
![ITU-T Y - IETF · [ITU-T H.248.1] Recommendation ITU-T H.248.1, Gateway control protocol: Version 3. [ITU-T H.460.4] Recommendation ITU-T H.460.4, Call priority designation and country/international](https://static.fdocuments.in/doc/165x107/5f1ddf16a7faaa7d93495e0f/itu-t-y-ietf-itu-t-h2481-recommendation-itu-t-h2481-gateway-control-protocol.jpg)


Languages
Pages
Legal


Report ITU-R M.2415-0 (11/2017)
Spectrum needs for Public Protection and Disaster Relief (PPDR)
M Series
Mobile, radiodetermination, amateur
and related satellite services

ii Rep. ITU-R M.2415-0
Foreword
The role of the Radiocommunication Sector is to ensure the rational, equitable, efficient and economical use of the radio-
frequency spectrum by all radiocommunication services, including satellite services, and carry out studies without limit
of frequency range on the basis of which Recommendations are adopted.
The regulatory and policy functions of the Radiocommunication Sector are performed by World and Regional
Radiocommunication Conferences and Radiocommunication Assemblies supported by Study Groups.
Policy on Intellectual Property Right (IPR)
ITU-R policy on IPR is described in the Common Patent Policy for ITU-T/ITU-R/ISO/IEC referenced in Annex 1 of
Resolution ITU-R 1. Forms to be used for the submission of patent statements and licensing declarations by patent holders
are available from http://www.itu.int/ITU-R/go/patents/en where the Guidelines for Implementation of the Common
Patent Policy for ITU-T/ITU-R/ISO/IEC and the ITU-R patent information database can also be found.
Series of ITU-R Reports
(Also available online at http://www.itu.int/publ/R-REP/en)
Series Title
BO Satellite delivery
BR Recording for production, archival and play-out; film for television
BS Broadcasting service (sound)
BT Broadcasting service (television)
F Fixed service
M Mobile, radiodetermination, amateur and related satellite services
P Radiowave propagation
RA Radio astronomy
RS Remote sensing systems
S Fixed-satellite service
SA Space applications and meteorology
SF Frequency sharing and coordination between fixed-satellite and fixed service systems
SM Spectrum management
Note: This ITU-R Report was approved in English by the Study Group under the procedure detailed in
Resolution ITU-R 1.
Electronic Publication
Geneva, 2018
ITU 2018
All rights reserved. No part of this publication may be reproduced, by any means whatsoever, without written permission of ITU.

Rep. ITU-R M.2415-0 1
REPORT ITU-R M.2415-0
Spectrum needs for Public Protection and Disaster Relief (PPDR)
(2017)
TABLE OF CONTENTS
Page
1 Introduction .................................................................................................................... 5
2 Scope .............................................................................................................................. 5
3 Spectrum considerations for PPDR ................................................................................ 5
4 Estimation of spectrum needs for PPDR ........................................................................ 6
5 Harmonization of spectrum ............................................................................................ 7
Annex 1 Spectrum needs for narrow-band and wide-band PPDR .......................................... 8
1 Methods of projecting spectrum needs ........................................................................... 9
2 Validity of the methodology ........................................................................................... 9
3 Critical parameters .......................................................................................................... 10
4 Extrapolated upper limit ................................................................................................. 11
5 Results ............................................................................................................................ 11
6 Discussion of results ....................................................................................................... 11
Attachment 1 to Annex 1 Methodology for the estimation of public protection and disaster
relief terrestrial spectrum needs ...................................................................................... 12
1 Introduction .................................................................................................................... 12
2 Advanced services .......................................................................................................... 12
3 A - Spectrum prediction model ...................................................................................... 12
4 B - Geographical area ..................................................................................................... 13
5 C - Operational environments versus service environments .......................................... 13
6 D - PPDR user population .............................................................................................. 14
7 E - Penetration rates ........................................................................................................ 15
8 F - Traffic parameters ..................................................................................................... 15

2 Rep. ITU-R M.2415-0
Page
9 G - PPDR quality of service functions ........................................................................... 16
10 H - Calculate total traffic ................................................................................................ 17
11 I - Net system capacity ................................................................................................... 18
12 J - Spectrum need estimation .......................................................................................... 18
Attachment 1.1 to Annex 1 Comparison of proposed methodology for the estimation of
PPDR spectrum needs to IMT-2000 methodology ........................................................ 20
Attachment 1.2 to Annex 1 PPDR Spectrum Needs Flowchart ............................................. 27
Attachment 1.3 to Annex 1 System capacity calculation examples ...................................... 31
Attachment 1.4 to Annex 1 Example: Public safety and disaster relief population density
data.................................................................................................................................. 35
Attachment 1.5 to Annex 1 Example spectrum needs estimation .......................................... 37
Attachment 1.6 to Annex 1 Example narrowband and wideband spectrum needs estimation
summaries ....................................................................................................................... 44
Attachment 2 to Annex 1 PPDR spectrum need estimation based on generic city analysis
(demographic population) ............................................................................................... 45
1 Generic City Approach ................................................................................................... 45
2 PPDR categories ............................................................................................................. 46
3 Spectrum needs ............................................................................................................... 48
Annex 2 Annexes on Broadband PPDR Spectrum Needs and Scenarios ............................... 64
2A.1 Methodology for PP1...................................................................................................... 65
2A.2 Methodology for PP2...................................................................................................... 65
Annex 2B Spectrum needs for BB PPDR Based on LTE in the United Arab Emirates ........ 66
2B.1 Background ..................................................................................................................... 66
2B.2 Methodology ................................................................................................................... 66
2B.3 Summary of the spectrum need estimation – Results ..................................................... 70
Annex 2C Throughput needs of broadband PPDR scenarios ................................................. 70
Attachment 1 to Annex 2C...................................................................................................... 72
Annex 2D Representative scenario- deploying LTE for PPDR .............................................. 74
2D.1 Background ..................................................................................................................... 74
Rep. ITU-R M.2415-0 3
Page
2D.2 Incident scenario ............................................................................................................. 74
2D.3 Event description ............................................................................................................ 74
2D.4 Analysis .......................................................................................................................... 77
2D.5 Results ............................................................................................................................ 78
2D.6 Conclusions of the representative scenario .................................................................... 79
Attachment 1 to Annex 2D Example for wireless applications needed for broadband PPDR
system ............................................................................................................................. 80
Annex 2E Spectrum need estimations and scenario of LTE based technology for broadband
PPDR in China................................................................................................................ 81
2E.1 Introduction .................................................................................................................... 81
2E.2 Methodology to estimate broadband spectrum needs ..................................................... 81
2E.3 Estimation of spectrum needs for Wuhan city in China ................................................. 84
2E.4 Scenario of LTE based technology for PPDR broadband .................................. 97
2E.5 Conclusion .......................................................................................................... 98
Annex 2F Broadband PPDR spectrum needs in Korea ........................................................... 99
2F.1 Introduction ......................................................................................................... 99
2F.2 Spectrum Need Estimation Methodology ........................................................... 99
2F.3 Traffic parameters ............................................................................................... 101
2F.3.2 Multiple PPDR Agencies Operation ................................................................... 105
2F.3.3 PPDR operation with other public broadband services ...................................... 106
2F.4 Spectrum Needs .............................................................................................................. 106
2F.5 Conclusion .......................................................................................................... 108
Annex 2G Estimation of spectrum needs for wireless PPDR systems using Monte Carlo
simulation ....................................................................................................................... 108
2G.1 Overview of approach and method used ............................................................ 108
2G.2 Background to the study ..................................................................................... 109
2G.3 Initial PPDR Spectrum Estimates ....................................................................... 109
2G.4 Wireless Broadband network simulation ............................................................ 111
2G.5 Resulting Effective Throughput-per-User .......................................................... 112
2G.6 Conclusions ......................................................................................................... 113
4 Rep. ITU-R M.2415-0
Page
Attachment 2 to Annex 2G Example results .......................................................................... 117
Annex 2H Spectrum needs for BB PPDR in Tunisia.............................................................. 119
2H.1 Summary of the spectrum need estimation – Results ......................................... 119

Rep. ITU-R M.2415-0 5
1 Introduction
Public Protection and Disaster Relief (PPDR) radiocommunication systems are vital to the
achievement of the maintenance of law and order, response to emergency situations, protection of life
and property and response to disaster relief events.
This Report discusses the estimations of spectrum needs for PPDR. Report ITU-R M.2377 presents
broad objectives and requirements of PPDR applications, including the increasing use of broadband
technologies to meet those objectives and requirements. The expanding scope of PPDR capabilities,
ranging from narrowband through wideband and broadband1, offers greater utility for emergency
response operations around the world, including in developing countries.
The advances in broadband technologies offer the potential of enhanced capability and capacity to
facilitate the achievements of both public protection operations and responding to major emergencies
and catastrophic disasters. Whilst noting that narrowband and wideband technologies for PPDR
services and applications are still widely used in all three ITU Regions.
2 Scope
This Report addresses the estimation of the spectrum needs for public protection and disaster relief
(PPDR) by providing:
– a method of estimating the amounts of spectrum;
– system scenarios and assumptions;
– validation of the method with respect to existing applications; and
– examples of different national and/or regional spectrum needs for narrowband, wideband and
broadband PPDR systems.
References, terminology, abbreviations and descriptions of PPDR operations can be found
in Annexes 1, 2 and 3 of Report ITU-R M.2377. PPDR applications and related examples, and PPDR
requirements can be found in Annexes 4 and 5 of Report ITU-R M.2377.
Examples of different national and/or regional spectrum needs for narrowband and wideband PPDR
systems are addressed in Annex 1 of this Report. Further examples of broadband spectrum needs
estimations and scenarios are addressed in Annex 2 (2A to 2F).
3 Spectrum considerations for PPDR
Resolution 646 (Rev.WRC-15) encourages administrations to use the harmonized frequency ranges
included in that resolution or parts thereof when undertaking their national planning for PPDR
solutions. To further assist administrations, Recommendation ITU-R M.2015 contains the frequency
arrangements for PPDR systems in these ranges.
It should be noted that the frequency ranges included in Resolution 646 (Rev.WRC-15) are allocated
to a variety of services in accordance with the relevant provisions of the Radio Regulations and that
flexibility must be afforded to administrations to determine, at national level, what portions of the
spectrum within the ranges in the Resolution can be used by PPDR agencies and organizations in
order to meet their particular national requirements.
1 Recommendation ITU-R F.1399 defines narrowband wireless access as “Wireless access in which the
maximum usable end-user bit rate is up to and including 64 kbit/s.”; wideband wireless access as “Wireless
access in which the maximum usable end-user bit rate is greater than 64 kbit/s and up to, and including, the
primary rate.”; and, broadband wireless access as “Wireless access in which the connection(s) capabilities
are higher than the primary rate”.

6 Rep. ITU-R M.2415-0
When considering appropriate frequencies for PPDR systems it should be recognized that the
propagation characteristics of lower frequencies allow signals to propagate further than higher
frequencies, making lower frequency systems potentially less costly to deploy, e.g. in rural areas.
Lower frequencies are also sometimes preferred in urban settings due to their superior building
penetration. However, these lower frequencies and the related bands have become saturated over time
and to prevent further congestion, some administrations are using more than one frequency band in
different parts of the radio spectrum.
4 Estimation of spectrum needs for PPDR
In regard to PPDR bandwidth needs, various estimates of PPDR traffic levels have been presented to
ITU-R.
Wireless PPDR traffic levels are known to vary significantly, depending on localised or broader
operational situations – ranging from routine daily activities, local emergency events (e.g. local crime
scenes, building fires, industrial incidents, and traffic accidents), wide-area operational events,
through to the less frequent major area disasters (e.g. rural forest fires, volcanic eruptions, typhoons,
and tsunami). Moreover, PPDR wireless traffic is comprised of a mix of simple narrowband voice
communications, messaging and data, through a variety of wideband applications – and will
increasingly include broadband applications. As such, PPDR traffic intensity will vary widely on a
daily, hourly or minute-by-minute basis, in response to particular operational needs and
circumstances.
In ITU-R and regional discussions, many countries have expressed the view that determining
minimum PPDR bandwidth remains a national matter – and should take account of differing national
policies and priorities, demographics, network investment preferences, PPDR agencies size and
structure, operational and procedural differences, and other factors.
In order to evaluate the amount of spectrum needed and to plan efficient use of spectrum assessments
are usually made by PPDR agencies and organizations on the operational and tactical requirements
of PPDR operations in the different scenarios. For this purpose, different methodologies exist.
Annex 1 (Narrow/Wideband technologies) and Annex 2 (Broadband technologies) provide examples
of estimations of the spectrum needs for PPDR. It should be noted that the examples in Annex 1 were
developed during ITU-R study period 2000 to 2003.
The ITU-R has developed several generic methodologies that may assist administrations in this
regard, including:
– Recommendation ITU-R M.1390 is a methodology developed for the calculation of
terrestrial spectrum requirement estimates for IMT-2000. This methodology is suitable for
evaluating spectrum requirement of systems using single radio access technology and it could
also be used for other public land mobile radio systems.
– Recommendation ITU-R M.1768 describes a methodology for the calculation of terrestrial
spectrum requirement estimation for International Mobile Telecommunications (IMT). This
methodology considers the application of multiple mobile and fixed communication systems
and complex cases of multi-network environments.
– Recommendation ITU-R M.1651 ‒ A method for assessing the required spectrum for
broadband nomadic wireless access systems including radio local area networks using the 5
GHz band, which provides the methodology for assessing spectrum requirements for RLANs.
Recommendation ITU-R M.1651 was developed and utilized in the WRC-03 study cycle,
then again as part of RLAN spectrum requirements under WRC-15 agenda item 1.1.
– Report ITU-R M.2290 ‒ Future spectrum requirements estimate for terrestrial IMT, which
utilized user demand forecasts to predict future usage of IMT.
Rep. ITU-R M.2415-0 7
– Recommendation ITU-R SM.1271 ‒ Efficient spectrum utilization using probabilistic
methods.
The spectrum estimation methodology employed in some of the estimations shown in Annexes 1
and 2 follows the format of the generic methodology that was used in Recommendation ITU R
M.1390, with the values selected for the PPDR applications taking into account the fact that PPDR
utilizes different technologies and applications (including dispatch and direct mode).
Recommendation ITU-R M.1390 was the only tool available for calculating IMT spectrum needs
when spectrum needs for PPDR were assessed under WRC-03 agenda item 1.3. The Recommendation
was published in 1999. It, therefore, reflects the technologies available at that time, e.g. IMT-2000,
and other public land mobile systems, which may continue to be deployed. Advances in broadband
PPDR technologies since publication are not reflected in the Recommendation. When applying
Recommendation ITU-R M.1390 to reflect broadband PPDR technologies, careful consideration
should be given to the appropriate values for the parameters, e.g. activity factor, group size, and net
system capability. An example of how these parameters can be adapted is provided in Annex 1.
Several other factors should also be considered when addressing the spectrum needs for broadband
wireless PPDR systems, such as the sectorization of base stations, traffic prioritization, and the
possibility of using any surrounding base stations and/or multiple frequency bands.
5 Harmonization of spectrum
Significant amounts of spectrum are already in use in various bands in various countries for
narrowband PPDR applications. It should be noted, however, that sufficient spectrum capacity will
be needed to accommodate future operational needs including narrowband, wideband and broadband
applications. Since the first adoption of Resolution 646 in 2003, experience has shown that the
advantages of harmonized spectrum include economic benefits, the development of compatible
networks and effective services and the promotion of interoperability of equipment internationally
and nationally for those agencies that require national and cross-border cooperation with other PPDR
agencies and organizations. Some of the benefits are:
– economies of scale in the manufacturing of equipment;
– readily available off-the-shelf equipment;
– competitive markets for equipment procurement;
– increased spectrum efficiency;
– efficient planning and border coordination of land mobile spectrum due to globally/regionally
harmonized frequency arrangements; and
– stability in band planning; that is, evolving to globally/regionally harmonized spectrum
arrangements may assist in more efficient planning of land mobile spectrum; and
– increased effective response to disaster relief.

8 Rep. ITU-R M.2415-0
Annex 1
Spectrum needs for narrow-band and wide-band PPDR
This Annex addresses the estimation of the spectrum needs for public protection and disaster relief
(PPDR), particularly within the context of WRC-03 agenda item 1.3. The Annex provides:
– a method of estimating the amounts of spectrum;
– system scenarios and assumptions;
– validation of the method with respect to existing applications;
– examples of several administrations projections of their spectrum needs by 20102;
– determining the amount of spectrum which should be harmonized in the context of future
applications, and
– conclusions.
The estimation method given in this Annex is provided for assisting in consolidating spectrum needs.
A number of administrations have used the modified methodology in Attachment 1 to this Annex to
estimate their national spectrum needs for PPDR. That methodology, however, is not the only means
by which administrations may estimate their national PPDR spectrum needs. Administrations have
the discretion to use whatever method, including the modified methodology; they choose to determine
their own spectrum needs for PPDR.
Many PPDR entities around the world are currently evaluating the migration from analogue wireless
systems to digital for current telecommunication services. The migration to digital will also allow
these entities to add some advanced services to these first generation PPDR digital systems. However,
there are many more advanced services that PPDR users are likely to demand as they become
available to commercial users. While spectrum demand has been estimated and allotted for 2nd and
3rd generation commercial wireless services, similar analysis has not been done for PPDR users.
The greatest demand for public protection and disaster relief telecommunication services is in large
cities where different categories of traffic can be found, i.e. that generated by mobile stations (MS),
vehicle mounted or portable stations, and personal stations (PS) (hand-held portable radios). The trend
is toward designing the PPDR telecommunication network to provide services to personal stations
both outdoor and indoor (building penetration).
Maximum demand will be created after a disaster, when many PPDR users converge on the
emergency scene utilizing existing telecommunication networks, installing temporary networks, or
utilizing vehicle mounted or portable stations. Additional spectrum may be needed for interoperability
between various PPDR users and/or additional spectrum may be needed for installation of temporary
disaster relief systems.
Considerations on spectrum demand should take into account the estimated traffic, the available and
foreseeable techniques, the propagation characteristics and the time-scale to meet the users' needs to
the greatest possible extent. Consideration on frequency matters should take into account that the
traffic generated by mobile systems, as well as the number and diversity of services, will continue to
grow. Any estimation of the traffic should take into consideration that non-voice traffic will constitute
an increasing portion of the total traffic and that traffic will be generated indoors as well as outdoors
by personal and mobile stations.
2 These spectrum estimations, done during the study cycle 2000-2003, estimated spectrum needs by 2010.
Rep. ITU-R M.2415-0 9
1 Methods of projecting spectrum needs
Description of the methodology
This public protection and disaster relief spectrum need estimation methodology (Attachment 1 to
this Annex) follows the format of the generic methodology that was used for the calculation of
IMT-2000 terrestrial spectrum requirements (Recommendation ITU-R M.1390). The use of the
methodology can be customized to specific applications by selecting values appropriate to the
particular terrestrial mobile application. Another model based on a generic city approach was also
used (see Attachment 2 to this Annex).
The values selected for the PPDR applications must take into account the fact that PPDR utilizes
different technologies and applications (including dispatch and direct mode).
Required input data $
– the identification of PPDR user categories, e.g. police, fire, ambulance;
– the number of users in each category;
– the estimated number of each user category in use in the busy hour;
– the type of information transmitted, e.g. voice, status message and telemetry;
– the typical area to be covered by the system under study;
– the average cell size of base stations in the area;
– the frequency reuse pattern;
– the grade of service;
– the technology used including RF channel bandwidth;
– the demographic population of the city.
2 Validity of the methodology
Discussion
Several aspects of the methodology, the assumptions inherent in the model as presented, timing,
method of estimation, frequency reuse, possibility of separating the estimation for PPDR, urban as
opposed to rural situations, and the nature of the operating environments were clarified in the ITU-R
study period 2000-2003.
Specifically, the following issues were raised in connection with the methodology:
a) Applicability of IMT-2000 methodology to PPDR?
b) Substituting the geographic areas (e.g. urban, in-building, etc.) in the IMT-2000 methodology
by service categories (narrowband (NB), wideband (WB), broadband (BB))?
c) Use of assumptions of PSWAC Report3 with regard to assessment of traffic for PPDR?
d) Treatment of traffic for PP and DR together?
e) Use of cellular configurations/hotspots in estimating spectrum needs for PPDR?
f) Applicability of the methodologies for the simplex/direct mode operations?
3 United States Public Safety Wireless Advisory Committee, Appendix D, Spectrum Requirements
Subcommittee Report, September 1996. In considering this Annex during the development of this Report
it was noted that the PSWAC was chartered to consider total spectrum requirements for the operational
needs of public safety entities in the United States through the year 2010; so this Report may not be relevant
to requirements in 2015.

10 Rep. ITU-R M.2415-0
In response, the following points should be noted:
1 While the document is based on the methodology used for IMT-2000, the method is capable
of including all technologies from simplex to cellular and beyond. Further work will be
required to establish appropriate classifications of service environment categories (e.g. for
fire, police, emergency medical services) and model systems for those environments, in order
to make the estimations needed for each type of use and technology.
2 Terms of the estimations of spectrum needs public protection activities could be separated
from disaster relief activities, with separate and appropriate parameter values and
assumptions being applied for each case. However, it was noted that there are instances where
public protection equipment, which is used for routine operations on a day-by-day basis, may
also be employed in times of disaster. In these cases, there would need to be some means
established to avoid double counting when undertaking estimations of spectrum needs.
3 In considering the service environments (i.e. narrowband, wideband and broadband), it was
noted that those used for IMT-2000 may also have some applicability to PPDR
communications.
Validity study
One administration undertook the performance of a study of the validity of the results predicted by
this methodology. This was done by inputting the parameters of a working narrowband PPDR system
into an estimation spreadsheet and checking that the amount of spectrum it predicted was the same
as that actually used by the system. It was concluded that this methodology is valid, provided it is
used carefully and correctly. It was also concluded that although not validated by actual measurement,
one might extrapolate that model works as well for wideband and broadband as long as the input
parameters are carefully considered and applied. Another administration reported on a similar study
undertaken in which examples were developed for typical cities, obtaining spectrum estimates that
are consistent with other examples previously reported. Using two examples of the application of the
methodology –one referred to a middle-sized city and the other to an industrial district– it was
concluded that the methodology is appropriate for the evaluation of spectrum needed for PPDR
radiocommunications.
3 Critical parameters
In assessing the validity of the methodology several critical parameters were identified which must
be selected with care. Studies in estimating spectrum needs for terrestrial land mobile systems were
conducted by some administrations showed that the most influential input parameters are:
cell radius/frequency reuse;
number of users.
The results of the studies were shown to be heavily dependent upon cellular architecture parameters.
The studies show that changes in cell radius will change the spectrum estimate significantly. While it
is true that reducing the size of the cell radius will increase the reuse of the spectrum and thereby
reduce the spectrum need, the cost of the infrastructure will also significantly increase. Similar
considerations apply to other parameters, e.g. using sectored cells decreases the necessary spectrum
by a factor of three. For these reasons it is advisable that careful studies of cellular structures are
undertaken prior to the final specification of the spectrum to be reserved to PPDR.
In preparing the estimate of spectrum amounts, it will be necessary to get consensus on the input data
to put into the generic methodology. Noting the sensitivity of the results to such critical parameters,
the input data will need to be selected carefully and will need to reflect a balance between the amount
of spectrum sought and the infrastructure cost. Countries that need less spectrum than the full amount

Rep. ITU-R M.2415-0 11
identified will have greater freedom in network design, the degree of frequency reuse and
infrastructure cost.
4 Extrapolated upper limit
During the ITU-R study period 2000-2003, Korea undertook a parametric analysis of the result of
spectrum need estimations made for Bhopal, Mexico City, and Seoul. The analysis also used data for
other cites taken from other contributions to the work of the ITU-R. The parametric analysis provided
insight into PPDR spectrum needs and it showed that considering the worst case/dense user situation
a maximum of 200 MHz (Narrowband: 40 MHz, Wideband: 90 MHz, Broadband:
70 MHz) is required to meet the estimated PPDR spectrum needs for WRC-03 agenda item 1.3.
5 Results
Results of estimates of amount of spectrum needed by the year 2010 for PPDR
A summary of results of spectrum estimates for PPDR scenarios presented by some administrations
using the proposed methodology is given below. However the data in the last row was made using
various other methods.
Location Narrowband
(MHz)
Wideband
(MHz)
Broadband
(MHz)
Total
(MHz)
Delhi 51.8 3.4 47.6 102.8
Bhopal 24 5.2 32.2 61.4
Seoul 15.1 90.5 69.2 174.8
Mexico City 46.2 39.2 50.2 135.6
Paris 16.6 32.6 – –
Medium city (Italy high penetration) 21.1 21.6 39.2 81.9
Medium city (Italy medium
penetration)
11.6 11.4 39.2 62.2
Industrial district (Italy) 3.0 3.0 39.2 45.2
6 Discussion of results
The totals listed in the above chart cover all the PPDR applications and both uplink and downlink
needs. The results range between 45 MHz and 175 MHz. Such results have to be compared with the
national current and forecasted situations taking into account the whole spectrum needed by PPDR
users.
There are several reasons for the wide range of spectrum estimates. First, the studies done in obtaining
these results showed that the spectrum estimates are very dependent on density and the penetration
rate. Second, administrations based their spectrum estimations on whatever scenarios they deemed
most appropriate. For example, Korea based its spectrum estimations on the worst case/most dense
user requirement. Italy chose to examine the PPDR spectrum needs of a typical medium-size city in
Italy. Other administrations used other scenarios.
Many countries do not envisage having physically separate PP and DR networks in their countries
and therefore see global/regional harmonization as applying to both PP and DR needs. Other countries
may decide to estimate separate PP and DR spectrum needs.
12 Rep. ITU-R M.2415-0
Attachment 1
to Annex 1
Methodology for the estimation of public protection and disaster
relief terrestrial spectrum needs
1 Introduction
The function of this Attachment is to present an initial forecast for spectrum needed by public
protection and disaster relief (PPDR) by the year 2010. A spectrum estimation methodology,
following the format of ITU methodology for the calculation of IMT-2000 spectrum needs, is
developed. Because of the differences between commercial wireless users and PPDR wireless users,
alternate methodologies are proposed to determine PPDR user penetration rates and define the PPDR
operational environments. Methodologies are also proposed to define PPDR net system capacity and
PPDR quality of service.
The analysis is based upon current PPDR wireless technologies and expected trends in demand for
advanced applications. From that, an initial forecast can be made for the amount of spectrum needed
for specific advanced telecommunication services through the year 2010.
2 Advanced services
The advanced services likely to be available to PPDR community by year 2010 are:
voice dispatch;
telephone interconnect;
simple messages;
transaction processing;
simple images (facsimile, snapshot);
remote file access for decision processing;
Internet/intranet access;
slow video;
full motion video;
multimedia services, like videoconference.
3 A - Spectrum prediction model
This spectrum prediction model follows the methodology for the prediction of IMT-2000 Spectrum
Requirements (Recommendation ITU-R M.1390).
The steps to be used are:
Step 1: Identify the geographical area over which the model will be applied.
Step 2: Identify the population of PPDR personnel.
Step 3: Identify the advanced services used by the PPDR community through year 2010.
Step 4: Quantify technical parameters that apply to each of the advanced services.
Step 5: Forecast the spectral need for each advanced service.
Step 6: Forecast total spectral need for PPDR through year 2010.

Rep. ITU-R M.2415-0 13
See Attachment 1.1 for a comparison of the proposed PPDR methodology versus the
Recommendation ITU-R M.1390 methodology. See Attachment 1.2 for a flowchart of the proposed
PPDR methodology.
4 B - Geographical area
Determine the PPDR user populations within the area of the study.
For this model, we do not need to investigate spectrum demand over an entire country. The area(s) of
interest will be one or more of the major metropolitan regions within each country. The population
density is highest in these areas. The proportion of PPDR personnel relative to the general population
is expected to be highest here, also. Therefore, the demand for spectrum resources should also be
highest in the major metropolitan area(s). This is similar to the IMT-2000 methodology where the
geography and environments of only the most significant contributors to spectrum needs are
considered.
We need to clearly define the geographic and/or political boundaries of the metropolitan area of study.
This may be the political boundary of the city or of the city and surrounding suburban cities and/or
counties in the metropolitan area. We need general population data for the metropolitan area. This
should be readily available from census data.
Instead of using general population density (population/km2), the PPDR user population and
penetration rates must be determined. Within the geopolitical boundaries of the study area, PPDR
user population must be defined and divided by the area to determine the PPDR user density
(PPDR/km2).
Representative cell area (radius, geometry) needs to be determined for each operational environment
within the geographic study area. This is dependent upon the population density, network design, and
network technology. PPDR networks tend to utilize higher power devices and larger radius cells than
commercial systems.
Follow IMT-2000 methodology A:
Define geographic boundaries and area (km2) of each environment.
5 C - Operational environments versus service environments
In the methodology for the calculation of IMT-2000 spectrum requirements, the analysis is conducted
on physical operational environments. These environments vary significantly in cell geometry and/or
population density. PPDR user population density is much lower than the general population density.
PPDR networks generally provide wireless services into all physical environments from one, or more,
wide-area network(s). This model defines “service environments” which group services by the type
of PPDR wireless telecommunication network: narrowband, wideband and broadband. Many services
are currently, and will continue to be, delivered by networks using narrowband channels (25 kHz or
less). These include dispatch voice, transaction processing, and simple images. More advanced
services like internet/intranet access and slow video will require a wideband channel (50 to 250 kHz)
to deliver these higher content services. Full motion video and multi-media services will require very
wide channels (1 to 10 MHz) to deliver real-time images. These three “service environments” are
likely to be deployed as separate overlapping networks utilizing different cell geometries and different
network and subscriber technologies.
Also, the services offered within each “service environment” will need to be defined.
Modified version of IMT-2000 methodology A1, A2, A3, A4, B1:
Define “service environment”, i.e. narrowband, wideband, broadband.
14 Rep. ITU-R M.2415-0
Determine direction of calculations for each environment: uplink, downlink, combined.
Determine average/typical cell geometry within each “service” environment.
Calculate representative cell area within each “service” environment.
Define services offered in each “service environment” and net user bit rate for each.
6 D - PPDR user population
Who are PPDR users? These are personnel who respond to day-to-day emergencies and to disasters.
They would typically be public protection personnel grouped into mission oriented categories, such
as police, fire brigades, emergency medical response. For disasters the scope of responders may
increase to include other government personnel or civilians. All these PPDR personnel would be
using PPDR telecommunication services during an emergency or disaster. PPDR users may be
combined together into categories that have similar wireless communication usage patterns, i.e. the
assumption is that all users grouped into “police” category personnel would have similar demands for
telecommunication services.
For this model, the categories will only be used to group PPDR users with similar wireless service
usage rates. That is, for police, each officer may have a radio, so the wireless penetration rate is 100%
for police. For ambulance crews, there may be two people assigned to an ambulance, but only one
radio, so the penetration rate is only 50% for ambulance crews. The current penetration rate can easily
be determined if the number of mobile and portable stations deployed is known. It is simply the ratio
of the number of radios deployed to the number of PPDR users in that category.
We need to determine the PPDR user populations. This can be collected for each PPDR user category;
police, law enforcement, fire brigade, emergency medical response, etc. This data may be collected
from the specific metropolitan governments or PPDR agencies. This data may be available from
several public sources, including annual budgets, census data, and reports published by national or
local law enforcements agencies.
The data may be presented in several formats, which must be converted into the total counts from
each source for each PPDR category within the area of study.
Some data may be presented as specific PPDR user counts within a political sub-division;
e.g. city A with a population of NN has AA police officers, BB fire fighters, CC ambulance
drivers, DD transit police, EE traffic wardens, and FF civilian support personnel.
Some data may be presented as a percentage relative to the total population; e.g. there are
XX police officers per 100 000 population. This needs to be multiplied by the population
within the area of study to calculate the total count for each PPDR category.
There may be multiple levels of government within the area of study. The PPDR totals for
each category need to be combined. Local police, county police, state police, and federal
police could be combined into a single “police” category. The assumption is that all these
“police” category personnel would have similar demands for telecommunication services.
Example of PPDR categories:
Regular Police Fire Brigades Emergency Medical Services
Special Police Functions Part-time Fire EMS Civilian Support
Police Civilian Support Fire Civilian Support
General Government Personnel Other PPDR Users
Growth projections for population and planned increases in PPDR personnel may be used to estimate
the future number of PPDR personnel within the area of study. Analysis over the study area may
show that some towns/cities within the area of study do not provide advanced PPDR services today,

Rep. ITU-R M.2415-0 15
but plan to deliver those services within the next ten years. Growth projection may simply be the
application of the higher PPDR user population density figures from cities/towns using advanced
wireless services today within the area of study to all parts of the study area.
Modified version of IMT-2000 methodology B2:
Determine PPDR user population density within study area.
Calculate for each mission-oriented category of PPDR user or for groups of PPDR users with
similar service usage patterns.
7 E - Penetration rates
Instead of using penetration rates from commercial wireless market analyses, the PPDR penetration
rates for current and future wireless telecommunication services must be determined. It is expected
that the ITU-R survey on PPDR communications will supply some of this data. One method would
be to determine the penetration rate of each telecommunication service within each of the PPDR
categories defined above, then convert this to the composite PPDR penetration rate for each
telecommunication service within each environment.
Modified version of IMT-2000 methodology B3, B4:
Calculate PPDR user population density.
Calculate for each category of PPDR user.
Determine penetration rate for each service within each environment.
Determine users/cell for each service within each environment.
8 F - Traffic parameters
The proposed model follows the IMT-2000 methodology. Traffic parameters used in examples below
represent average for all PPDR users. However, these traffic parameters could also be calculated for
individual PPDR categories and combined to calculate composite traffic/user. Much of this data was
determined by PSWAC4 and that busy hour traffic data will be used in the examples presented below.
The “busy hour call attempts” are defined as the ratio between the total number of connected
calls/sessions during the busy hour and the total number of PPDR users in the study area during the
busy hour. The activity factor is assumed to be 1 for all services, including PPDR speech. For PPDR
systems that do not use vocoders with discontinuous voice transmission, PPDR speech continuously
occupies the channel and the PPDR speech activity factor is 1.
Follow IMT-2000 methodology B5, B6, B7:
Determine busy hour call attempts per PPDR user for each service in each environment.
Determine effective call/session duration.
Determine activity factor.
Calculate busy hour traffic per PPDR user.
Calculate offered traffic/cell (E) for each service in each environment.
4 Public Safety Wireless Communications User Traffic Profiles and Grade-Of-Service Recommendations
(13 March 1996) in Appendix D of the Final Report of Spectrum Requirements Subcommittee (SRSC), in
Appendix D of the Final Report of the Public Safety Wireless Advisory Committee (11 September 1996).
16 Rep. ITU-R M.2415-0
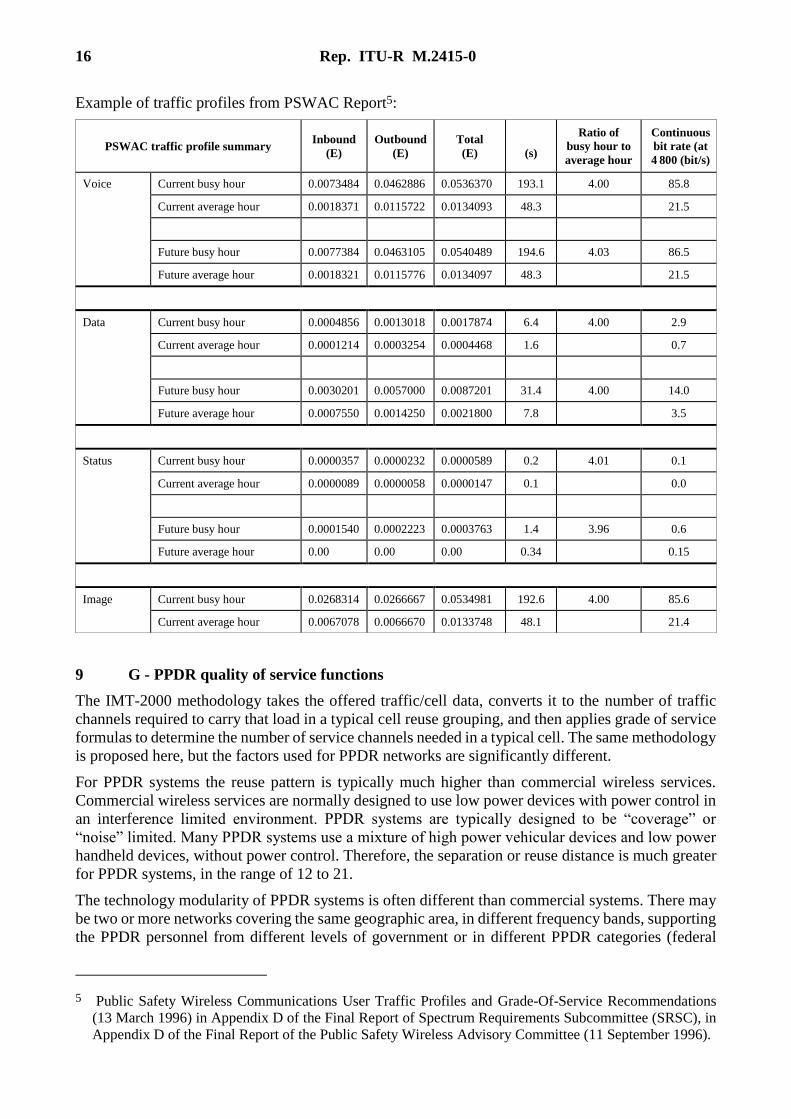
Example of traffic profiles from PSWAC Report5:
PSWAC traffic profile summary Inbound
(E)
Outbound
(E)
Total
(E)
(s)
Ratio of
busy hour to
average hour
Continuous
bit rate (at
4 800 (bit/s)
Voice Current busy hour 0.0073484 0.0462886 0.0536370 193.1 4.00 85.8
Current average hour 0.0018371 0.0115722 0.0134093 48.3 21.5
Future busy hour 0.0077384 0.0463105 0.0540489 194.6 4.03 86.5
Future average hour 0.0018321 0.0115776 0.0134097 48.3 21.5
Data Current busy hour 0.0004856 0.0013018 0.0017874 6.4 4.00 2.9
Current average hour 0.0001214 0.0003254 0.0004468 1.6 0.7
Future busy hour 0.0030201 0.0057000 0.0087201 31.4 4.00 14.0
Future average hour 0.0007550 0.0014250 0.0021800 7.8 3.5
Status Current busy hour 0.0000357 0.0000232 0.0000589 0.2 4.01 0.1
Current average hour 0.0000089 0.0000058 0.0000147 0.1 0.0
Future busy hour 0.0001540 0.0002223 0.0003763 1.4 3.96 0.6
Future average hour 0.00 0.00 0.00 0.34 0.15
Image Current busy hour 0.0268314 0.0266667 0.0534981 192.6 4.00 85.6
Current average hour 0.0067078 0.0066670 0.0133748 48.1 21.4
9 G - PPDR quality of service functions
The IMT-2000 methodology takes the offered traffic/cell data, converts it to the number of traffic
channels required to carry that load in a typical cell reuse grouping, and then applies grade of service
formulas to determine the number of service channels needed in a typical cell. The same methodology
is proposed here, but the factors used for PPDR networks are significantly different.
For PPDR systems the reuse pattern is typically much higher than commercial wireless services.
Commercial wireless services are normally designed to use low power devices with power control in
an interference limited environment. PPDR systems are typically designed to be “coverage” or
“noise” limited. Many PPDR systems use a mixture of high power vehicular devices and low power
handheld devices, without power control. Therefore, the separation or reuse distance is much greater
for PPDR systems, in the range of 12 to 21.
The technology modularity of PPDR systems is often different than commercial systems. There may
be two or more networks covering the same geographic area, in different frequency bands, supporting
the PPDR personnel from different levels of government or in different PPDR categories (federal
5 Public Safety Wireless Communications User Traffic Profiles and Grade-Of-Service Recommendations
(13 March 1996) in Appendix D of the Final Report of Spectrum Requirements Subcommittee (SRSC), in
Appendix D of the Final Report of the Public Safety Wireless Advisory Committee (11 September 1996).
Rep. ITU-R M.2415-0 17
networks may be independent of local networks; police networks may be independent of fire
networks).
The result is networks with fewer channel resources per cell. PPDR networks are normally designed
for higher coverage reliabilities, 95% to 97%, because they are trying to cover all operational
environments from a fixed network. Commercial networks, with a revenue stream, can continuously
adapt their networks to changing user needs. PPDR networks, funded with public monies, normally
undergo minimal change in cell locations or service channels per cell over their lifetime of
10-20 years.
For PPDR services, availability of the channel must be very high, even during busy hours, because
of the immediate need to transmit critical, sometimes life-saving, information. PPDR networks are
designed for lower call blocking6 levels, less than 1%, as PPDR personnel need immediate access to
the network during emergency situations. While many routine conversations and data transactions
can wait several seconds for a response, many PPDR situations are highly tense and require immediate
channel availability and response.
Loading varies greatly for different PPDR network topologies and for different PPDR situations.
Many police or fire situations may require individual channels to be set aside for on-scene
interoperability with very low loading, less than 10%. Conventional, single channel, mobile relay
systems in use today typically operate at 20-25% loading, because unacceptable blockage occurs at
higher loading. Large 20 channel trunked systems, which spread the load across all available
channels, with a mix of critical and non-critical users, may be able to operate at acceptable levels for
critical PPDR operations with busy hour loading of 70-80%.
The net impact causes the Erlang B factor for the average PPDR network to be higher, about 1.5,
instead of the 1.1 to 1.2 factors seen with commercial services at 90% coverage and 1% blocking.
Follow IMT-2000 methodology B8:
Unique PPDR requirements:
Blocking less than 1%
Modularity ~ 20 channels per cell per network, results in a high Erlang B factor of about 1.5.
Frequency reuse cell format
12 for like power mobile or personal stations
21 for mixture of high/low power mobile and personal stations.
Determine number of service channels needed for each service in each “service” environment (NB,
WB, BB).
10 H - Calculate total traffic
The proposed model follows the IMT-2000 methodology. The PPDR net user bit rate should include
the raw data rate, the overhead factor and the coding factor. This is dependent upon the technology
chosen for each service.
Information is coded to reduce or compress the content which minimizes the amount of data to be
transmitted over an RF channel. Voice, which may be coded at a rate of 64 kbit/s or 32 kbit/s for
wireline applications, is coded at rates of less than 4 800 bit/s for PPDR dispatch speech applications.
6 Public Safety Wireless Communications User Traffic Profiles and Grade-Of-Service Recommendations
(13 March 1996) in Appendix D of the Final Report of Spectrum Requirements Subcommittee (SRSC), in
Appendix D of the Final Report of the Public Safety Wireless Advisory Committee (September 11, 1996).
18 Rep. ITU-R M.2415-0
The more the information is compressed, the more important each bit becomes, and the more
important the error correction function becomes. Error coding rates from 50% to 100% of information
content are typical. Higher transmission rates over the harsh multi-path propagation environment of
an RF channel require additional synchronization and equalization functions, which use additional
capacity. Also, other network access and control functions need to be carried along with the
information payload (unit identity, network access functions, encryption).
PPDR systems in operation today use 50-55% of the transmitted bit rate for error correction and
overhead.
For example: a technology for speech on narrowband channels may have a speech vocoder output
rate of 4.8 kbit/s with a forward error correction (FEC) rate of 2.4 kbit/s and the protocol may be
provisioned for another 2.4 kbit/s of overhead signalling and information bits, for a net user bit rate
of 9.6 kbit/s.
Follow IMT-2000 methodology C1, C2, C3:
Define net user bit rate, overhead factors, coding factors for each service in each “service”
environment.
Convert service channels from B8 back to per cell basis.
Calculate total traffic (Mbit/s) for each service in each “service” environment.
11 I - Net system capacity
The net system capacity is an important measure of the spectrum efficiency of a wireless
telecommunications system. The net system capacity calculation produces the maximum system
capacity possible within the spectrum band being studied.
The proposed model follows the IMT-2000 methodology. However, the calculation of PPDR net
system capacity should be based upon typical PPDR technologies, PPDR frequency bands, and PPDR
reuse patterns, rather than the GSM model used in the IMT-2000 methodology.
Methodology C provides an analysis for several PPDR technologies currently in use against some
existing PPDR spectrum allocations. These examples show maximum possible system capacity for
the purpose of estimating future spectrum needs. There are numerous other user requirements and
spectrum allocation factors, not included here, that affect the functional and operational deployment
of a network, the choice of technology, and the resulting network’s spectrum efficiency.
Follow IMT-2000 methodology C4, C5:
Pick several PPDR network technologies.
Pick several representative frequency bands.
Follow same calculations format as GSM model.
Calculate typical net system capacities for PPDR land mobile radio technology.
12 J - Spectrum need estimation
The proposed model follows the IMT-2000 methodology.
PPDR networks are very likely to have coincident busy hours. Therefore, the alpha factor will be 1.0.
The number of PPDR personnel is likely to grow with general population growth. The demand for
PPDR services is likely to increase following trends similar to the demand for commercial wireless
telecommunication services.
Rep. ITU-R M.2415-0 19
The beta factor can be set to a number greater than 1.0 here, or the growth factor can be included in
the net system capacity calculations.
Follow IMT-2000 methodology D1, D2, D3, D4, D5, D6:
Define alpha factor 1.
Define beta factor 1 (include growth under net system capacity, ignore other outside effects for
example calculations).
Estimate spectrum need for each service in each “service” environment.
Sum up spectrum needs for each “service” environment (NB, WB, BB).
Sum up total spectrum need.
Examples
See Attachment 1.5 to Annex 1 for a detailed narrowband voice example using London data from
Methodology D.
Conclusion
It has been demonstrated that the IMT-2000 methodology (Recommendation ITU-R M.1390) may be
adapted to calculate the system requirements for public protection and disaster relief communications
(or applications). Methods have been provided to determine the PPDR user population and service
penetration rates. “Service” environments have been defined over which PPDR spectrum needs can
be estimated. The factors necessary to adapt the IMT-2000 methodology to a PPDR methodology
have been identified, including the development of a methodology to define PPDR net system
capacity.
20 Rep. ITU-R M.2415-0
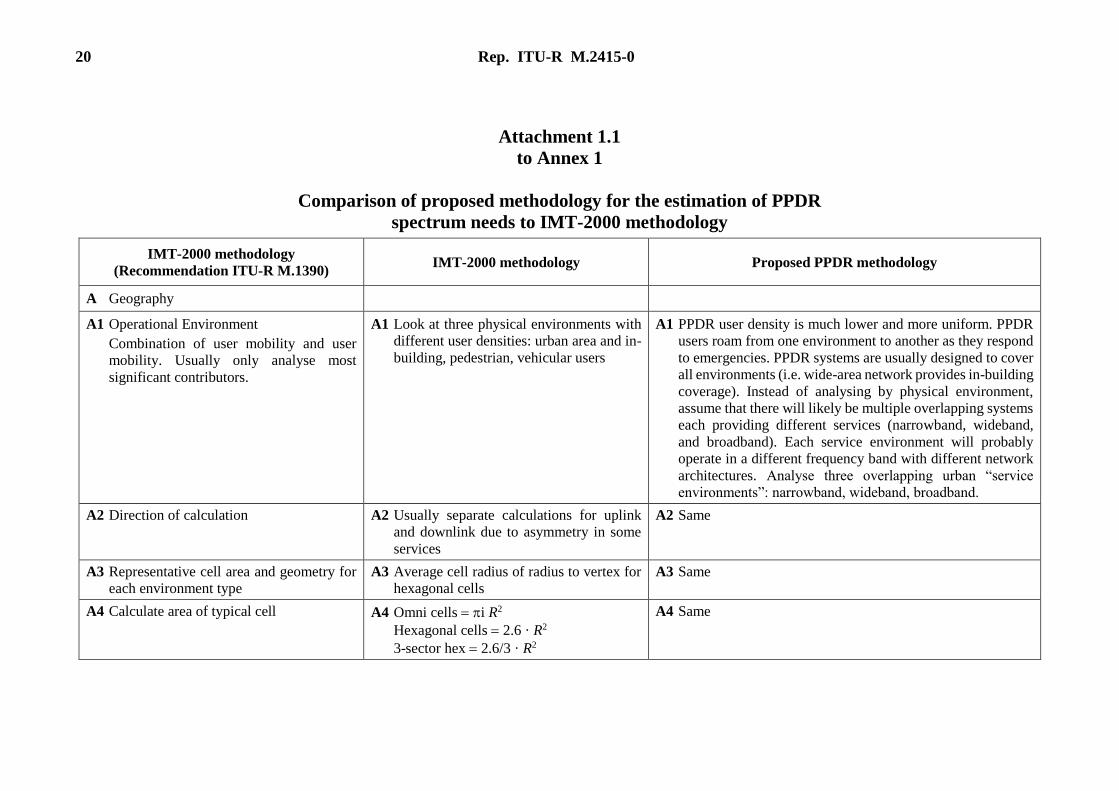
Attachment 1.1
to Annex 1
Comparison of proposed methodology for the estimation of PPDR
spectrum needs to IMT-2000 methodology
IMT-2000 methodology
(Recommendation ITU-R M.1390) IMT-2000 methodology Proposed PPDR methodology
A Geography
A1 Operational Environment
Combination of user mobility and user
mobility. Usually only analyse most
significant contributors.
A1 Look at three physical environments with
different user densities: urban area and in-
building, pedestrian, vehicular users
A1 PPDR user density is much lower and more uniform. PPDR
users roam from one environment to another as they respond
to emergencies. PPDR systems are usually designed to cover
all environments (i.e. wide-area network provides in-building
coverage). Instead of analysing by physical environment,
assume that there will likely be multiple overlapping systems
each providing different services (narrowband, wideband,
and broadband). Each service environment will probably
operate in a different frequency band with different network
architectures. Analyse three overlapping urban “service
environments”: narrowband, wideband, broadband.
A2 Direction of calculation A2 Usually separate calculations for uplink
and downlink due to asymmetry in some
services
A2 Same
A3 Representative cell area and geometry for
each environment type
A3 Average cell radius of radius to vertex for
hexagonal cells
A3 Same
A4 Calculate area of typical cell A4 Omni cells i R2
Hexagonal cells 2.6 · R2
3-sector hex 2.6/3 · R2
A4 Same

Rep. ITU-R M.2415-0 21
IMT-2000 methodology (Rec. ITU-R M.1390)
IMT-2000 methodology Proposed PPDR methodology
B Market & traffic
B1 Services offered B1 Net user bit rate (kbit/s)
For each service: speech, circuit data, simple messages, medium multimedia, high multimedia, highly interactive multimedia
B1 Net user bit rate (kbit/s) for each of the three PPDR service environments: narrowband, wideband, broadband
B2 Population density
Persons per unit of area within each environment. Population density varies with mobility
B2 Potential users per km2
Relative to general population
B2 Total PPDR user population within the total area under consideration. Divide PPDR user population by total area to get PPDR user population density.
PPDR users are usually separated into well-defined categories by mission. Example:
Category Population
Regular Police 25 498
Special Police Functions 6 010
Police Civilian Support 13 987
Fire Suppression 7 081
Part-time Fire 2 127
Fire Civilian Support 0
Emergency Medical Services 0
EMS Civilian Support 0
General Government Services 0
Other PPDR Users 0
Total PPDR user population 54 703
Area under consideration. Area within well-defined geographic or political boundaries.
Example: City of London 1 620 km2
PPDR user population density PPDR user population/area
Example: London 33.8 PPDR/km2

22 Rep. ITU-R M.2415-0
IMT-2000 methodology
(Rec. ITU-R M.1390) IMT-2000 methodology Proposed PPDR methodology
B3 Penetration rate
Percentage of persons subscribing to a
service within an environment. Person may
subscribe to more than one service
B3 Usually shown as table,
Rows are services defined in B1, such as
speech, circuit data, simple messages,
medium multi-media, high multimedia,
highly interactive multimedia.
Columns are environments, such as in-
building, pedestrian, vehicular
B3 Similar table.
Rows are services, such as voice, data, video
Columns are “service environments”, such as narrowband,
wideband, broadband.
May collect penetration rate into each “service environment”
separately for each PPDR category and then calculate
composite PPDR penetration rate.
Example:
Category Population Penetration
(NB Voice)
Regular Police 25 498 100%
Special Police Functions 6 010 10%
Police Civilian Support 13 987 10%
Fire Suppression 7 081
70%
Part-time Fire 2 127
10%
Fire Civilian Support 0 0
Emergency Medical Services 0 0
EMS Civilian Support 0 0
General Government Services 0 0
Other PPDR Users 0 0
TOTAL PPDR user population 54 703
Narrowband Voice
PPDR user population32 667
PPDR penetration rate for narrowband “service
environment” and voice “service”:
Sum(Pop Pen)/sum(Pop) 59.7%

Rep. ITU-R M.2415-0 23
IMT-2000 methodology
(Rec. ITU-R M.1390) IMT-2000 methodology Proposed PPDR methodology
B4 Users/cell
Number of people subscribing to service
within cell in environment
B4 Users/cell
Pop density Pen Rate Cell area B4 Same
B5 Traffic parameters
Busy hour call attempts: average number of
calls/sessions attempted to/from average user
during a busy hour
Effective call duration
Average call/session duration during busy
hour
Activity factor
Percentage of time that resource is actually
used during a call/session.
Example: bursty packet data may not use
channel during entire session. If voice
vocoder does not transmit data during voice
pauses
B5 Calls/busy hour
s/call
0-100%
B5 Same
Sources: PSWAC Report7 or data collected from existing
PPDR systems
Same
Same
More likely that activity factor is 100% for most PPDR services.
B6 Traffic/user
Average traffic generated by each user during
busy hour
B6 Call-seconds/user
Busy hour attempts Call duration
Activity factor
B6 Same
B7 Offered traffic/cell
Average traffic generated by all users within
a cell during the busy hour (3 600 s)
B7 Erlangs
Traffic/user User/cell/3 600
B7 Same
7 Report from September 1996, see footnote 3 in Annex 1 § 2 for details.

24 Rep. ITU-R M.2415-0
IMT-2000 methodology
(Rec. ITU-R M.1390) IMT-2000 methodology Proposed PPDR methodology
B8 Quality of service function
Offered traffic/cell is multiplied by typical
frequency reuse cell grouping size and
quality of Service factors (blocking
function) to estimate offered traffic/cell
at a given quality level
Group size
Traffic per group
Typical cellular reuse 7
Traffic/cell (E) Group Size
Use 12 for portable only or mobile only systems.
Use 21 for mixed portable and mobile systems.
In mixed systems, assume that system is designed for portable
coverage. Higher power mobiles in distant cells are likely to,
so group size is increased from 12 to 21 to provide more
separation.
Same
Service channels per group Apply grade of service formulas
Circuit Erlang B with 1% or 2%
blocking
Packet Erlang C with 1% or 2% delayed
and delay/holding time ratio 0.5
Similar
Use 1% blocking. Erlang B factor probably close to 1.5.
Need to consider extra reliability for PPDR systems, excess
capacity for peak emergencies, and number of channels likely
to be deployed at each PPDR antenna site.
Technology modularity may affect number of channels that
can be deployed at a site

Rep. ITU-R M.2415-0 25
IMT-2000 methodology
(Rec. ITU-R M.1390) IMT-2000 methodology Proposed PPDR methodology
C Technical and system considerations
C1 Service channels per cell to carry offered load C1 Service channels per cell
Service channels per
group/Group size
C1 Same
C2 Service channel bit rate (kbit/s)
Equals net user bit rate plus additional increase in
loading due to coding and/or overhead signalling,
if not already included
C2 Service channel bit rate Net
user bit rate
Overhead factor Coding
factor
If coding and overhead already
included in Net user bit rate,
then Coding factor 1 and
Overhead factor 1
C2 Same
Can also sum effects of coding and overhead.
If vocoder output 4.8 kbit/s, FEC 2.4 kbit/s, and Overhead
2.4 kbit/s, then Channel bit rate 9.6 kbit/s
C3 Calculate traffic (Mbit/s)
Total traffic transmitted within area under study,
including all factors
C3 Total traffic
Service channels per cell x
service channel bit rate
C3 Same
C4 Net system capability
Measure of system capacity for a specific
technology. Related to spectral efficiency
C4 Calculate for GSM system C4 Calculate for typical narrowband, wideband and broadband land
mobile systems
C5 Calculate for GSM model
200 kHz channel bandwidth, 9 cell reuse, 8 traffic
slots per carrier, frequency division duplex (FDD)
with 2 5.8 MHz, 2 guard channels, 13 kbit/s in
each traffic slot, 1.75 overhead/coding factor
C5 Net system capacity for GSM
model
0.1 Mbit/s/MHz/cell
C5 See Attachment 1.1 for several land mobile examples
26 Rep. ITU-R M.2415-0
IMT-2000 methodology
(Rec. ITU-R M.1390) IMT-2000 methodology Proposed PPDR methodology
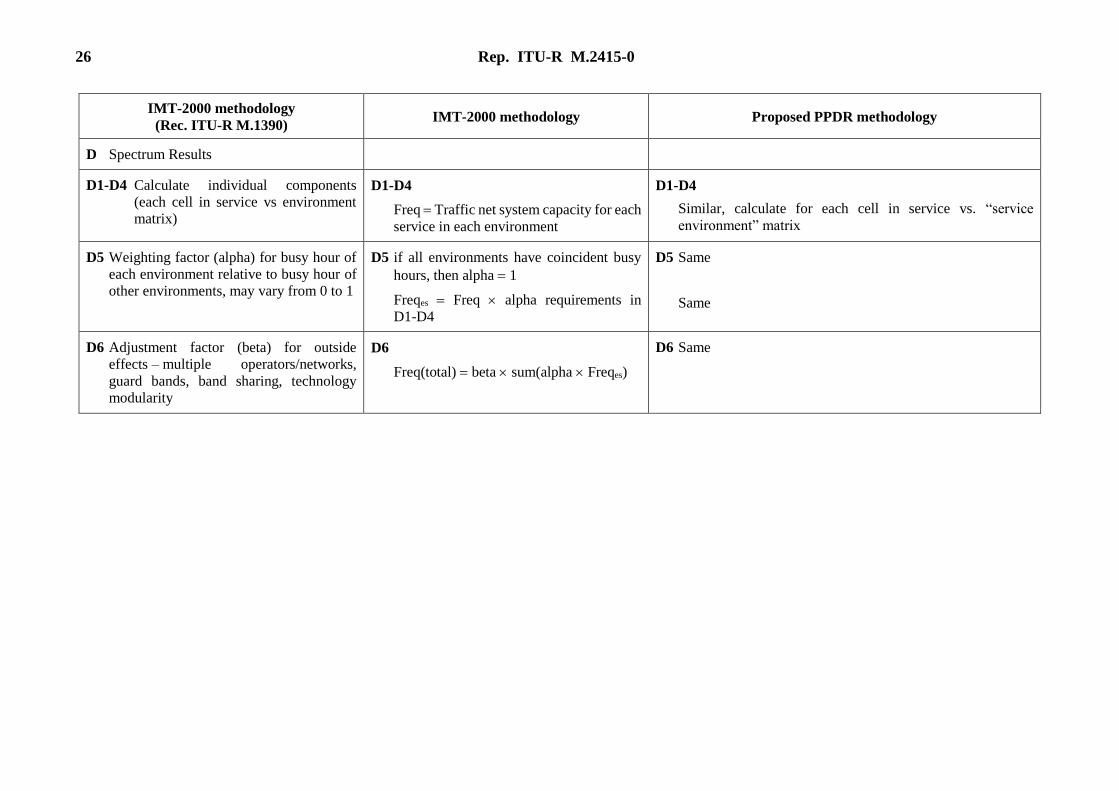
D Spectrum Results
D1-D4 Calculate individual components
(each cell in service vs environment
matrix)
D1-D4
Freq Traffic net system capacity for each
service in each environment
D1-D4
Similar, calculate for each cell in service vs. “service
environment” matrix
D5 Weighting factor (alpha) for busy hour of
each environment relative to busy hour of
other environments, may vary from 0 to 1
D5 if all environments have coincident busy
hours, then alpha 1
Freqes Freq alpha requirements in
D1-D4
D5 Same
Same
D6 Adjustment factor (beta) for outside
effects – multiple operators/networks,
guard bands, band sharing, technology
modularity
D6
Freq(total) beta sum(alpha Freqes)
D6 Same

Rep. ITU-R M.2415-0 27
Attachment 1.2
to Annex 1
PPDR Spectrum Needs Flowchart
Rap 2033-00
Define study area
Total population = nn, nnn, nnn people
Total area = nn, nnn km2
(Population density = pop/km2)
Sum (PPDR by category) Total area =
PPDR pop density = PPDR/km2
Define “service” environments
Narrowband
- High mobility
- Wide-area coverage
- Voice, transaction,
text, image
Wideband
- High mobility
- Wide-area coverage
- Text, image,
slow video
Broadband
- Low mobility
- Local area coverage
- Video, multimedia
Narrowband
penetration
Wideband
penetration
Broadband
penetration
Determine PPDR population by category
- Police/Law Enforcement
- Special Police Functions
- Civilian Police Support
- Fire Brigade
- Part-Time Fire
- Fire Civilian Support
- Emergency Medical Services
- EMS Civilian Support
- General Government Personnel
- Other PPDR Users
28 Rep. ITU-R M.2415-0
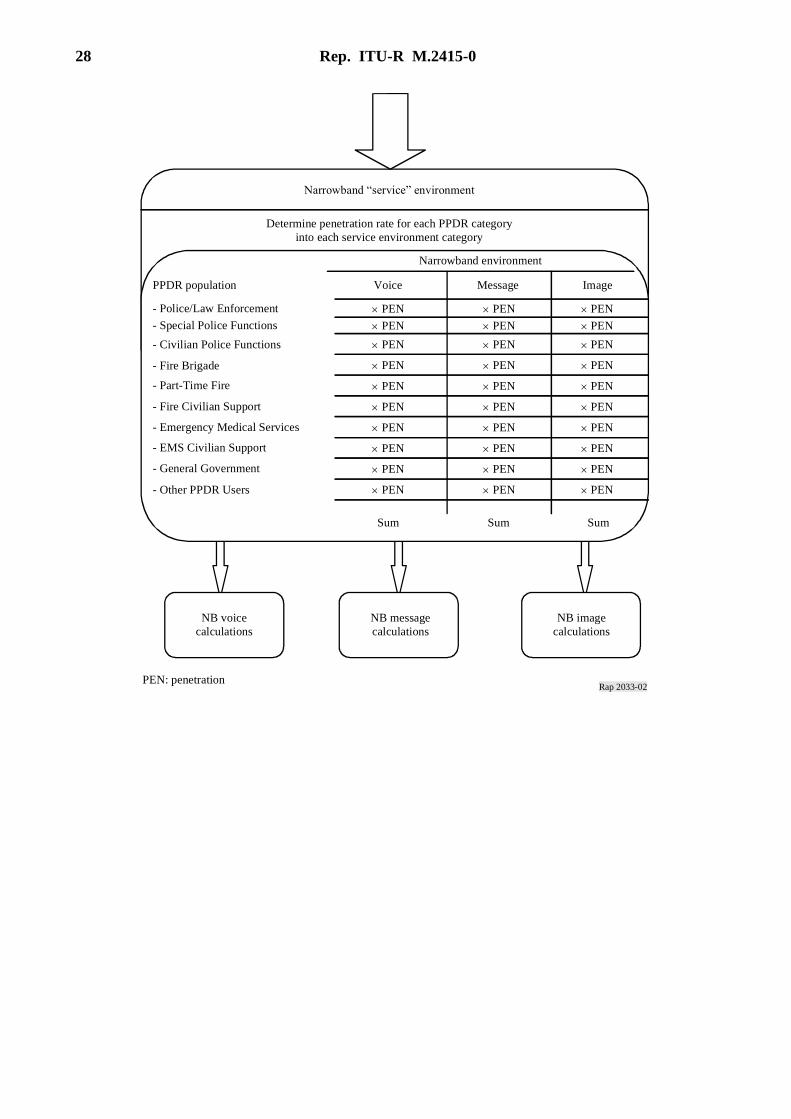
Rap 2033-02
Narrowband “service” environment
Determine penetration rate for each PPDR category
into each service environment category
Narrowband environment
Voice Message ImagePPDR population
- Police/Law Enforcement
- Special Police Functions
- Civilian Police Functions
- Fire Brigade
- Part-Time Fire
- Fire Civilian Support
- Emergency Medical Services
- EMS Civilian Support
- General Government
- Other PPDR Users
Sum Sum Sum
NB image
calculations
NB message
calculations
NB voice
calculations
PEN: penetration
PEN PEN PEN
PEN
PEN
PEN
PEN
PEN
PEN
PEN
PEN
PEN
PEN
PEN
PEN
PEN
PEN
PEN
PEN
PEN
PEN
PEN
PEN
PEN
PEN
PEN
PEN
PEN
PEN
PEN

Rep. ITU-R M.2415-0 29
Rap 2033-03
= PPDR
NB voice
population
Total
PPDR population
= PPDR NB voice
penetration rate
= PPDR
NB message
population
Total
PPDR population
= PPDR NB message
penetration rate
= PPDR
NB image
population
Total
PPDR population
= PPDR NB image
penetration rate
Population density
(PPDR/km2)
Cell area (km2/cell)
= PPDR NB voice
users per cell
= PPDR NB message
users per cell
= PPDR NB image
users per cell
Calls/busy hour
Seconds/call
Activity factor
= Traffic/user
Narrowband
voice
= Traffic/user
Narrowband
message
= Traffic/user
Narrowband
image
Users/cell
= Offered traffic/cell
(E)
= Offered traffic/cell
(E)
= Offered traffic/cell
(E)
Determine
average/typical
cell radius
for environment
Determine
cell geometry
for environment
Calculate
cell area
(km2/cell)
Population density
(PPDR/km2)
Cell area (km2/cell)
Population density
(PPDR/km2)
Cell area (km2/cell)
Calls/busy hour
Seconds/call
Activity factor
Calls/busy hour
Seconds/call
Activity factor
Users/cell
Users/cell
30 Rep. ITU-R M.2415-0
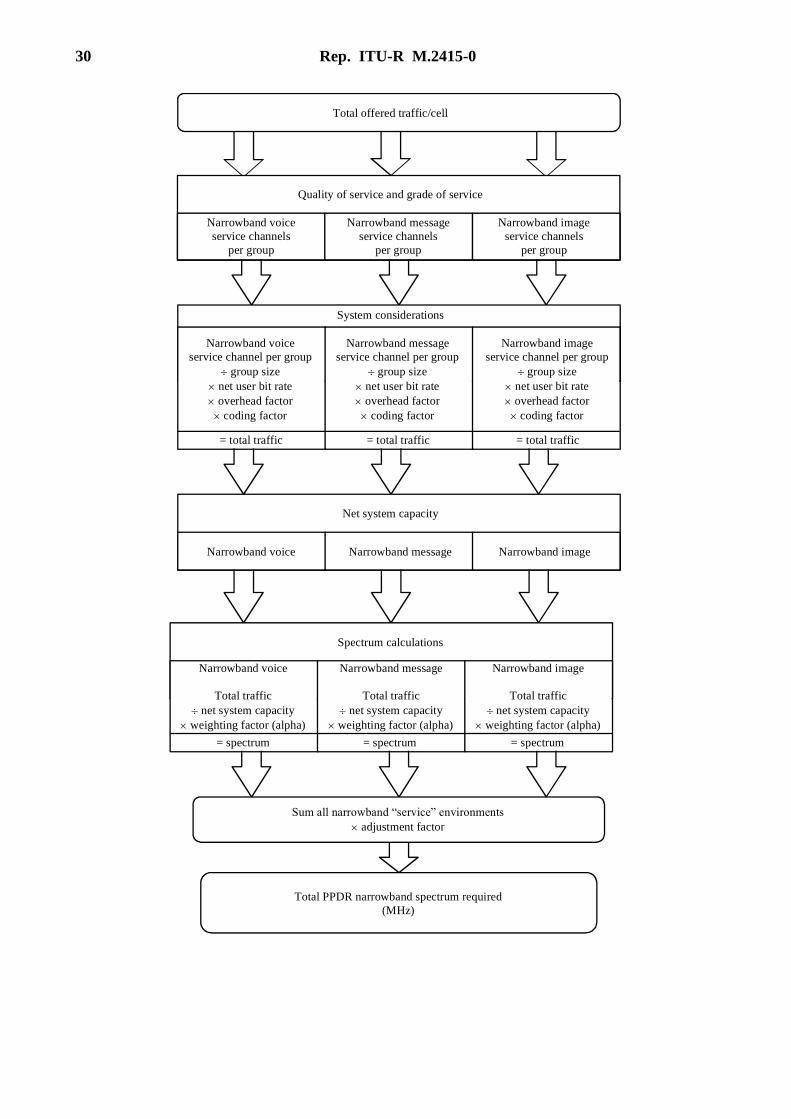
Rap 2033-04
Total offered traffic/cell
Quality of service and grade of service
Narrowband voice
service channels
per group
Narrowband message
service channels
per group
Narrowband image
service channels
per group
System considerations
Narrowband voice
service channel per group
group size
net user bit rate
overhead factor
coding factor
= total traffic
Narrowband voice
Net system capacity
Narrowband message Narrowband image
Spectrum calculations
Narrowband voice
Total traffic
net system capacity
weighting factor (alpha)
Narrowband message
Total traffic
net system capacity
weighting factor (alpha)
Narrowband image
Total traffic
net system capacity
weighting factor (alpha)
= spectrum = spectrum = spectrum
Sum all narrowband “service” environments
adjustment factor
Total PPDR narrowband spectrum required
(MHz)
Narrowband message
service channel per group
group size
net user bit rate
overhead factor
coding factor
= total traffic
Narrowband image
service channel per group
group size
net user bit rate
overhead factor
coding factor
= total traffic
Rep. ITU-R M.2415-0 31
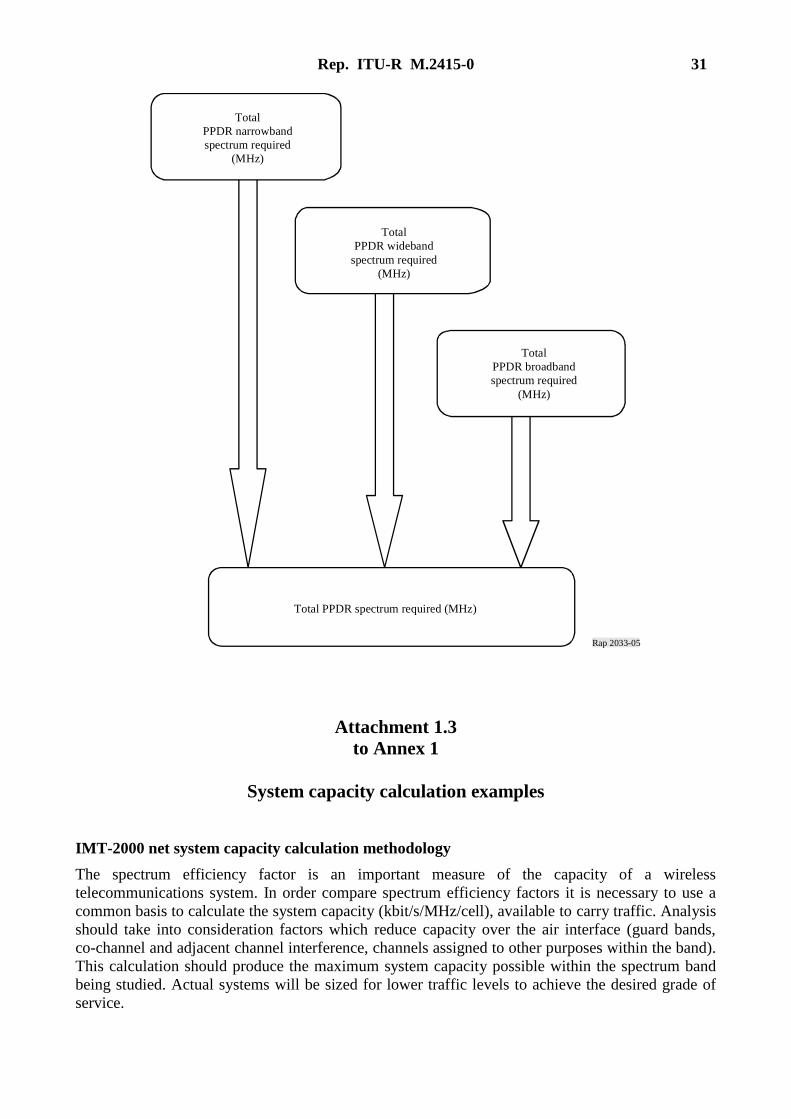
Attachment 1.3
to Annex 1
System capacity calculation examples
IMT-2000 net system capacity calculation methodology
The spectrum efficiency factor is an important measure of the capacity of a wireless
telecommunications system. In order compare spectrum efficiency factors it is necessary to use a
common basis to calculate the system capacity (kbit/s/MHz/cell), available to carry traffic. Analysis
should take into consideration factors which reduce capacity over the air interface (guard bands,
co-channel and adjacent channel interference, channels assigned to other purposes within the band).
This calculation should produce the maximum system capacity possible within the spectrum band
being studied. Actual systems will be sized for lower traffic levels to achieve the desired grade of
service.
Rap 2033-05
Total
PPDR narrowband
spectrum required
(MHz)
Total
PPDR wideband
spectrum required
(MHz)
Total
PPDR broadband
spectrum required
(MHz)
Total PPDR spectrum required (MHz)
32 Rep. ITU-R M.2415-0
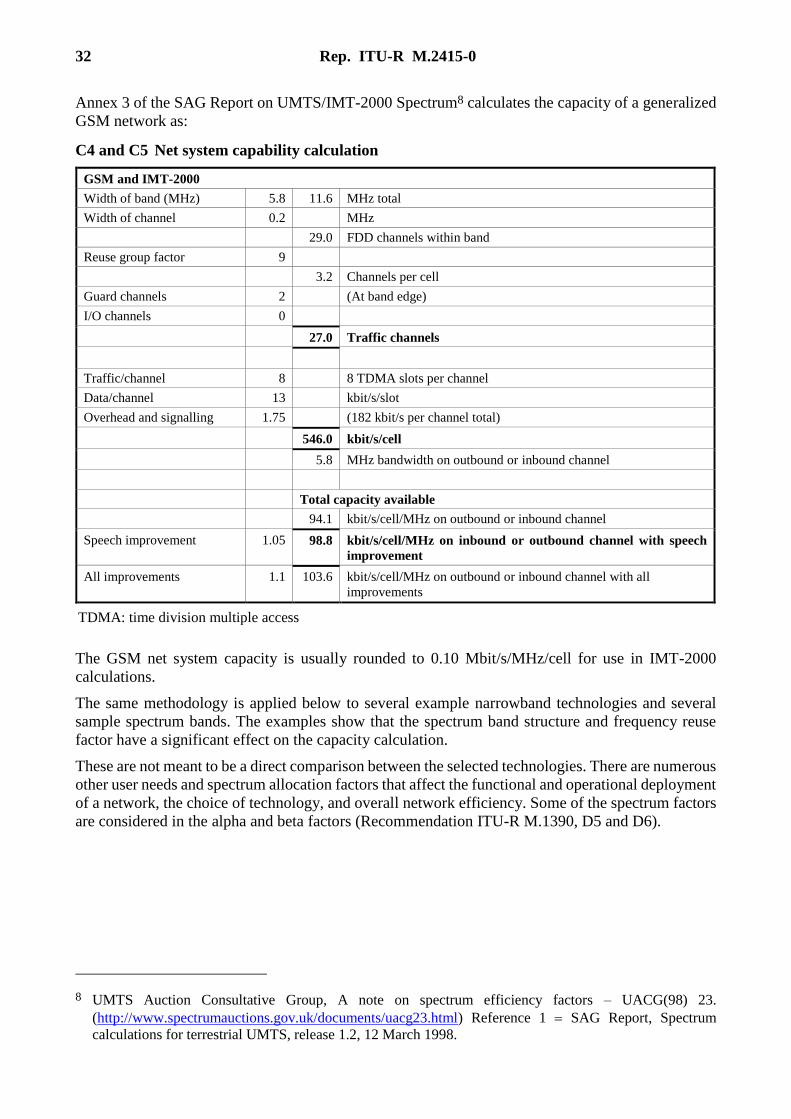
Annex 3 of the SAG Report on UMTS/IMT-2000 Spectrum8 calculates the capacity of a generalized
GSM network as:
C4 and C5 Net system capability calculation
GSM and IMT-2000
Width of band (MHz) 5.8 11.6 MHz total
Width of channel 0.2 MHz
29.0 FDD channels within band
Reuse group factor 9
3.2 Channels per cell
Guard channels 2 (At band edge)
I/O channels 0
27.0 Traffic channels
Traffic/channel 8 8 TDMA slots per channel
Data/channel 13 kbit/s/slot
Overhead and signalling 1.75 (182 kbit/s per channel total)
546.0 kbit/s/cell
5.8 MHz bandwidth on outbound or inbound channel
Total capacity available
94.1 kbit/s/cell/MHz on outbound or inbound channel
Speech improvement 1.05 98.8 kbit/s/cell/MHz on inbound or outbound channel with speech
improvement
All improvements 1.1 103.6 kbit/s/cell/MHz on outbound or inbound channel with all
improvements
TDMA: time division multiple access
The GSM net system capacity is usually rounded to 0.10 Mbit/s/MHz/cell for use in IMT-2000
calculations.
The same methodology is applied below to several example narrowband technologies and several
sample spectrum bands. The examples show that the spectrum band structure and frequency reuse
factor have a significant effect on the capacity calculation.
These are not meant to be a direct comparison between the selected technologies. There are numerous
other user needs and spectrum allocation factors that affect the functional and operational deployment
of a network, the choice of technology, and overall network efficiency. Some of the spectrum factors
are considered in the alpha and beta factors (Recommendation ITU-R M.1390, D5 and D6).
8 UMTS Auction Consultative Group, A note on spectrum efficiency factors – UACG(98) 23.
(http://www.spectrumauctions.gov.uk/documents/uacg23.html) Reference 1 SAG Report, Spectrum
calculations for terrestrial UMTS, release 1.2, 12 March 1998.

Rep. ITU-R M.2415-0 33
Net system capability summary
Spectrum band Technology Channels Total capacity
available
Reuse group factor = 12
European 400 MHz public safety band TETRA TDMA 4 slots/25 kHz 98.0 kbit/s/MHz/cell
Reuse group factor = 21
European 400 MHz public safety band TETRA TDMA 4 slots/25 kHz 56.0 kbit/s/MHz/cell
FDMA: Frequency division multiple access.
NOTE – 1 Reuse group factor of 12 is used for systems implementing only low power, handheld, portable
devices. Reuse factor of 21 is used for systems implementing both handheld portables and higher power,
vehicular mounted, mobile devices. Greater reuse factor is required because of potential for interference from
distant mobiles into cells designed for portable coverage.
Example 1: Narrowband technologies for dispatch voice and low rate data.
TETRA TDMA applied to European 400 MHz public safety band.
Rap 2033-06
With 12-cell reuse pattern,
distant high power mobile may
interfere into cells designed for
low power hand-held portable
coverage.
21-cell reuse pattern
is recommended.

34 Rep. ITU-R M.2415-0
C4 and C5 Net system capability calculation
TETRA TDMA European 400 MHz public safety band
Width of band (MHz) 3 6.0 MHz total
Width of channel 0.025
120.0 FDD channels within band
Reuse group factor 12 (Hand-held portables only)
10.0 Channels per cell
Guard channels 2 (At band edge)
Interoperability channels 20 (Reserve for direct mode operations)
98.0 Traffic channels
Traffic/channel 4 Slots/channel
Data/channel 7.2 kbit/s/slot
Overhead and signalling 1.25 (36 kbit/s per channel total)
294.0 kbit/s/cell
3.0 MHz bandwidth on outbound or inbound channel
Total capacity available
98.0 kbit/s/cell/MHz on outbound or inbound channel
Speech improvement 1.05 102.9 kbit/s/cell/MHz on outbound or inbound channel with speech improvement
All improvements 1.1 107.8 kbit/s/cell/MHz on outbound or inbound channel with all improvements
TETRA TDMA European 400 MHz public safety band
Width of band (MHz) 3 6.0 MHz total
Width of channel 0.025
120.0 FDD channels within band
Reuse group factor 21 (Mixture of portables and mobiles)
5.7 Channels per cell
Guard channels 2 (At band edge)
Interoperability channels 20 (Reserve for direct mode operations)
98.0 Traffic channels
Traffic/channel 4 Slots/channel
Data/channel 7.2 kbit/s/slot
Overhead and signalling 1.25 (36 kbit/s per channel total)
168.0 kbit/s/cell
3.0 MHz bandwidth on outbound or inbound channel
Total capacity available
56.0 kbit/s/cell/MHz on outbound or inbound channel
Speech improvement 1.05 58.8 kbit/s/cell/MHz on outbound or inbound channel with speech improvement
All improvements 1.1 61.6 kbit/s/cell/MHz on outbound or inbound channel with all improvements
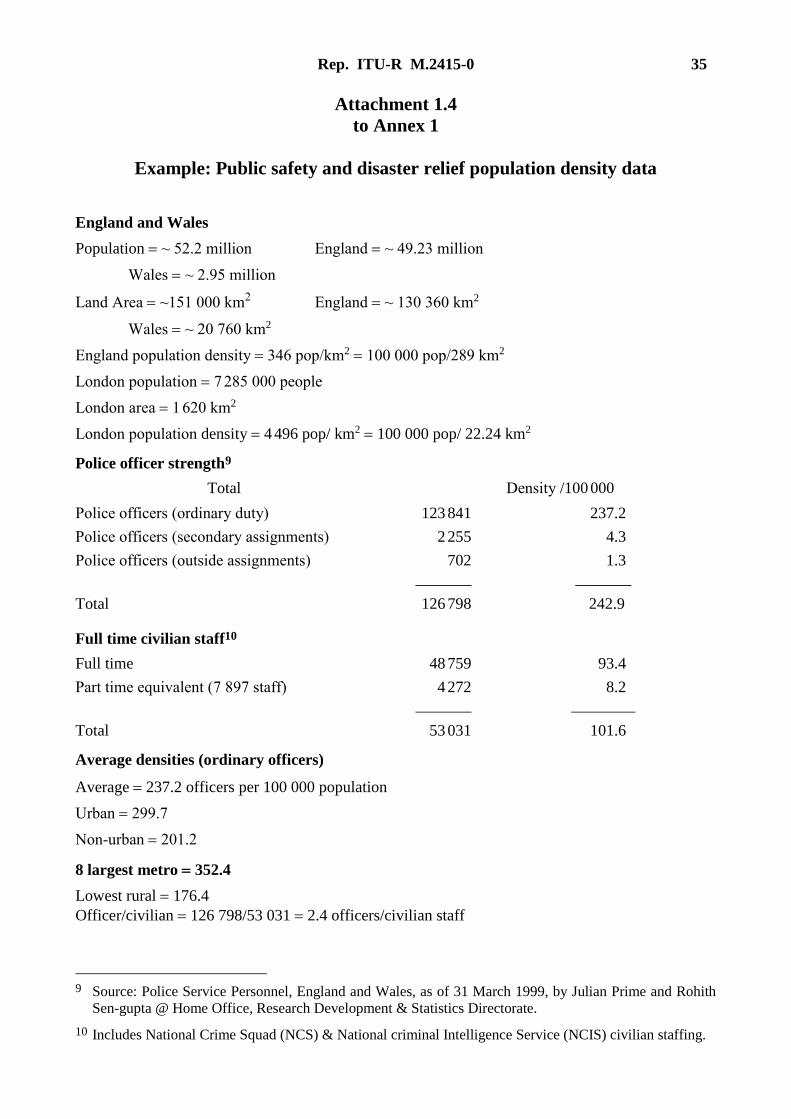
Rep. ITU-R M.2415-0 35
Attachment 1.4
to Annex 1
Example: Public safety and disaster relief population density data
England and Wales
Population ~ 52.2 million England ~ 49.23 million
Wales ~ 2.95 million
Land Area ~151 000 km2 England ~ 130 360 km2
Wales ~ 20 760 km2
England population density 346 pop/km2 100 000 pop/289 km2
London population 7 285 000 people
London area 1 620 km2
London population density 4 496 pop/ km2 100 000 pop/ 22.24 km2
Police officer strength9
Total Density /100 000
Police officers (ordinary duty) 123 841 237.2
Police officers (secondary assignments) 2 255 4.3
Police officers (outside assignments) 702 1.3
_______ _______
Total 126 798 242.9
Full time civilian staff10
Full time 48 759 93.4
Part time equivalent (7 897 staff) 4 272 8.2
_______ ________
Total 53 031 101.6
Average densities (ordinary officers)
Average 237.2 officers per 100 000 population
Urban 299.7
Non-urban 201.2
8 largest metro 352.4
Lowest rural 176.4
Officer/civilian 126 798/53 031 2.4 officers/civilian staff
9 Source: Police Service Personnel, England and Wales, as of 31 March 1999, by Julian Prime and Rohith
Sen-gupta @ Home Office, Research Development & Statistics Directorate.
10 Includes National Crime Squad (NCS) & National criminal Intelligence Service (NCIS) civilian staffing.
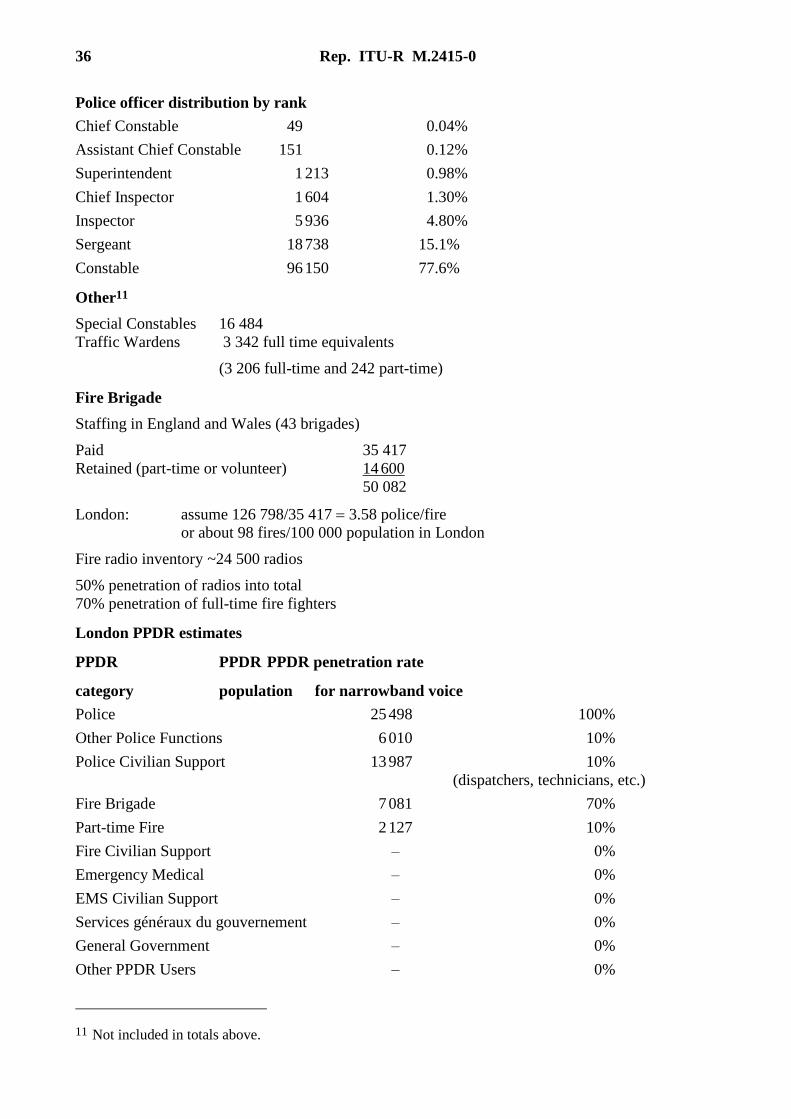
36 Rep. ITU-R M.2415-0
Police officer distribution by rank
Chief Constable 49 0.04%
Assistant Chief Constable 151 0.12%
Superintendent 1 213 0.98%
Chief Inspector 1 604 1.30%
Inspector 5 936 4.80%
Sergeant 18 738 15.1%
Constable 96 150 77.6%
Other11
Special Constables 16 484
Traffic Wardens 3 342 full time equivalents
(3 206 full-time and 242 part-time)
Fire Brigade
Staffing in England and Wales (43 brigades)
Paid 35 417
Retained (part-time or volunteer) 14 600
50 082
London: assume 126 798/35 417 3.58 police/fire
or about 98 fires/100 000 population in London
Fire radio inventory ~24 500 radios
50% penetration of radios into total
70% penetration of full-time fire fighters
London PPDR estimates
PPDR PPDR PPDR penetration rate
category population for narrowband voice
Police 25 498 100%
Other Police Functions 6 010 10%
Police Civilian Support 13 987 10%
(dispatchers, technicians, etc.)
Fire Brigade 7 081 70%
Part-time Fire 2 127 10%
Fire Civilian Support – 0%
Emergency Medical – 0%
EMS Civilian Support – 0%
Services généraux du gouvernement – 0%
General Government – 0%
Other PPDR Users – 0%
11 Not included in totals above.
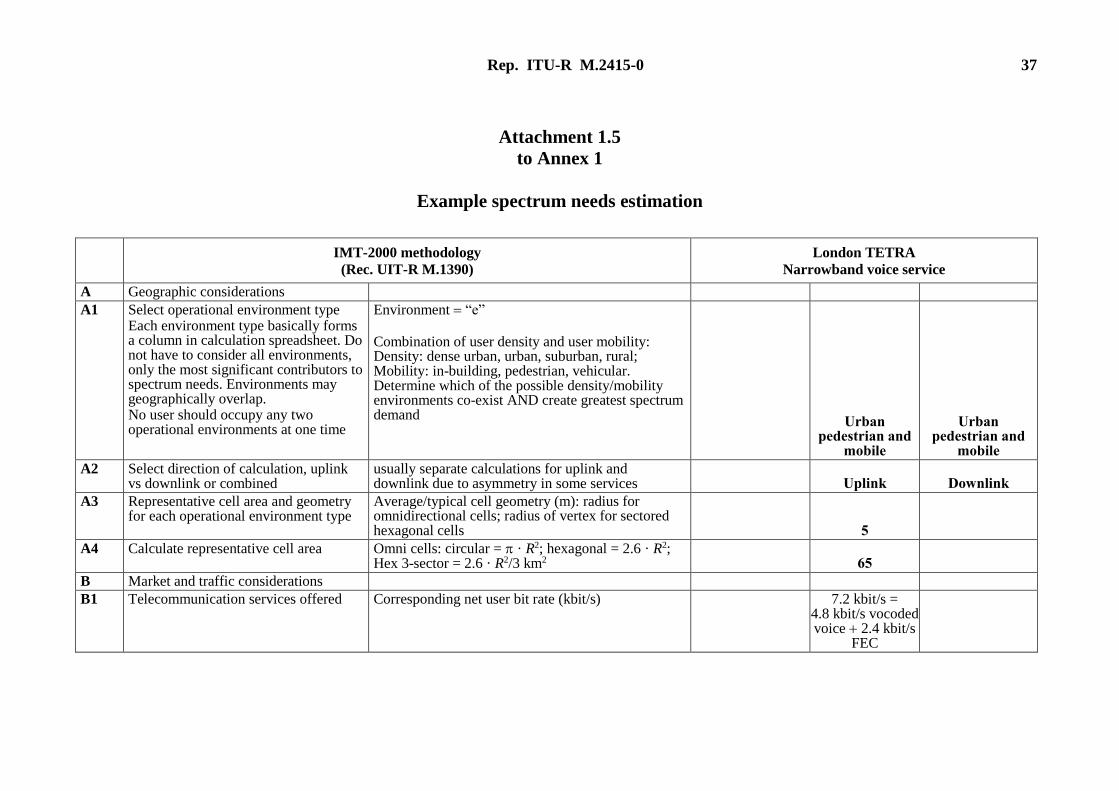
Rep. ITU-R M.2415-0 37
Attachment 1.5
to Annex 1
Example spectrum needs estimation
IMT-2000 methodology
(Rec. UIT-R M.1390)
London TETRA
Narrowband voice service
A Geographic considerations
A1 Select operational environment type Each environment type basically forms a column in calculation spreadsheet. Do not have to consider all environments, only the most significant contributors to spectrum needs. Environments may geographically overlap. No user should occupy any two operational environments at one time
Environment “e” Combination of user density and user mobility: Density: dense urban, urban, suburban, rural; Mobility: in-building, pedestrian, vehicular. Determine which of the possible density/mobility environments co-exist AND create greatest spectrum demand
Urban pedestrian and
mobile
Urban pedestrian and
mobile
A2 Select direction of calculation, uplink vs downlink or combined
usually separate calculations for uplink and downlink due to asymmetry in some services
Uplink Downlink
A3 Representative cell area and geometry for each operational environment type
Average/typical cell geometry (m): radius for omnidirectional cells; radius of vertex for sectored hexagonal cells
5
A4 Calculate representative cell area Omni cells: circular = · R2; hexagonal = 2.6 · R2; Hex 3-sector = 2.6 · R2/3 km2
65
B Market and traffic considerations
B1 Telecommunication services offered Corresponding net user bit rate (kbit/s) 7.2 kbit/s = 4.8 kbit/s vocoded voice 2.4 kbit/s
FEC

38 Rep. ITU-R M.2415-0
IMT-2000 methodology
(Rec. UIT-R M.1390)
London TETRA
Narrowband voice service
B2 Population density Total population sum (POP by category)
54 703
Total PPDR user population within
area under consideration
= SUM (POP PEN)
Population (POP) by PPDR category
Penetration (PEN) rate within PPDR
category
Police Other Police Police Civilian Support Fire Part-time Fire Fire Civilian Support EMS EMS Civilian Support General Government Other PPDR Users
25 498 6 010
13 987 7 081 2 127 0 0 0 0 0
(Narrowband voice)
1.00 0.10 0.10 0.70 0.10 0.10 0.50 0.10 0.10 0.10
32 667,1
PPDR user population using NB voice service
Area under consideration 308.9 square miles 1 620 km2
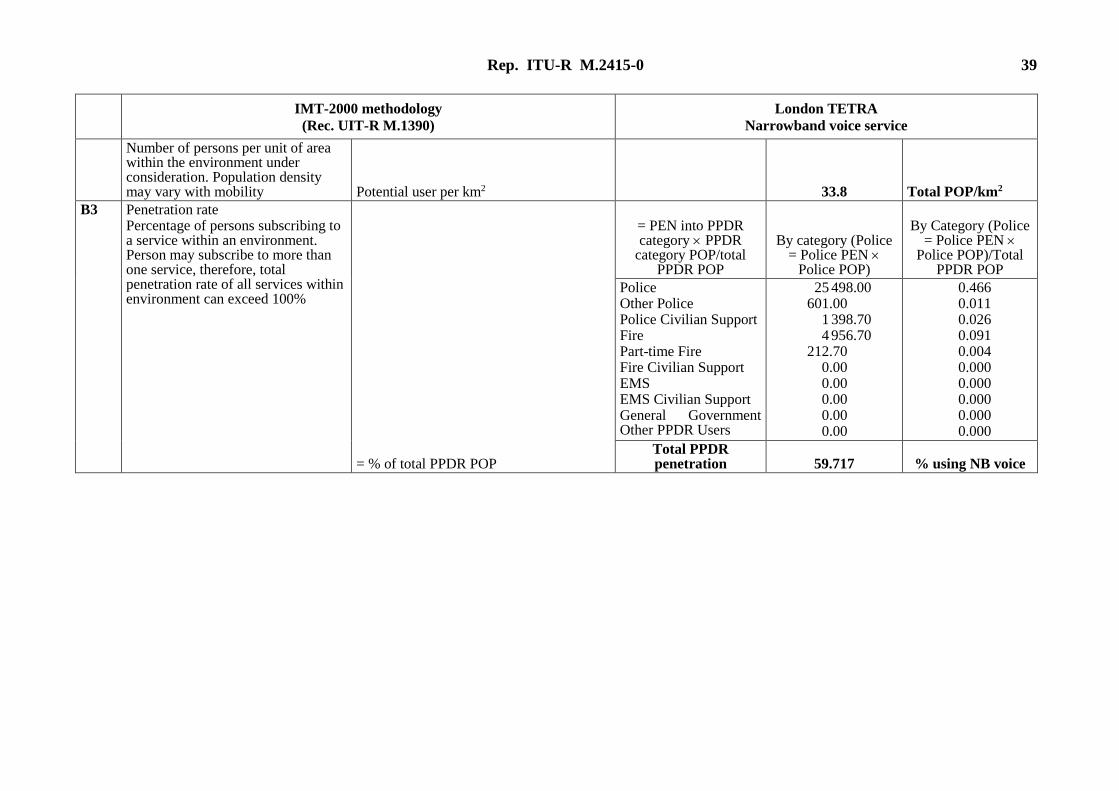
Rep. ITU-R M.2415-0 39
IMT-2000 methodology
(Rec. UIT-R M.1390)
London TETRA
Narrowband voice service
Number of persons per unit of area within the environment under consideration. Population density may vary with mobility Potential user per km2
33.8 Total POP/km2
B3 Penetration rate Percentage of persons subscribing to a service within an environment. Person may subscribe to more than one service, therefore, total penetration rate of all services within environment can exceed 100%
= % of total PPDR POP
= PEN into PPDR category PPDR
category POP/total PPDR POP
By category (Police = Police PEN
Police POP)
By Category (Police = Police PEN
Police POP)/Total PPDR POP
Police Other Police Police Civilian Support Fire Part-time Fire Fire Civilian Support EMS EMS Civilian Support General Government Other PPDR Users
25 498.00 601.00
1 398.70 4 956.70
212.70 0.00 0.00 0.00 0.00 0.00
0.466 0.011 0.026 0.091 0.004 0.000 0.000 0.000 0.000 0.000
Total PPDR penetration 59.717 % using NB voice
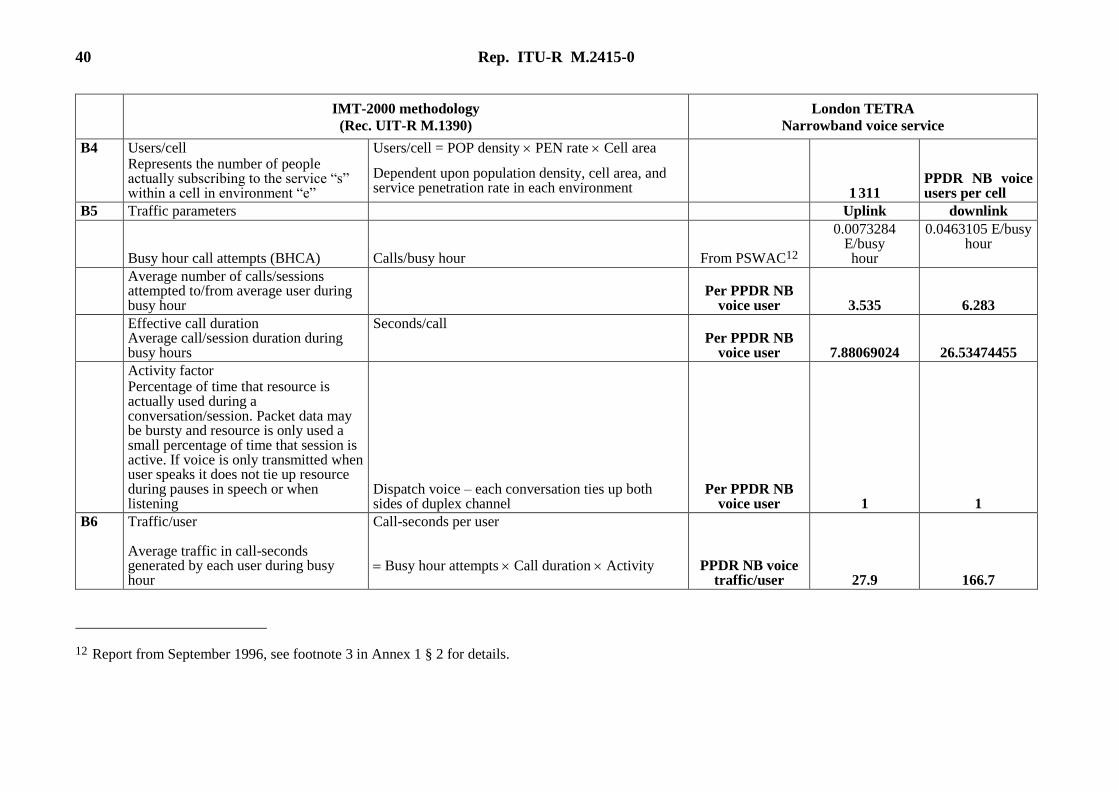
40 Rep. ITU-R M.2415-0
IMT-2000 methodology
(Rec. UIT-R M.1390)
London TETRA
Narrowband voice service
B4 Users/cell Represents the number of people actually subscribing to the service “s” within a cell in environment “e”
Users/cell = POP density PEN rate Cell area
Dependent upon population density, cell area, and service penetration rate in each environment 1 311
PPDR NB voice users per cell
B5 Traffic parameters Uplink downlink
Busy hour call attempts (BHCA) Calls/busy hour From PSWAC12
0.0073284 E/busy hour
0.0463105 E/busy hour
Average number of calls/sessions attempted to/from average user during busy hour
Per PPDR NB
voice user 3.535 6.283
Effective call duration Average call/session duration during busy hours
Seconds/call Per PPDR NB
voice user 7.88069024 26.53474455
Activity factor Percentage of time that resource is actually used during a conversation/session. Packet data may be bursty and resource is only used a small percentage of time that session is active. If voice is only transmitted when user speaks it does not tie up resource during pauses in speech or when listening
Dispatch voice – each conversation ties up both sides of duplex channel
Per PPDR NB voice user 1 1
B6 Traffic/user Average traffic in call-seconds generated by each user during busy hour
Call-seconds per user Busy hour attempts Call duration Activity PPDR NB voice
traffic/user 27.9 166.7
12 Report from September 1996, see footnote 3 in Annex 1 § 2 for details.

Rep. ITU-R M.2415-0 41
IMT-2000 methodology
(Rec. UIT-R M.1390)
London TETRA
Narrowband voice service
B7 Offered traffic/cell Average traffic generated by all users within a cell during the busy hour (3 600 s)
Erlangs = Traffic/user User/cell/3600
PPDR NB voice traffic cell
10.14 60.70
B8 Establish quality of service (QOS) function parameters
Uplink Downlink
Group size Number of cells in a group. Because cellular system deployment and technologies provide some measure of traffic “sharing” between adjacent cells, traffic versus QoS is considered within a grouping of cells
12 (portable only) or 21 (portable mobile) Typical cellular grouping is 1 cell surrounded by 6 adjacent cells for a group size of 7. Traffic/cell is multiplied by group size and quality of service (or blocking function) is applied to grouping. Answer is divided by group size to restore to valuation per cell
21 21
Traffic per group = Traffic/cell (E) Group size
PPDR NB voice traffic group
213.00 1 274.70
Service channels per group Determine number of channels required to support traffic from each service, round to next higher whole number
= apply grade of service formulas across group Circuit = Erlang B with 1% blocking. Used Erlang = 1.5, assuming that dispatch voice in broken into multiple systems with no more than 20 channels per site
1.50 1.50
PPDR NB voice service channels per
group
319.50 1 912.05

42 Rep. ITU-R M.2415-0
IMT-2000 methodology
(Rec. UIT-R M.1390)
London TETRA
Narrowband voice service
C Technical and system considerations Uplink Downlink
C1 Service channels per cell needed to carry offered load Actual number of “channels” that must be provisioned within each cell to carry intended traffic
= Service channels per group/Group size PPDR NB
voice service channels per cell
15.21 91.05
C2 Service channel bit rate (kbit/s) Service channel bit rate equals net user bit rate, plus any additional increases in bit rate due to coding factors and/or overhead signalling
= Net user bit rate Overhead factor Coding factor This is where coding and overhead factors are included. For coding factor = 1, and overhead factor = 1, = B1 1 1 = Net user bit rate
9.6 kbit/s includes coding and overhead
PPDR NB voice service
channel bit rate
9 9
C3 Calculate traffic (Mbit/s) Total traffic to be transmitted within the area of study – includes all factors; user traffic (call duration, busy hour call attempts, activity factor, net channel bit rate) environment, service type, direction of transmission (up/down link), cell geometry, quality of service, traffic efficiency (calculated across a group of cells), and service channel bit rate (including coding and overhead factors)
= Service channels/Cell Service channel bit rate
PPDR NB voice traffic
(Mbit/s) 0.137 0.819
C4 Net system capability Measure of system capacity for a specific technology. Related to spectral efficiency. Requires complex calculation or simulation to determine net system capability for a specific technology deployed in a specific network configuration
Trade-offs between net system capability and QoS. May include the following factors; spectral efficiency of technology, Eb/N0 requirements, C/I requirements, frequency re-use plan, coding/signalling factors of radio transmission technology, environment, deployment model

Rep. ITU-R M.2415-0 43
IMT-2000 methodology
(Rec. UIT-R M.1390)
London TETRA
Narrowband voice service
C5 Calculate for GSM model Calculation for TETRA TDMA using 25 kHz bandwidth channels, 21 cell re-use (mobile + portable), 4 traffic slots per carrier, ignoring signalling channels, 400 MHz bandplan, FDD with 2 3 MHz (120 RF channels - 20 DMO channels –2 guard channels at edge of band), data rate of 7.2 kbits/s on each traffic slot, a factor of 1.25 for overhead and coding. Net system capacity for TETRA TDMA = 56.0 kbit/s/MHz/cell
TETRA 0.056 0.056
D Spectrum results Uplink Downlink
D1-D4
Calculate individual components Freq = Traffic/Net system capability PPDR NB voice (MHz)
2.445 14.633
D5 Weighting factor for each environment (alpha) Weighting of each environment relative to other environments - alpha may vary from 0 to 1, correct for non-simultaneous busy hours, correct for geographic offsets
= Freq alpha If all environments have coincident busy hours and all three environments are co-located,, then alpha = 1
Alpha = 1 1 1
PPDR NB voice (MHz)
2.445 14.633
D6 Adjustment factor (beta) Freq(total) = beta sum (alpha Freq)
Adjustment of all environments to outside effects - multiple operators/users (decreased trunking or spectral efficiency), guardbands, sharing with other services within band, technology modularity, etc.
For dispatch voice model, assuming one system and fact that guardbands were included in C5, then beta = 1. Multiple systems, such as one for Police and one for Fire/EMS may decrease efficiency and beta would be > 1
Beta = 1 1
D7 Estimated total spectrum need PPDR NB voice TOTAL (MHz)
17.078 MHz
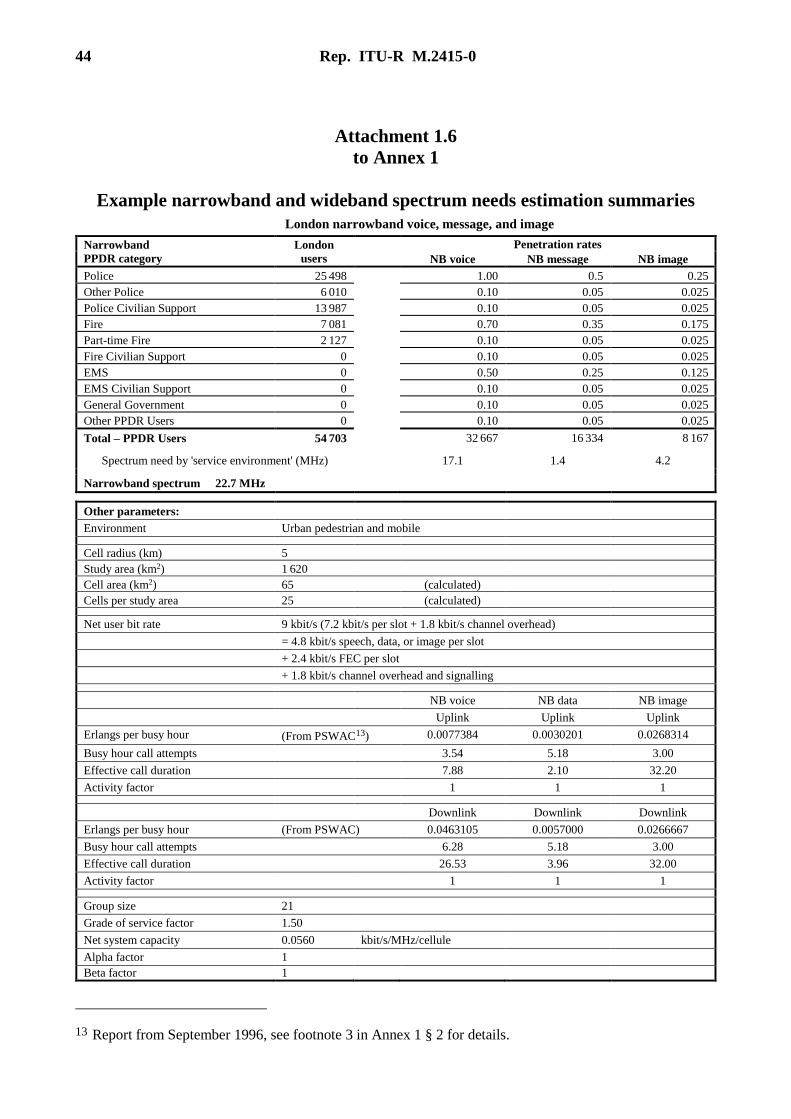
44 Rep. ITU-R M.2415-0
Attachment 1.6
to Annex 1
Example narrowband and wideband spectrum needs estimation summaries
London narrowband voice, message, and image
Narrowband
PPDR category
London
users
Penetration rates
NB voice NB message NB image
Police 25 498 1.00 0.5 0.25
Other Police 6 010 0.10 0.05 0.025
Police Civilian Support 13 987 0.10 0.05 0.025
Fire 7 081 0.70 0.35 0.175
Part-time Fire 2 127 0.10 0.05 0.025
Fire Civilian Support 0 0.10 0.05 0.025
EMS 0 0.50 0.25 0.125
EMS Civilian Support 0 0.10 0.05 0.025
General Government 0 0.10 0.05 0.025
Other PPDR Users 0 0.10 0.05 0.025
Total – PPDR Users 54 703 32 667 16 334 8 167
Spectrum need by 'service environment' (MHz) 17.1 1.4 4.2
Narrowband spectrum 22.7 MHz
Other parameters:
Environment Urban pedestrian and mobile
Cell radius (km) 5
Study area (km2) 1 620
Cell area (km2) 65 (calculated)
Cells per study area 25 (calculated)
Net user bit rate 9 kbit/s (7.2 kbit/s per slot + 1.8 kbit/s channel overhead)
= 4.8 kbit/s speech, data, or image per slot
+ 2.4 kbit/s FEC per slot
+ 1.8 kbit/s channel overhead and signalling
NB voice NB data NB image
Uplink Uplink Uplink
Erlangs per busy hour (From PSWAC13) 0.0077384 0.0030201 0.0268314
Busy hour call attempts 3.54 5.18 3.00
Effective call duration 7.88 2.10 32.20
Activity factor 1 1 1
Downlink Downlink Downlink
Erlangs per busy hour (From PSWAC) 0.0463105 0.0057000 0.0266667
Busy hour call attempts 6.28 5.18 3.00
Effective call duration 26.53 3.96 32.00
Activity factor 1 1 1
Group size 21
Grade of service factor 1.50
Net system capacity 0.0560 kbit/s/MHz/cellule
Alpha factor 1
Beta factor 1
13 Report from September 1996, see footnote 3 in Annex 1 § 2 for details.

Rep. ITU-R M.2415-0 45
Attachment 2
to Annex 1
PPDR spectrum need estimation based on generic city
analysis (demographic population)
1 Generic City Approach
Instead of looking at specific cities, the following analysis examines several medium sized cities in
several countries. This analysis is based upon the average density of police officers relative to the
general demographic population and the ratio of police to other public protection providers. From this
analysis, a generic example of the relationship between the different PPDR user categories and
demographic population density has been developed. This approach shows the optimum PPDR
spectrum need based on the size of demographic population, that is, the amount of PPDR spectrum
needed based on the idealistic amount of PPDR users in a city based on demographic population size.
The police and PPDR densities were examined from national statistics and city budgets for Australia,
and England. Statistics for police show a national average density in the 180 police per 100 000
population to 250 police per 100 000 population. The density in urban areas varies from about 25%
above the national average for medium density cities to >100% above the national average for dense
urban cities. The density in suburban areas varies from about 25% above the national average for
suburbs of medium density cities to 50% above the national average for suburbs of dense urban cities.
Fire and EMS/Rescue levels were harder to determine because they are often combined together.
Information was used for cities where they were separate, and ratios of the various PP and DR
categories were determined relative to the police population density. For example, ratios for fire
fighters were in the range of 3.5 to 4 police officers per fire fighter (25 to 30%). Where
Rescue/Emergency Medical/Ambulance could be separated out, ratios for Rescue/EMS were in the
range of 3.5 to 4 fire fighters per Rescue/EMS (25 to 30%).
In the generic examples below, and for simplicity, only two densities are used, 180 and 250 police
per 100 000 population. Also for simplicity, only two types of cities were analysed: a medium size
city (2.5 million population) and a large city (8 million population). This probably underestimates the
PPDR density in large urban areas where there are many examples of police densities in the range of
400-500 police per 100 000 population.
The “doughnut” effect was also examined, where frequencies used in the urban centre cannot be
reused in the suburbs immediately adjacent to the urban area. In ITU-R contributions from the
2000-2003 study period, many of the cities included both the urban and suburban areas together in a
single spectrum need estimation. Cell size had to be averaged and PPDR user density was lowered.
In retrospect, each area should have been treated separately, and the spectrum needs added together.
Numerous urban areas were examined. Most had a central urban core with a dense population. There
was also a suburban ring around the urban core that contained about the same amount of population,
but was about 5 to 20 times the area of the urban core. The examples below use a ratio of 10:1 for
suburban to urban area. Assuming 4 to 5 km radius cell sizes for the urban core, typical cell sizes in
the suburbs should be about 10 times larger in area or ~3 times larger in radius.

46 Rep. ITU-R M.2415-0
2 PPDR categories
Three classes of users were defined, which is basically re-grouping the PPDR categories by
penetration rates:
Primary users (usage with 30% penetration rate) PP users normally operating within the geographic
area on a day-to-day basis local police, fire fighters, and emergency medical/rescue
Secondary users (usage with 10% penetration rate) other police (state, district, province, federal,
national, special operations, investigators), part-time or volunteer police/fire, general government
workers, civil protection agencies, military/army, utility workers, disaster relief workers
Rap 2033-01
Adjacent suburban area
- Assume area is ~10 times area of urban core
- Assume population approximately equal
to population in urban core
- Assume radius of narrowband cells to be
about 3 times radius (10 times area) of cells in
urban core
Urban core
- Assume area in 500 to 1 500 km2 range
- Assume population in 2 to 8 million range
- Assume radius of narrowband cells to be
in 4 to 5 km range
Frequency reuse
- NB: little frequency reuse between urban core
and surrounding suburbs due to reuse factor (21)
- WB: smaller radius cells and lower reuse factor (12)
- Allows reuse within the suburban ring and some
reuse between urban core and suburban ring
FIGURE 1
Metropolitan Area
(Urban core and adjacent suburbs)
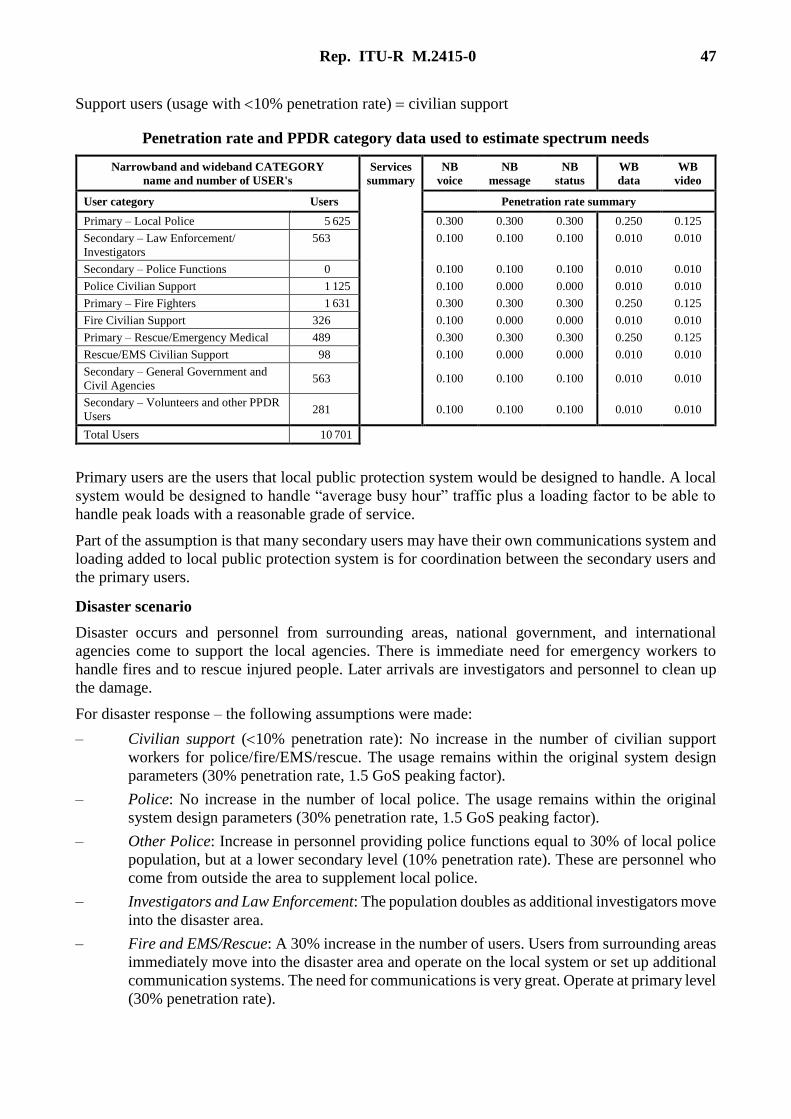
Rep. ITU-R M.2415-0 47
Support users (usage with 10% penetration rate) civilian support
Penetration rate and PPDR category data used to estimate spectrum needs
Narrowband and wideband CATEGORY
name and number of USER's
Services
summary
NB
voice
NB
message
NB
status
WB
data
WB
video
User category Users Penetration rate summary
Primary – Local Police 5 625 0.300 0.300 0.300 0.250 0.125
Secondary – Law Enforcement/
Investigators
563 0.100 0.100 0.100 0.010 0.010
Secondary – Police Functions 0 0.100 0.100 0.100 0.010 0.010
Police Civilian Support 1 125 0.100 0.000 0.000 0.010 0.010
Primary – Fire Fighters 1 631 0.300 0.300 0.300 0.250 0.125
Fire Civilian Support 326 0.100 0.000 0.000 0.010 0.010
Primary – Rescue/Emergency Medical 489 0.300 0.300 0.300 0.250 0.125
Rescue/EMS Civilian Support 98 0.100 0.000 0.000 0.010 0.010
Secondary – General Government and
Civil Agencies 563
0.100 0.100 0.100 0.010 0.010
Secondary – Volunteers and other PPDR
Users 281
0.100 0.100 0.100 0.010 0.010
Total Users 10 701
Primary users are the users that local public protection system would be designed to handle. A local
system would be designed to handle “average busy hour” traffic plus a loading factor to be able to
handle peak loads with a reasonable grade of service.
Part of the assumption is that many secondary users may have their own communications system and
loading added to local public protection system is for coordination between the secondary users and
the primary users.
Disaster scenario
Disaster occurs and personnel from surrounding areas, national government, and international
agencies come to support the local agencies. There is immediate need for emergency workers to
handle fires and to rescue injured people. Later arrivals are investigators and personnel to clean up
the damage.
For disaster response – the following assumptions were made:
– Civilian support (10% penetration rate): No increase in the number of civilian support
workers for police/fire/EMS/rescue. The usage remains within the original system design
parameters (30% penetration rate, 1.5 GoS peaking factor).
– Police: No increase in the number of local police. The usage remains within the original
system design parameters (30% penetration rate, 1.5 GoS peaking factor).
– Other Police: Increase in personnel providing police functions equal to 30% of local police
population, but at a lower secondary level (10% penetration rate). These are personnel who
come from outside the area to supplement local police.
– Investigators and Law Enforcement: The population doubles as additional investigators move
into the disaster area.
– Fire and EMS/Rescue: A 30% increase in the number of users. Users from surrounding areas
immediately move into the disaster area and operate on the local system or set up additional
communication systems. The need for communications is very great. Operate at primary level
(30% penetration rate).
48 Rep. ITU-R M.2415-0
– Secondary level users (10% penetration rate): Double the number of general government
users, volunteers, civil agency users, utility users, etc. who need to communicate with
primary users or need to use the local network for communications.
Where is the disaster?
Look at three disaster scenarios:
1 No disaster normal day-to-day operations
2 Disaster only in urban area
3 Disaster only in suburban area
3 Spectrum needs
Estimate spectrum needs for:
– Urban day-to-day
– Urban disaster
– Suburban day-to-day
– Suburban disaster
– Spectrum needs for the three disaster scenarios:
(Instead of worst case analysis)
Urban and suburban systems designed to handle “average busy hour” traffic loading plus a 1.5 GoS
factor to handle emergency loading by the normal PPDR users. Disaster operations assumes that
additional, outside PPDR personnel are added to the system.
a) Normal day-to-day operations:
The amount of spectrum needed for NB equals the sum of the urban and suburban spectrum need
estimations. The assumption is that spectrum used in the urban area cannot be reused in the adjacent
suburban area, due to large cell size and large reuse factor.
The amount of spectrum needed for WB equals the sum of the urban and half of the suburban
spectrum need estimation. The assumption is that spectrum used in the urban area can be reused in
the adjacent suburban area, due to the smaller cell size and smaller reuse factor. Also, because the
urban area sits in middle of the suburban area, there is some additional separation, which would allow
additional frequency reuse between suburban sites.
b) Urban disaster operations:
The amount of spectrum needed for NB equals the sum of the urban disaster and the suburban non-
disaster spectrum need estimation.
The amount of spectrum needed for WB equals the sum of the urban disaster and half of the suburban
non-disaster spectrum need estimation.
c) Suburban disaster operations:
The amount of spectrum needed for NB equals the sum of the urban non-disaster and the suburban
disaster spectrum need estimation.
The amount of spectrum needed for WB equals the sum of the urban non-disaster and half of the
suburban disaster spectrum need estimation.
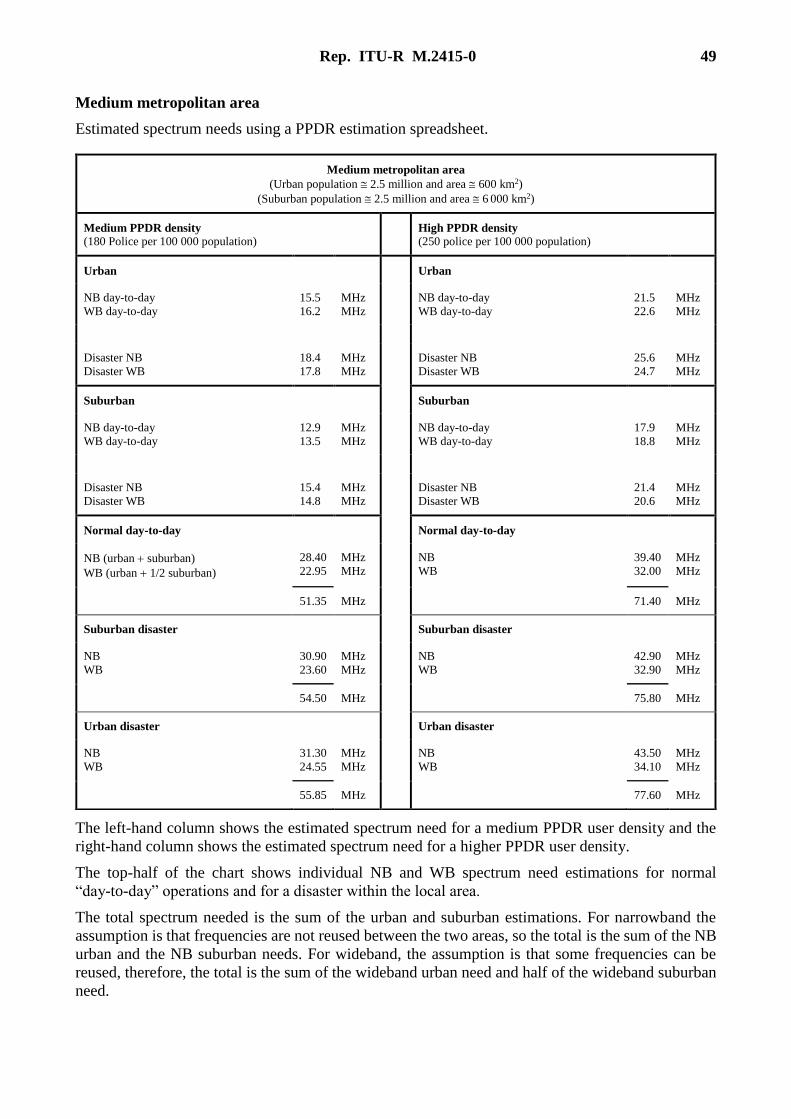
Rep. ITU-R M.2415-0 49
Medium metropolitan area
Estimated spectrum needs using a PPDR estimation spreadsheet.
The left-hand column shows the estimated spectrum need for a medium PPDR user density and the
right-hand column shows the estimated spectrum need for a higher PPDR user density.
The top-half of the chart shows individual NB and WB spectrum need estimations for normal
“day-to-day” operations and for a disaster within the local area.
The total spectrum needed is the sum of the urban and suburban estimations. For narrowband the
assumption is that frequencies are not reused between the two areas, so the total is the sum of the NB
urban and the NB suburban needs. For wideband, the assumption is that some frequencies can be
reused, therefore, the total is the sum of the wideband urban need and half of the wideband suburban
need.
Medium metropolitan area
(Urban population 2.5 million and area 600 km2)
(Suburban population 2.5 million and area 6 000 km2)
Medium PPDR density
(180 Police per 100 000 population) High PPDR density
(250 police per 100 000 population)
Urban Urban
NB day-to-day
WB day-to-day
15.5
16.2
MHz
MHz
NB day-to-day
WB day-to-day
21.5
22.6
MHz
MHz
Disaster NB
Disaster WB
18.4
17.8
MHz
MHz
Disaster NB
Disaster WB
25.6
24.7
MHz
MHz
Suburban Suburban
NB day-to-day
WB day-to-day
12.9
13.5
MHz
MHz
NB day-to-day
WB day-to-day
17.9
18.8
MHz
MHz
Disaster NB
Disaster WB
15.4
14.8
MHz
MHz
Disaster NB
Disaster WB
21.4
20.6
MHz
MHz
Normal day-to-day Normal day-to-day
NB (urban suburban)
WB (urban 1/2 suburban)
28.40
22.95
MHz
MHz
NB
WB
39.40
32.00
MHz
MHz
51.35 MHz 71.40 MHz
Suburban disaster Suburban disaster
NB
WB
30.90
23.60
MHz
MHz
NB
WB
42.90
32.90
MHz
MHz
54.50 MHz 75.80 MHz
Urban disaster Urban disaster
NB
WB
31.30
24.55
MHz
MHz
NB
WB
43.50
34.10
MHz
MHz
55.85 MHz 77.60 MHz
50 Rep. ITU-R M.2415-0
The bottom half of the chart shows the spectrum need estimated for a disaster in either the urban area
or the suburban area, where there is a significant increase in the number of users (up to 30% for
primary users).
Normal day-to-day operations for this generic medium size city need from 51 MHz to 71 MHz
depending on whether it is located in a country with a medium PPDR density or a high PPDR density.
If a disaster scenario described above occurs in the suburban area, then the NB/WB spectrum need
increases by about 6%. If a disaster occurs in the urban area, then NB/WB spectrum need increases
by about 9%.
Disaster operations for this generic medium size city need from 55 MHz to 78 MHz depending on
where the disaster occurs and whether it is located in a country with a medium PPDR density or a
high PPDR density.
The broadband spectrum need has to be added. Since broadband will cover very small radius “hot
spots”, the broadband frequencies can be reused throughout the urban and suburban area. ITU-R
contributions from the 2000-2003 study period have shown broadband spectrum needs to be in the
50-75 MHz range.
Therefore, for a generic medium size city, the total spectrum need is in the range of 105 to 153 MHz
to handle the type of disaster scenario described above.

Rep. ITU-R M.2415-0 51
The following two tables show the breakout of PPDR users and narrowband and wideband
services in a medium-sized metropolitan area. Medium metropolitan area estimated for
180 police officers per 100 000 population
Spectrum Needs – Generic City Estimation Re-Formatted July 2002
Metropolitan Study Area Medium Metropolitan Area Input Data
Population of Urban Area 2 500 000 People
1.0
Ratio Suburban/Urban Population
Population of Surrounding Suburban
Area 2 500 000 People Ratio should be near 1.0 (Range of 0.5 to 1.5 of Urban Population)
Area of Urban Center 600 km2 10.0
Ratio Suburban/Urban Area
Area of Surrounding Suburbs 6 000 km2 Ratio should be near 10.0 (Range of 5 to 15 of Urban Area)
Urban Population Density 4 167 People/km2
Suburban Population Density 417 People/km2
“Large” or “Medium” City MED If Urban Population Density > 5 000 people/km2, then this is a large city, OR if Urban population > 3 000 000 people, then this is a large city, otherwise this is a medium city
Police User Density (national average)
180.0 Police per 100 000 population
CATEGORY name and
number of USERS User Category
Urban Day-to-Day Urban Disaster Suburban Day-to-Day Suburban Disaster
Population Population Population Population
Primary – Local Police 6 750 6 750 5 625 5 625
Secondary – Law
Enforcement/Investigators 675 1 350 563 1 125
Secondary – Police Functions 0 2 025 0 1 688
Police Civilian Support 1 350 1 350 1 125 1 125
Primary – Fire Fighters 1 958 2 545 1 631 2 121
Fire Civilian Support 392 392 326 326
Primary – Rescue/ Emergency Medical
587 763 489 636
Rescue/EMS Civilian
Support 117 117 98 98
Secondary – General Govern-
ment and Civil Agencies 675 1 350 563 1 125
Secondary – Volunteers and Other PPDR Users
338 675 281 563
Total 12 841 17 317 10 701 14 431
Narrowband
Urban Day-to-Day Urban Disaster Suburban Day-to-Day Suburban Disaster
Busy Hour
Users
Spectrum
Need (MHz)
Busy Hour
Users
Spectrum
Need (MHz)
Busy Hour
Users
Spectrum
Need (MHz)
Busy Hour
Users
Spectrum
Need (MHz)
NB Voice Service 3 143 13.8 3 743 16.4 2 619 11.5 3 119 13.7
NB Message Service 2 957 1.6 3 557 1.9 2 464 1.3 2 965 1.6
NB Status Service 2 957 0.1 3 557 0.1 2 464 0.1 2 965 0.1
Total Narrowband Spectrum Need (MHz)
15.5 18.4 12.9 15.4
Normal NB Day-to-Day 28.4 MHz 15.5 < < < 12.9
NB Urban Disaster Scenario 31.3 MHz < < 18.4 < 12.9
NB Suburban Disaster Scenario 30.9 MHz
15.5 < < < < < 15.4
Larger of the two NB
Disaster Scenarios 31.3 MHz

52 Rep. ITU-R M.2415-0
Medium metropolitan area estimated for 180 police officers per 100 000 population (end)
Wideband
Urban Day-to-Day Urban Disaster Suburban Day-to-Day Suburban Disaster
Busy Hour
Users
Spectrum
Need (MHz)
Busy Hour
Users
Spectrum
Need (MHz)
Busy Hour
Users
Spectrum
Need (MHz)
Busy Hour
Users
Spectrum
Need (MHz)
WB Data Service 2 359 15.7 2 587 17.2 1 966 13.1 2 156 14.3
WB Video Service 1 197 0.5 1 330 0.6 998 0.4 1 108 0.5
Total Wideband Spectrum Need (MHz)
16.2 17.8 13.5 14.8
× 1/2 × 1/2
Normal WB Day-to-Day 23.0 MHz 16.2 < < < 6.8
Urban WB Disaster Scenario 24.6 MHz < < 17.8 < 6.8
Suburban WB Disaster Scenario 23.6 MHz 16.2 < < < < < 7.4
Larger of the two WB Disaster Scenarios 24.6 MHz
Spectrum Need Totals NB WB Sum
Normal Day-to-Day 28.4 + 23.0 = 51.4 MHz
Suburban Disaster Scenario 30.9 + 23.6 = 54.5 MHz
Urban Disaster Scenario 31.3 + 24.6 = 55.9 MHz
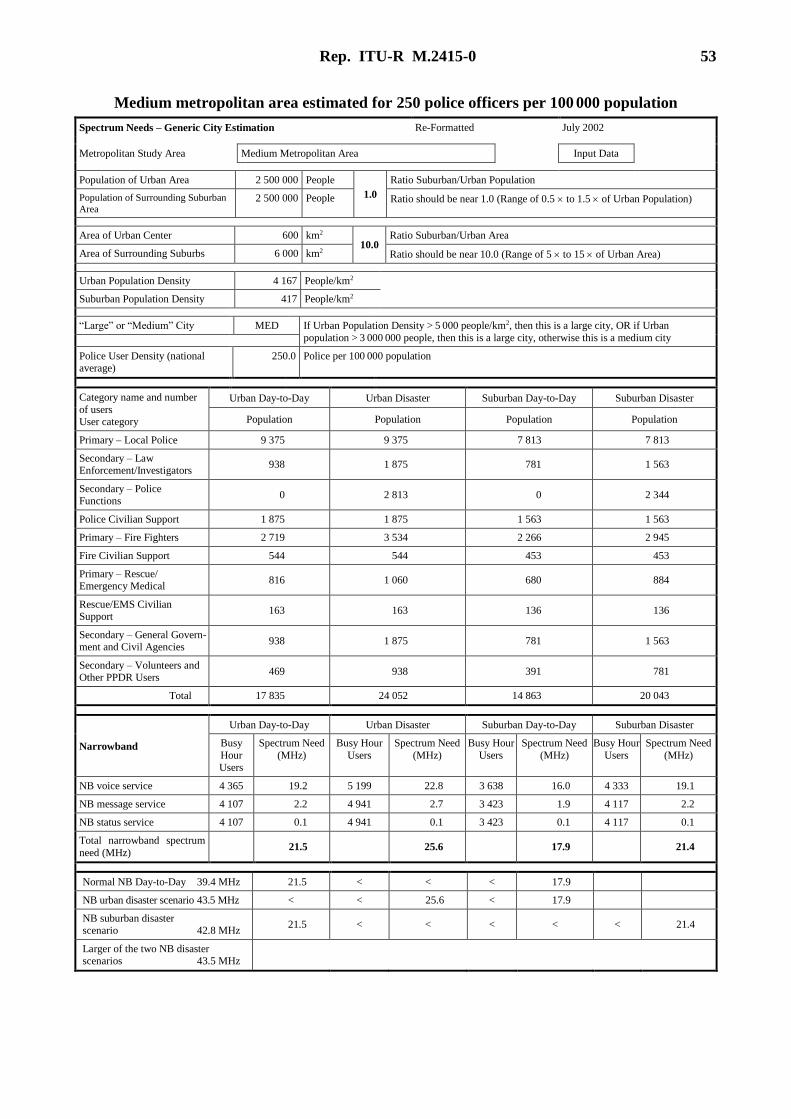
Rep. ITU-R M.2415-0 53
Medium metropolitan area estimated for 250 police officers per 100 000 population
Spectrum Needs – Generic City Estimation Re-Formatted July 2002
Metropolitan Study Area Medium Metropolitan Area Input Data
Population of Urban Area 2 500 000 People
1.0
Ratio Suburban/Urban Population
Population of Surrounding Suburban
Area 2 500 000 People Ratio should be near 1.0 (Range of 0.5 to 1.5 of Urban Population)
Area of Urban Center 600 km2 10.0
Ratio Suburban/Urban Area
Area of Surrounding Suburbs 6 000 km2 Ratio should be near 10.0 (Range of 5 to 15 of Urban Area)
Urban Population Density 4 167 People/km2
Suburban Population Density 417 People/km2
“Large” or “Medium” City MED If Urban Population Density > 5 000 people/km2, then this is a large city, OR if Urban
population > 3 000 000 people, then this is a large city, otherwise this is a medium city
Police User Density (national average)
250.0 Police per 100 000 population
Category name and number
of users User category
Urban Day-to-Day Urban Disaster Suburban Day-to-Day Suburban Disaster
Population Population Population Population
Primary – Local Police 9 375 9 375 7 813 7 813
Secondary – Law Enforcement/Investigators
938 1 875 781 1 563
Secondary – Police Functions
0 2 813 0 2 344
Police Civilian Support 1 875 1 875 1 563 1 563
Primary – Fire Fighters 2 719 3 534 2 266 2 945
Fire Civilian Support 544 544 453 453
Primary – Rescue/ Emergency Medical
816 1 060 680 884
Rescue/EMS Civilian Support
163 163 136 136
Secondary – General Govern-ment and Civil Agencies
938 1 875 781 1 563
Secondary – Volunteers and Other PPDR Users
469 938 391 781
Total 17 835 24 052 14 863 20 043
Narrowband
Urban Day-to-Day Urban Disaster Suburban Day-to-Day Suburban Disaster
Busy
Hour
Users
Spectrum Need
(MHz)
Busy Hour
Users
Spectrum Need
(MHz)
Busy Hour
Users
Spectrum Need
(MHz)
Busy Hour
Users
Spectrum Need
(MHz)
NB voice service 4 365 19.2 5 199 22.8 3 638 16.0 4 333 19.1
NB message service 4 107 2.2 4 941 2.7 3 423 1.9 4 117 2.2
NB status service 4 107 0.1 4 941 0.1 3 423 0.1 4 117 0.1
Total narrowband spectrum
need (MHz)
21.5 25.6 17.9 21.4
Normal NB Day-to-Day 39.4 MHz 21.5 < < < 17.9
NB urban disaster scenario 43.5 MHz < < 25.6 < 17.9
NB suburban disaster scenario 42.8 MHz
21.5 < < < < < 21.4
Larger of the two NB disaster scenarios 43.5 MHz

54 Rep. ITU-R M.2415-0
Medium metropolitan area estimated for 250 police officers per 100 000 population (end)
Wideband
Urban Day-to-Day Urban Disaster Suburban Day-to-Day Suburban Disaster
Busy Hour
Users
Spectrum
Need (MHz)
Busy Hour
Users
Spectrum
Need (MHz)
Busy Hour
Users
Spectrum
Need (MHz)
Busy Hour
Users
Spectrum
Need (MHz)
WB Data Service 3 277 21.8 3 593 23.9 2 731 18.2 2 994 19.9
WB Video Service 1 663 0.7 1 847 0.8 1 386 0.6 1 539 0.7
Total Wideband Spectrum
Need (MHz) 22.5 24.7 18.8 20.6
× 1/2 × 1/2
Normal WB Day-to-Day 31.9 MHz 22.5 < < < 9.4
Urban WB Disaster Scenario 34.1 MHz < < 24.7 < 9.4
Suburban WB Disaster
Scenario 32.8 MHz 22.5 < < < < < 10.3
Larger of the two WB Disaster Scenarios 34.1 MHz
Spectrum Need Totals NB WB Sum
Normal Day-to-Day 39.4 + 31.9 = 71.3 MHz
Suburban Disaster Scenario 42.8 + 32.8 = 75.7 MHz
Urban Disaster Scenario 43.5 + 34.1 = 77.6 MHz

Rep. ITU-R M.2415-0 55
Large metropolitan area
Estimated spectrum needs using a PPDR estimation spreadsheet.
Large metropolitan area
(Urban population 8.0 million and area 800 km2)
(Suburban population 8.0 million and area 8 000 km2)
Medium PPDR density
(180 Police per 100 000 population)
High PPDR density (250 police per 100 000 population)
Urban Urban
NB day-to-day
WB day-to-day
23.7
24.9
MHz
MHz
NB day-to-day
WB day-to-day
33.0
34.6
MHz
MHz
Disaster NB
Disaster WB
28.3
27.4
MHz
MHz
Disaster NB
Disaster WB
39.3
38.0
MHz
MHz
Suburban Suburban
NB day-to-day
WB day-to-day
19.8
20.7
MHz
MHz
NB day-to-day
WB day-to-day
27.4
28.7
MHz
MHz
Disaster NB
Disaster WB
23.6
22.7
MHz
MHz
Disaster NB
Disaster WB
32.7
31.5
MHz
MHz
Normal day-to-day Normal day-to-day
NB (urban suburban)
WB (urban 1/2 suburban)
43.50
35.25
MHz
MHz
NB
WB
60.40
48.95
MHz
MHz
78.75 MHz 109.35 MHz
Suburban disaster Suburban disaster
NB
WB
47.30
36.25
MHz
MHz
NB
WB
65.70
50.35
MHz
MHz
83.55 MHz 116.05 MHz
Urban disaster Urban disaster
NB
WB
48.10
37.75
MHz
MHz
NB
WB
66.70
52.35
MHz
MHz
85.85 MHz 119.05 MHz
The left-hand column shows the estimated spectrum need for a medium PPDR user density and the
right-hand column shows the estimated spectrum need for higher PPDR user density.
The top-half of the chart shows individual NB and WB spectrum need estimations for normal
“day-to-day” operations and for a disaster within the local area.
The total spectrum need is the sum of the urban and suburban estimations. For narrowband the
assumption is that frequencies are not reused between the two areas, so the total is the sum of the NB
urban and the NB suburban needs. For wideband, the assumption is that some frequencies can be
reused, therefore, the total is the sum of the wideband urban need and half of the wideband suburban
need.
The bottom half of the chart shows the estimated spectrum need for a disaster in either the urban area
or the suburban area, where there is a significant increase in the number of users (up to 30% for
primary users).
56 Rep. ITU-R M.2415-0
Normal day-to-day operations for this generic large city need from 79 MHz to 109 MHz depending
on whether it is located in a country with a medium PPDR density or a high PPDR density.
If a disaster scenario described above occurs in the suburban area, then the NB/WB spectrum need
increases by about 6%. If disaster occurs in the urban area, then the NB/WB spectrum need increases
by about 9%.
Disaster operations for this generic large city need from 84 MHz to 119 MHz depending on where
the disaster occurs and whether it is located in a country with a medium PPDR density or a high
PPDR density.
The broadband spectrum need has to be added. Since broadband will cover very small radius “hot
spots”, the broadband frequencies can be reused throughout the urban and suburban area. ITU-R
contributions from the 2000-2003 study period have shown broadband spectrum needs to be in the
50-75 MHz range.
Therefore, for a generic large city, the total spectrum need is in the range of 134 to 194 MHz to handle
the type of disaster scenario described above.
The following two tables show the breakout of PPDR users and narrowband and wideband service in
a large-sized metropolitan area.
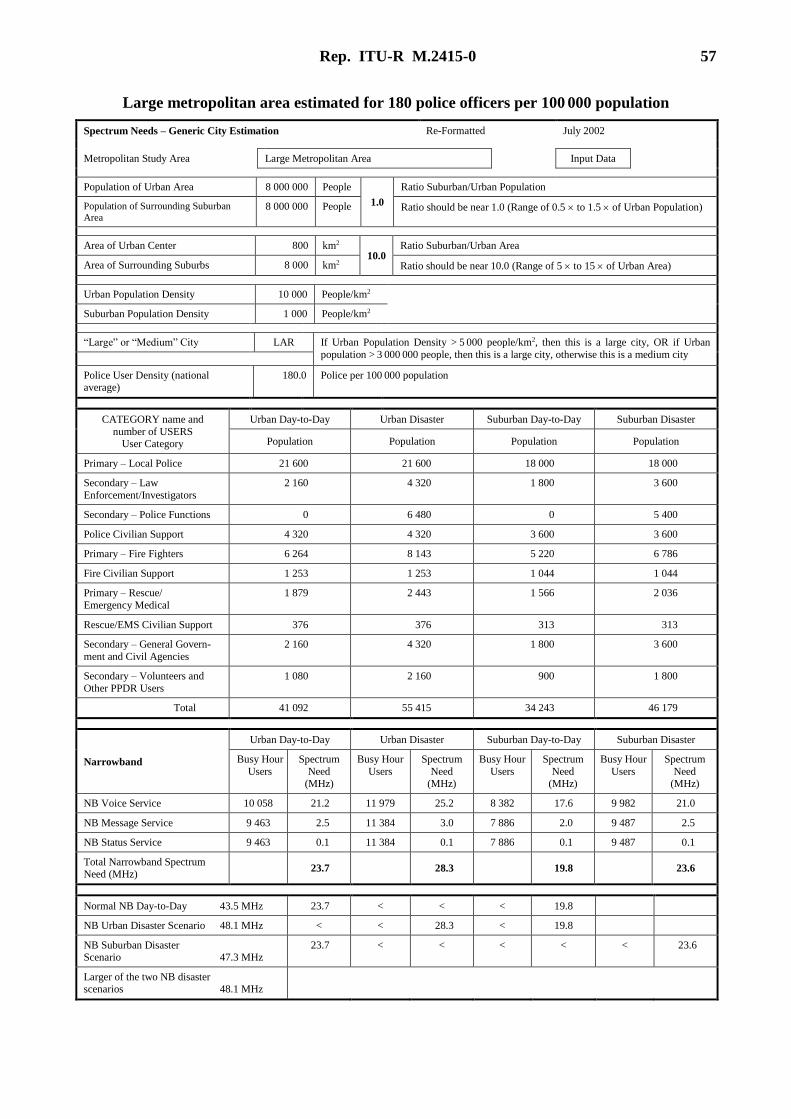
Rep. ITU-R M.2415-0 57
Large metropolitan area estimated for 180 police officers per 100 000 population
Spectrum Needs – Generic City Estimation Re-Formatted July 2002
Metropolitan Study Area Large Metropolitan Area Input Data
Population of Urban Area 8 000 000 People
1.0
Ratio Suburban/Urban Population
Population of Surrounding Suburban
Area 8 000 000 People Ratio should be near 1.0 (Range of 0.5 to 1.5 of Urban Population)
Area of Urban Center 800 km2 10.0
Ratio Suburban/Urban Area
Area of Surrounding Suburbs 8 000 km2 Ratio should be near 10.0 (Range of 5 to 15 of Urban Area)
Urban Population Density 10 000 People/km2
Suburban Population Density 1 000 People/km2
“Large” or “Medium” City LAR If Urban Population Density > 5 000 people/km2, then this is a large city, OR if Urban
population > 3 000 000 people, then this is a large city, otherwise this is a medium city
Police User Density (national average)
180.0 Police per 100 000 population
CATEGORY name and
number of USERS User Category
Urban Day-to-Day Urban Disaster Suburban Day-to-Day Suburban Disaster
Population Population Population Population
Primary – Local Police 21 600 21 600 18 000 18 000
Secondary – Law
Enforcement/Investigators
2 160 4 320 1 800 3 600
Secondary – Police Functions 0 6 480 0 5 400
Police Civilian Support 4 320 4 320 3 600 3 600
Primary – Fire Fighters 6 264 8 143 5 220 6 786
Fire Civilian Support 1 253 1 253 1 044 1 044
Primary – Rescue/
Emergency Medical
1 879 2 443 1 566 2 036
Rescue/EMS Civilian Support 376 376 313 313
Secondary – General Govern-
ment and Civil Agencies
2 160 4 320 1 800 3 600
Secondary – Volunteers and
Other PPDR Users
1 080 2 160 900 1 800
Total 41 092 55 415 34 243 46 179
Narrowband
Urban Day-to-Day Urban Disaster Suburban Day-to-Day Suburban Disaster
Busy Hour
Users
Spectrum
Need (MHz)
Busy Hour
Users
Spectrum
Need (MHz)
Busy Hour
Users
Spectrum
Need (MHz)
Busy Hour
Users
Spectrum
Need (MHz)
NB Voice Service 10 058 21.2 11 979 25.2 8 382 17.6 9 982 21.0
NB Message Service 9 463 2.5 11 384 3.0 7 886 2.0 9 487 2.5
NB Status Service 9 463 0.1 11 384 0.1 7 886 0.1 9 487 0.1
Total Narrowband Spectrum Need (MHz)
23.7 28.3 19.8 23.6
Normal NB Day-to-Day 43.5 MHz 23.7 < < < 19.8
NB Urban Disaster Scenario 48.1 MHz < < 28.3 < 19.8
NB Suburban Disaster Scenario 47.3 MHz
23.7 < < < < < 23.6
Larger of the two NB disaster scenarios 48.1 MHz

58 Rep. ITU-R M.2415-0
Large metropolitan area estimated for 180 police officers per 100 000 population (end)
Wideband
Urban Day-to-Day Urban Disaster Suburban Day-to-Day Suburban Disaster
Busy Hour
Users
Spectrum Need
(MHz)
Busy Hour
Users
Spectrum Need
(MHz)
Busy Hour
Users
Spectrum Need
(MHz)
Busy Hour
Users
Spectrum Need
(MHz)
WB Data Service 7 549 24.1 8 279 26.4 6 291 20.0 6 899 22.0
WB Video Service 3 831 0.8 4 256 0.9 3 193 0.7 3 546 0.8
Total Wideband Spectrum
Need (MHz) 24.9 27.4 20.7 22.7
× 1/2 × 1/2
Normal WB Day-to-Day 35.3 MHz 24.9 < < < 10.3
Urban WB Disaster Scenario 37.7 MHz < < 27.4 < 10.3
Suburban WB Disaster
Scenario 36.3 MHz 24.9 < < < < < 11.4
Larger of the two WB disaster
Scenarios 37.7 MHz
Spectrum Need Totals NB WB Sum
Normal Day-to-Day 43.5 + 35.3 = 78.8 MHz
Suburban Disaster Scenario 47.3 + 36.3 = 83.6 MHz
Urban Disaster Scenario 48.1 + 37.7 = 85.8 MHz

Rep. ITU-R M.2415-0 59
Large metropolitan area estimated for 250 police officers per 100 000 population
Spectrum Needs – Generic City Estimation Re-Formatted July 2002
Metropolitan Study Area Large Metropolitan Area Input Data
Population of Urban Area 8 000 000 People
1.0
Ratio Suburban/Urban Population
Population of Surrounding Suburban
Area 8 000 000 People Ratio should be near 1.0 (Range of 0.5 to 1.5 of Urban Population
Area of Urban Center 800 km2 10.0
Ratio Suburban/Urban Area
Area of Surrounding Suburbs 8 000 km2 Ratio should be near 10.0 (Range of 5 to 15 of Urban Area)
Urban Population Density 10 000 People/km2
Suburban Population Density 1 000 People/km2
“Large” or “Medium” City LAR If Urban Population Density > 5 000 people/km2, then this is a large city, OR if Urban population > 3 000 000 people, then this is a large city, otherwise this is a medium city
Police User Density (national average)
250.0 police per 100 000 population
CATEGORY name and
number of USERS User Category
Urban Day-to-Day Urban Disaster Suburban Day-to-Day Suburban Disaster
Population Population Population Population
Primary – Local Police 30 000 30 000 25 000 25 000
Secondary – Law Enforcement/Investigators
3 000 6 000 2 500 5 000
Secondary – Police Functions 0 9 000 0 7 500
Police Civilian Support 6 000 6 000 5 000 5 000
Primary – Fire Fighters 8 700 11 310 7 250 9 425
Fire Civilian Support 1 740 1 740 1 450 1 450
Primary – Rescue/ Emergency
Medical
2 610 3 393 2 175 2 828
Rescue/EMS Civilian Support 522 522 435 435
Secondary – General Govern-
ment and Civil Agencies
3 000 6 000 2 500 5 000
Secondary – Volunteers and
Other PPDR Users
1 500 3 000 1 250 2 500
Total 57 072 76 965 47 560 64 138
Narrowband
Urban Day-to-Day Urban Disaster Suburban Day-to-Day Suburban Disaster
Busy Hour Users
Spectrum Need (MHz)
Busy Hour Users
Spectrum Need (MHz)
Busy Hour Users
Spectrum Need (MHz)
Busy Hour Users
Spectrum Need (MHz)
NB Voice Service 13 969 29.4 16 637 35.1 11 641 24.5 13 864 29.2
NB Message Service 13 143 3.4 15 811 4.1 10 953 2.8 13 176 3.4
NB Status Service 13 143 0.1 15 811 0.2 10 953 0.1 13 176 0.1
Total Narrowband Spectrum Need (MHz)
33.0 39.3 27.4 32.7
Normal NB Day-to-Day 60.4 MHz 33.0 < < < 27.4
NB urban disaster scenario 66.8 MHz < < 39.3 < 27.4
NB suburban disaster scenario 65.7 MHz
33.0 < < < < < 32.7
Larger of the two NB disaster scenarios 66.8 MHz
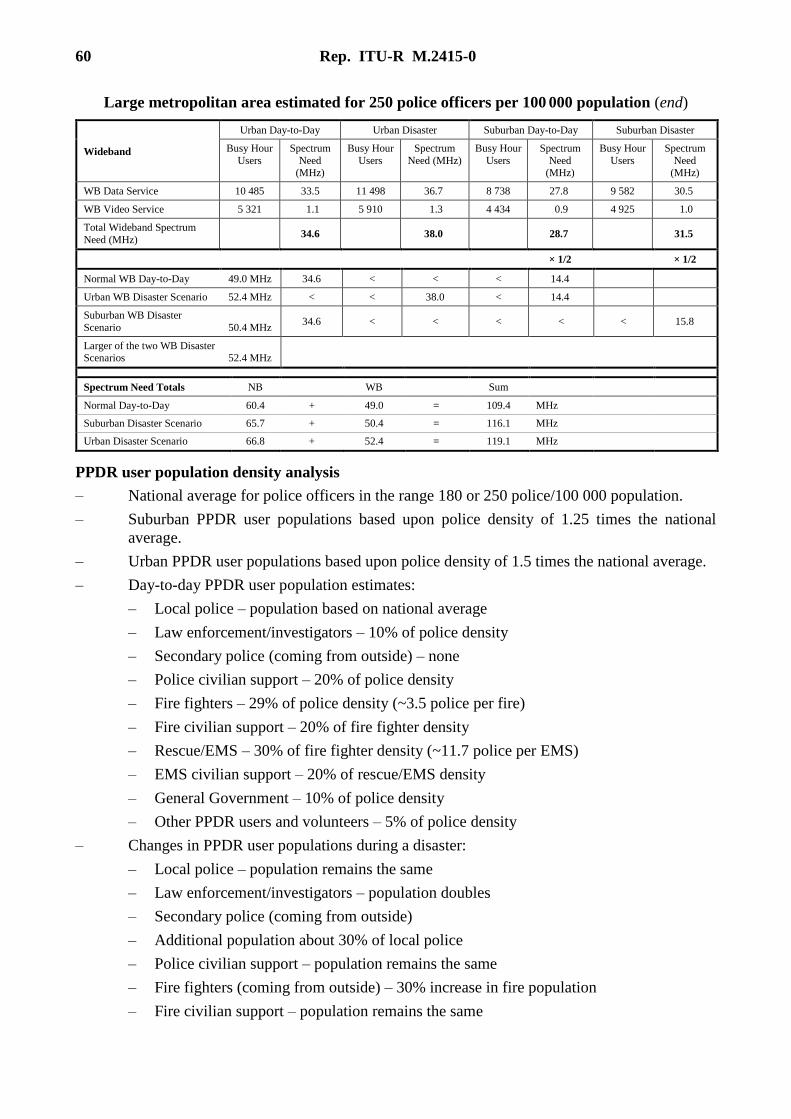
60 Rep. ITU-R M.2415-0
Large metropolitan area estimated for 250 police officers per 100 000 population (end)
Wideband
Urban Day-to-Day Urban Disaster Suburban Day-to-Day Suburban Disaster
Busy Hour
Users
Spectrum
Need (MHz)
Busy Hour
Users
Spectrum
Need (MHz)
Busy Hour
Users
Spectrum
Need (MHz)
Busy Hour
Users
Spectrum
Need (MHz)
WB Data Service 10 485 33.5 11 498 36.7 8 738 27.8 9 582 30.5
WB Video Service 5 321 1.1 5 910 1.3 4 434 0.9 4 925 1.0
Total Wideband Spectrum
Need (MHz)
34.6 38.0 28.7 31.5
× 1/2 × 1/2
Normal WB Day-to-Day 49.0 MHz 34.6 < < < 14.4
Urban WB Disaster Scenario 52.4 MHz < < 38.0 < 14.4
Suburban WB Disaster
Scenario 50.4 MHz 34.6 < < < < < 15.8
Larger of the two WB Disaster Scenarios 52.4 MHz
Spectrum Need Totals NB WB Sum
Normal Day-to-Day 60.4 + 49.0 = 109.4 MHz
Suburban Disaster Scenario 65.7 + 50.4 = 116.1 MHz
Urban Disaster Scenario 66.8 + 52.4 = 119.1 MHz
PPDR user population density analysis
– National average for police officers in the range 180 or 250 police/100 000 population.
– Suburban PPDR user populations based upon police density of 1.25 times the national
average.
– Urban PPDR user populations based upon police density of 1.5 times the national average.
– Day-to-day PPDR user population estimates:
– Local police – population based on national average
– Law enforcement/investigators – 10% of police density
– Secondary police (coming from outside) – none
– Police civilian support – 20% of police density
– Fire fighters – 29% of police density (~3.5 police per fire)
– Fire civilian support – 20% of fire fighter density
– Rescue/EMS – 30% of fire fighter density (~11.7 police per EMS)
– EMS civilian support – 20% of rescue/EMS density
– General Government – 10% of police density
– Other PPDR users and volunteers – 5% of police density
– Changes in PPDR user populations during a disaster:
– Local police – population remains the same
– Law enforcement/investigators – population doubles
– Secondary police (coming from outside)
– Additional population about 30% of local police
– Police civilian support – population remains the same
– Fire fighters (coming from outside) – 30% increase in fire population
– Fire civilian support – population remains the same
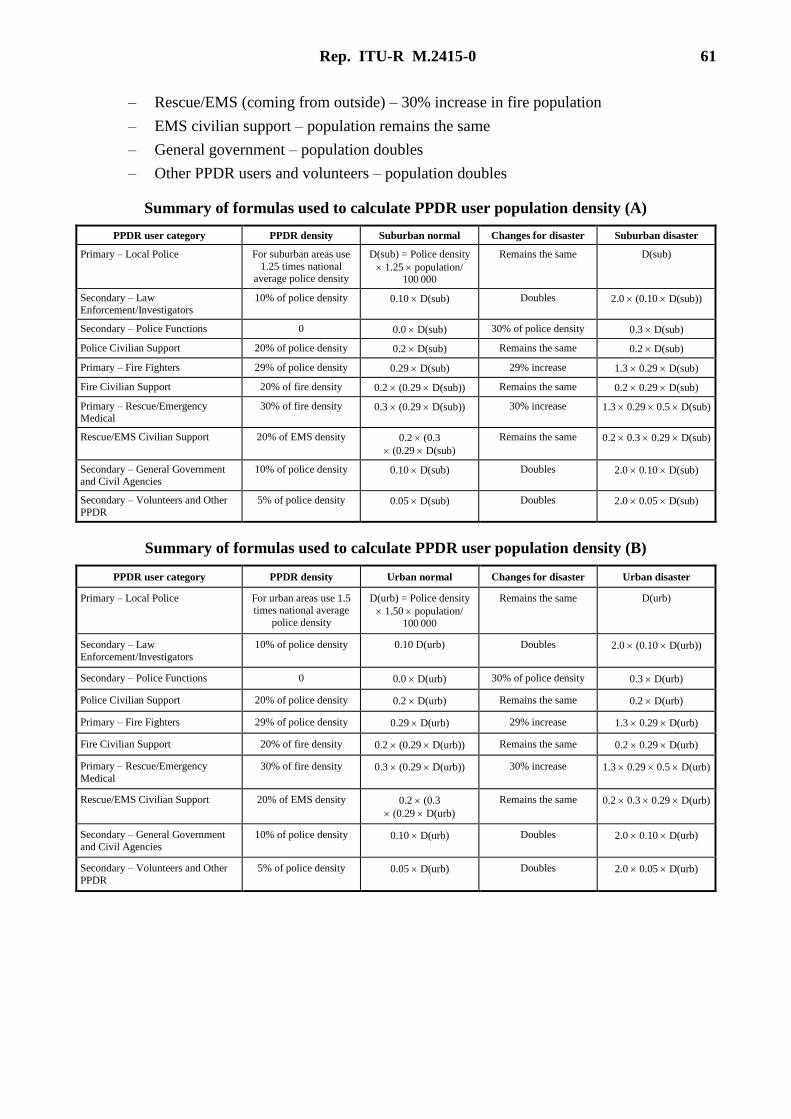
Rep. ITU-R M.2415-0 61
– Rescue/EMS (coming from outside) – 30% increase in fire population
– EMS civilian support – population remains the same
– General government – population doubles
– Other PPDR users and volunteers – population doubles
Summary of formulas used to calculate PPDR user population density (A)
PPDR user category PPDR density Suburban normal Changes for disaster Suburban disaster
Primary – Local Police For suburban areas use
1.25 times national average police density
D(sub) = Police density
1.25 population/ 100 000
Remains the same D(sub)
Secondary – Law Enforcement/Investigators
10% of police density 0.10 D(sub) Doubles 2.0 (0.10 D(sub))
Secondary – Police Functions 0 0.0 D(sub) 30% of police density 0.3 D(sub)
Police Civilian Support 20% of police density 0.2 D(sub) Remains the same 0.2 D(sub)
Primary – Fire Fighters 29% of police density 0.29 D(sub) 29% increase 1.3 0.29 D(sub)
Fire Civilian Support 20% of fire density 0.2 (0.29 D(sub)) Remains the same 0.2 0.29 D(sub)
Primary – Rescue/Emergency Medical
30% of fire density 0.3 (0.29 D(sub)) 30% increase 1.3 0.29 0.5 D(sub)
Rescue/EMS Civilian Support 20% of EMS density 0.2 (0.3
(0.29 D(sub)
Remains the same 0.2 0.3 0.29 D(sub)
Secondary – General Government and Civil Agencies
10% of police density 0.10 D(sub) Doubles 2.0 0.10 D(sub)
Secondary – Volunteers and Other PPDR
5% of police density 0.05 D(sub) Doubles 2.0 0.05 D(sub)
Summary of formulas used to calculate PPDR user population density (B)
PPDR user category PPDR density Urban normal Changes for disaster Urban disaster
Primary – Local Police For urban areas use 1.5 times national average
police density
D(urb) = Police density
1.50 population/
100 000
Remains the same D(urb)
Secondary – Law
Enforcement/Investigators
10% of police density 0.10 D(urb) Doubles 2.0 (0.10 D(urb))
Secondary – Police Functions 0 0.0 D(urb) 30% of police density 0.3 D(urb)
Police Civilian Support 20% of police density 0.2 D(urb) Remains the same 0.2 D(urb)
Primary – Fire Fighters 29% of police density 0.29 D(urb) 29% increase 1.3 0.29 D(urb)
Fire Civilian Support 20% of fire density 0.2 (0.29 D(urb)) Remains the same 0.2 0.29 D(urb)
Primary – Rescue/Emergency
Medical 30% of fire density 0.3 (0.29 D(urb)) 30% increase 1.3 0.29 0.5 D(urb)
Rescue/EMS Civilian Support 20% of EMS density 0.2 (0.3
(0.29 D(urb)
Remains the same 0.2 0.3 0.29 D(urb)
Secondary – General Government
and Civil Agencies 10% of police density 0.10 D(urb) Doubles 2.0 0.10 D(urb)
Secondary – Volunteers and Other
PPDR
5% of police density 0.05 D(urb) Doubles 2.0 0.05 D(urb)

62 Rep. ITU-R M.2415-0
Example parameters
Narrowband – medium city – suburban – medium PPDR density
Population 2 500 000 people
Area 6 000 km2
Police Density Suburban U(sub) 1.25 180 × 2 500 000/100 000 5 625 police
Cell radius 14.4 km
Cell antenna pattern Omni
Reuse factor 21
GoS factor 1.5
Width of frequency band 24 MHz
Channel bandwidth 12.5 kHz
% of band not used for traffic 10%
Narrowband – medium city – urban – medium PPDR density
Population 2 500 000 people
Area 600 km2
Police density suburban U(urb) 1.5 180 2 500 000/100 000 6 750 police
Cell radius 5.0 km
Cell antenna pattern Hex
Reuse factor 21
GoS factor 1.5
Width of frequency band 24 MHz
Channel bandwidth 12.5 kHz
% of band not used for traffic 10%
Wideband – medium city – suburban – medium PPDR density
Population 2 500 000 people
Area 6 000 km2
Police density suburban U(sub) 1.25 180 2 500 000/100 000 5 625 police
Cell radius 9.2 km
Cell antenna pattern Omni
Reuse factor 12
GoS factor 1.5
Width of frequency band 24 MHz
Channel bandwidth 150 kHz
% of band not used for traffic 10%
Wideband – medium city – urban – medium PPDR density
Population 2 500 000 people
Area 600 km2
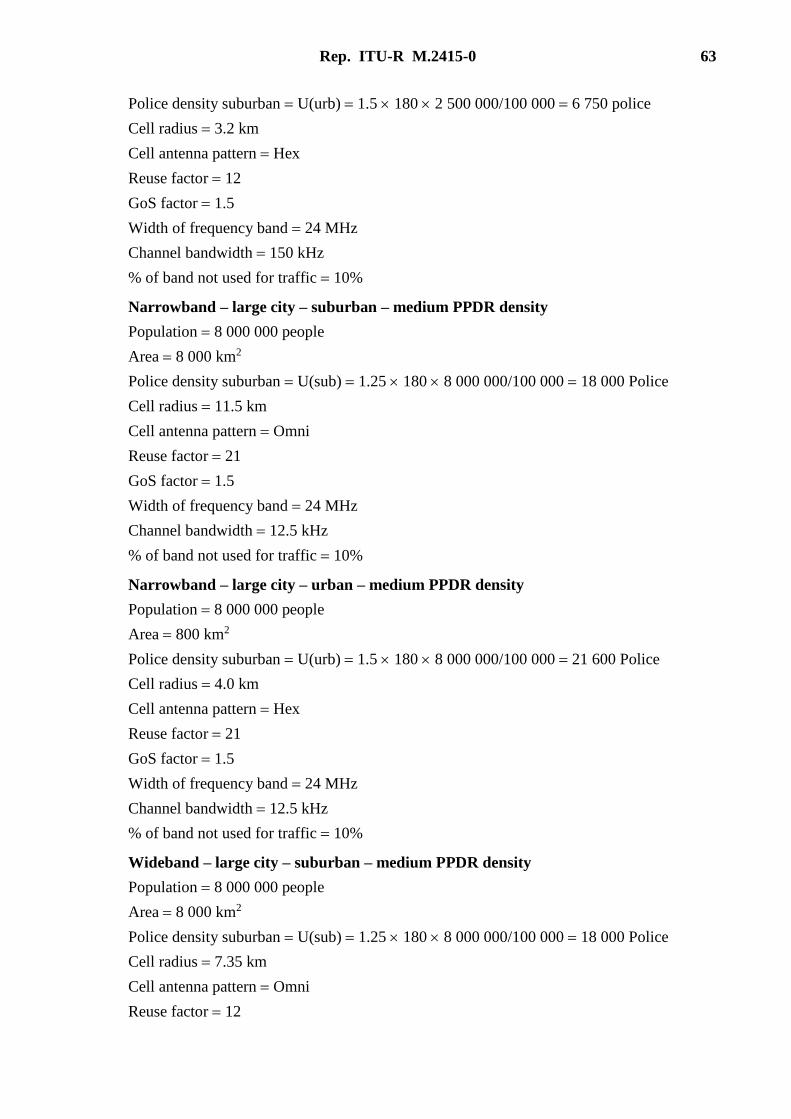
Rep. ITU-R M.2415-0 63
Police density suburban U(urb) 1.5 180 2 500 000/100 000 6 750 police
Cell radius 3.2 km
Cell antenna pattern Hex
Reuse factor 12
GoS factor 1.5
Width of frequency band 24 MHz
Channel bandwidth 150 kHz
% of band not used for traffic 10%
Narrowband – large city – suburban – medium PPDR density
Population 8 000 000 people
Area 8 000 km2
Police density suburban U(sub) 1.25 180 8 000 000/100 000 18 000 Police
Cell radius 11.5 km
Cell antenna pattern Omni
Reuse factor 21
GoS factor 1.5
Width of frequency band 24 MHz
Channel bandwidth 12.5 kHz
% of band not used for traffic 10%
Narrowband – large city – urban – medium PPDR density
Population 8 000 000 people
Area 800 km2
Police density suburban U(urb) 1.5 180 8 000 000/100 000 21 600 Police
Cell radius 4.0 km
Cell antenna pattern Hex
Reuse factor 21
GoS factor 1.5
Width of frequency band 24 MHz
Channel bandwidth 12.5 kHz
% of band not used for traffic 10%
Wideband – large city – suburban – medium PPDR density
Population 8 000 000 people
Area 8 000 km2
Police density suburban U(sub) 1.25 180 8 000 000/100 000 18 000 Police
Cell radius 7.35 km
Cell antenna pattern Omni
Reuse factor 12
64 Rep. ITU-R M.2415-0
GoS factor 1.5
Width of frequency band 24 MHz
Channel bandwidth 150 kHz
% of band not used for traffic 10%
Wideband – large city – urban – medium PPDR density
Population 8 000 000 people
Area 800 km2
Police density suburban U(urb) 1.5 180 2 500 000/100 000 21 600 Police
Cell radius 2.56 km
Cell antenna pattern Hex
Reuse factor 12
GoS factor 1.5
Width of frequency band 24 MHz
Channel bandwidth 150 kHz
% of band not used for traffic 10%
Annex 2
Annexes on Broadband PPDR Spectrum Needs and Scenarios
Studies performed by several member states and sector members on the needed spectrum for
Broadband PPDR are presented in Annex 2. The following table summarizes the studies’ results:
Annex Source
Bandwidth needs
(MHz) Comments
Uplink Downlink
2A CEPT 10 10 Data only. Based on ECC Report 199
Conclusions
2B UAE 16.9 12.5 Two incidents data.
2C Motorola
Solutions > 20 20 Level 3 incident (FDD)
2D Israel 20 20
2E China 30-40 TD-LTE, depends on different scenarios
2F Korea 10 10
2G Telstra Monte Carlo simulation of throughput
2H Tunisia 10 10
Based on broadband spectrum
requirements. Narrowband spectrum
requirements have not been considered in
the study as they were already available
for PPDR use.
Rep. ITU-R M.2415-0 65
Annex 2A
Methodology for the estimation of broadband PPDR
spectrum needs within CEPT14
The frequency ranges used for estimating the necessary spectrum bandwidth are the 400 MHz and
700 MHz ranges. It is assumed that a wide area network would be deployed below 1 GHz in order to
reduce the number of necessary cell sites.
A brief description of the methodology used for estimation of spectrum needs is presented below.
This methodology can be considered as an incident based approach where traffic is summed over
several separate incidents and background traffic is then added in order to define the total spectrum
needs.
2A.1 Methodology for PP1
The methodology used for PP1 scenarios consists of the following 5 steps:
Step 1: Definition of the incidents (scenarios).
Step 2: Estimate the total traffic requirement per incident including background traffic.
Step 3: Calculate the link budgets and cell size.
Step 4: Estimate the number of incidents that should be taken into account simultaneously per cell.
Step 5: Estimate the total spectrum need based on assumptions on number of incidents per cell,
location of incidents within a cell and spectrum efficiency per incident.
2A.2 Methodology for PP2
The methodology used for PP2 scenarios consists of the following 3 steps:
Step 1: Definition of the PP2 scenarios.
Step 2: Estimate of the PP2 scenarios traffic.
Step 3: Estimate the total spectrum need based on assumptions on location of users within the cell
and spectral efficiency.
14 See ECC Report 199 for more details on methodology used in CEPT.

66 Rep. ITU-R M.2415-0
Annex 2B
Spectrum needs for BB PPDR Based on LTE
in the United Arab Emirates
2B.1 Background
After the WRC-12 Resolution 648, the UAE TRA initiated and hosted a national dialog through the
creation of a National PPDR Committee with representatives from all public safety and disaster relief
agencies.
The Committee held regular meetings to create a better understanding of the evolution of
technologies, technical and spectrum needs for broadband services and applications.
The UAE TRA has met with PPDR industry on several occasions to better understand industry trends
and to ensure that what is being proposed for the UAE and the region is consistent with our national
interest.
In addition, the TRA has commissioned a specialized consulting company to study, model and
estimate the spectrum needs for BB PPDR in the UAE.
2B.2 Methodology
The study is addressing the methodology used to assess and estimate minimum spectrum needs were
derived from the works that were done by CEPT under FM49 particularly Report 199 and FM49
LEWP Matrix. The flowchart below explains the basic methodology that was followed. Input was
sought from all members of the National PPDR Committee. Number of PPDR users, user
requirements for services, applications, coverage, and availability were inputted. Additional data
based on technology adopted (LTE/LTE-Advanced), number of existing towers and sites used for the
TETRA LMR, and spectrum options from UHF sub 1 GHz to 3.6 GHz.
FIGURE 2B-1

Rep. ITU-R M.2415-0 67
In order to model the number of PPDR users per cell site, a study was based on propagation model
assumptions for LTE, a list of frequency bands to be considered, clutter data for UAE, and link budget
parameters and certain distribution factor for PPDR users.
The total number of users was calculated based on input collected from PPDR representatives to the
Committee with additional growth margin. The number used in the model for UAE was based on
98192 PPDR users.
FIGURE 2B-2
Highlights of PPDR spectrum needs results for UAE
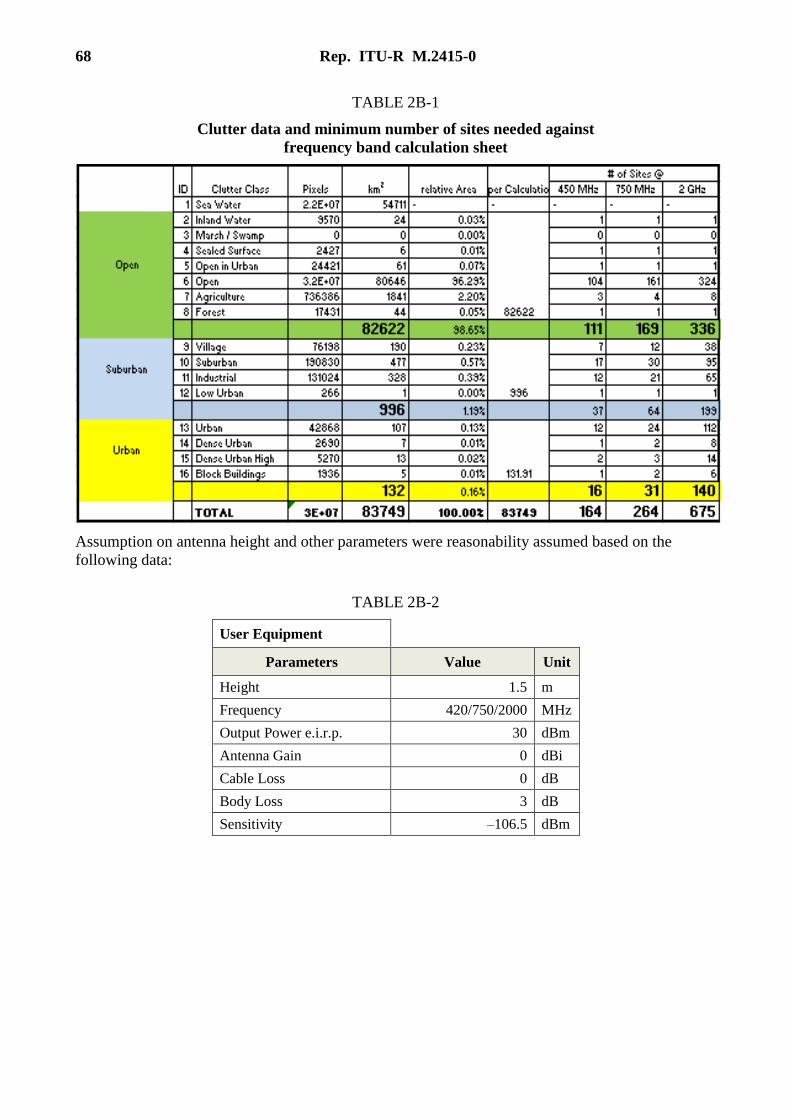
68 Rep. ITU-R M.2415-0
TABLE 2B-1
Clutter data and minimum number of sites needed against
frequency band calculation sheet
Assumption on antenna height and other parameters were reasonability assumed based on the
following data:
TABLE 2B-2
User Equipment
Parameters Value Unit
Height 1.5 m
Frequency 420/750/2000 MHz
Output Power e.i.r.p. 30 dBm
Antenna Gain 0 dBi
Cable Loss 0 dB
Body Loss 3 dB
Sensitivity –106.5 dBm
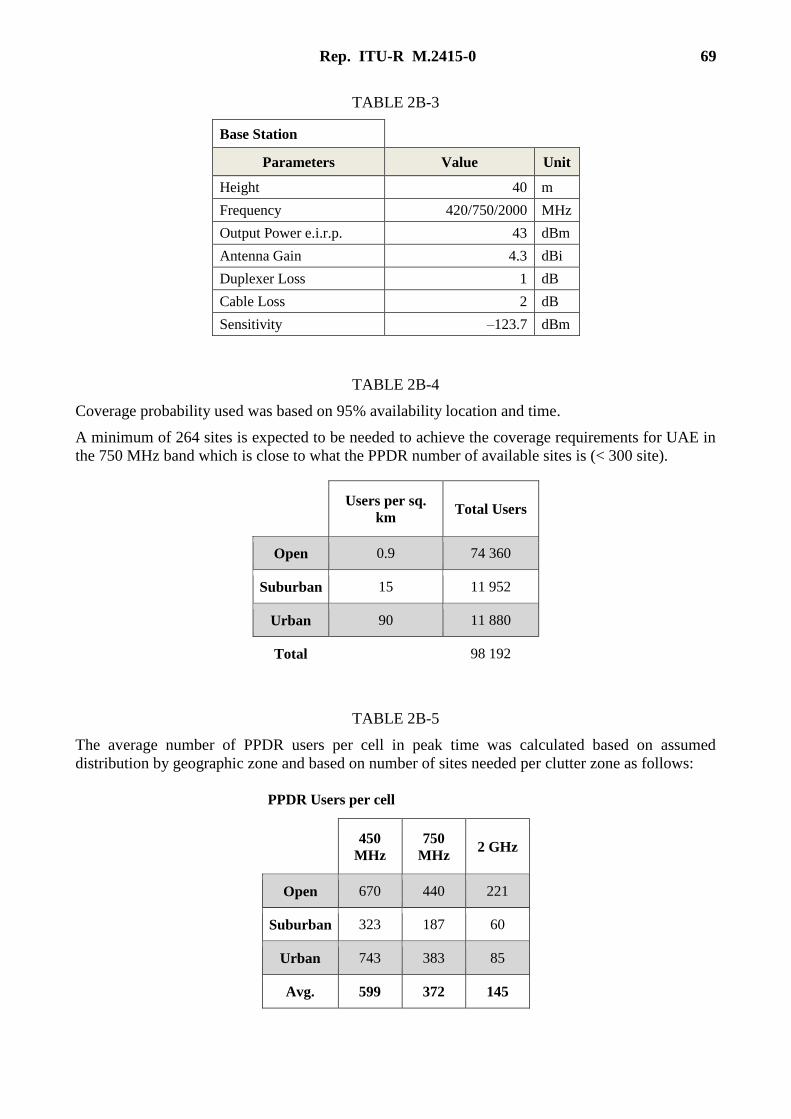
Rep. ITU-R M.2415-0 69
TABLE 2B-3
Base Station
Parameters Value Unit
Height 40 m
Frequency 420/750/2000 MHz
Output Power e.i.r.p. 43 dBm
Antenna Gain 4.3 dBi
Duplexer Loss 1 dB
Cable Loss 2 dB
Sensitivity –123.7 dBm
TABLE 2B-4
Coverage probability used was based on 95% availability location and time.
A minimum of 264 sites is expected to be needed to achieve the coverage requirements for UAE in
the 750 MHz band which is close to what the PPDR number of available sites is (< 300 site).
Users per sq.
km Total Users
Open 0.9 74 360
Suburban 15 11 952
Urban 90 11 880
Total 98 192
TABLE 2B-5
The average number of PPDR users per cell in peak time was calculated based on assumed
distribution by geographic zone and based on number of sites needed per clutter zone as follows:
PPDR Users per cell
450
MHz
750
MHz 2 GHz
Open 670 440 221
Suburban 323 187 60
Urban 743 383 85
Avg. 599 372 145

70 Rep. ITU-R M.2415-0
The number of 372 PPDR Users per cell in peak time was used to estimate spectrum needs for
different scenarios of BB-PPDR use.
2B.3 Summary of the spectrum need estimation – Results
– Normal peak busy hours (day-to-day operations) needs 3.9 MHz
– 1 incident needs 6.3 MHz
– 2 incident needs 16.9 MHz
TABLE 2B-6
Annex 2C
Throughput needs of broadband PPDR scenarios
Mobile Broad Band technology aiming at wide area coverage constitute an evolution from Narrow
Band technology currently applied for mission critical PPDR voice communications in all ITU-R
Regions.
A Mobile Broad Band application for the PPDR such as transmission of high resolution images and
video requires much higher basic bit-rates than current PPDR technology can deliver.
It should be noted that the new demands for several simultaneous multimedia capabilities (several
simultaneous applications running in parallel) over a mobile system presents a huge demand on

Rep. ITU-R M.2415-0 71
throughput and high speed data capabilities while the system at the same time shall provide very high
peak data rates.
Such demand is particularly challenging when deployed in a localized areas with intensive scene-of-
incident requirements where PPDR responders are operating under often very difficult conditions.
For example a 700 MHz LTE PPDR base station deployed to support Broad Band applications in
urban environments could typically be tailored to servicing a localized area in the order of 1 km2 or
even less offering access to voice, high-speed data, high quality digital real time video and multimedia
services, at indicative continuous data rates in the downlink direction in the range of 1-10 – 100-
150 Mbit/s per sector, with a total capacity of 300-450 Mbit/s over the area of 1 km2, with channel
bandwidths determined by the particular deployment of the system. Examples of possible applications
include:
– high-resolution video communications from portable terminals such as during traffic stops;
– video surveillance of security entry points such as airports with automatic detection based on
reference images, hazardous material or other relevant parameters;
– remote monitoring of patients and remote real time video view of the single patient
demanding the order of up to 1 Mbit/s. The demand for capacity can easily be envisioned
during the rescue operation following a major disaster. This may equate to a net hot spot
capacity of over 100 Mbit/s close to a broadband PPDR base station.
Mobile Broad Band systems may have inherent noise and interference trade-offs with data rates and
associated coverage. Depending on the technology and the deployed configuration, a single
broadband network base station may have different coverage areas in the range of a few hundred
metres up to hundred kilometres, offering a wide range in spectrum reuse capability.
Collectively, the high peak data rates, extended coverage and data speeds plus localized coverage
area open up numerous new possibilities for BB PPDR applications including tailored area networks
as described.
A spectrum throughput and bandwidth estimation tool has been developed based on the requirements
of some Public Safety agencies. This estimation tool is based on a set of PPDR applications which is
based on their current operational experience and their vision of future working practices. The
estimation tool allows the user to model up to two incident scenes of small, medium, large or very
large emergencies. The first incident scene is assumed to take place near the cell edge, and the second
incident scene is assumed to be uniformly distributed somewhere in the cell (at a median
location/area).
The estimation tool utilizes a blended spectral efficiency model (with a total of 9 spectral efficiency
values dependent on the deployment scenario), where background data traffic is modelled with
average spectral efficiencies, and the incident scenes are modelled with different spectral efficiencies
depending on their location (based on simulations, which are ongoing).
In this estimation tool, the user may change any boxes highlighted in blue to study different effects
(e.g. incident scene size, placement, system deployment topology, bldg. coverage, actual application
usage for each incident size/type). While the tool allows the study of various effects through
simulations of various scenarios, it may be noted that there is significant increase in spectral needs at
a cell edge and for large incidents; this becomes overwhelming, likely resulting in the need to offload
PS traffic to commercial networks, or deploy an incident scene microcell (CoW). One can also see
from the spreadsheet that a medium sized incident near the cell edge and a large incident at a median
location need approximately 10+10 MHz of spectrum which is in-line with some other published
studies.

72 Rep. ITU-R M.2415-0
Spectrum_Calculator_v0_8.xlsx
Attachment 1 to this Annex provides some of the PPDR scenarios using this tool to show the
throughput and the bandwidth needs of these Broadband PPDR scenarios. These scenarios include
level 1 being a Tanker Spill, Level 2, a Clandestine (Drug) Lab, and Level 3, a Petrochemical Refinery
incident. Figure 2C-1 below summarizes the expected public safety equipment and personnel
response needed to manage such an incident in a local Chicago (Illinois, USA) suburb.
Attachment 1
to Annex 2C
Given the unique mission critical requirements of public safety, it is essential that first responders
have unilateral control over sufficient broadband capacity to serve current and future needs. To this
end, Motorola Solutions developed a model to evaluate public safety’s broadband wireless
requirements by drawing upon existing policies and recent incident feedback. For purposes of this
research, Level 1 through Level 3 Hazardous Materials Incidents were considered: Level 1 being a
Tanker Spill, Level 2, a Clandestine (Drug) Lab, and Level 3, a Petrochemical Refinery incident. The
Fig. 2C-1 below summarizes the expected public safety equipment and personnel response needed to
manage such an incident in a local Chicago (Illinois, USA) suburb.15
FIGURE 2C-1
Typical Response Scope for Level 1-3 Hazardous Materials Incidents
15 Specifically Posen, Illinois was used and their MABAS (Multi-Agency Box Alarm System) “Box Card”
was evaluated with interpretation from Posen PS employees.
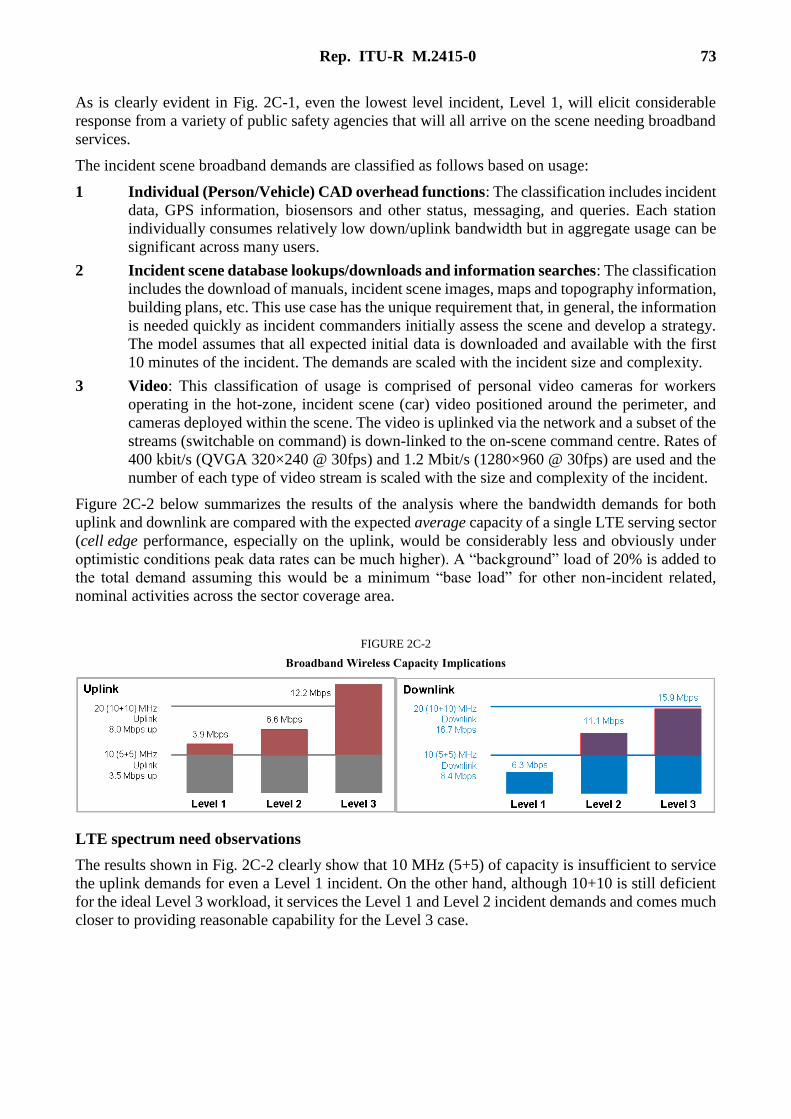
Rep. ITU-R M.2415-0 73
As is clearly evident in Fig. 2C-1, even the lowest level incident, Level 1, will elicit considerable
response from a variety of public safety agencies that will all arrive on the scene needing broadband
services.
The incident scene broadband demands are classified as follows based on usage:
1 Individual (Person/Vehicle) CAD overhead functions: The classification includes incident
data, GPS information, biosensors and other status, messaging, and queries. Each station
individually consumes relatively low down/uplink bandwidth but in aggregate usage can be
significant across many users.
2 Incident scene database lookups/downloads and information searches: The classification
includes the download of manuals, incident scene images, maps and topography information,
building plans, etc. This use case has the unique requirement that, in general, the information
is needed quickly as incident commanders initially assess the scene and develop a strategy.
The model assumes that all expected initial data is downloaded and available with the first
10 minutes of the incident. The demands are scaled with the incident size and complexity.
3 Video: This classification of usage is comprised of personal video cameras for workers
operating in the hot-zone, incident scene (car) video positioned around the perimeter, and
cameras deployed within the scene. The video is uplinked via the network and a subset of the
streams (switchable on command) is down-linked to the on-scene command centre. Rates of
400 kbit/s (QVGA 320×240 @ 30fps) and 1.2 Mbit/s (1280×960 @ 30fps) are used and the
number of each type of video stream is scaled with the size and complexity of the incident.
Figure 2C-2 below summarizes the results of the analysis where the bandwidth demands for both
uplink and downlink are compared with the expected average capacity of a single LTE serving sector
(cell edge performance, especially on the uplink, would be considerably less and obviously under
optimistic conditions peak data rates can be much higher). A “background” load of 20% is added to
the total demand assuming this would be a minimum “base load” for other non-incident related,
nominal activities across the sector coverage area.
FIGURE 2C-2
Broadband Wireless Capacity Implications
LTE spectrum need observations
The results shown in Fig. 2C-2 clearly show that 10 MHz (5+5) of capacity is insufficient to service
the uplink demands for even a Level 1 incident. On the other hand, although 10+10 is still deficient
for the ideal Level 3 workload, it services the Level 1 and Level 2 incident demands and comes much
closer to providing reasonable capability for the Level 3 case.

74 Rep. ITU-R M.2415-0
Annex 2D
Representative scenario- deploying LTE for PPDR
2D.1 Background
This study is addressing the methodology used to estimate minimum spectrum needs for PPDR
agencies in Israel.
Use of IMT-LTE for Broadband PPDR system refers to 15 time line events and a typical response
sequence based on the number of responders, as well as the broadband resources throughout the
incident. The data traffic supporting this response is assumed to be served by a wide area, mobile
broadband network. The PPDR agencies also use Project-25 system for voice only. Project-25 system
had not been analyzed during this event.
2D.2 Incident scenario
The scenario includes an accident in which a chemical material truck crashes in the city; the truck
hits several cars and the truck tank is damaged. The chemical material starts to leak, and the PPDR
agencies start to evacuate the area. Two cars are on fire, the fire is spreading fast, people are injured
and some are trapped inside the cars, a nearby building must be evacuated as soon as possible.
The following table shows the time line scenario step by step.
The table includes:
1 Event description.
2 Time line from 0 to 6 hours.
3 Link type: Project 25 system for Voice and LTE for data.
4 Required actions uplink.
5 Required actions downlink.
6 Total number of users that arrive each time line.
The following PPDR agencies take part during the event:
1 Police.
2 Ambulances.
3 Fire brigade.
4 Hazardous materials response team.
5 City control forces.
2D.3 Event description
Call received at police operation centre, and the operation centre dispatch immediately broadcasts to
all forces to go there as soon as possible. 12 police cars confirm that they on the way to scene. The
operation centre dispatch sends location information to vehicles’ computers and the police cars also
request more information about the area and more GIS information. The dispatch sends them the GIS
information and high resolution video of the event from a security camera close to the truck. After
7 min, the police cars arrive at the scene and send real time low resolution video from the area. The
policemen are getting real time high resolution video from a high resolution security camera via the
LTE system on a nearby building in which people are trapped because of the fire. They are also

Rep. ITU-R M.2415-0 75
getting GIS information and building information. After 12 min, additional police vehicles with
2 chief officers arrive at the scene.
They also send real time low resolution video from the area and they receive real time high resolution
video from a police helicopter via the LTE system. After 13 minutes, a city control vehicle with two
officers arrives at the scene. They send real time low resolution video from the area to the city control
room and they receive real time high resolution video from a city traffic control camera via the LTE
system. After 14 minutes, four ambulances arrive. They request GIS information and send real time
high resolution video to their Command Centre. They are receiving real time high resolution video
from a security camera via the LTE system about the injuries and getting medical information and
GIS information. After 15 minutes the fire-brigade arrives, requests GIS information, sends real time
medium resolution video from the vehicle’s camera, receives real time medium resolution video from
the scene and gets GIS information and building scheme. After 16 minutes, hazardous materials
response team arrive and request GIS information, send high resolution pictures in order to verify the
chemical liquid with the help of their experts, receive real time medium resolution video from the
scene and get GIS information. After 20 minutes, Front Command and Control deployed in the scene
area are connecting to the police database. They operate voice conference calls and video conferences;
receive real time low resolution video from the helicopter and real time high resolution video from
forces inside the building. At this point the Front Command and Control are fully connected to the
police database and can use any police information such as cars and people information, real time
video, and pictures that can be shared with anyone that needs the information. The information is now
fully displayed in the main command and control room of the police and other forces. Commanders
can share the information and get full control of the event.
TABLE 2D-1
Incident scenario time line
Scenario time line
No. of
users
Used
systems
Required action
Downlink
Required action
Uplink
Link
type Time+
Part number and
event description
0 1 Accident occurs
1 minute 2 Call received at
police Operation
Centre
12 Project 25 Call to the closest police
vehicles and send
location information to
vehicles' computer
Voice 2 minutes 3 Operation Centre
dispatch sent
12 Project 25
& LTE
Getting GIS information
and each policeman
(total of 12 ) getting real
time high resolution
video of the event from
security camera close to
the truck
Request for
information from
Vehicle’s
computer+GIS
information
Voice+
Data
3 minutes 4 Police vehicles on
the way to scene
12 Project 25
& LTE
Getting real time high
resolution video from
security camera close to
the truck and getting
GIS information
Sending real time low
resolution video from
the area
Voice+
Data
7 minutes 5 Policemen arrive at
scene

76 Rep. ITU-R M.2415-0
TABLE 2D-1 (end)
Scenario time line
No. of
users
Used
systems
Required action
Downlink
Required action
Uplink
Link
type Time+
Part number and
event description
2 Project 25
& LTE
Getting real time high
resolution video from
police helicopter
Sending real time low
resolution video from
the area
Voice+
Data
12 minutes 6 Additional police
vehicle with 2 chief
officers arrives
2 Project 25
& LTE
Getting real time high
resolution video from
traffic control camera
Sending real time low
resolution video from
the area
Voice+
Data
13 minutes 7 City control vehicle
with 2 officers
arrives at scene
12 Project 25
& LTE
Getting real time high
resolution video from
security camera about
the injuries and getting
GIS information
Request for GIS
information and
sending real time high
resolution video to
command center
Voice+
Data
14 minutes 8 Four ambulances
arrival
3 Project 25
& LTE
Getting real time
medium resolution video
from scene and get GIS
information
Request for GIS
information and
sending real time
medium resolution
video from vehicle
camera
Voice+
Data
15 minutes 9 Fire forces arrival
1 Project 25
& LTE
Getting real time
medium resolution video
from scene and getting
GIS information
Request for GIS
information and
sending high
resolution pictures
Voice+
Data
16 minutes 10 Hazardous materials
response team
arrival
4 Project 25
& LTE
Video conference ,
getting real time low
resolution video from
helicopter and real time
high resolution video
from scene
Connecting to police
database and video
conference
Voice+
Data
20 minutes 11 Front Command and
Control deployment
Project 25
& LTE
Total of 36 users who
operate 72 applications
simultaneously
Total of 36 users who
operate 36
applications
simultaneously
Voice+
Data
20 minutes 12 All forces arrived
and operational
Project 25
& LTE
Voice+
Data
40 minutes 13 The ambulances
leave the area on the
way to hospital
Project 25
& LTE
Voice+
Data
100
minutes
14 The forces
succeeded to isolate
the truck and to
close the leak
Voice+
Data
125
minutes
15 Chemical material
removing to
replacement tanks
Voice+
Data
200
minutes
16 Replacements tanks
are removed from
area
Voice+
Data
250
minutes
17 The area is clean
and checked
Voice+
Data
360
minutes
18 End of the event
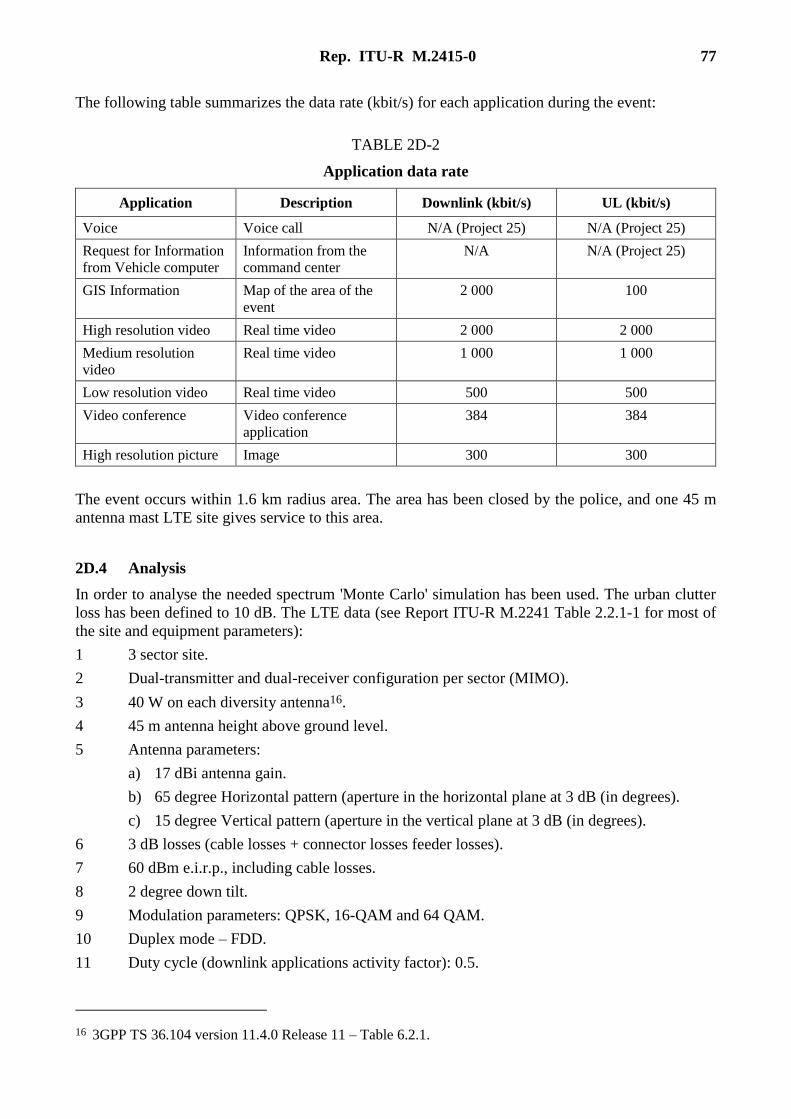
Rep. ITU-R M.2415-0 77
The following table summarizes the data rate (kbit/s) for each application during the event:
TABLE 2D-2
Application data rate
UL (kbit/s) Downlink (kbit/s) Description Application
N/A (Project 25) N/A (Project 25) Voice call Voice
N/A (Project 25) N/A Information from the
command center
Request for Information
from Vehicle computer
100 2 000 Map of the area of the
event
GIS Information
2 000 2 000 Real time video High resolution video
1 000 1 000 Real time video Medium resolution
video
500 500 Real time video Low resolution video
384 384 Video conference
application
Video conference
300 300 Image High resolution picture
The event occurs within 1.6 km radius area. The area has been closed by the police, and one 45 m
antenna mast LTE site gives service to this area.
2D.4 Analysis
In order to analyse the needed spectrum 'Monte Carlo' simulation has been used. The urban clutter
loss has been defined to 10 dB. The LTE data (see Report ITU-R M.2241 Table 2.2.1-1 for most of
the site and equipment parameters):
1 3 sector site.
2 Dual-transmitter and dual-receiver configuration per sector (MIMO).
3 40 W on each diversity antenna16.
4 45 m antenna height above ground level.
5 Antenna parameters:
a) 17 dBi antenna gain.
b) 65 degree Horizontal pattern (aperture in the horizontal plane at 3 dB (in degrees).
c) 15 degree Vertical pattern (aperture in the vertical plane at 3 dB (in degrees).
6 3 dB losses (cable losses + connector losses feeder losses).
7 60 dBm e.i.r.p., including cable losses.
8 2 degree down tilt.
9 Modulation parameters: QPSK, 16-QAM and 64 QAM.
10 Duplex mode – FDD.
11 Duty cycle (downlink applications activity factor): 0.5.
16 3GPP TS 36.104 version 11.4.0 Release 11 – Table 6.2.1.
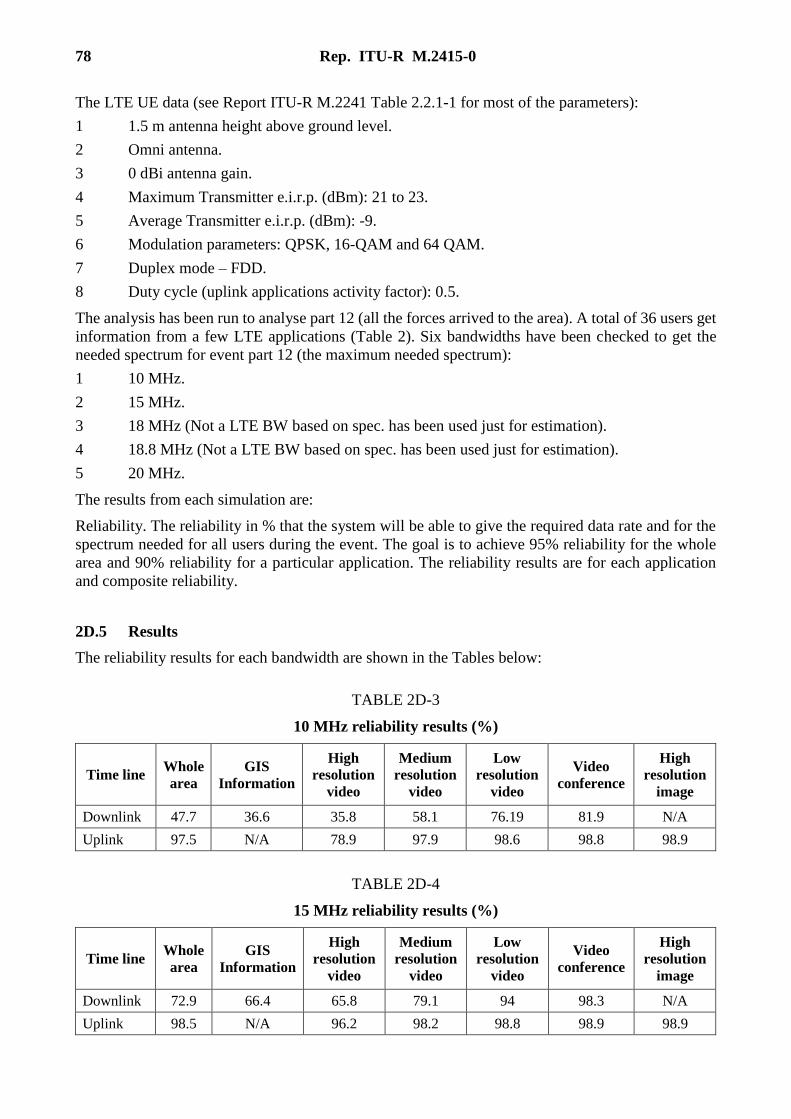
78 Rep. ITU-R M.2415-0
The LTE UE data (see Report ITU-R M.2241 Table 2.2.1-1 for most of the parameters):
1 1.5 m antenna height above ground level.
2 Omni antenna.
3 0 dBi antenna gain.
4 Maximum Transmitter e.i.r.p. (dBm): 21 to 23.
5 Average Transmitter e.i.r.p. (dBm): -9.
6 Modulation parameters: QPSK, 16-QAM and 64 QAM.
7 Duplex mode – FDD.
8 Duty cycle (uplink applications activity factor): 0.5.
The analysis has been run to analyse part 12 (all the forces arrived to the area). A total of 36 users get
information from a few LTE applications (Table 2). Six bandwidths have been checked to get the
needed spectrum for event part 12 (the maximum needed spectrum):
1 10 MHz.
2 15 MHz.
3 18 MHz (Not a LTE BW based on spec. has been used just for estimation).
4 18.8 MHz (Not a LTE BW based on spec. has been used just for estimation).
5 20 MHz.
The results from each simulation are:
Reliability. The reliability in % that the system will be able to give the required data rate and for the
spectrum needed for all users during the event. The goal is to achieve 95% reliability for the whole
area and 90% reliability for a particular application. The reliability results are for each application
and composite reliability.
2D.5 Results
The reliability results for each bandwidth are shown in the Tables below:
TABLE 2D-3
10 MHz reliability results (%)
High
resolution
image
Video
conference
Low
resolution
video
Medium
resolution
video
High
resolution
video
GIS
Information
Whole
area Time line
N/A 81.9 76.19 58.1 35.8 36.6 47.7 Downlink
98.9 98.8 98.6 97.9 78.9 N/A 97.5 Uplink
TABLE 2D-4
15 MHz reliability results (%)
High
resolution
image
Video
conference
Low
resolution
video
Medium
resolution
video
High
resolution
video
GIS
Information
Whole
area Time line
N/A 98.3 94 79.1 65.8 66.4 72.9 Downlink
98.9 98.9 98.8 98.2 96.2 N/A 98.5 Uplink
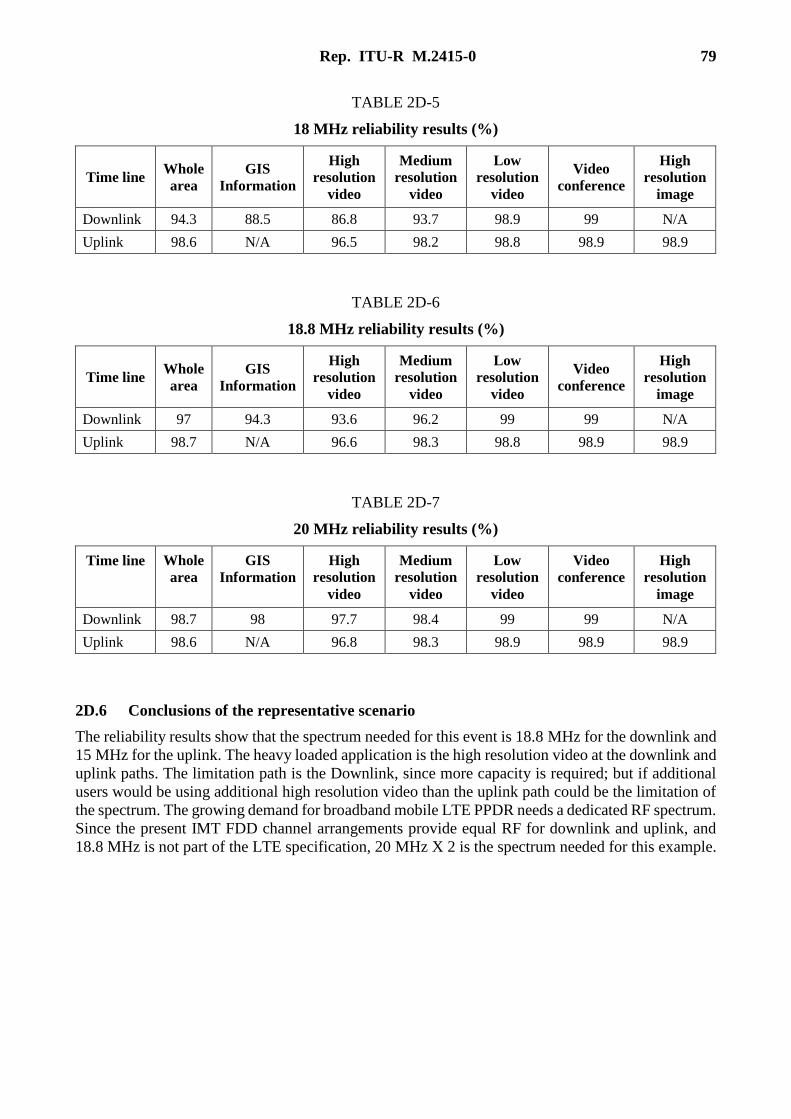
Rep. ITU-R M.2415-0 79
TABLE 2D-5
18 MHz reliability results (%)
High
resolution
image
Video
conference
Low
resolution
video
Medium
resolution
video
High
resolution
video
GIS
Information
Whole
area Time line
N/A 99 98.9 93.7 86.8 88.5 94.3 Downlink
98.9 98.9 98.8 98.2 96.5 N/A 98.6 Uplink
TABLE 2D-6
18.8 MHz reliability results (%)
High
resolution
image
Video
conference
Low
resolution
video
Medium
resolution
video
High
resolution
video
GIS
Information
Whole
area Time line
N/A 99 99 96.2 93.6 94.3 97 Downlink
98.9 98.9 98.8 98.3 96.6 N/A 98.7 Uplink
TABLE 2D-7
20 MHz reliability results (%)
High
resolution
image
Video
conference
Low
resolution
video
Medium
resolution
video
High
resolution
video
GIS
Information
Whole
area
Time line
N/A 99 99 98.4 97.7 98 98.7 Downlink
98.9 98.9 98.9 98.3 96.8 N/A 98.6 Uplink
2D.6 Conclusions of the representative scenario
The reliability results show that the spectrum needed for this event is 18.8 MHz for the downlink and
15 MHz for the uplink. The heavy loaded application is the high resolution video at the downlink and
uplink paths. The limitation path is the Downlink, since more capacity is required; but if additional
users would be using additional high resolution video than the uplink path could be the limitation of
the spectrum. The growing demand for broadband mobile LTE PPDR needs a dedicated RF spectrum.
Since the present IMT FDD channel arrangements provide equal RF for downlink and uplink, and
18.8 MHz is not part of the LTE specification, 20 MHz X 2 is the spectrum needed for this example.

80 Rep. ITU-R M.2415-0
Attachment 1
to Annex 2D
Example for wireless applications needed for broadband PPDR system
Wireless Applications
Video
real time video from helicopter
real time video from UAS
real time video from other cameras
video transmission from scene
Data
First responders information database connectivity
First responders tactical systems connectivity
First responders cars computers connectivity
First responders citizens information database connectivity
First responders GIS information database connectivity
First responders LPR information database connectivity
First responders vehicle information database connectivity
First responders technical information database connectivity
First responders internal mail connectivity
First responders internal application connectivity
TMS/SMS and MMS capability
Location and GIS
Sending location information
Maps and GIS information
First responders tactical GIS system connectivity
Communications
VOICE call
Conference call
PTT call to P25
PTT group call
Emergency call
Talk around between to handsets capability
video call
Broadband communications
Voice over IP connectivity
Mobile base station connectivity
front command and control connectivity
Rep. ITU-R M.2415-0 81
Annex 2E
Spectrum need estimations and scenario of LTE based technology
for broadband PPDR in China
2E.1 Introduction
The bandwidth needed by broadband PPDR would be tremendously different in different scenarios.
This annex aims to research on the PPDR spectrum needs of some typical scenarios in China. In the
methodology part, 1.4 GHz band and TDD duplex mode are introduced into assumptions. Then the
spectrum needs for Wuhan city in China are estimated according to the methodology as an example.
Additionally a typical PPDR incident scenario in China is also given.
2E.2 Methodology to estimate broadband spectrum needs
TABLE 2E-1
Methodology
IMT-2000 methodology
(Recommendation ITU-R M.1390) Methodology
A Geography
A1 Operational Environment
Combination of user mobility and user mobility.
Usually only analyze most significant
contributors.
A1 PPDR user density is much lower and more
uniform. PPDR users roam from one environment to
another as they respond to emergencies. PPDR systems
are usually designed to cover all environments (i.e. wide
area network provides in-building coverage). Instead of
analyzing by physical environment, assume that there
will likely be multiple overlapping systems each
providing different services (narrowband, wideband, and
broadband). Each service environment will probably
operate in a different frequency band with different
network architectures. Analyse three overlapping urban
“service environments”: narrowband, wideband,
broadband.
A2 Direction of calculation A2 Usually separate calculations for uplink and
downlink due to asymmetry in some services
A3 Representative cell area and geometry for
each environment type
A3 Average cell radius of radius to vertex for
hexagonal cells
A4 Calculate area of typical cell A4 Omni cells i R2
Hexagonal cells 2.6 · R2
3-sector hex 2.6/3 · R2
B Market & traffic
B1 Services offered B1 Net user bit rate (kbit/s) for each of the four PPDR
service environments: narrowband voice, narrowband
data, wideband image, broadband video.

82 Rep. ITU-R M.2415-0
TABLE 2E-1 (cont.)
IMT-2000 methodology
(Recommendation ITU-R M.1390) Methodology
B2 Population density
Persons per unit of area within each environment.
Population density varies with mobility
B2 Total PPDR user population within the total area
under consideration. Divide PPDR user population by
total area to get PPDR user population density.
PPDR users are usually separated into well-defined
categories by mission. Example:
Category Population
Regular Police 25848
Special Police Functions 5169
Police Civilian Support 12924
Fire Suppression 7755
General Government Service 130
Other PPDR users 5039
Total PPDR user population 58157
Area under consideration. Area within well-defined
geographic or political boundaries.
Example: City of Wuhan1550 km2
PPDR user population density PPDR user
population/area
Example: Wuhan 37.5 PPDR/km2
B3 Penetration rate
Percentage of persons subscribing to a service within an environment. Person may subscribe to more than one service
B3 Similar table.
Rows are services, such as voice, data and video.
Columns are “service environments”, such as
narrowband, wideband, and broadband.
May collect penetration rate into each “service
environment” separately for each PPDR category and
then calculate composite PPDR penetration rate.
Example:
Category Population Penetration
(NB Voice)
Regular Police 25 848 100%
Special Police Function 5 169 20%
Police Civilian Support 12 924 10%
Fire Suppression 7 755 0%
Emergency Medical service 1 292 50%
General Government Service 130 40%
Other PPDR users 5 039 40%
Total PPDR user population 58157
Narrowband Voice
PPDR user population 36807.9
PPDR penetration rate for narrowband “service
environment” and voice “service”:
Sum(Pop Pen)/sum(Pop) 63.2%

Rep. ITU-R M.2415-0 83
TABLE 2E-1 (cont.)
IMT-2000 methodology
(Recommendation ITU-R M.1390) Methodology
B4 Users/cell
Number of people subscribing to service within cell in environment
B4 Users/cell
Pop density Pen Rate Cell area
B5 Traffic parameters
Busy hour call attempts: average number of calls/sessions attempted to/from average user during a busy hour
Effective call duration
Average call/session duration during busy hour
Activity factor
Percentage of time that resource is actually used
during a call/session.
Example: bursty packet data may not use channel
during entire session. If voice vocoder does not
transmit data during voice pauses
B5 Calls/busy hour
Sources: current PPDR data and prediction data
s/call
0-100%
B6 Traffic/user
Average traffic generated by each user during
busy hour
B6 Call-seconds/user
Busy hour attempts Call duration Activity factor
B7 Offered traffic/cell
Average traffic generated by all users within a
cell during the busy hour (3 600 s)
B7 Erlangs
Traffic/user User/cell/3 600
B8 Quality of service function
Offered traffic/cell is multiplied by typical
frequency reuse cell grouping size and quality of
Service factors (blocking function) to estimate
offered traffic/cell at a given quality level
One carrier is applied in TD-LTE system. Group size
is 1.
Group size
Traffic per group =Traffic/cell (E)
Service channels per group
Use 1% blocking. Erlang B factor probably close to 1.5.
Need to consider extra reliability for PPDR systems,
excess capacity for peak emergencies, and number of
channels likely to be deployed at each PPDR antenna
site.
Technology modularity may affect number of channels
that can be deployed at a site
C Technical and system considerations
C1 Service channels per cell to carry offered
load C1 Service channels per cell Service channels per
group/Group size

84 Rep. ITU-R M.2415-0
TABLE 2E-1 (end)
IMT-2000 methodology
(Recommendation ITU-R M.1390) Methodology
C2 Service channel bit rate (kbit/s) C2 Service channel bit rate Net userbit rate
Overhead factor Coding factor
Equals net user bit rate plus additional increase
in loading due to coding and/or overhead
signalling, if not already included
If vocoder output 4.8 kbit/s, FEC 2.4 kbit/s, and
Overhead 2.4 kbit/s, then Channel bit rate 9.6 kbit/s
C3 Calculate traffic (Mbit/s)
Total traffic transmitted within area under study,
including all factors
C3 Total traffic
Service channels per cell service channel bit rate
C4 Net system capability
Measure of system capacity for a specific
technology. Related to spectral efficiency
C4 Calculate for typical narrowband voice,
narrowband data, wideband image and broadband video,
spectrum efficiency based on simulation results.
D Spectrum results
D1-D4 Calculate individual components (each
cell in service vs environment matrix
D1-D4 Calculate for each cell in service vs. “service
environment” matrix
D5 Weighting factor (alpha) for busy hour of
each environment relative to busy hour of other
environments, may vary from 0 to 1
D5 If all environments have coincident busy hours, then
alpha 1
Freqes Freq alpha requirements in D1-D4
D6 Adjustment factor (beta) for outside
effects – multiple operators/networks, guard
bands, band sharing, technology modularity
D6
Freq(total) beta sum(alpha Freqes)
2E.3 Estimation of spectrum needs for Wuhan city in China
According to above modified method, the frequency band based on TD-LTE system is predicted,
considering voice (including point-to-point downlink and uplink and point-to-multipoint downlink
and uplink), narrow band data, image and video.
Since packet data is carried in TD-LTE system and the quality of voice service focuses on time delay,
corresponding spectrum efficiency is a little bit low, shown in Table 2E-2. The spectrum efficiency
of Point-to-point uplink and downlink is 0.2 Mbit/s/cell/MHz. In order to guarantee the quality of cell
edge, corresponding spectrum efficiency of point-to-multipoint downlink is a little bit lower, that is
0.1 Mbit/s/cell/MHz.
To narrow band data and image, it needs to be differentiated between the average spectrum efficiency
and edge spectrum efficiency. According to simulation results, average spectrum efficiency uplink is
1.2 Mbit/s/cell/MHz, however, the edge of spectrum efficiency uplink is only 0.1 Mbit/s/cell/MHz.
Average spectrum efficiency downlink is 1.6 Mbit/s/cell/MHz, however, the edge of spectrum
efficiency downlink is only 0.1 Mbit/s/cell/MHz. Average spectrum efficiency is applied to uplink
and downlink in this report.
To wide band video service, spectrum efficiency is calculated by factoring average spectrum
efficiency and edge spectrum efficiency, shown in Table 2E-4.

Rep. ITU-R M.2415-0 85
TABLE 2E-2
Spectrum efficiency of TD-LTE voice
Parameters of voice Value Unit
Band (MHz) 20
Frequency Reuse factor 1
Point-to-point uplink spectrum efficiency 0.2 Mbit/s/cell/MHz
Point-to-point downlink spectrum efficiency 0.2 Mbit/s/cell/MHz
Point-to-multipoint downlink spectrum efficiency 0.1 Mbit/s/cell/MHz
TABLE 2E-3
Spectrum efficiency of TD-LTE narrow band data and image
Parameters of voice Value Unit
Band (MHz) 20
Frequency Reuse factor 1
Uplink average spectrum efficiency 1.2 Mbit/s/cell/MHz
Uplink edge spectrum efficiency 0.1 Mbit/s/cell/MHz
Downlink average spectrum efficiency 1.6 Mbit/s/cell/MHz
Downlink edge spectrum efficiency 0.1 Mbit/s/cell/MHz
TABLE 2E-4
Spectrum efficiency of TD-LTE video
Parameters of voice Value Unit
Band (MHz) 20
Frequency Reuse factor 1
Spectrum efficiency adjustment factor/ Edge proportion 0.7
Uplink spectrum efficiency 0.437 Mbit/s/cell/MHz
Downlink spectrum efficiency 0.536 Mbit/s/cell/MHz
Wuhan city is capital of Hubei province and centre of politics, economy and culture, which located
in the centre of China. It’s urban and main suburb cover 1 550 km2. It is predicted that population of
2020 will be about 20 million.
The PPDR is categorized as 4 classes that are police, other police, police civilian support, and fire.
The respective probable number is shown as following.
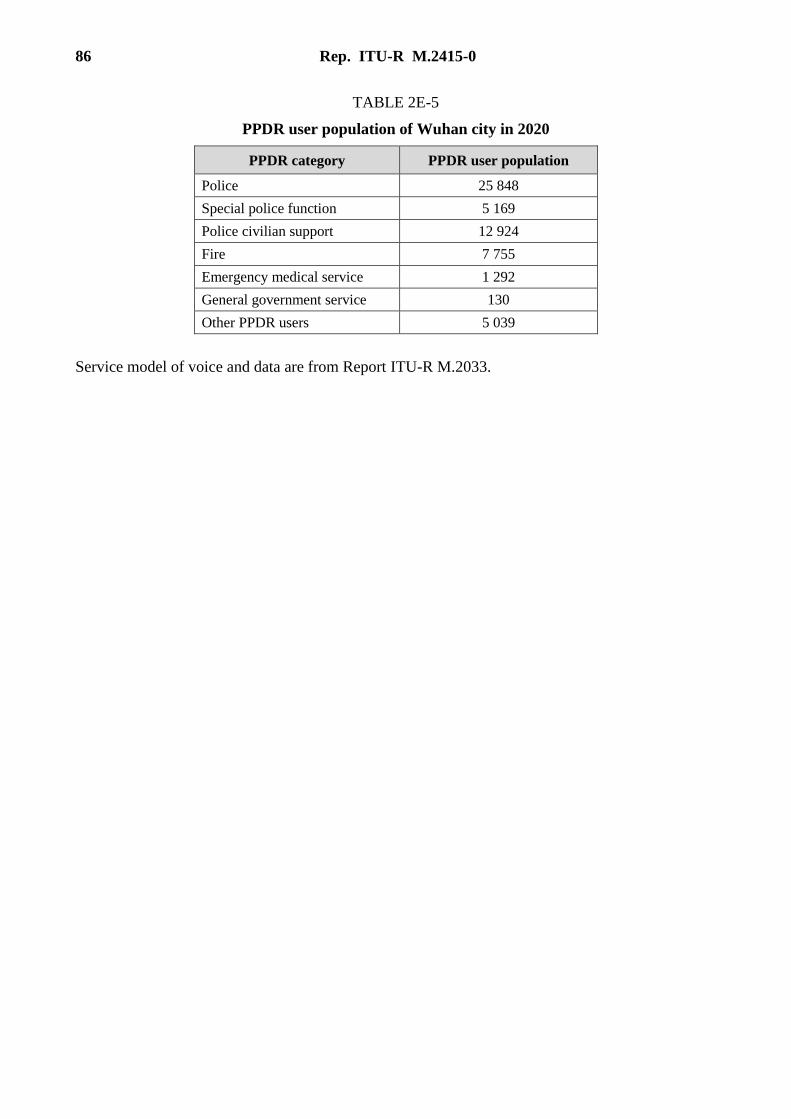
86 Rep. ITU-R M.2415-0
TABLE 2E-5
PPDR user population of Wuhan city in 2020
PPDR category PPDR user population
Police 25 848
Special police function 5 169
Police civilian support 12 924
Fire 7 755
Emergency medical service 1 292
General government service 130
Other PPDR users 5 039
Service model of voice and data are from Report ITU-R M.2033.
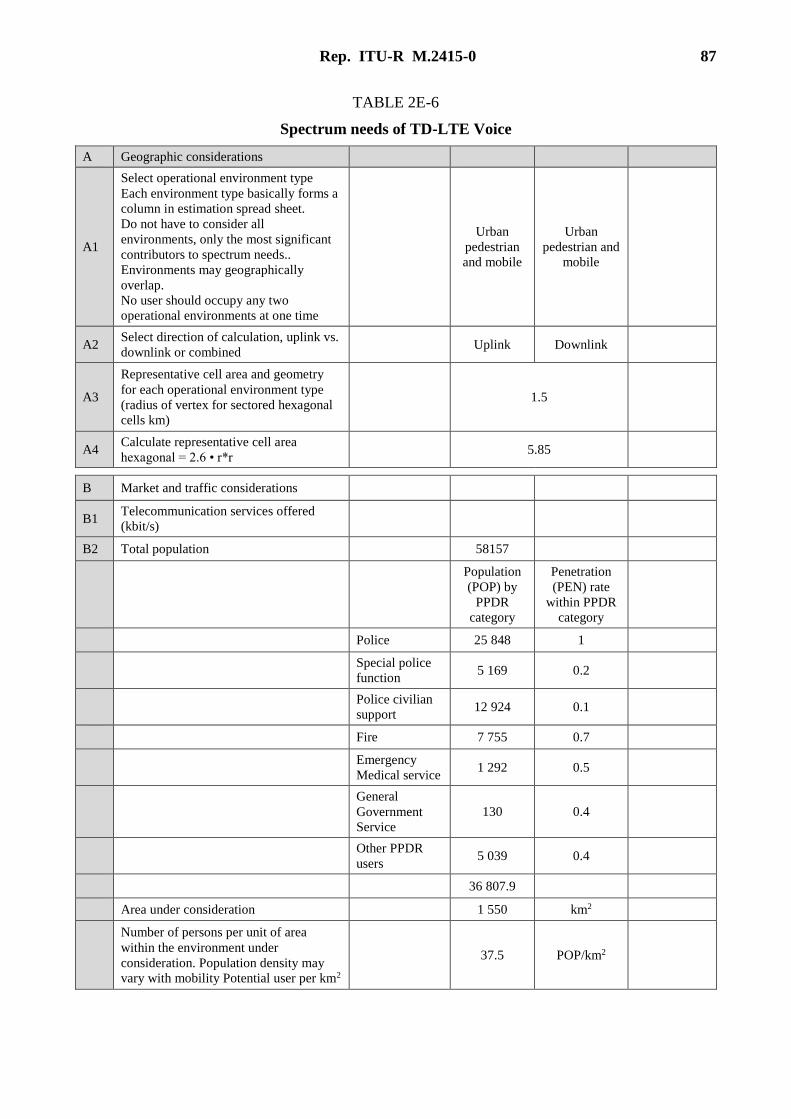
Rep. ITU-R M.2415-0 87
TABLE 2E-6
Spectrum needs of TD-LTE Voice
A Geographic considerations
A1
Select operational environment type
Each environment type basically forms a
column in estimation spread sheet.
Do not have to consider all
environments, only the most significant
contributors to spectrum needs..
Environments may geographically
overlap.
No user should occupy any two
operational environments at one time
Urban
pedestrian
and mobile
Urban
pedestrian and
mobile
A2 Select direction of calculation, uplink vs.
downlink or combined Uplink Downlink
A3
Representative cell area and geometry
for each operational environment type
(radius of vertex for sectored hexagonal
cells km)
1.5
A4 Calculate representative cell area
hexagonal = 2.6 • r*r 5.85
B Market and traffic considerations
B1 Telecommunication services offered
(kbit/s)
B2 Total population 58157
Population
(POP) by
PPDR
category
Penetration
(PEN) rate
within PPDR
category
Police 25 848 1
Special police
function 5 169 0.2
Police civilian
support 12 924 0.1
Fire 7 755 0.7
Emergency
Medical service 1 292 0.5
General
Government
Service
130 0.4
Other PPDR
users 5 039 0.4
36 807.9
Area under consideration 1 550 km2
Number of persons per unit of area
within the environment under
consideration. Population density may
vary with mobility Potential user per km2
37.5 POP/km2
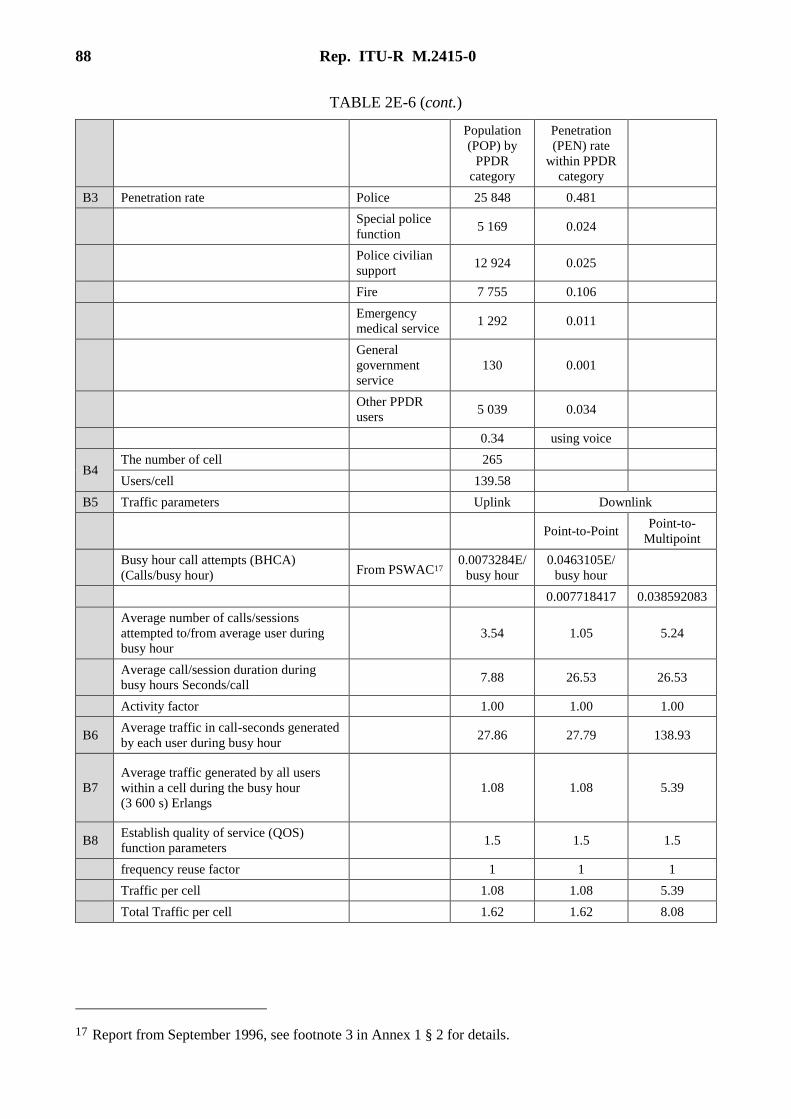
88 Rep. ITU-R M.2415-0
TABLE 2E-6 (cont.)
Population
(POP) by
PPDR
category
Penetration
(PEN) rate
within PPDR
category
B3 Penetration rate Police 25 848 0.481
Special police
function 5 169 0.024
Police civilian
support 12 924 0.025
Fire 7 755 0.106
Emergency
medical service 1 292 0.011
General
government
service
130 0.001
Other PPDR
users 5 039 0.034
0.34 using voice
B4 The number of cell 265
Users/cell 139.58
B5 Traffic parameters Uplink Downlink
Point-to-Point Point-to-
Multipoint
Busy hour call attempts (BHCA)
(Calls/busy hour) From PSWAC17 0.0073284E/
busy hour
0.0463105E/
busy hour
0.007718417 0.038592083
Average number of calls/sessions
attempted to/from average user during
busy hour
3.54 1.05 5.24
Average call/session duration during
busy hours Seconds/call 7.88 26.53 26.53
Activity factor 1.00 1.00 1.00
B6 Average traffic in call-seconds generated
by each user during busy hour 27.86 27.79 138.93
B7
Average traffic generated by all users
within a cell during the busy hour
(3 600 s) Erlangs
1.08 1.08 5.39
B8 Establish quality of service (QOS)
function parameters 1.5 1.5 1.5
frequency reuse factor 1 1 1
Traffic per cell 1.08 1.08 5.39
Total Traffic per cell 1.62 1.62 8.08
17 Report from September 1996, see footnote 3 in Annex 1 § 2 for details.

Rep. ITU-R M.2415-0 89
TABLE 2E-6 (end)
C Technical and system considerations
C1 Total Traffic per cell 1.62 1.62 8.08
C2 Bitrate (kbit/s) (12.2k AMR, about 16k) 16.00 16.00 16.00
C3 Calculate traffic (Mbit/s) 0.026 0.026 0.129
C4 Frequency Efficiency 0.200 0.200 0.1
D Spectrum results
D1 0.13 0.13 1.29
D2 Weighting factor for each environment
(α) 1.00 1.00 1
D3 Adjustment factor (β) 1.00 1.00 1
D4 Estimate total spectrum (MHz) 1.55
TABLE 2E-7
Spectrum needs of TD-LTE narrow band data
A Geographic considerations
A1
Select operational environment type
Each environment type basically forms a
column in estimation spreadsheet. Do not
have to consider all environments, only the
most significant contributors to spectrum
needs. Environments may geographically
overlap.
No user should occupy any two
operational environments at one time
Urban
pedestrian and
mobile
Urban
pedestrian and
mobile
A2 Select direction of calculation, uplink vs
downlink or combined Uplink Downlink
A3
Representative cell area and geometry for
each operational environment type,(radius of vertex for sectored hexagonal
cells km)
1.5
A4 Calculate representative cell area
hexagonal = 2.6 • r*r 5.85
B Market and traffic considerations
B1 Telecommunication services offered
(kbit/s)
B2 Total population 58 157
Population
(POP) by PPDR
category
Penetration
(PEN) rate
within PPDR
category
Police 25 848 0.5
Special
police
function
5 169 0.05
Police
civilian
support
12 924 0.05
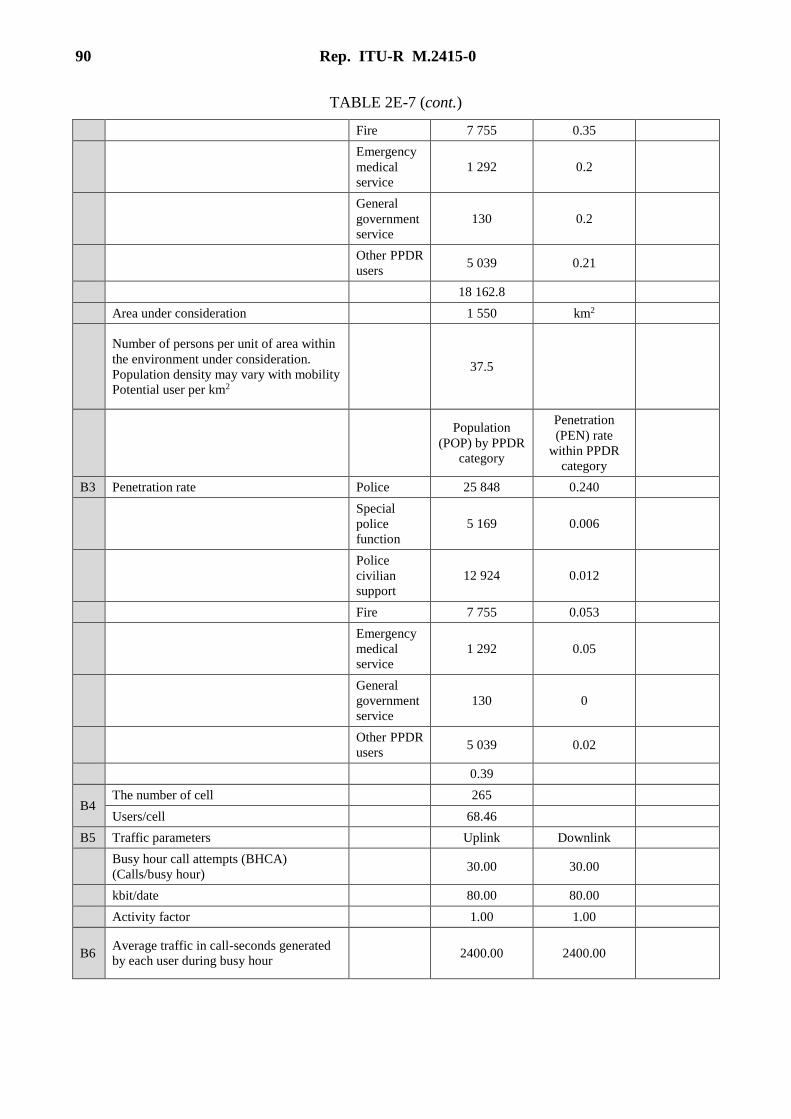
90 Rep. ITU-R M.2415-0
TABLE 2E-7 (cont.)
Fire 7 755 0.35
Emergency
medical
service
1 292 0.2
General
government
service
130 0.2
Other PPDR
users 5 039 0.21
18 162.8
Area under consideration 1 550 km2
Number of persons per unit of area within
the environment under consideration.
Population density may vary with mobility
Potential user per km2
37.5
Population
(POP) by PPDR
category
Penetration
(PEN) rate
within PPDR
category
B3 Penetration rate Police 25 848 0.240
Special
police
function
5 169 0.006
Police
civilian
support
12 924 0.012
Fire 7 755 0.053
Emergency
medical
service
1 292 0.05
General
government
service
130 0
Other PPDR
users 5 039 0.02
0.39
B4 The number of cell 265
Users/cell 68.46
B5 Traffic parameters Uplink Downlink
Busy hour call attempts (BHCA)
(Calls/busy hour) 30.00 30.00
kbit/date 80.00 80.00
Activity factor 1.00 1.00
B6 Average traffic in call-seconds generated
by each user during busy hour 2400.00 2400.00
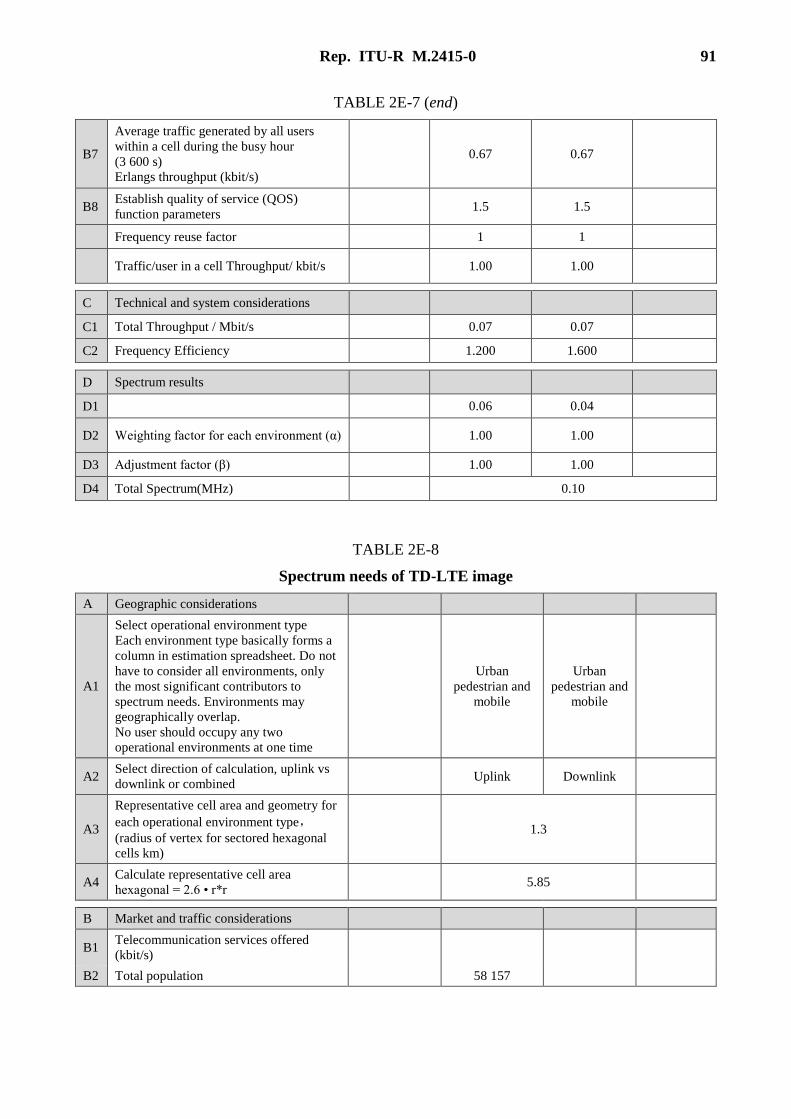
Rep. ITU-R M.2415-0 91
TABLE 2E-7 (end)
B7
Average traffic generated by all users
within a cell during the busy hour
(3 600 s)
Erlangs throughput (kbit/s)
0.67 0.67
B8 Establish quality of service (QOS)
function parameters 1.5 1.5
Frequency reuse factor 1 1
Traffic/user in a cell Throughput/ kbit/s 1.00 1.00
C Technical and system considerations
C1 Total Throughput / Mbit/s 0.07 0.07
C2 Frequency Efficiency 1.200 1.600
D Spectrum results
D1 0.06 0.04
D2 Weighting factor for each environment (α) 1.00 1.00
D3 Adjustment factor (β) 1.00 1.00
D4 Total Spectrum(MHz) 0.10
TABLE 2E-8
Spectrum needs of TD-LTE image
A Geographic considerations
A1
Select operational environment type
Each environment type basically forms a
column in estimation spreadsheet. Do not
have to consider all environments, only
the most significant contributors to
spectrum needs. Environments may
geographically overlap.
No user should occupy any two
operational environments at one time
Urban
pedestrian and
mobile
Urban
pedestrian and
mobile
A2 Select direction of calculation, uplink vs
downlink or combined Uplink Downlink
A3
Representative cell area and geometry for
each operational environment type,(radius of vertex for sectored hexagonal
cells km)
1.3
A4 Calculate representative cell area
hexagonal = 2.6 • r*r 5.85
B Market and traffic considerations
B1 Telecommunication services offered
(kbit/s)
B2 Total population 58 157

92 Rep. ITU-R M.2415-0
TABLE 2E-8 (cont.)
Population
(POP) by PPDR
category
Penetration
(PEN) rate
within PPDR
category
Police 25 848 0.6
Special police
function 5 169 0.05
Police civilian
support 12 924 0.01
Fire 7 755 0.3
Emergency
medical
service
1 292 0.2
General
government
service
130 0.2
Other PPDR
users 5 039 0.24
19 908.4
Area under consideration 1 550 km2
Number of persons per unit of area within
the environment under consideration.
Population density may vary with
mobility Potential user per km2
37.5
Population
(POP) by PPDR
category
Penetration
(PEN) rate
within PPDR
category
B3 Penetration rate Police 25 848 0.289
Special police
function 5 169 0.006
Police civilian
support 12 924 0.002
Fire 7 755 0.046
Emergency
medical
service
1 292 0.005
General
government
service
130 0
Other PPDR
users 5 039 0.023
0.40
B4 The number of cell 265
Users/cell 75.19
B5 Traffic parameters Uplink Downlink

Rep. ITU-R M.2415-0 93
TABLE 2E-8 (end)
Busy hour call attempts (BHCA)
(Calls/busy hour) 6.00 6.00
kbit /Image 8 000.00 8 000.00
Activity factor 1.00 1.00
B6 Average traffic in call-seconds generated
by each user during busy hour 48 000.00 48 000.00
B7
Average traffic generated by all users
within a cell during the busy hour
(3 600 s)
Erlangs Throughput(kbit/s)
13.33 13.33
B8 Establish quality of service (QOS)
function parameters 1.5 1.5
Frequency Reuse factor 1 1
Traffic/user in a cell Throughput/ kbit/s 20.00 20.00
C Technical and system considerations
C1 Total Throughput / Mbit/s 1.50 1.50
C2 Frequency Efficiency 1.200 1.600
D Spectrum results
D1 1.25 0.94
D2 Weighting factor for each environment
(α) 1.00 1.00
D3 Adjustment factor (β) 1.00 1.00
D4 Total Spectrum (MHz) 2.19
TABLE 2E-9
Spectrum requirement of TD-LTE video
A Geographic considerations
A1
Select operational environment type
Each environment type basically forms a
column in estimation spreadsheet. Do not
have to consider all environments, only
the most significant contributors to
spectrum needs. Environments may
geographically overlap.
No user should occupy any two
operational environments at one time
Urban
pedestrian and
mobile
Urban
pedestrian
and mobile
A2 Select direction of calculation, uplink vs
downlink or combined Uplink Downlink
A3
Representative cell area and geometry for
each operational environment type (radius
of vertex for sectored hexagonal cells km)
1.5
A4 Calculate representative cell area
hexagonal = 2.6 • r*r 5.85

94 Rep. ITU-R M.2415-0
TABLE 2E-9 (cont.)
B Market and traffic considerations
B1 Telecommunication services offered
(kbit/s)
B2 Total population 58 157
Population
(POP) by
PPDR category
Penetration
(PEN) rate
within PPDR
category
Police 25 848 0.2
Special police
function 5 169 0.04
Police civilian
support 12 924 0.02
Fire 7 755 0.4
Emergency
medical
service
1 292 0.1
General
government
service
130 0.3
Other PPDR
users 5 039 0.1
9 694.4
Area under consideration 1 550 km2
Number of persons per unit of area within
the environment under consideration.
Population density may vary with mobility
Potential user per km2
37.5
Population
(POP) by
PPDR category
Penetration
(PEN) rate
within PPDR
category
B3 Penetration rate Police 25 848 0.096
Special police
function 5 169 0.005
Police civilian
support 12 924 0.005
Fire 7 755 0.061
Emergency
medical
service
1 292 0.002
General
government
service
130 0.001
Other PPDR
users 5 039 0.009
0.33
B4 The number of cell 265
Users/cell 36.58

Rep. ITU-R M.2415-0 95
TABLE 2E-9 (end)
B5 Traffic parameters Uplink Downlink
Busy hour call attempts (BHCA)
(Calls/busy hour) 6.00 3.00
Average traffic in call-seconds generated
by each user during busy hour 60.00 60.00
Activity factor 1.00 1.00
B6
Average traffic generated by all users
within a cell during the busy hour (3 600
s)
Erlangs throughput (kbit/s)
360.00 180.00
B7
Average traffic generated by all users
within a cell during the busy hour (3 600
s)
Erlangs throughput (kbit/s)
3.66 1.83
B8 Establish quality of service (QOS)
function parameters 1.5 1.5
Frequency Reuse factor 1 1
Traffic of all users in a cell
Throughput/kbit/s 3.66 1.83
Total traffic in a cell Throughput/ kbit/s 5.49 2.74
C Technical and system considerations
C1 Total Traffic per cell 5.49 2.74
C2 Bitrate (kbit/s) (2 MHz) 2 000.00 2 000.00
C3 Total Throughput / Mbit/s 10.975 5.487
C4 Frequency Efficiency 0.430 0.550
D Spectrum results
D
1 25.52 9.98
D
2 Weighting factor for each environment (α) 1.00 1.00
D
3 Adjustment factor (β) 1.00 1.00
D
4 Total Spectrum (MHz) 35.50
Frequency prediction is summarised in Table 2E-10.
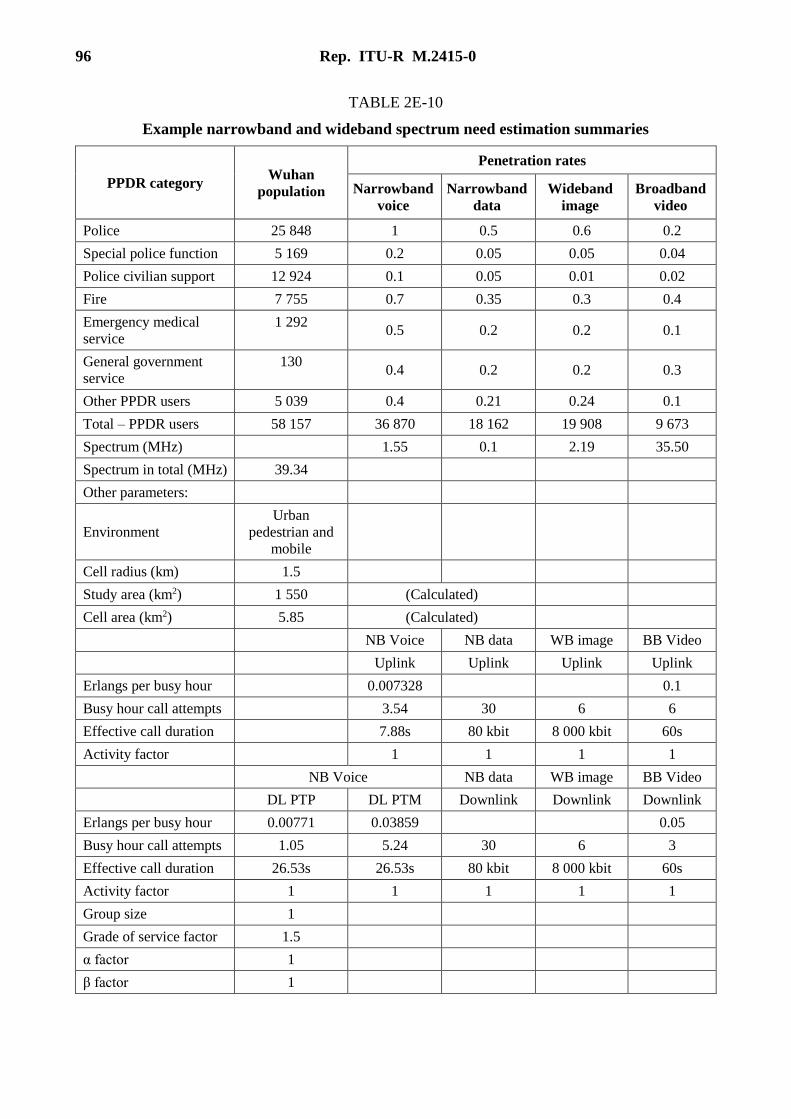
96 Rep. ITU-R M.2415-0
TABLE 2E-10
Example narrowband and wideband spectrum need estimation summaries
PPDR category Wuhan
population
Penetration rates
Narrowband
voice
Narrowband
data
Wideband
image
Broadband
video
Police 25 848 1 0.5 0.6 0.2
Special police function 5 169 0.2 0.05 0.05 0.04
Police civilian support 12 924 0.1 0.05 0.01 0.02
Fire 7 755 0.7 0.35 0.3 0.4
Emergency medical
service
1 292 0.5 0.2 0.2 0.1
General government
service
130 0.4 0.2 0.2 0.3
Other PPDR users 5 039 0.4 0.21 0.24 0.1
Total – PPDR users 58 157 36 870 18 162 19 908 9 673
Spectrum (MHz) 1.55 0.1 2.19 35.50
Spectrum in total (MHz) 39.34
Other parameters:
Environment
Urban
pedestrian and
mobile
Cell radius (km) 1.5
Study area (km2) 1 550 (Calculated)
Cell area (km2) 5.85 (Calculated)
NB Voice NB data WB image BB Video
Uplink Uplink Uplink Uplink
Erlangs per busy hour 0.007328 0.1
Busy hour call attempts 3.54 30 6 6
Effective call duration 7.88s 80 kbit 8 000 kbit 60s
Activity factor 1 1 1 1
NB Voice NB data WB image BB Video
DL PTP DL PTM Downlink Downlink Downlink
Erlangs per busy hour 0.00771 0.03859 0.05
Busy hour call attempts 1.05 5.24 30 6 3
Effective call duration 26.53s 26.53s 80 kbit 8 000 kbit 60s
Activity factor 1 1 1 1 1
Group size 1
Grade of service factor 1.5
α factor 1
β factor 1
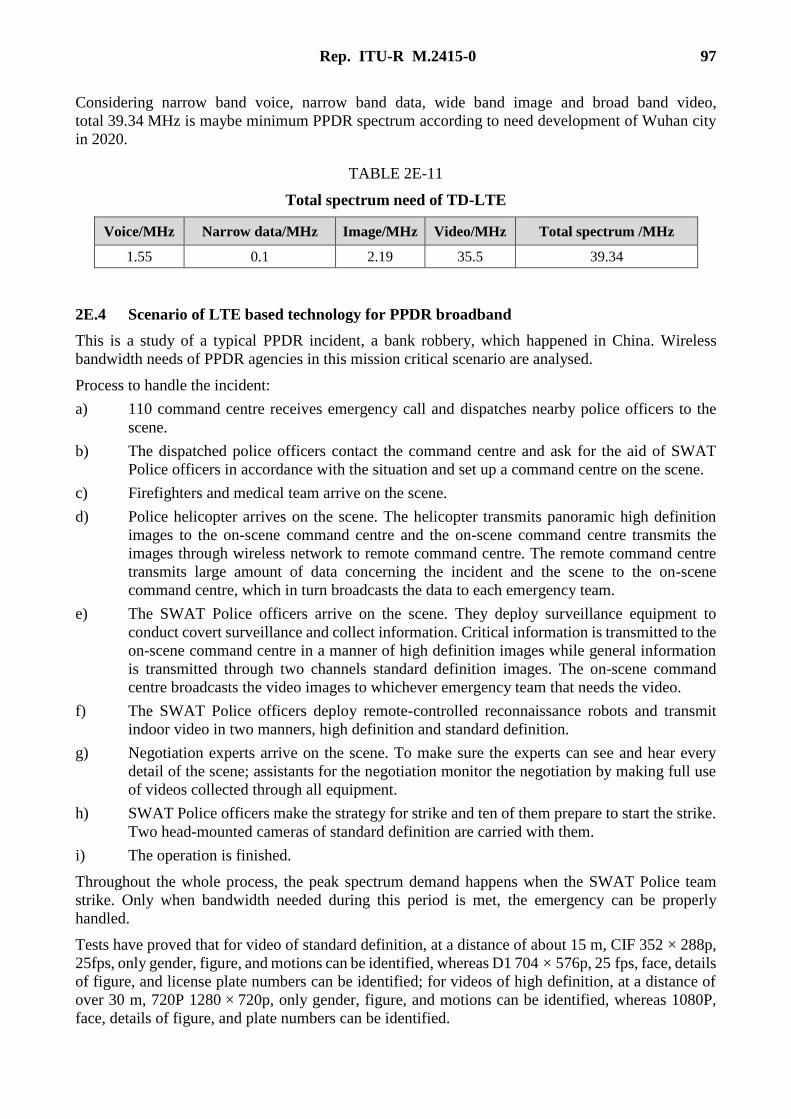
Rep. ITU-R M.2415-0 97
Considering narrow band voice, narrow band data, wide band image and broad band video,
total 39.34 MHz is maybe minimum PPDR spectrum according to need development of Wuhan city
in 2020.
TABLE 2E-11
Total spectrum need of TD-LTE
Voice/MHz Narrow data/MHz Image/MHz Video/MHz Total spectrum /MHz
1.55 0.1 2.19 35.5 39.34
2E.4 Scenario of LTE based technology for PPDR broadband
This is a study of a typical PPDR incident, a bank robbery, which happened in China. Wireless
bandwidth needs of PPDR agencies in this mission critical scenario are analysed.
Process to handle the incident:
a) 110 command centre receives emergency call and dispatches nearby police officers to the
scene.
b) The dispatched police officers contact the command centre and ask for the aid of SWAT
Police officers in accordance with the situation and set up a command centre on the scene.
c) Firefighters and medical team arrive on the scene.
d) Police helicopter arrives on the scene. The helicopter transmits panoramic high definition
images to the on-scene command centre and the on-scene command centre transmits the
images through wireless network to remote command centre. The remote command centre
transmits large amount of data concerning the incident and the scene to the on-scene
command centre, which in turn broadcasts the data to each emergency team.
e) The SWAT Police officers arrive on the scene. They deploy surveillance equipment to
conduct covert surveillance and collect information. Critical information is transmitted to the
on-scene command centre in a manner of high definition images while general information
is transmitted through two channels standard definition images. The on-scene command
centre broadcasts the video images to whichever emergency team that needs the video.
f) The SWAT Police officers deploy remote-controlled reconnaissance robots and transmit
indoor video in two manners, high definition and standard definition.
g) Negotiation experts arrive on the scene. To make sure the experts can see and hear every
detail of the scene; assistants for the negotiation monitor the negotiation by making full use
of videos collected through all equipment.
h) SWAT Police officers make the strategy for strike and ten of them prepare to start the strike.
Two head-mounted cameras of standard definition are carried with them.
i) The operation is finished.
Throughout the whole process, the peak spectrum demand happens when the SWAT Police team
strike. Only when bandwidth needed during this period is met, the emergency can be properly
handled.
Tests have proved that for video of standard definition, at a distance of about 15 m, CIF 352 × 288p,
25fps, only gender, figure, and motions can be identified, whereas D1 704 × 576p, 25 fps, face, details
of figure, and license plate numbers can be identified; for videos of high definition, at a distance of
over 30 m, 720P 1280 × 720p, only gender, figure, and motions can be identified, whereas 1080P,
face, details of figure, and plate numbers can be identified.

98 Rep. ITU-R M.2415-0
Table 2E-12 lists the bandwidth needs of different personnel and equipment during the strike.
Compared to the bandwidth for video transmission, the bandwidth for uploading and downloading
voice and data can be ignored. Thus, Table 2E-12 only lists the statistics for downlink and uplink
bandwidth needed by video.
TABLE 2E-12
Analysis of bandwidth needs during the strike
Emergency team
Personnel
and
equipment
Service(s)
Source
coding
rate
Uplink
bandwidth
Downlink
bandwidth
Command Centre 15 compressed video
broadcast 7 MHz
Ordinary Police
Officers 20
identity authentication
and query
Medical Team 5 1 channel D1 video
upload and download 1 Mbit/s 2 MHz 2 MHz
Fire Fighters 5 1 channel D1 video
upload and download 1 Mbit/s 2 MHz 2 MHz
Negotiation
Experts 3
high definition video
download 4 MHz
Strike Team 10 2 channels CIF video
upload and download
0.5
Mbit/s 2 MHz 4 MHz
Police Helicopter 1 1 channel 1080P video
upload and download 3 Mbit/s 5 MHz 1 MHz
Reconnaissance
Robot 10
1 channel 720P, 1
channel CIF video
upload
3.5
Mbit/s 6 MHz
The above analysis shows that to fulfil the task, uplink needs at least 17 MHz bandwidth and broadcast
downlink at least 7 MHz (frequency spectrum utilization about 50%). Consider the routine work;
extra 10% background spectrum width is needed. The total spectrum width is about 27 MHz. It is
asserted that the more complex the incident case, the more spectrum is needed.
2E.5 Conclusion
According to the provided methodology and the typical case above, allocating about 30 MHz
bandwidth for PPDR agencies may be appropriate to fulfil the requirements of general PPDR
scenarios. It would require more spectrum bandwidth (e.g. 40 MHz) if disaster relief scenarios are
fully considered.
Rep. ITU-R M.2415-0 99
Annex 2F
Broadband PPDR spectrum needs in Korea
2F.1 Introduction
The Government of Korea recently decided to use Public Safety LTE technologies with 2 × 10 MHz
frequency in the 700 MHz band (718-728 MHz for uplink and 773-783 MHz for downlink) according
to APT 700 MHz Band Plan) to build nationwide Public Protection and Disaster Relief (PPDR)
Broadband network for sharing among Korean PPDR agencies. According to this decision, the
Ministry of Public Safety and Security of Korea (MPSS; http://www.mpss.go.kr/main/main.html) has
led the related project to build PPDR Broadband network since 2014. This broadband network is
considered to be not only used for PPDR agencies (police, fire brigade, etc.) but also carry out public
broadband services for express railway18 and inshore vessel19. The PPDR network is supposed to be
built as a nationwide dedicated network basically but the use of commercial network to cover area
where PPDR network coverage does not reach is also being considered.
The spectrum needs have been studied and they are based on traffic scenarios of PPDR agencies (e.g.
police, fire brigade, coast guard) in PP1 (day-to-day operation), PP2 (large emergency and public
event), DR (disaster) scenarios respectively. Spectrum needs when multiple PPDR agencies jointly
carry out operation are considered. Korea government is considering integrated public broadband
services for PPDR, railway, and inshore vessels in a single nationwide LTE network. Thus, spectrum
needs for the integrated public broadband service are also analysed.
In § A2F.2, spectrum need estimation methodology is explained and traffic parameters of each
scenario are presented. Section A2F.4 shows spectrum need estimation results and conclusions are
drawn in § A2F.5.
2F.2 Spectrum Need Estimation Methodology
The spectrum need estimation methodology adopted in this study is based on Recommendation ITU-
R M.1390 which is used for the calculation of IMT-2000 terrestrial spectrum requirements and its use
to estimate spectrum needs for PPDR is shown in Report ITU-R M.2033. The spectrum need
estimation procedure consists of 4 stages as in Fig. 2F-1.
FIGURE 2F-1
Spectrum need estimation procedure in Rec. ITU-R M.1390
In this study, the Recommendation ITU-R M.1390 methodology is considered but modified to reflect
PPDR service characteristics as explained below.
18 Ministry of Land, Infrastructure and Transport of Korea has been planning a railway broadband service
known as Intelligent Railway Integrated System (IRIS) which provides train safety applications including
train control and monitoring.
19 Ministry of Oceans and Fisheries of Korea has been planning to provide ship safety broadband services
primarily to inshore small vessels which are not equipped with Global Maritime Distress and Safety System
(GMDSS).
A. Geographic
Consideration
B. Market and
Traffic
Consideration
C. Technical and
System
Consideration
D. Spectrum
Results
Consideration

100 Rep. ITU-R M.2415-0
A) Geographic considerations
In this stage, environment type, cell area and geometry etc. are considered. Environment types are
usually selected most significant contributors. In this study, dense urban and urban are considered as
density and in-building and pedestrian are considered as mobility. Circular cell geometry and at least
1 km cell diameter is assumed. In general, cell diameter is used to calculate the number of user in a
cell, but in this study cell diameter is irrelevant to the number of user since it is assumed that most of
users are concentrated on one cell. When operation being carried out over wide area (e.g. police PP2
scenario in § A2F.3.1), we assume cell diameter is 1 km.
B) Market and traffic considerations
In this stage, the number of user per cell is calculated from service type, population density and
penetration rate. Traffic parameters (busy hour call attempt, average call duration, activity factor) for
each service (e.g. voice, data, and video) are also considered and traffic per cell in Erlang unit is
calculated from the traffic parameters. To calculate required channels from traffic per cell, QoS
parameters (e.g. call blocking probability for circuit switched network, packet delay for packet
switched network) is also considered. In this study, traffic parameters are collected from major PPDR
agencies (police, fire brigade, coast guard) as given in § A2F.3. Stages B and C to calculate traffic in
kbit/s unit are integrated as explained in stage C.
C) Technical and system considerations
The number of channel required for each application is obtained from traffic per cell and QoS
parameters through Erlang B or C formula. The obtained number of channel for each application is
multiplied by required bit rate of the corresponding applications. Finally, spectral efficiency
parameter is considered to transform traffic into spectrum needs.
In above stages B and C, traffic in Erlang unit are calculated into the required number of channel and
transformed into traffic in kbit/s. In this study, for simplicity of calculation, traffic in kbit/s is
calculated directly as follows referring to ECC Report 199.
For real time application, traffic (kbit/s) = number of user × call (transaction) attempt per hour ×
required bit rate (kbit/s) × call (transaction) duration per hour (min) / 60. For non-real time application
(kbit/s) = 8 × number of user × call (transaction) attempt per hour × data (Byte) / (3 600 × 1 000).
The result of traffic in kbit/s obtained from this calculation method may be smaller than the result
from M.1390 which takes into account QoS parameters. However, it is anticipated that the difference
would not be significant because HD quality video transmission services which account for the most
of spectrum is assumed to be ensued for their channel.
As a radio interface technology, LTE Release 8 is assumed and its spectral efficiency is given as
follows.
TABLE 2F-1
Spectral Efficiencies Assumption
Spectral Efficiency (bit/s/Hz) Uplink (1×2 MIMO) Downlink (2×2 MIMO)
Average 0.735 1.69
Cell edge 0.024 0.05

Rep. ITU-R M.2415-0 101
The values of spectral efficiency differ depending on location of mobile station in a cell or
transmission modes (e.g. Multicast-broadcast single frequency network (MBSFN)) for a specific
application (e.g. group call)20. In this study, average spectral efficiency is assumed for simplicity. We
also assume a cell is spitted into 3 sectors and due to the cell split total cell capacity is increased
by 2.5 times considering inter-sector interference.
D) Spectrum results considerations
Traffic in kbit/s for each application is divided by spectral efficiency to obtain spectrum needs.
Weighting factor and adjustment factor are assumes as 1 in this study.
2F.3 Traffic parameters
Traffic parameters for broadband PPDR network in PP1 (day-to-day operation), PP2 (large
emergency and public event), DR (disaster) scenarios are considered. Applications are categorized
into voice, data, and video though there are some differences for each agency.
2F.3.1 Individual PPDR Agency Operation
Traffic parameters for major individual PPDR agencies of police, fire brigade and coast guard are
considered. Each parameter of each scenario is assumed as an average value. Traffic parameter values
for PP2 and DR scenarios are presented as below to save pages.
A) Police
In PP1 scenario, commitment of 500 police officers in a cell for daily works such as traffic
enforcement, 112 call incident responses, and special facility security are assumed.
In PP2 scenario, it is assumed that a special event occurs over diameter 4-5 km in Seoul metropolitan
area and 20-30 thousand police officers are committed to the guard operation. In general, base stations
are built densely in metropolitan area to avoid traffic overload in a cell. Thus, it can be assumed that
cell diameter is reduced to 1 km and about 2 500 police officers are crowded within a cell21.
20 The effect on spectrum requirement due to communication at cell edge area and the use of different
transmission mode is discussed in other literatures such as ECC Report 199.
21 In LTE system, cell diameter for 700 MHz band is in the range of 2-3 km.
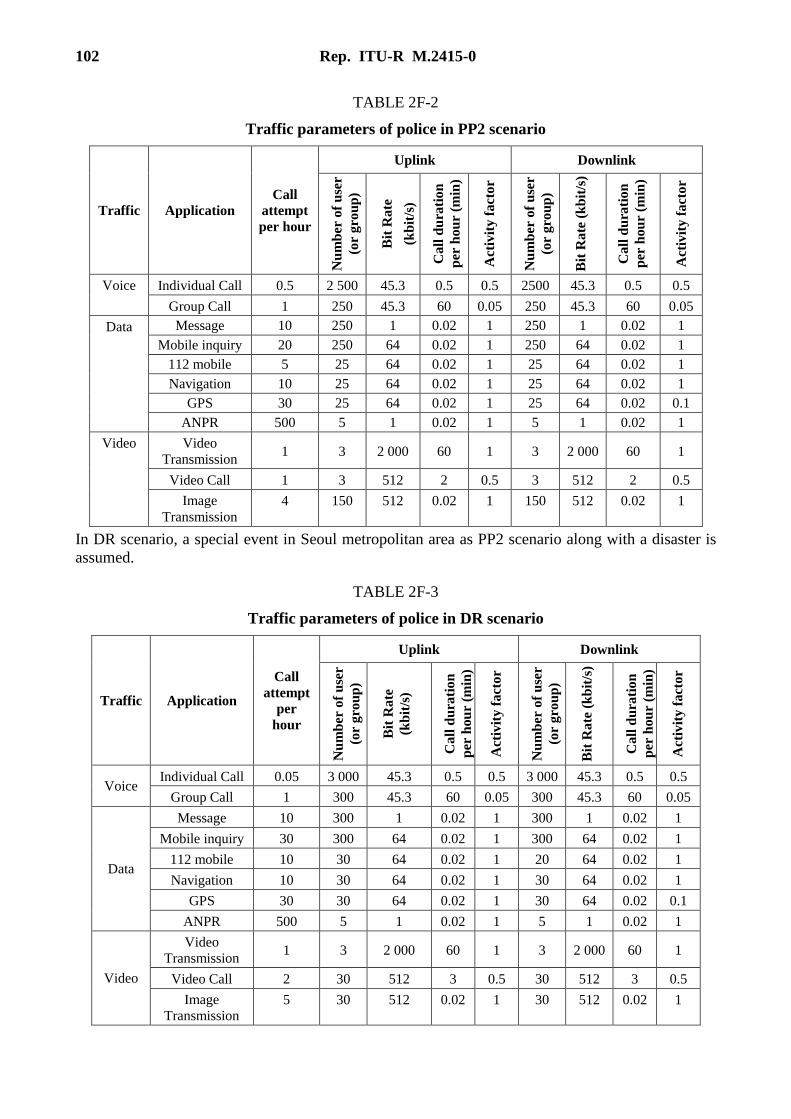
102 Rep. ITU-R M.2415-0
TABLE 2F-2
Traffic parameters of police in PP2 scenario
Traffic Application
Call
attempt
per hour
Uplink Downlink
Nu
mb
er o
f u
ser
(or
gro
up
)
Bit
Ra
te
(kb
it/s
)
Ca
ll d
ura
tio
n
per
hou
r (m
in)
Act
ivit
y f
act
or
Nu
mb
er o
f u
ser
(or
gro
up
)
Bit
Ra
te (
kb
it/s
)
Ca
ll d
ura
tio
n
per
hou
r (m
in)
Act
ivit
y f
act
or
Voice Individual Call 0.5 2 500 45.3 0.5 0.5 2500 45.3 0.5 0.5
Group Call 1 250 45.3 60 0.05 250 45.3 60 0.05
Data Message 10 250 1 0.02 1 250 1 0.02 1
Mobile inquiry 20 250 64 0.02 1 250 64 0.02 1
112 mobile 5 25 64 0.02 1 25 64 0.02 1
Navigation 10 25 64 0.02 1 25 64 0.02 1
GPS 30 25 64 0.02 1 25 64 0.02 0.1
ANPR 500 5 1 0.02 1 5 1 0.02 1
Video Video
Transmission 1 3 2 000 60 1 3 2 000 60 1
Video Call 1 3 512 2 0.5 3 512 2 0.5
Image
Transmission
4 150 512 0.02 1 150 512 0.02 1
In DR scenario, a special event in Seoul metropolitan area as PP2 scenario along with a disaster is
assumed.
TABLE 2F-3
Traffic parameters of police in DR scenario
Traffic Application
Call
attempt
per
hour
Uplink Downlink
Nu
mb
er o
f u
ser
(or
gro
up
)
Bit
Rate
(kb
it/s
)
Call
du
rati
on
per
hou
r (m
in)
Act
ivit
y f
act
or
Nu
mb
er o
f u
ser
(or
gro
up
)
Bit
Rate
(k
bit
/s)
Call
du
rati
on
per
hou
r (m
in)
Act
ivit
y f
act
or
Voice Individual Call 0.05 3 000 45.3 0.5 0.5 3 000 45.3 0.5 0.5
Group Call 1 300 45.3 60 0.05 300 45.3 60 0.05
Data
Message 10 300 1 0.02 1 300 1 0.02 1
Mobile inquiry 30 300 64 0.02 1 300 64 0.02 1
112 mobile 10 30 64 0.02 1 20 64 0.02 1
Navigation 10 30 64 0.02 1 30 64 0.02 1
GPS 30 30 64 0.02 1 30 64 0.02 0.1
ANPR 500 5 1 0.02 1 5 1 0.02 1
Video
Video
Transmission 1 3 2 000 60 1 3 2 000 60 1
Video Call 2 30 512 3 0.5 30 512 3 0.5
Image
Transmission
5 30 512 0.02 1 30 512 0.02 1
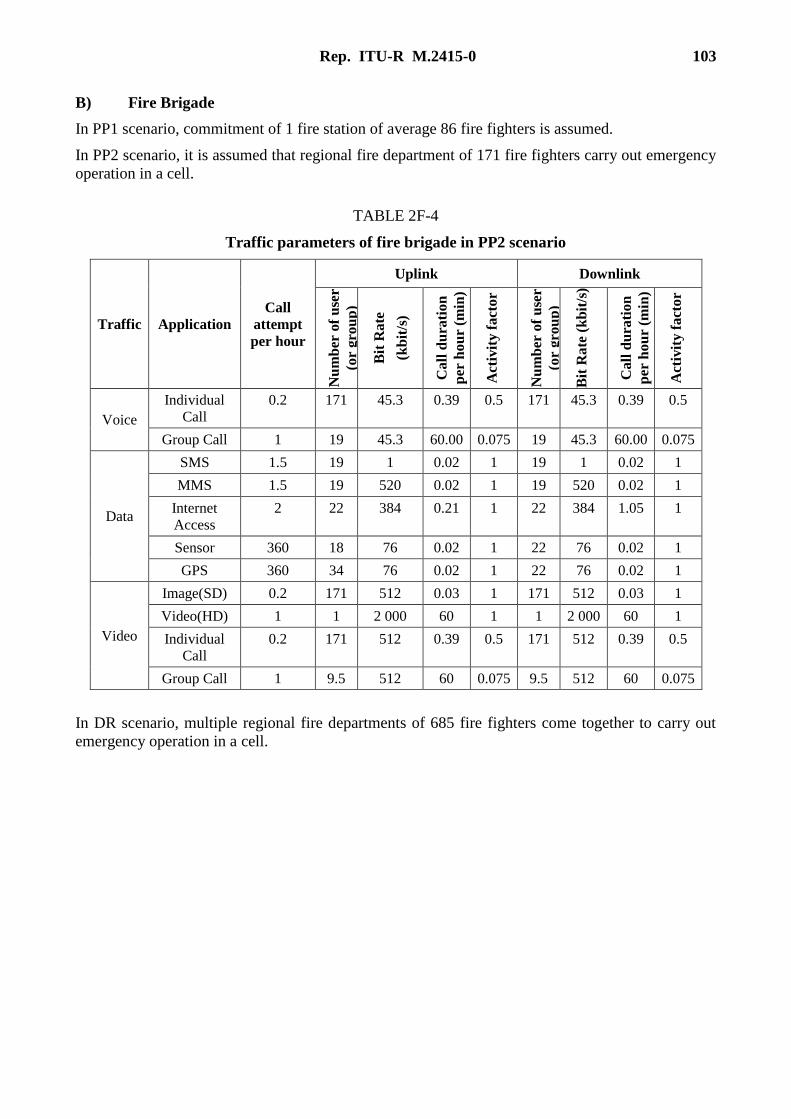
Rep. ITU-R M.2415-0 103
B) Fire Brigade
In PP1 scenario, commitment of 1 fire station of average 86 fire fighters is assumed.
In PP2 scenario, it is assumed that regional fire department of 171 fire fighters carry out emergency
operation in a cell.
TABLE 2F-4
Traffic parameters of fire brigade in PP2 scenario
Traffic Application
Call
attempt
per hour
Uplink Downlink
Nu
mb
er o
f u
ser
(or
gro
up
)
Bit
Ra
te
(kb
it/s
)
Ca
ll d
ura
tio
n
per
ho
ur
(min
)
Act
ivit
y f
act
or
Nu
mb
er o
f u
ser
(or
gro
up
)
Bit
Ra
te (
kb
it/s
)
Ca
ll d
ura
tio
n
per
ho
ur
(min
)
Act
ivit
y f
act
or
Voice
Individual
Call
0.2 171 45.3 0.39 0.5 171 45.3 0.39 0.5
Group Call 1 19 45.3 60.00 0.075 19 45.3 60.00 0.075
Data
SMS 1.5 19 1 0.02 1 19 1 0.02 1
MMS 1.5 19 520 0.02 1 19 520 0.02 1
Internet
Access
2 22 384 0.21 1 22 384 1.05 1
Sensor 360 18 76 0.02 1 22 76 0.02 1
GPS 360 34 76 0.02 1 22 76 0.02 1
Video
Image(SD) 0.2 171 512 0.03 1 171 512 0.03 1
Video(HD) 1 1 2 000 60 1 1 2 000 60 1
Individual
Call
0.2 171 512 0.39 0.5 171 512 0.39 0.5
Group Call 1 9.5 512 60 0.075 9.5 512 60 0.075
In DR scenario, multiple regional fire departments of 685 fire fighters come together to carry out
emergency operation in a cell.

104 Rep. ITU-R M.2415-0
TABLE 2F-5
Traffic parameters of fire brigade in DR scenario
Traffic Application
Call
attempt
per hour
Uplink Downlink
Nu
mb
er o
f
use
r (
or
gro
up
)
Bit
Ra
te
(kb
it/s
)
Ca
ll d
ura
tio
n
per
ho
ur
(min
)
Act
ivit
y f
act
or
Nu
mb
er o
f
use
r (
or
gro
up
)
Bit
Ra
te
(kb
it/s
)
Ca
ll d
ura
tio
n
per
ho
ur
(min
)
Act
ivit
y f
act
or
Voice
Individual
Call
0.2 685 45.3 0.39 0.5 685 45.3 0.39 0.5
Group Call 1 76 45.3 60.00 0.075 76 45.3 60.00 0.075
Data
SMS 3 76 1 0.02 1 76 1 0.02 1
MMS 3 76 520 0.02 1 76 520 0.02 1
Internet
Access
2 30 512 0.39 1 30 512 1.95 1
Sensor 360 70 76 0.02 1 30 76 0.02 1
GPS 360 137 76 0.02 1 30 76 0.02 1
Video
Image(SD) 0.2 685 512 0.03 1 685 512 0.03 1
Video(HD) 1 2 2 000 60 1 2 2 000 60 1
Individual
Call
0.2 685 512 0.39 0.5 685 512 0.39 0.5
Group Call 1 38 512 60.00 0.075 38 512 60.00 0.075
C) Coast Guard
In PP1 scenario, 1 coast guard vessels are committed to respond vessel failure or to transport
emergency patient of island area.
In PP2 scenario, 10 coast guard vessels are committed to carry out searching operation, to respond to
marine oil spill, ship fire and flood.
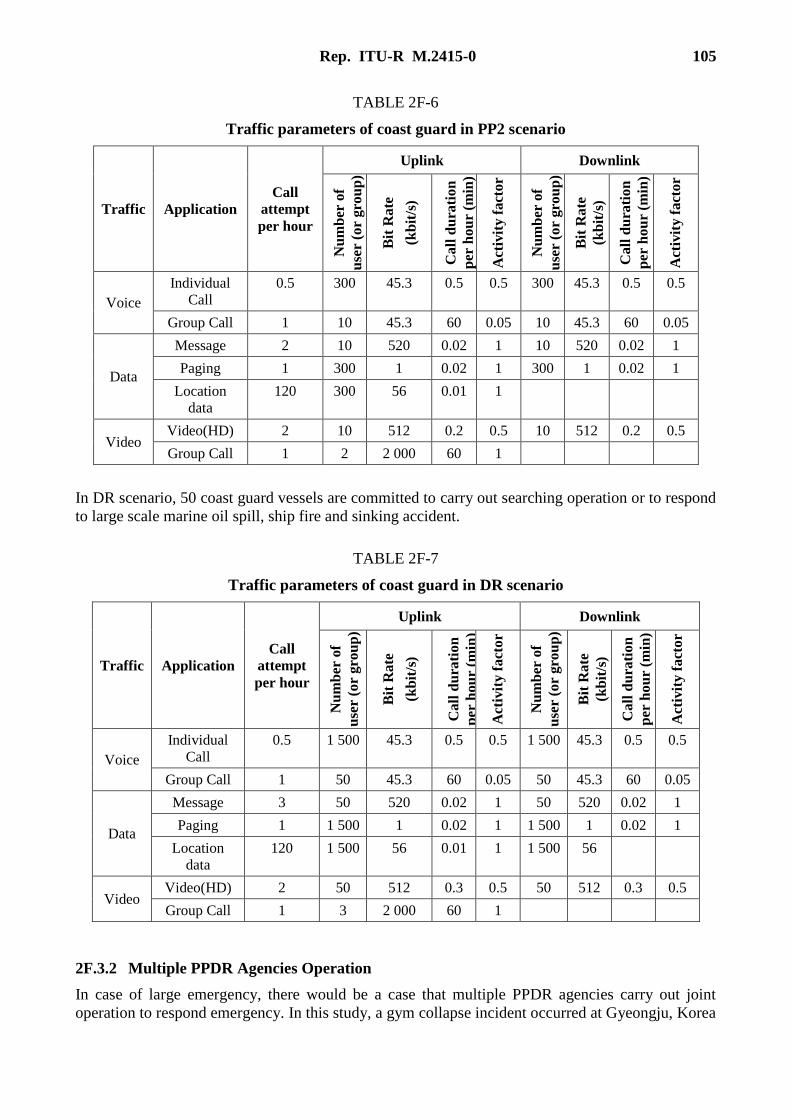
Rep. ITU-R M.2415-0 105
TABLE 2F-6
Traffic parameters of coast guard in PP2 scenario
Traffic Application
Call
attempt
per hour
Uplink Downlink
Nu
mb
er o
f
use
r (
or
gro
up
)
Bit
Ra
te
(kb
it/s
)
Ca
ll d
ura
tio
n
per
ho
ur
(min
)
Act
ivit
y f
act
or
Nu
mb
er o
f
use
r (
or
gro
up
)
Bit
Ra
te
(kb
it/s
)
Ca
ll d
ura
tio
n
per
ho
ur
(min
)
Act
ivit
y f
act
or
Voice
Individual
Call
0.5 300 45.3 0.5 0.5 300 45.3 0.5 0.5
Group Call 1 10 45.3 60 0.05 10 45.3 60 0.05
Data
Message 2 10 520 0.02 1 10 520 0.02 1
Paging 1 300 1 0.02 1 300 1 0.02 1
Location
data
120 300 56 0.01 1
Video Video(HD) 2 10 512 0.2 0.5 10 512 0.2 0.5
Group Call 1 2 2 000 60 1
In DR scenario, 50 coast guard vessels are committed to carry out searching operation or to respond
to large scale marine oil spill, ship fire and sinking accident.
TABLE 2F-7
Traffic parameters of coast guard in DR scenario
Traffic Application
Call
attempt
per hour
Uplink Downlink
Nu
mb
er o
f
use
r (
or
gro
up
)
Bit
Rate
(kb
it/s
)
Call
du
rati
on
per
hou
r (m
in)
Act
ivit
y f
act
or
Nu
mb
er o
f
use
r (
or
gro
up
)
Bit
Rate
(kb
it/s
)
Call
du
rati
on
per
hou
r (m
in)
Act
ivit
y f
act
or
Voice
Individual
Call
0.5 1 500 45.3 0.5 0.5 1 500 45.3 0.5 0.5
Group Call 1 50 45.3 60 0.05 50 45.3 60 0.05
Data
Message 3 50 520 0.02 1 50 520 0.02 1
Paging 1 1 500 1 0.02 1 1 500 1 0.02 1
Location
data
120 1 500 56 0.01 1 1 500 56
Video Video(HD) 2 50 512 0.3 0.5 50 512 0.3 0.5
Group Call 1 3 2 000 60 1
2F.3.2 Multiple PPDR Agencies Operation
In case of large emergency, there would be a case that multiple PPDR agencies carry out joint
operation to respond emergency. In this study, a gym collapse incident occurred at Gyeongju, Korea

106 Rep. ITU-R M.2415-0
in Feb. 2014 is considered. Total number of committed responder is 1 448 which consist of 788 fire
fighters, 500 police officers, 80 local government officials and 80 soldiers.
TABLE 2F-8
Traffic parameters of multiple agencies operation scenario
Traffic Application
Call
attempt
per hour
Uplink Downlink
Nu
mb
er o
f u
ser
(or
gro
up
)
Bit
Ra
te
(kb
it/s
)
Ca
ll d
ura
tio
n p
er
ho
ur
(min
)
Act
ivit
y f
act
or
Nu
mb
er o
f u
ser
(or
gro
up
)
Bit
Ra
te (
kb
it/s
)
Ca
ll d
ura
tio
n p
er
ho
ur
(min
)
Act
ivit
y f
act
or
Voice
Individual
Call
0.1 1 448 45.3 0.39 0.5 1 448 45.3 0.39 0.5
Group Call 1 145 45.3 60 0.075 145 45.3 60 0.075
Data
SMS 3 145 1 0.02 1 145 1 0.02 1
MMS 3 145 520 0.02 1 145 520 0.02 1
Internet
Access
2 30 512 1 1 30 512 20 1
Sensor 360 70 76 0.02 1 70 76 0.02 0.1
GPS 360 145 76 0.02 1 145 76 0.02 0.1
Video
Image(SD) 1 64 512 0.02 1 64 512 0.02 1
Video(HD) 1 3 2 000 60 1 3 2 000 60 1
Video(SD) 1 3 1 000 60 1 3 1 000 60 1
Individual
Call
0.2 788 512 0.39 0.5 788 512 0.39 0.5
Group Call 1 39 512 60 0.075 39 512 60 0.075
2F.3.3 PPDR operation with other public broadband services
Traffic scenario of integrated public broadband service where not only PPDR but also other public
broadband services (e.g. for railway or inshore vessels) is provided. To estimate spectrum need of
integrated service, traffic scenarios can be considered separated by geographical service area of land
and sea. For land area, PPDR and railway broadband services, for sea area, PPDR and inshore vessel
broadband services are used simultaneously. Spectrum needs are determined so as to meet spectrum
needs of all service areas.
In this study, an incident near Seoul station is assumed for land area scenario and traffic parameters
of multiple PPDR agencies as given in § 2F.3.2 is adopted. For sea area scenario, ship sinking near
Busan harbour is considered. In this scenario, PPDR agency officers in harbour area and coast guard
vessels in sea are assumed and broadband service for in shore vessel is also provided simultaneously.
2F.4 Spectrum Needs
Tables 2F-9 and 2F-10 show that for individual PPDR agency operation 2×5 MHz would be sufficient
for PP1, PP2, DR scenarios.

Rep. ITU-R M.2415-0 107
TABLE 2F-9
Uplink spectrum needs for individual PPDR agency operation (MHz)
Agency Police Fire Brigade Coast Guard
Scenario PP1 PP2 DR PP1 PP2 DR PP1 PP2 DR
Voice 0.087 0.437 0.524 0.038 0.211 0.152 0.003 0.028 0.139
Data 0.036 0.060 0.102 0.250 0.322 0.983 0.035 0.165 0.843
Video 0.007 3.326 3.695 1.323 1.460 4.206 1.089 2.186 3.335
Total 0.131 3.822 4.321 1.611 1.992 5.340 1.127 2.379 4.316
TABLE 2F-10
Downlink spectrum needs for individual PPDR agency operation (MHz)
Agency Police Fire Brigade Coast Guard
Scenario PP1 PP2 DR PP1 PP2 DR PP1 PP2 DR
Voice 0.038 0.190 0.228 0.016 0.092 0.066 0.001 0.012 0.060
Data 0.015 0.023 0.003 0.150 0.548 0.352 0.000 0.001 0.011
Video 0.008 1.446 1.607 0.575 0.635 1.829 0.000 0.004 0.030
Total 0.061 1.660 1.838 0.742 1.274 2.247 0.001 0.017 0.102
In case of multiple PPDR agencies operation, 7.4 MHz and 5.2 MHz are needed for uplink and
downlink respectively thus 2×10 MHz should be provided for this case.
TABLE 2F-11
Spectrum needs for multiple PPDR agencies operation (MHz)
Services Voice Data Video Total
Uplink 0.28 1.202 5.869 7.351
Downlink 0.122 2.477 2.552 5.151
When PPDR service is integrated with other public broadband service, spectrum should be provided
to cover all areas (both land and sea). From Table 2F-12, it is shown that broadband services in each
service area can be supported by using 2×10 MHz spectrum.
TABLE 2F-12
Spectrum needs for PPDR operation with other public broadband services (MHz)
Service Area Service Uplink Downlink
Land Area
PPDR 7.35 5.15
Railway Broadband* 2.05 1.85
Sub Total 9.4 7
Sea Area
Coast Guard 4.32 0.1
Inshore Vessel Broadband* 4.89 4.21
PPDR 0.35 0.62
Sub Total 9.56 4.93
* Analysis of spectrum needs for railway and inshore vessel broadband service is presented in separate
report, which will be published in the near future.
108 Rep. ITU-R M.2415-0
2F.5 Conclusion
For individual PPDR agency operation, it is shown that 2×5 MHz spectrum would be sufficient for
all scenarios. In case of multiple PPDR agencies operation, 2×10 MHz should be provided.
Furthermore, in case of integrated public broadband service, services in each service area can be
supported within the range of 2×10 MHz spectrum. Thus, when comparing with individual spectrum
use for each public broadband service where total spectrum needed would be 2×20 MHz, it can be
shown that spectrum can be saved by 2×10 MHz. Furthermore, considering that PPDR spectrum
would be underutilized in day-to-day situation, integration with other public broadband services
would be beneficial in terms of efficient spectrum use.
Spectrum needs in above are analysed based on specific traffic scenarios and average spectral
efficiency thus spectrum deficiency may occur in severe disaster situations. Specifically, HD quality
video transmission identified in demand among Korean PPDR agencies needs considerable spectrum
and it is anticipated that the demand will increase due to the trend of price reduction of high quality
video transmission equipment. Also, spectrum needs may be increased when an incident scene is
located near cell edge where spectral efficiency is significantly low. In this case, spectrum usage can
be limited to a certain level referred to as spectrum cap in ECC Report 199 but users may be subject
to service quality degradation.
To respond to spectrum deficiency, PPDR agencies should take countermeasures to secure additional
communication capacity. For example, a mobile cell site can be installed near cell edge to secure
additional cell capacity and ad-hoc point-to-point or point-to-multi point networks using frequency
such as 5 GHz band recommended as broadband PPDR frequency band in APT/AWF/REC-01(Rev.1)
also can be built to offload heavy traffic due to a hot spot area. Roaming to a commercial network
also can be considered when there is service provision agreement between PPDR agencies and
commercial wireless broadband service provider.
Annex 2G
Estimation of spectrum needs for wireless PPDR systems
using Monte Carlo simulation
2G.1 Overview of approach and method used
The aim of this simulation study by Telstra was to determine the achievable throughput in a more
realistic context, offered by a typical LTE network in various geographic/deployment scenarios for
supporting PPDR operations, taking into account practical network performance.
The particular approach adopted involved three steps: The first step was to implement a realistic
simulation model, using specialised software, of a representative 19-cell LTE ‘network’ in
accordance with previous models used in other studies by ITU-R on IMT systems (specifically LTE
& LTE-Advanced). The simulation then assigned a notional amount of spectrum and placed a number
of user-terminals randomly within each sector in that network. The uplink (UL) and downlink (DL)
signal-to-noise-and-interference ratio (SINR) and propagation loss was logged for a selected user-
terminal. The position of the user-terminal is then randomly moved around within the sector, and the
process is repeated as many times as necessary to achieve statistical accuracy. The output of this step
is a sufficiently large number of sampled SINR and propagation loss data pairs.
Rep. ITU-R M.2415-0 109
The second step of the analysis was to convert each of the SINR and propagation loss values into a
corresponding data throughput using a coverage and capacity dimensioning tool22. The output of this
step is a cumulative distribution of UL and DL throughput in the sector.
The third step is to compare the achievable throughput to PPDR traffic requirements. These
requirements are dependent on the scenario being modelled and would cover day-to-day operational
use and emergency situations of increasing severity.
This three step approach has the advantage that it avoids introducing a priori averaging assumptions
in the estimation of spectrum needs. It models each of the received signal levels taking into account
its propagation path loss and converts each signal level and path loss into a throughput for each user-
terminal location.
2G.2 Background to the study
The rationale for undertaking these studies is to assist administrations in making policy decisions
regarding the provision of wireless broadband PPDR capability – and the opportunity cost versus
economic benefit of various deployment options.
Several administrations have already commenced to plan and deploy wireless broadband PPDR.
Those efforts have already highlighted the considerable capital cost of building dedicated wireless
broadband PPDR networks with high throughput, and the need for careful consideration of the
options. Moreover, studies of network build costs in some countries have shown that required capital
expenditure, amortised over time, is significantly greater than the cost of alternative
deployment/delivery options, such as carrying PPDR traffic as a priority stream on a public mobile
broadband network23. Public mobile broadband networks may therefore be attractive to some
administrations, for economically facilitating broadband capabilities to meet the needs of PPDR
agencies. As such, public network operators also need to consider the additional spectrum occupancy
associated with supporting PPDR traffic – so these capacity studies are equally relevant to dedicated
PPDR and public network based deployment options.
From an overall traffic viewpoint, public LTE networks today serve millions of users using defined
spectrum bandwidth assignments, and noting the growing penchant of users for audio-visual
applications, PPDR traffic and usage scenarios are unlikely to present insurmountable load or latency
issues to public network operators. Thus, as an example of one possible response to a major
emergency scenario, a public wireless broadband network could potentially make all of its bandwidth
available for priority use by PPDR agency users24. In many countries, spectrum assignments to
contemporary public LTE networks may already offer considerably greater traffic capacity compared
to any prospective dedicated PPDR network. As such, and in addition to cost savings, there may be
notable performance advantages for PPDR services delivered over public mobile broadband
platforms. However, careful consideration of the implications of PPDR operations and emergency
traffic levels are still of interest to public network operators for capacity planning purposes.
2G.3 Initial PPDR Spectrum Estimates
The initial PPDR throughput requirements were reported in a number of past contributions to ITU-R,
and documented in this Report (and in previous versions of Report ITU-R M.2377) addressing general
PPDR requirements.
22 Ericsson, Coverage and capacity Dimensioning FDD Recommendation, Release 16A.
23 Public Safety Mobile Broadband, Productivity Commission Research Report, December 2015.
24 Telstra LANES to the rescue: http://www.telstra.com.au/aboutus/media/media-releases/telstra-lanes-to-the-
rescue.xml.
110 Rep. ITU-R M.2415-0
A) Narrowband and Wideband PPDR Spectrum Needs
In particular, Annex 1 of this Report sets out a methodology for determining spectrum needs of
narrow and wideband PPDR systems. The methodology adopted an approach developed for
IMT-2000 technology25 and adapted this for narrowband and wideband PPDR systems. It results in
a relatively high spectrum need primarily because dedicated channels are assumed (activity
factor = 1), and 12 or 21 cell frequency reuse is assumed. However, it has since been recognized that
the spectrum needs are significantly reduced when using LTE systems to provide packet-oriented
PPDR voice, data and broadband capability26,27. For example, if LTE assumptions were substituted
in the analysis in Attachment 1.6 to Annex 1, the spectrum needed for London narrowband voice
would reduce from 17.1 MHz to well under 1 MHz. Narrowband messaging and imaging
requirements will also similarly be significantly reduced when carried on an efficient packet-oriented
LTE network.
B) Broadband PPDR Spectrum Needs
In Annex 2 of this Report, several examples were presented for estimating the broadband PPDR
spectrum needs. While intended to illustrate the minimum spectrum needs, these examples could also
be interpreted as indicating the capacity implications for the case of broadband PPDR functionality
being delivered via public mobile broadband networks. Of particular note, the indicative day-to-day
and general emergency PPDR traffic estimates are relatively low in comparison to current bit-rates
already seen in relation to most public wireless broadband systems in operation today.
In relation to the more extreme spectrum estimates, intended to cater to major disaster events arising
relatively infrequently, it is clear that much of the additional spectrum capacity would lie idle over
quite large coverage areas for long periods of time – unless it were otherwise made available to
alternative usage (such as for public mobile traffic) when not needed for PPDR operations. A further
concern is that the top-down methodology underlying these extreme estimates also arbitrarily infers
that all possible applications are simultaneously required to be delivered to every PPDR user terminal
via a single base-station. In contrast, the bottom-up methodology outlined in this annex adopts a more
realistic approach by determining the effective throughput available from a specified channel
bandwidth, and compares that to the typical capacity required for various PPDR application streams.
C) Implications for Other deployment Options
As noted above, studies of PPDR spectrum needs can be equally used for determining the ability of
public mobile broadband networks to deliver broadband services to PPDR agencies, and the
implications for performance.
A further advantage of public mobile broadband networks is that regular improvements in spectral
efficiency are routinely implemented by network operators to meet increasing user demand as the
technology improves and vendors release hardware and software updates. Such ongoing performance
enhancement represents an investment that public network operators can readily justify, but which
PPDR agencies may find more difficult due to fiscal appropriation constraints typical of many
government agencies.
The analysis in Annex 2 of this Report does not preclude PPDR spectrum needs being met through
use of several frequency bands. For example, in 2011 the Australian Communications and Media
Authority proposed 10 MHz of dedicated low-band FDD spectrum (below 1 GHz) and supplemented
25 Recommendation ITU-R M.1390.
26 FirstNet, First responder Network, http://www.firstnet.gov/network.
27 Final contracts for new emergency services network are signed,
https://www.gov.uk/government/news/final-contracts-for-new-emergency-services-network-are-signed.

Rep. ITU-R M.2415-0 111
by 50 MHz of high-band TDD spectrum (4.9 GHz) be made available for PPDR28]. More recently,
the largest public network operator in Australia (Telstra Corporation) made available its entire
nationwide multi-band commercial LTE network for priority access by PPDR users (based on the
700, 1 800, and 2 600 MHz bands)29.
Additionally, to meet the ‘anytime, anywhere’ expectations of users, contemporary public networks
now typically offer very high outdoor coverage probability – often referred to as ‘coverage depth’.
Most public mobile broadband networks are specifically designed for 90% indoor coverage
probability that, based on typical building attenuation and deployment density values, will result in
an outdoor coverage probability significantly exceeding the 95% to 97% design objective for PPDR30.
2G.4 Wireless Broadband network simulation
A) Defining a model LTE network
As a part of the work of Joint Task Group 4-5-6-7, and which led to identification of additional
spectrum to meet the needs of LTE and LTE-Advanced systems, the ITU-R has already reached a
consensus regarding the relevant parameters and deployment modelling of LTE networks. Those
same modelling methods can also be conveniently used as a starting point for PPDR capacity
prediction. Taking account of the technology characteristics and performance capabilities specified
by 3GPP, the ITU-R methodology included a 19-cell model network, and several sets of alternative
deployment metrics reflecting the differing urban, suburban and rural deployment scenarios.
The 19-cell network and orientation of base stations is illustrated in Figs 2G-2 and 2G-3 in
Attachment 1 to this Annex. The associated base-station and user-equipment parameters are further
set out in Table 2G-2 of Attachment 1 for the urban, suburban and rural deployment scenarios. For
the purposes of the studies in this Annex, the network model was implemented within a widely-
recognised software simulation tool: Transfinite's Visualyse™ radio system and interference analysis
software tool31.
B) Generating the Results
The LTE network model was run as a Monte Carlo simulation, comprised of at least 2 000 ‘snap
shots’ in each run to ensure sufficient statistical accuracy, and all user terminals were moved
randomly in each ‘snap shot’.
The path loss between relevant serving base-station and a representative user-terminal, along with its
SINR, was recorded in each ‘snap shot’, to generate a high-resolution distribution of the resulting raw
data.
The translation of SNIR and path loss into throughput was done using a spreadsheet implementation
of a capacity and network dimensioning tool32 that has now been well proven by the field performance
observations of many LTE network operators around the world.
28 Spectrum for public safety radiocommunications: Current ACMA initiatives and decisions, October 2012,
http://www.acma.gov.au/~/media/Spectrum%20Licensing%20Policy/Issue%20for%20comment/IFC%20
pre%202013/spectrum_for_public_safety%20docx.docx.
29 Telstra LANES to the rescue: http://www.telstra.com.au/aboutus/media/media-releases/telstra-lanes-to-the-
rescue.xml
30 9 - G PPDR quality of service functions p.17.
31 Visualyse Professional V7, http://www.transfinite.com/content/downloadsvisualyse
32 Ericsson, Coverage and Capacity Dimensioning FDD Recommendation, Release 16A.
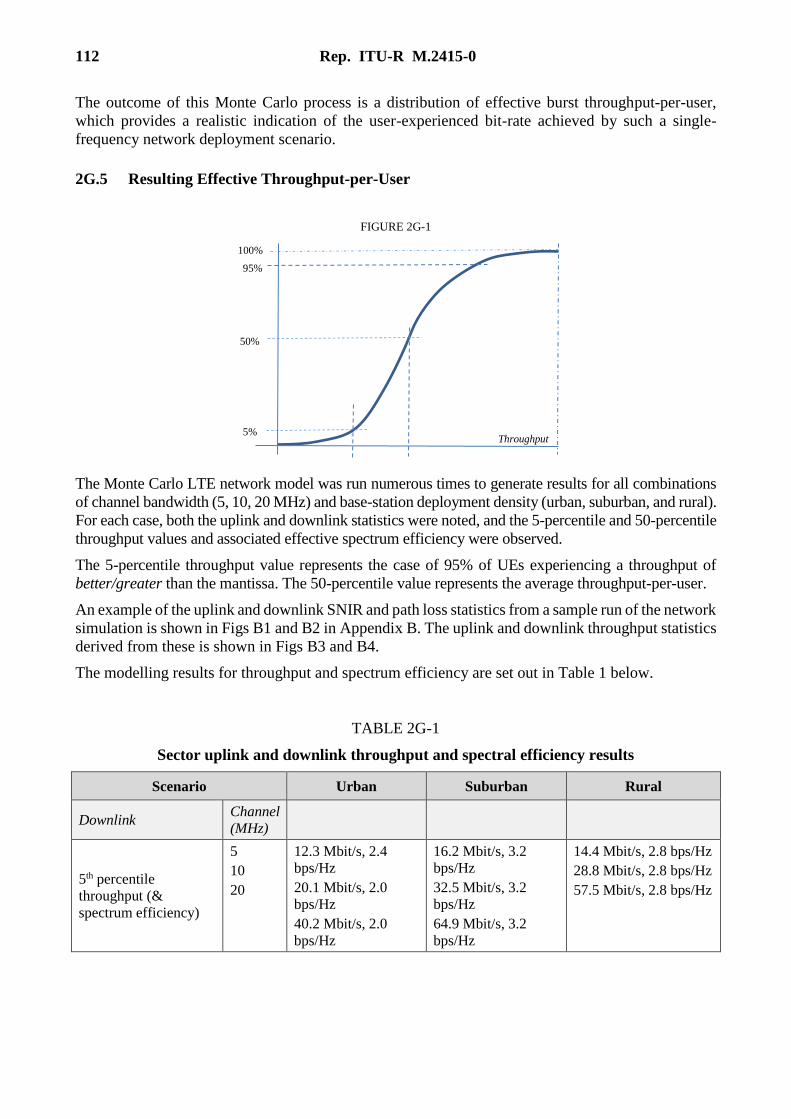
112 Rep. ITU-R M.2415-0
The outcome of this Monte Carlo process is a distribution of effective burst throughput-per-user,
which provides a realistic indication of the user-experienced bit-rate achieved by such a single-
frequency network deployment scenario.
2G.5 Resulting Effective Throughput-per-User
FIGURE 2G-1
The Monte Carlo LTE network model was run numerous times to generate results for all combinations
of channel bandwidth (5, 10, 20 MHz) and base-station deployment density (urban, suburban, and rural).
For each case, both the uplink and downlink statistics were noted, and the 5-percentile and 50-percentile
throughput values and associated effective spectrum efficiency were observed.
The 5-percentile throughput value represents the case of 95% of UEs experiencing a throughput of
better/greater than the mantissa. The 50-percentile value represents the average throughput-per-user.
An example of the uplink and downlink SNIR and path loss statistics from a sample run of the network
simulation is shown in Figs B1 and B2 in Appendix B. The uplink and downlink throughput statistics
derived from these is shown in Figs B3 and B4.
The modelling results for throughput and spectrum efficiency are set out in Table 1 below.
TABLE 2G-1
Sector uplink and downlink throughput and spectral efficiency results
Scenario Urban Suburban Rural
Downlink Channel
(MHz)
5th percentile
throughput (&
spectrum efficiency)
5
10
20
12.3 Mbit/s, 2.4
bps/Hz
20.1 Mbit/s, 2.0
bps/Hz
40.2 Mbit/s, 2.0
bps/Hz
16.2 Mbit/s, 3.2
bps/Hz
32.5 Mbit/s, 3.2
bps/Hz
64.9 Mbit/s, 3.2
bps/Hz
14.4 Mbit/s, 2.8 bps/Hz
28.8 Mbit/s, 2.8 bps/Hz
57.5 Mbit/s, 2.8 bps/Hz
50%
5%
100%
95%
Throughput

Rep. ITU-R M.2415-0 113
50th percentile
throughput (&
spectrum efficiency)
5
10
20
15.1 Mbit/s, 3.0
bps/Hz
28.0 Mbit/s, 2.8
bps/Hz
56.0 Mbit/s, 2.8
bps/Hz
18.1 Mbit/s, 3.6
bps/Hz
36.1 Mbit/s, 3.6
bps/Hz
72.2 Mbit/s, 3.6
bps/Hz
17.0 Mbit/s, 3.4 bps/Hz
34.0 Mbit/s, 3.4 bps/Hz
67.9 Mbit/s, 3.4 bps/Hz
Uplink
5th percentile
throughput (&
spectrum efficiency)
5
10
20
2.2 Mbit/s, 0.44
bps/Hz
2.4 Mbit/s. 0.24
bps/Hz
1.7 Mbit/s, 0.09
bps/Hz
3.8 Mbit/s, 0.8
bps/Hz
11.1 Mbit/s, 1.1
bps/Hz
15.6 Mbit/s, 0.8
bps/Hz
2.2 Mbit/s, 0.4 bps/Hz
7.2 Mbit/s, 0.7 bps/Hz
8.8 Mbit/s, 0.4 bps/Hz
50th percentile
throughput (&
spectrum efficiency)
5
10
20
4.9 Mbit/s, 1.0
bps/Hz
6.7 Mbit/s, 0.7
bps/Hz
8.1 Mbit/s, 0.4
bps/Hz
6.9 Mbit/s, 1.4
bps/Hz
17.2 Mbit/s, 1.7
bps/Hz
28.1 Mbit/s, 1.4
bps/Hz
4.8 Mbit/s, 1.0 bps/Hz
13.1 Mbit/s, 1.3 bps/Hz
19.5 Mbit/s, 1.0 bps/Hz
To put the above throughput values in suitable perspective, it is useful to review typical application
bit-rates:
– Voice – using Adaptive Multi-Rate Wide Band (AMR-WB) coding in normal mobile
environments results in an effective bit rate of about 12.65 kbit/s for superior audio quality
speech and music (i.e. quality better than a 56 kbit/s Rec. ITU-T G.722 signal) – and can
range up to 23.85 kbit/s in adverse background noise environments;
– Audio-visual – for a H.264 composite signal providing HD 720p (1280 × 720) resolution33
for transfer of vehicle/man-mounted surveillance signals, requires an aggregate bit rate of
2.56 Mbit/s (video 2496 kbit/s + audio 64 kbit/s);
– Data records – variable sizes, depending on application, needing burst-rates ranging from
around 0.1-3 Mbits;
– Images/photographs – variable sizes, depending on application, needing burst-rates ranging
from around 0.1-3 Mbits.
The resulting effective throughput-per-user reported above therefore suggests that PPDR users can
expect satisfactory performance via a 5 MHz FDD channel.
2G.6 Conclusions
The simulation studies outlined in this report illustrate examples of greater spectral efficiencies and
correspondingly lower PPDR spectrum needs than have been previously indicated by studies relying
on methodologies such as Recommendation ITU-R M.1390 or other bespoke methods – mainly due
to under-estimation of actual achievable spectral efficiency factor.
Moreover, these results suggest that carriage of wireless broadband PPDR applications over public
mobile broadband networks is generally feasible (even for a 5 MHz channel bandwidth) with better
spectrum efficiency than otherwise assumed, and that broadband PPDR traffic can be readily and
efficiently accommodated ultimately leading to greater overall public benefit.
33 For example, see: http://www.lighterra.com/papers/videoencodingh264/.

114 Rep. ITU-R M.2415-0
Attachment 1
to Annex 2G
Model layout and parameters
FIGURE 2G-2
LTE/LTE-Advanced macro network layout
FIGURE 2G-3
Macro-cell layout34
34 Figure 1, Report ITU-R M.2292-0, Characteristics of terrestrial IMT-Advanced systems for frequency
sharing/ interference analyses, p. 5.
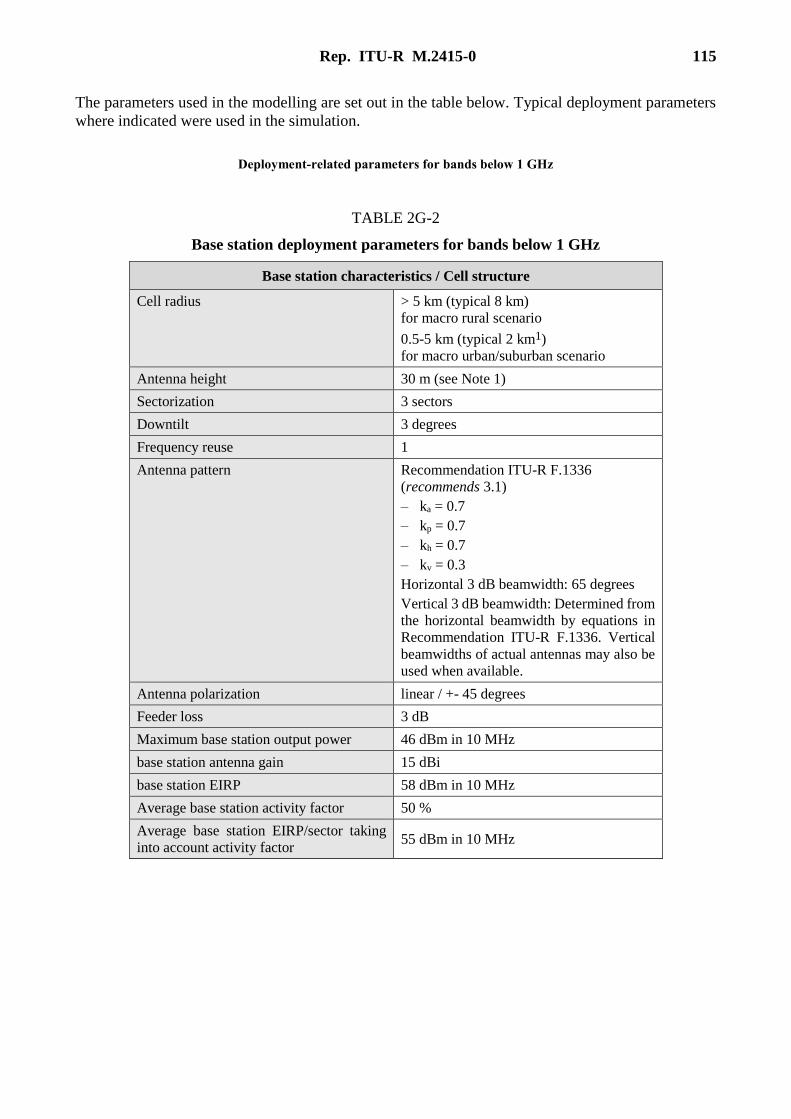
Rep. ITU-R M.2415-0 115
The parameters used in the modelling are set out in the table below. Typical deployment parameters
where indicated were used in the simulation.
Deployment-related parameters for bands below 1 GHz
TABLE 2G-2
Base station deployment parameters for bands below 1 GHz
Base station characteristics / Cell structure
Cell radius > 5 km (typical 8 km)
for macro rural scenario
0.5-5 km (typical 2 km1)
for macro urban/suburban scenario
Antenna height 30 m (see Note 1)
Sectorization 3 sectors
Downtilt 3 degrees
Frequency reuse 1
Antenna pattern Recommendation ITU-R F.1336
(recommends 3.1)
– ka = 0.7
– kp = 0.7
– kh = 0.7
– kv = 0.3
Horizontal 3 dB beamwidth: 65 degrees
Vertical 3 dB beamwidth: Determined from
the horizontal beamwidth by equations in
Recommendation ITU-R F.1336. Vertical
beamwidths of actual antennas may also be
used when available.
Antenna polarization linear / +- 45 degrees
Feeder loss 3 dB
Maximum base station output power 46 dBm in 10 MHz
base station antenna gain 15 dBi
base station EIRP 58 dBm in 10 MHz
Average base station activity factor 50 %
Average base station EIRP/sector taking
into account activity factor 55 dBm in 10 MHz
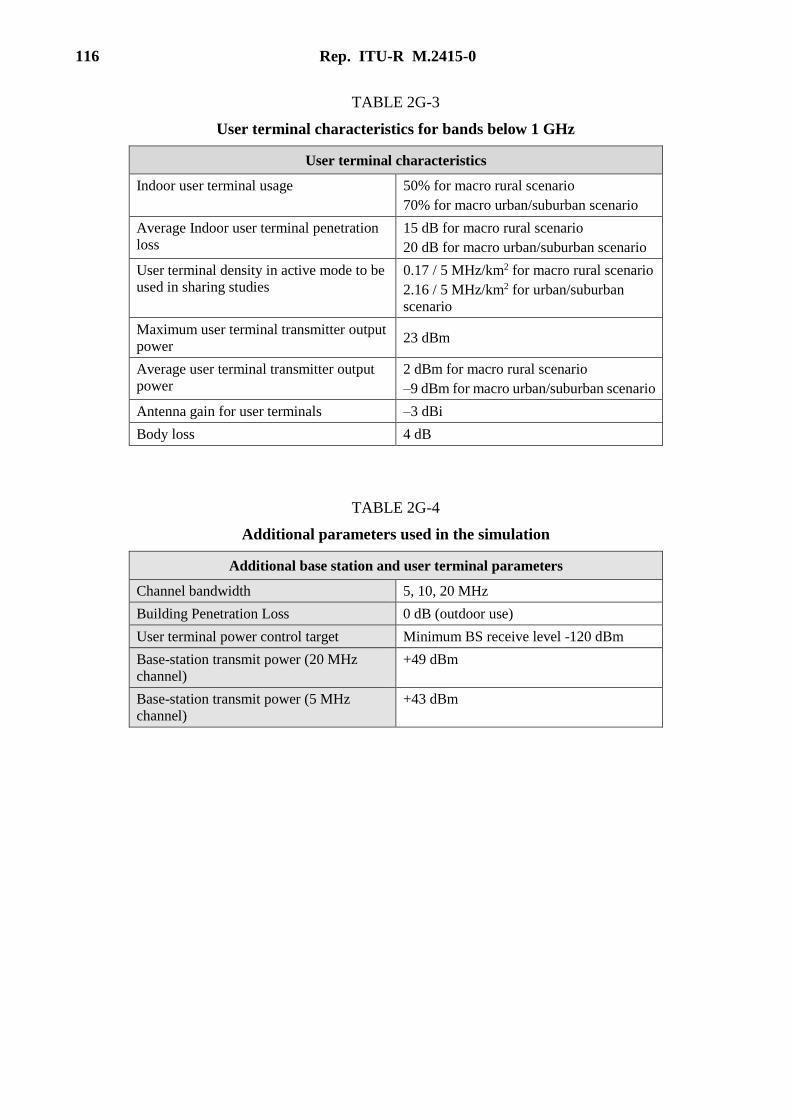
116 Rep. ITU-R M.2415-0
TABLE 2G-3
User terminal characteristics for bands below 1 GHz
User terminal characteristics
Indoor user terminal usage 50% for macro rural scenario
70% for macro urban/suburban scenario
Average Indoor user terminal penetration
loss
15 dB for macro rural scenario
20 dB for macro urban/suburban scenario
User terminal density in active mode to be
used in sharing studies
0.17 / 5 MHz/km2 for macro rural scenario
2.16 / 5 MHz/km2 for urban/suburban
scenario
Maximum user terminal transmitter output
power 23 dBm
Average user terminal transmitter output
power
2 dBm for macro rural scenario
–9 dBm for macro urban/suburban scenario
Antenna gain for user terminals –3 dBi
Body loss 4 dB
TABLE 2G-4
Additional parameters used in the simulation
Additional base station and user terminal parameters
Channel bandwidth 5, 10, 20 MHz
Building Penetration Loss 0 dB (outdoor use)
User terminal power control target Minimum BS receive level -120 dBm
Base-station transmit power (20 MHz
channel)
+49 dBm
Base-station transmit power (5 MHz
channel)
+43 dBm

Rep. ITU-R M.2415-0 117
Attachment 2
to Annex 2G
Example results
FIGURE 2G-4
CDF of uplink SINR for suburban network model for 10 MHz channel bandwidth
FIGURE 2G-5
CDF of downlink SINR for suburban network model for 10 MHz channel bandwidth
0.0%
0.1%
1.0%
10.0%
100.0%
0 10 20 30 40 50
Pro
bab
ility
th
at S
INR
is le
ss t
han
x-v
alu
e
SINR (dB)
0.0%
0.1%
1.0%
10.0%
100.0%
0 10 20 30 40 50 60
Pro
bab
ility
th
at S
INR
is le
ss t
han
th
e x-
valu
e
SINR (dB)
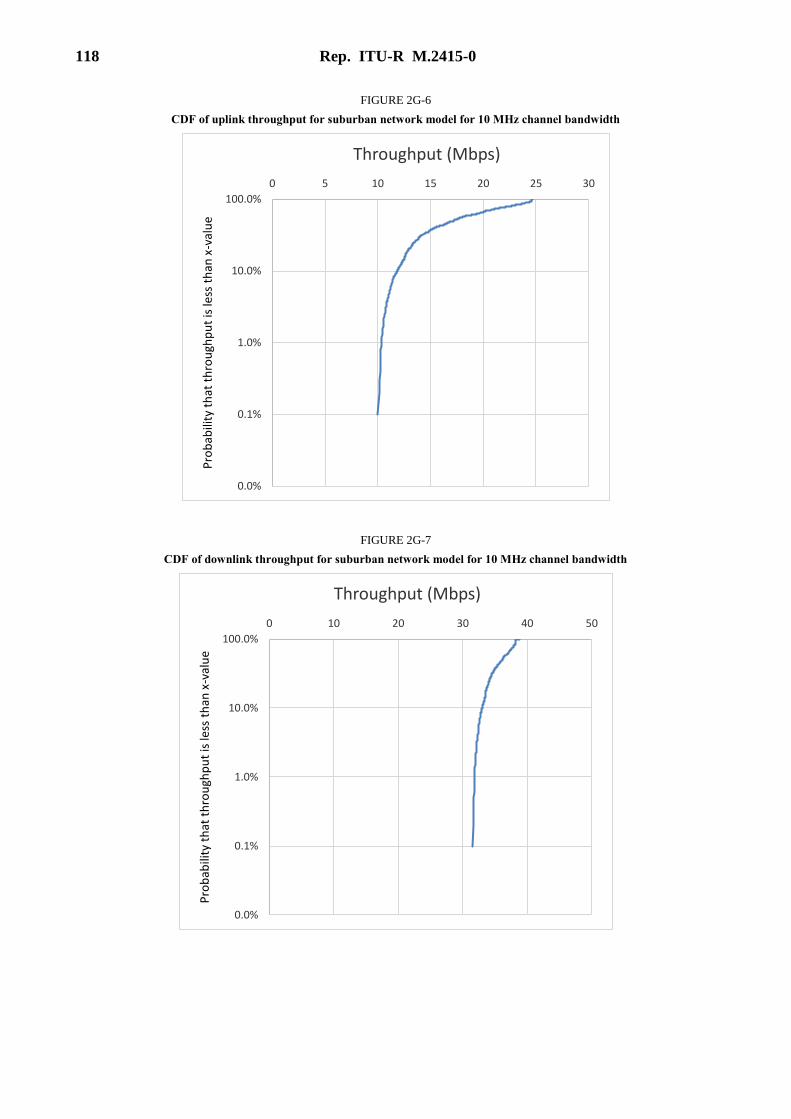
118 Rep. ITU-R M.2415-0
FIGURE 2G-6
CDF of uplink throughput for suburban network model for 10 MHz channel bandwidth
FIGURE 2G-7
CDF of downlink throughput for suburban network model for 10 MHz channel bandwidth
0.0%
0.1%
1.0%
10.0%
100.0%
0 5 10 15 20 25 30
Pro
bab
ility
th
at t
hro
ugh
pu
t is
less
th
an x
-val
ue
Throughput (Mbps)
0.0%
0.1%
1.0%
10.0%
100.0%
0 10 20 30 40 50
Pro
bab
ility
th
at t
hro
ugh
pu
t is
less
th
an x
-val
ue
Throughput (Mbps)
Rep. ITU-R M.2415-0 119
Annex 2H
Spectrum needs for BB PPDR in Tunisia
2H.1 Summary of the spectrum need estimation – Results
After the clearance of the terrestrial broadcasting service from the 700 MHz band in December 2016
in Tunisia following the transition to DTT in lower UHF TV channels (<694 MHz), spectrum
requirements for Broadband PPDR have been studied. It was concluded that to support the data rate
and applications for smart public safety applications, a block of 20 MHz (10+10 MHz paired) is
required. This will be needed for the development of safer and smart communities and for introducing
mission critical data and multimedia applications in daily operations of the security agencies and in
emergency situations.
The block of spectrum, 723-733 MHz for mobile uplinks paired with 778-788 MHz for base station
transmit (downlink), has been identified for the development of a Public Safety broadband network
for PPDR.
______________
Top Related