


Languages
Pages
Legal


Learning objectives
– Comprehensive view of GIS consisting of hardware, software, data, procedures and expert knowledge,
– Differences between GIS and related computer systems, such as graphics, CAD and DBMS,
– Overview of the range of function and tools in GIS, related to tasks in hydrology and water management
•2

Topics
• Introduction
• The concept of GIS.
• Maps and spatial analysis
• Data entry, storage and retrieval
• Computer-based processing of geologic data
• Vector and raster data models and analysis
• Linking digital maps and attribute information
• Spatial interpolation
• Practical application through a real Life GIS project
•3

Introduction
• Growing importance since mid 1980s, in scientific, technical and socio-economic disciplines and public sector
• Large number of different products for a large bandwidth of applications
• Term „Geographic Information System“ (GIS)
• Related to hydrological and water management problems
•4
•5
GIS – SOME DEFINITIONS
• GIS may include manual systems, however, it usually refers to a computerised database system for capture, storage, retrieval, analysis and display of spatial data (Huxhold, 1991).
• GIS is capable of assisting the storage, retrieval and manipulation of spatially referenced data such as street address or a census tract (Nedovic-Budic, 1999).
• GIS is most useful when used to perform data analysis (Lee and Wong, 2001, viii)

•6
An Inelegant Definition for GIS
A system of integrated computer-based tools for end-to-end processing (capture, storage, retrieval, analysis, display) of data using location on the earth’s surface for interrelation in support of operations management, decision making, and science.

What is GIS
•7
• It is a computerized technique used in collecting, processing, analyzing and visualizing data which are connected with geographic locations to get prolific results necessary for decision maker.
• GIS can carry out the traditional Database analyses process such query and statistical analyses.
• Therefore GIS has the ability to carry out the database analyses processes as well as the data visualization of geographic data such as different types of maps, air photo and satellite images.

What is GIS
•8
• GIS technique can be applied in wide different fields, such as Geology, hydrogeology, hydrology, agriculture, mapping, Geography, Environmental issues, Landuse, Survey, Urban planning and others.
GIS is very important due to its ability in:
• Connecting tabular and spatial data
• Processing and analyses of different layers of information simultaneously.
• Supporting decision maker

•9
What is GIS
•GIS takes the numbers and words from the rows and
columns in databases and spreadsheets and puts them
on a map.
+
=
•It allows you to view,
understand, question,
interpret, and visualize
data in ways simply not
possible in the rows and
columns of a
spreadsheet.
•10
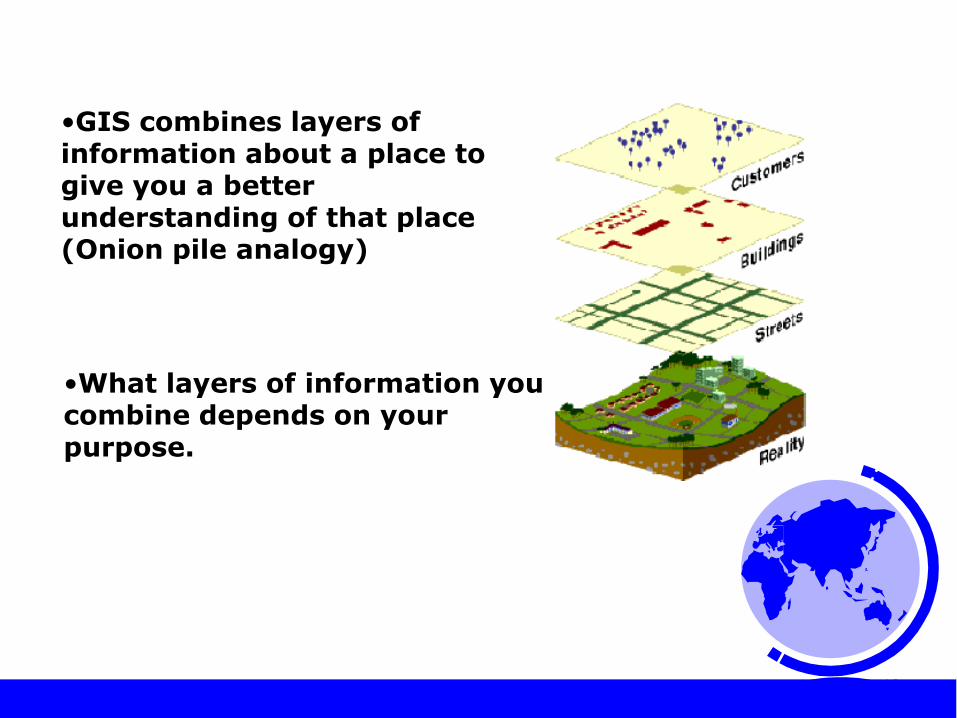
•What layers of information you combine depends on your purpose.
•GIS combines layers of information about a place to give you a better understanding of that place (Onion pile analogy)
History
• GIS on all categories of computers from super
computer to PC and even handhelds
• From cartography to integrative tool
• Integrated, multi-discipline approach
• Parallel development in land register (cadastre),
topographic mapping, thematic maps, CAD (Computer
Aided Design), geography, mathematical analysis of
spatial variability, soil science, surveying, remote
sensing, imaging, spatial planning
•11

History
• Commercially available systems from appr. 1980 (ArcInfo 1981)
• GIS, RIS, LUIS, ...
• GIS for acquisition, storage, analysis, and presentation of spatial data.
• Spatial data are describing elements of reality with respect to
– Position within a coordinate system
– Spatial relationship (topology) like neighbourhood, proximity,
– Properties (attributes) like groundwater table, land use, concentration of pollutants, etc.
•12
History
•13
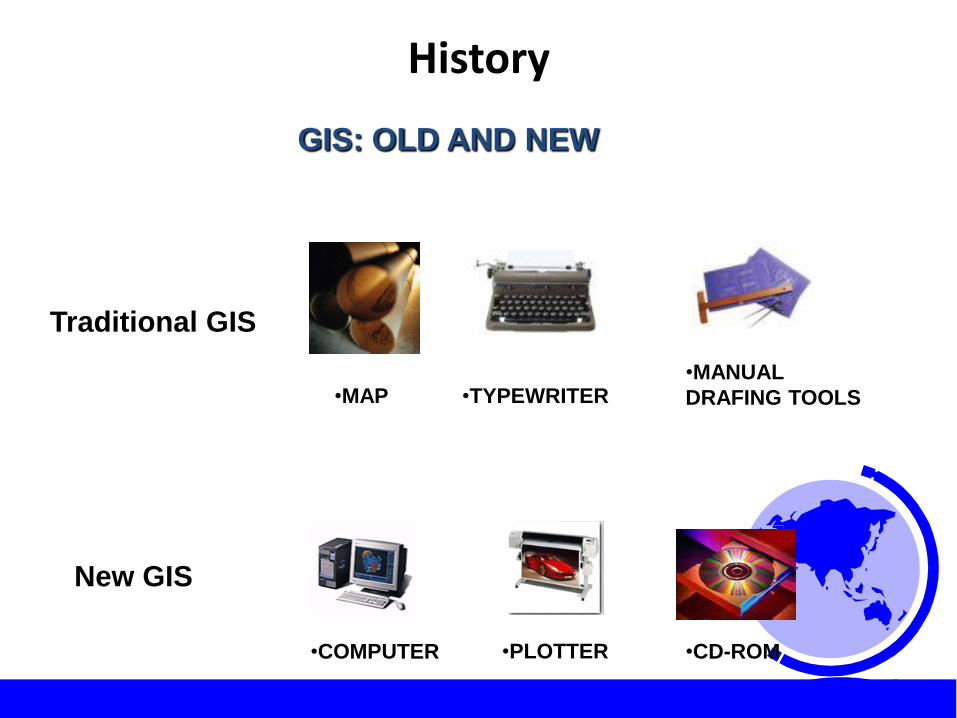
GIS: OLD AND NEW
Traditional GIS
•MAP •TYPEWRITER
•MANUAL
DRAFING TOOLS
New GIS
•COMPUTER •PLOTTER •CD-ROM
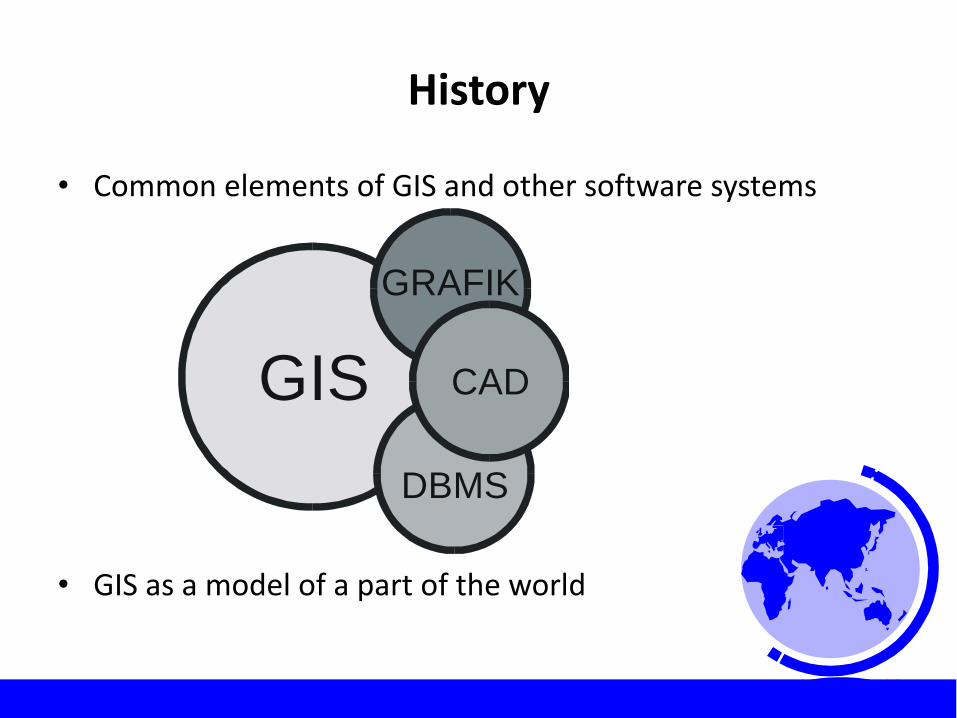
History
• Common elements of GIS and other software systems
• GIS as a model of a part of the world
•14
GIS
GRAFIK
CAD
DBMS

•15
•15
GIS: historical background
This technology has developed from:
– Digital cartography and CAD
– Data Base Management Systems
•1
•2
•3
•ATTRIB
•ID •X,Y
•1
•2
•3
•ID
•1
•2
•3
•CAD System •Data Base Management System

•16
•16 •16
•Digital
•Mapping
•Photo-
grammetry •Computer
•Aided
•Design
•Surveying
•Remote
•Sensing
•Databases
•GIS
•Cross-disciplinary nature of GIS

Why GIS is very important?
•17
• Decrease the time of production and increase work accuracy.
• Decrease the man power pro project.
• Decrease the project budget.
•18
THE NEED FOR GIS
• the real world has a lot of spatial data
– manipulation, analysis and modeling can be
effective and efficiently carried out with a GIS
• the neighborhood of the intended purchase of house
• the route for fire-fighting vehicles to the fire area
• location of historical sites to visit
• the earth surface for purposes of army
• the earth surface is a limited resource • rational decisions on space utilization
• fast and quality information in decision making
•19
THE NEED FOR GIS
complexity of management
– due to the need to combine and process many
sets of data, in addition to judge as many as
possible, situation that might happen.
intense competition
– the need to use technology in making
decisions and strategy in the world of intense
competition.
Advantages of GIS
•20
• It helps in planning of new project and expansion of the existing.
• It helps in handling enormous quantity of information in short time with high accuracy.
• It helps in taking the right decision in short time.
• It helps in distribution of information to a large number of users.
• Merging the spatial and tabular data in one database.

Advantages of GIS
•21
• It helps in analyzing the spatial data with high accuracy.
• It helps in answering, querying, processing of tabular dat.
• It helps in visualizing spatial data.
• It helps in simulation of assumptions of proposals of new projects even before starting in realty.

•22
GIS APPLICATION (I)
• environment
– management of natural resources
• land, forest, marine, etc.
– monitoring/control of environmental pollution
– environment impact study
• infrastructure
– transport and irrigation management and
maintenance
– utility management and maintenance
• electric, water, gas, telephone, etc.

•23
GIS APPLICATION (II)
• socio-economy
– town and country planning
– monitoring of population migration
– disperse of resources/services
• clinics, schools, etc
• military
– land form visualisation
– visibility analysis

•24
• GIS used in multiple disciplines: • Agriculture
• Archaeology
• Architecture/Lanscape Arch.
• Business
• Computer Science
• Environmental Science
• Engineering
• Journalism
• Military Science
• Natural Resource Management
•Geography
•Geology
•Meteorology
•Oceanography
•Law Enforcement
•Public Health
•History
•Sociology
•Urban/Regional Planning
•25
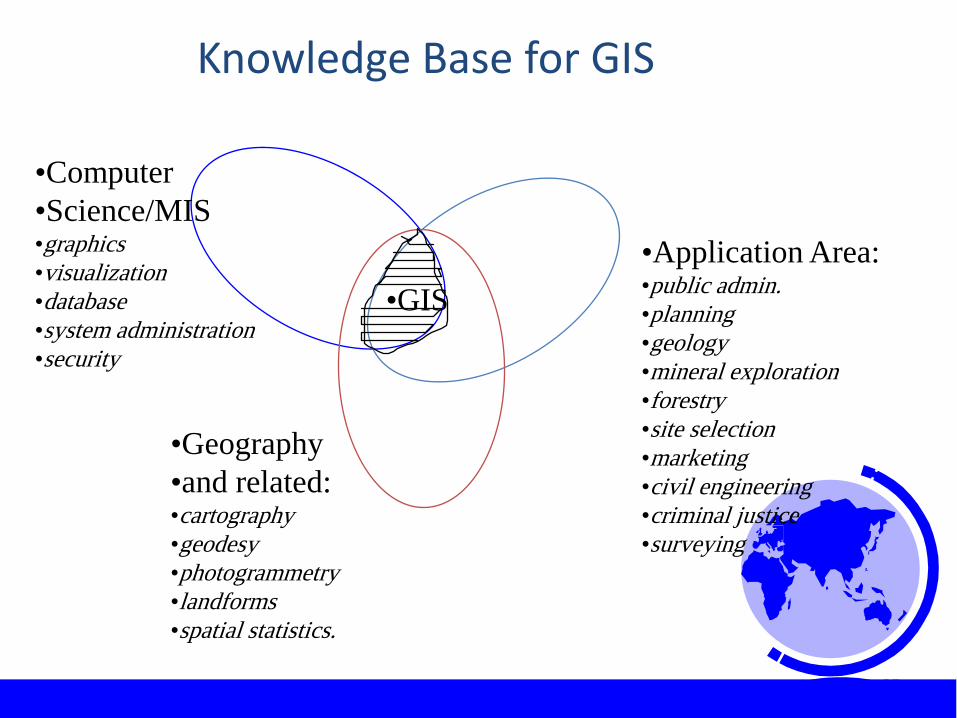
Knowledge Base for GIS
•GIS
•Application Area: •public admin.
•planning
•geology
•mineral exploration
•forestry
•site selection
•marketing
•civil engineering
•criminal justice
•surveying
•Computer
•Science/MIS •graphics
•visualization
•database
•system administration
•security
•Geography
•and related: •cartography
•geodesy
•photogrammetry
•landforms
•spatial statistics.
•26
What do we need to use GIS?
•1) Hardware
•Computers and peripherals needed to install the software on.
•2) Software
•GIS software provides the functions and •tools needed to store, analyze, and display information about places
•27
What do we need to use GIS?
•3) Data
A GIS can use data from a wide range of data formats including images, CAD files, spreadsheets, relational databases, and many more sources
•4) People
Those are the staff using the hardware and software, to display and analyze the data using the available tools.
•5) Training and procedures
Good training will better help understand GIS tasks
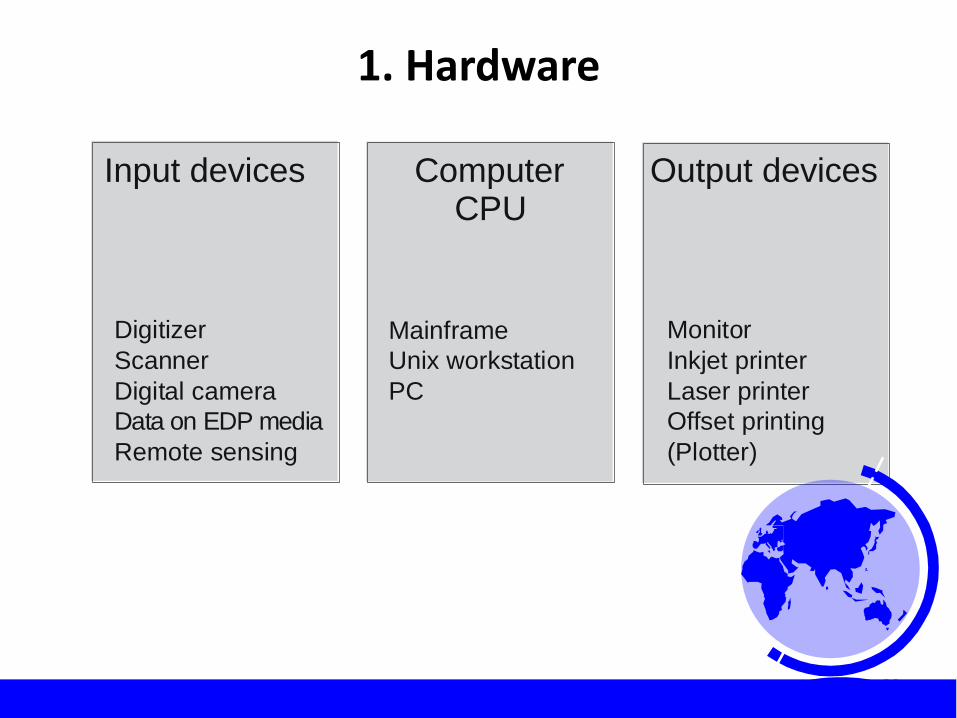
1. Hardware
•28
Input devices ComputerCPU
Output devices
Digitizer
Scanner
Digital camera
Data on EDP media
Remote sensing
Mainframe
Unix workstation
PC
Monitor
Inkjet printer
Laser printer
Offset printing
(Plotter)

•29
• Scanners
• Digitizers
• Printers
• Plotters

Hardware
•30
• Main Frame, Unix workstation units and their installed GIS software are used in handling big projects.
• While for smaller projects, PC in network or in separate manner are used.
• Also GPS are used in gathering accurate coordinates
Software
•31
• Software gives tools, procedures and ability to store, posses and visualize the spatial data.
•
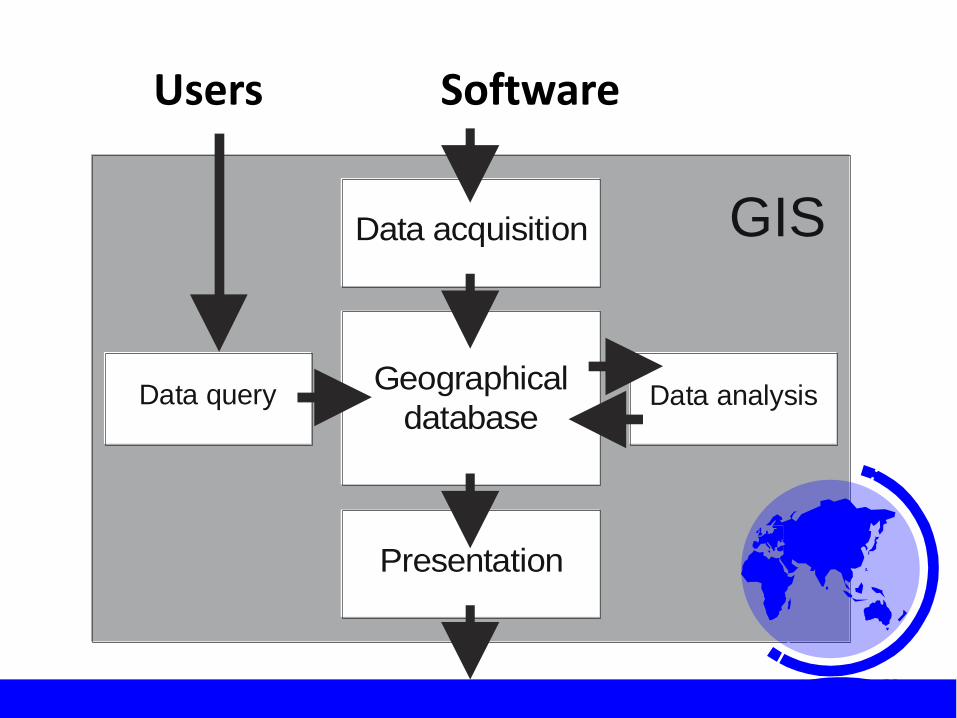
Users Software
•32
GISData acquisition
Data query Data analysisGeographical
database
Presentation
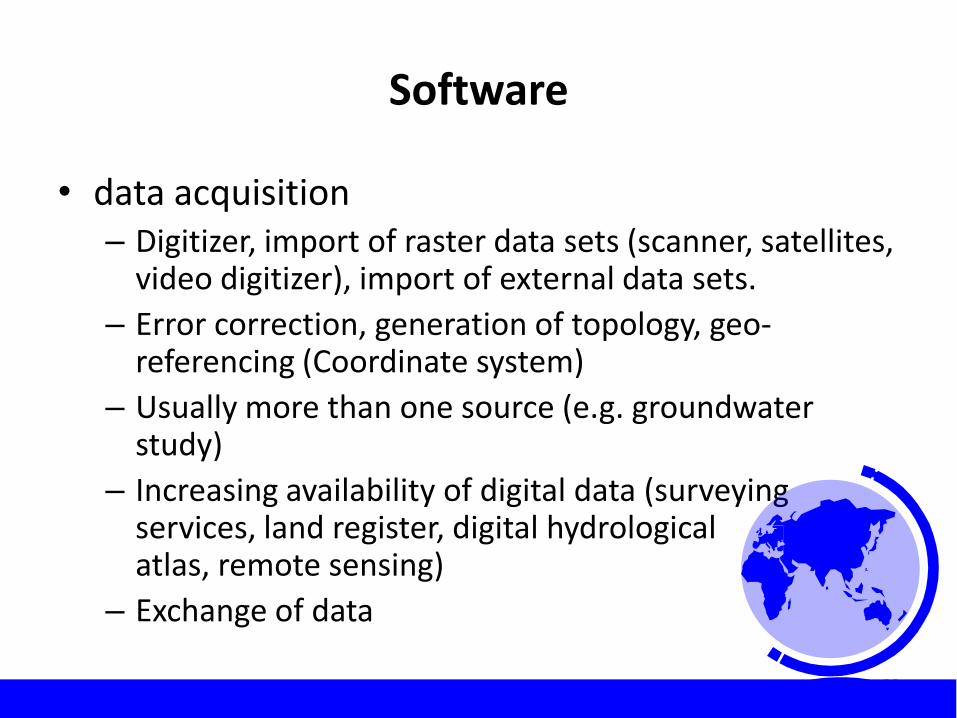
Software
• data acquisition – Digitizer, import of raster data sets (scanner, satellites,
video digitizer), import of external data sets.
– Error correction, generation of topology, geo-referencing (Coordinate system)
– Usually more than one source (e.g. groundwater study)
– Increasing availability of digital data (surveying services, land register, digital hydrological atlas, remote sensing)
– Exchange of data
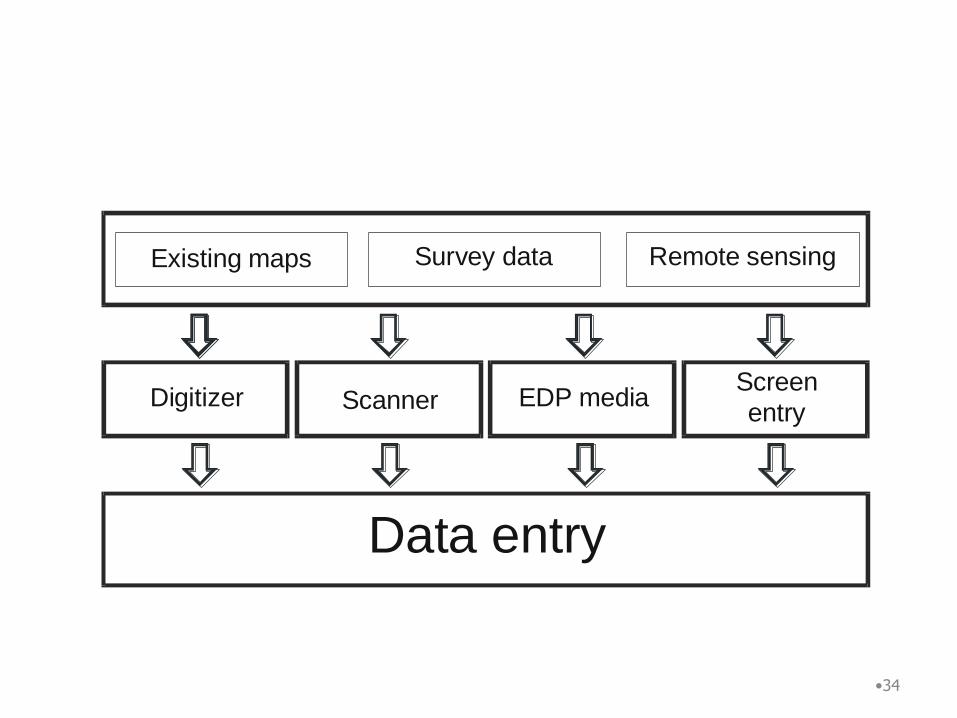
•33
•34
Existing maps Survey data Remote sensing
Data entry
Digitizer EDP mediaScreen
entryScanner
Software
• Data management: organisation, structuring and storage
– Reliable storage,
– Efficient access and unified interface for all software components to the data.
– Organisation of information about a specific region usually organised by layers
•35

Software
•36
• Analysis: geographical database turns into an information system – Where is object A? The GIS reports the coordinates,
e.g., of a monitoring site, or displays a map whith the object highlighted
– Where is A in relation to B? The potential polluter (A) is within (outside of) the wellhead protection area (B)
– How many objects of type A are within a distance D of B? How many monitoring wells (A) are available within the estimated extent (D) of a well‘s cone of depression? buffer zones around object

Software
•37
– What is the value of function z at location x? E.g., the groundwater tables at some wells are given. For location x, the value of function z, here groundwater table, is to be interpolated.
– How large is B? Area, perimeter and length are often automatically managed by GIS. Used, e.g. to evaluate areal statistics for time-area diagrams.
– Which objects are adjacent to objects with a given combination of properties? Which land parcels are crossed by a planned irrigation canal?
– Combination of objects with a given combination of properties. Suitability of land for a desired use.
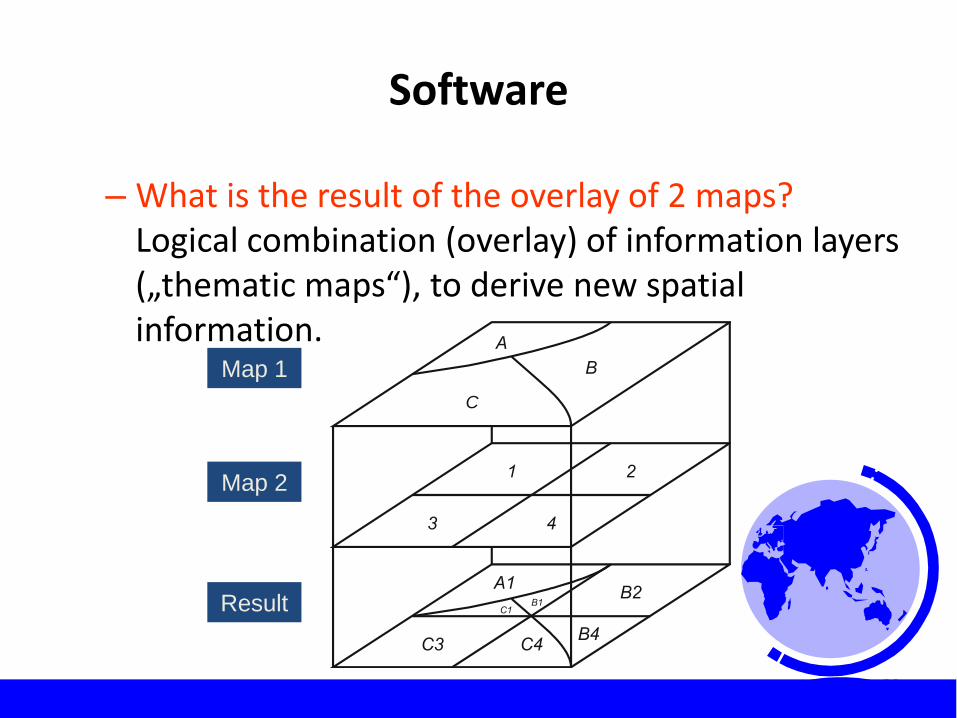
Software
– What is the result of the overlay of 2 maps? Logical combination (overlay) of information layers („thematic maps“), to derive new spatial information.
•38
C
Karte 1
Karte 2
Ergebnis
Map 1
Result
Map 2
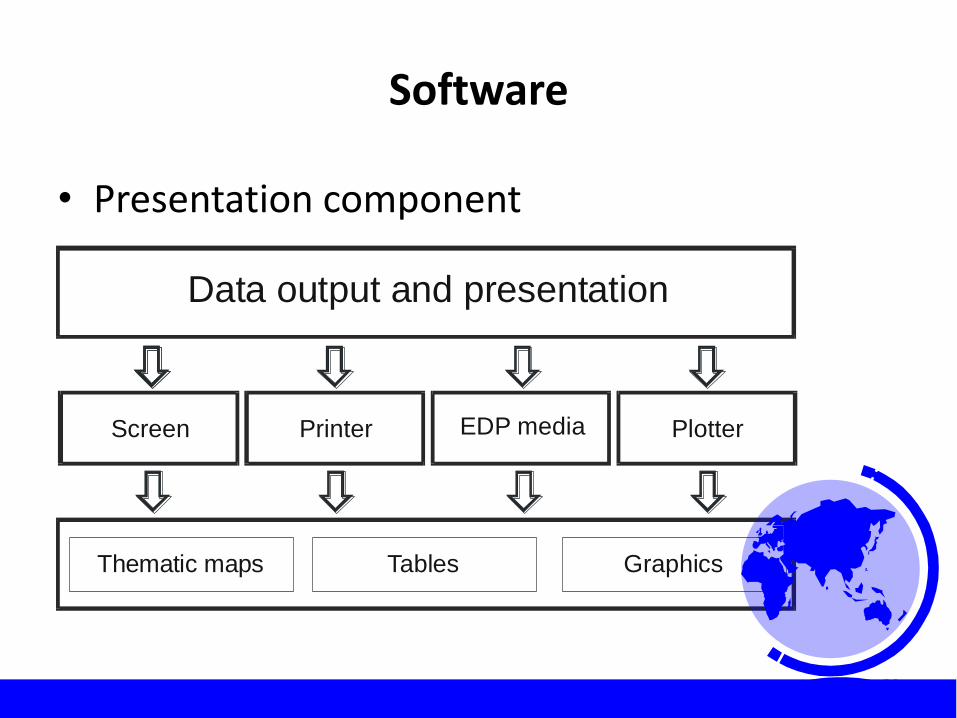
Software
• Presentation component
•39
Thematic maps Tables Graphics
Data output and presentation
Screen EDP media PlotterPrinter

Tools (functions) in GIS
• Differences in the focus depending on specific software product
– E.g. ArcInfo Workstation:
• Data capture and automation
• Error refinement and verification
• Coordinate transformation
• Topology generation and update
• Generalization tools
• Attribute automation and update
• Database construction
• Analysis and manipulation
• Display and query
• Using menus
• Dynamic segmentation
• GRID analysis
• IMAGE analysis
• Database integration
• TIN
•40
•41
Summary
• GIS are computer based systems to acquire, manage, analyse and present spatial information.
• Development started in the 1960‘s, breakthrough in widely spread application in environmental information systems occured in the 1980‘s.
• A GIS should be seen not only as a software package, but rather as a comprehensive system, consisting of hardware, software, data and users.
•42
2 Data; Vector, Raster, and CAD

•43
Geographical data models and geographical data primitives
• geographical data primitives : points, lines, polygons (vector model)
• Pixels (raster model)
1 2 3 4 5 62
3
4
5
6
7
x
y
a
b
cd
a a1 a2 …
1 2 3 4 5 62
3
4
5
6
7
x
y1 2
3
4
5
6
ab
c d
e
a a1 a2 …
1 2 3 4 5 62
3
4
5
6
7
x
y
a a1 a2 …
•43
Value Land cover
1
2
3
forest
grassland
farmland
Columns
Origin (upper left cell)
Rows
Cell size

•44
• Vector models
– simple points, lines and polygons
– complex points, lines, polygons and objects • More complex definitions of points, lines and polygons can be
used to capture the internal structure of an entity; functional or descriptive.
• E.g.: ‘city’ contains streets, houses and parks, each having different functionality and may respond differntly to queries or operations.
• Object-oriented systems support a hierarchical construction of objects from simple building blocks and a framework for description of properties as well as behaviour.
•45
Points
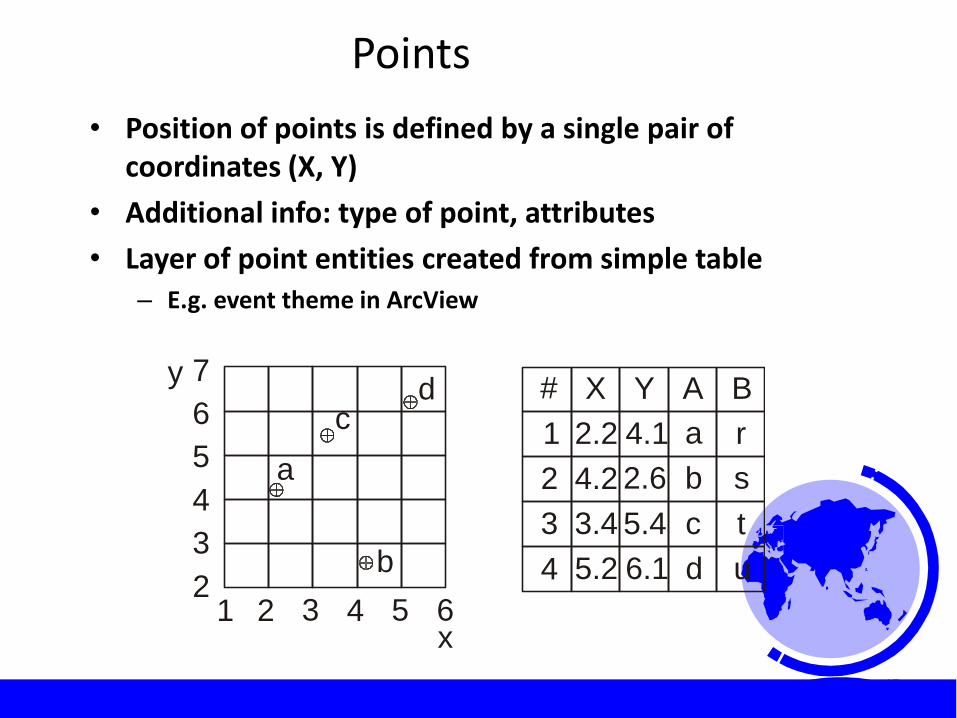
• Position of points is defined by a single pair of coordinates (X, Y)
• Additional info: type of point, attributes
• Layer of point entities created from simple table – E.g. event theme in ArcView
•45
1 2 3 4 5 6
2
3
4
5
6
7
x
y
a
b
cd # X Y A B
1
2
3
4
a
b
c
d
r
s
t
u
2.2 4.1
4.2
3.4 5.4
5.2 6.1
2.6

•46
Lines
• Sequence of (X, Y) coordinate pairs and connecting straight lines or curves
1 2 3 4 5 62
3
4
5
6
7
x
y
1
2
X Y
2.2 4.1
5.4
X Y
4.2 2.6
5.2 6.1
4.3
#
1
2
A B
a
b
r
s
#1: #2:
•46
•47
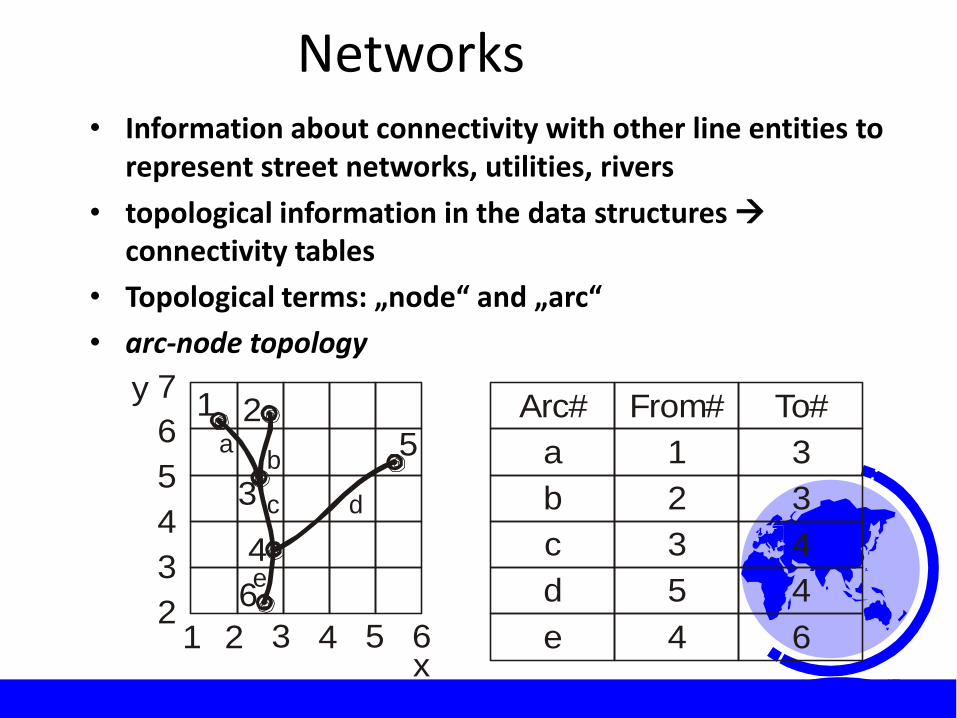
Networks • Information about connectivity with other line entities to
represent street networks, utilities, rivers
• topological information in the data structures connectivity tables
• Topological terms: „node“ and „arc“
• arc-node topology
•47
1 2 3 4 5 62
3
4
5
6
7
x
y1 2
3
4
5
6
ab
c d
e
Arc# From# To#
d 5 4
c 3 4
a 1 3
b 2 3
e 4 6
•48
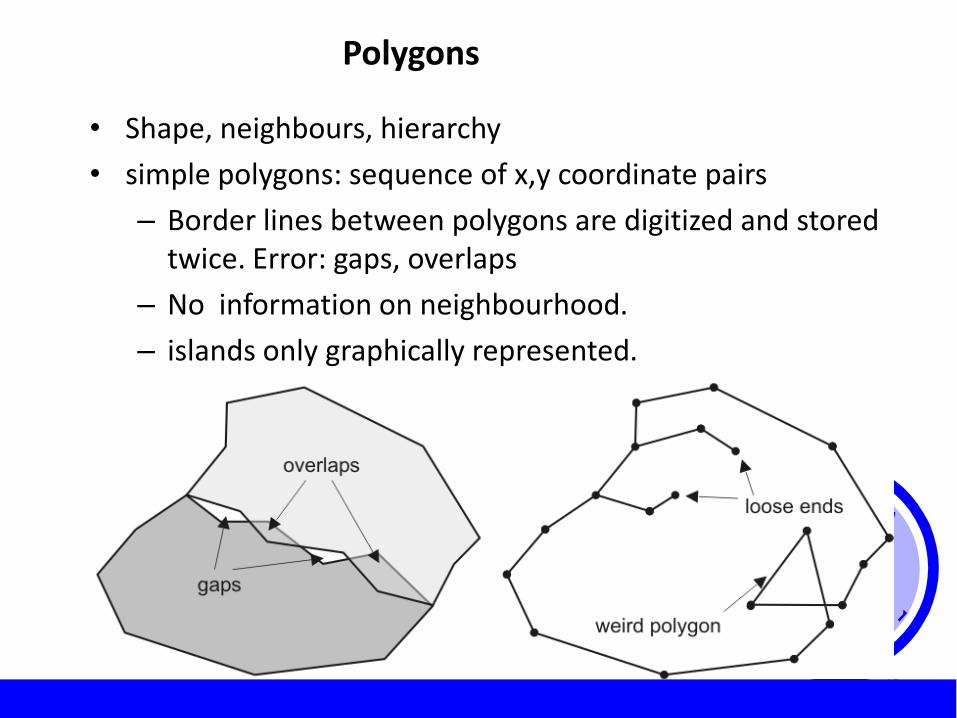
Polygons
• Shape, neighbours, hierarchy
• simple polygons: sequence of x,y coordinate pairs
– Border lines between polygons are digitized and stored twice. Error: gaps, overlaps
– No information on neighbourhood.
– islands only graphically represented.
– Difficult to validate
•48
•49
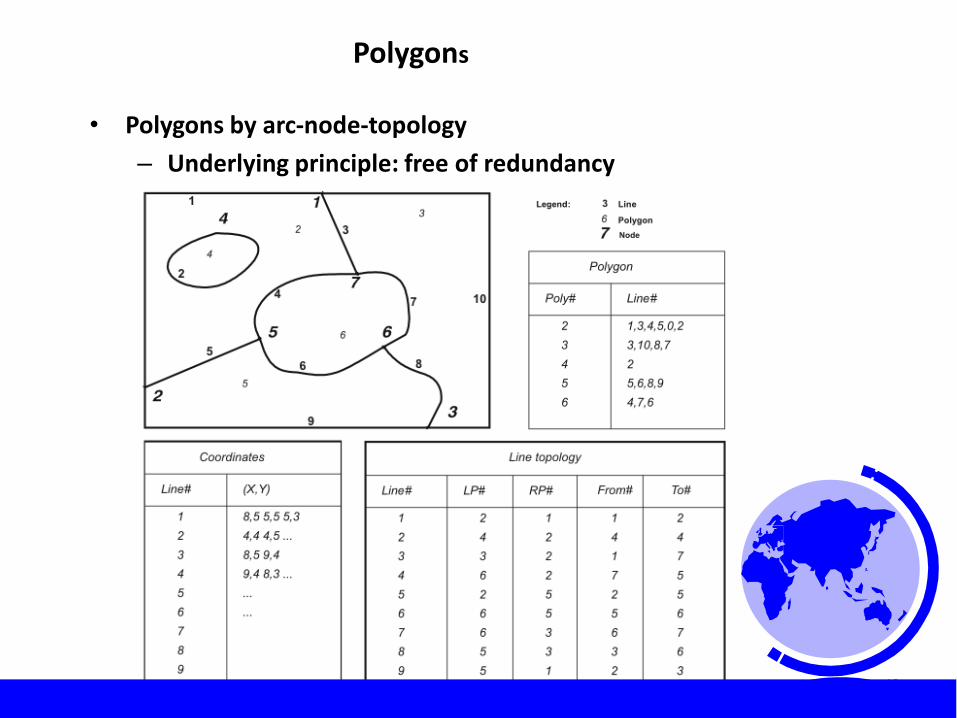
Polygons
• Polygons by arc-node-topology
– Underlying principle: free of redundancy
•49

Raster models
– Mainly integer grids with lookup table of categories
– Loss of spatial resolution
•50 •50

•51
Data organisation in raster data structures
• Raster resembles photo
• 3 ways to interprete a pixel
– classification: a range of values is allocated to certain objects (gray pixels are roads, blue pixels are water surfaces,...).
– measure the value: intensity of a colour, concentration, etc.
– relative height over reference height.
•51
•52
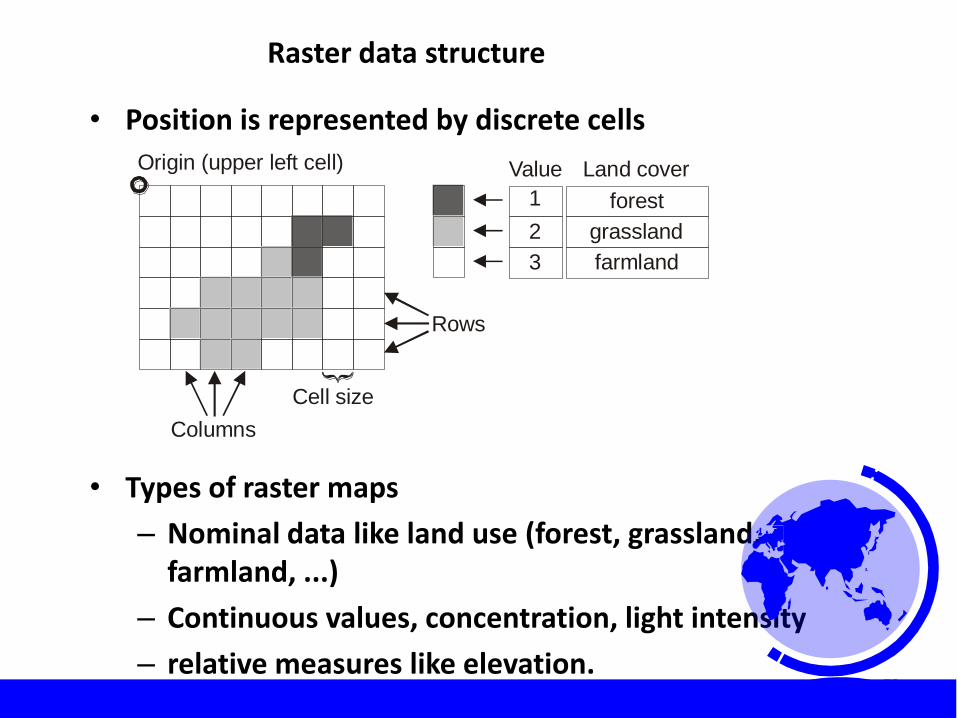
Raster data structure
• Position is represented by discrete cells
• Types of raster maps
– Nominal data like land use (forest, grassland, farmland, ...)
– Continuous values, concentration, light intensity
– relative measures like elevation.
•52
Value Land cover
1
2
3
forest
grassland
farmland
Columns
Origin (upper left cell)
Rows
Cell size
•53
•53
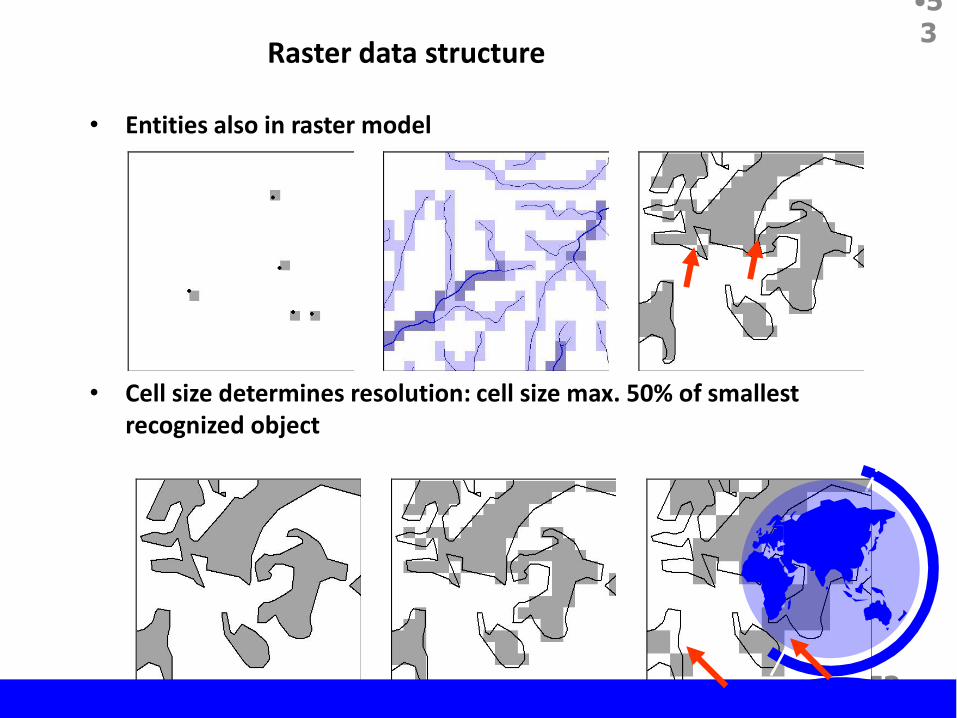
Raster data structure
• Entities also in raster model
• Cell size determines resolution: cell size max. 50% of smallest recognized object
•53
•54
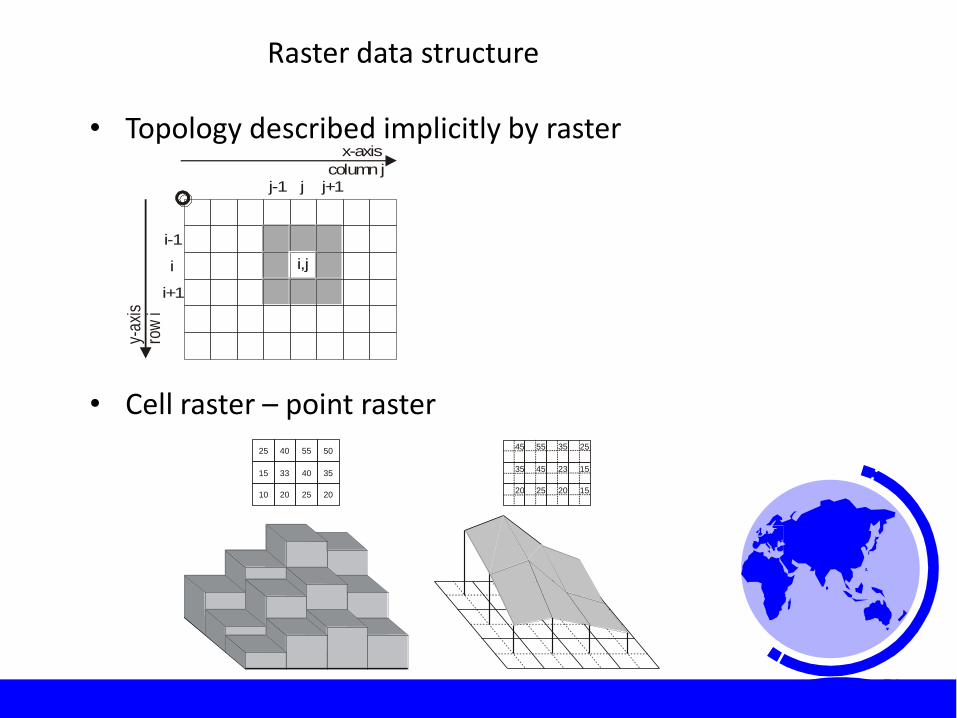
Raster data structure
• Topology described implicitly by raster
• Cell raster – point raster
50554025
35403315
20252010
25355545
15234535
15202520
Zellraster Punktraster
i,ji
i+1
i-1
jj-1 j+1
x-axisy-
axis
column jro
w i
Cell Raster Point Raster •54

•55
• Pictures can be used as map displays (e.g. satellite image, orthophoto) or also as attribute information (e.g. pictures of the measuring instruments linked to the measuring points on a measuring point map, photo of the houses in the information system of a real estate agent).
•55
•56
•56
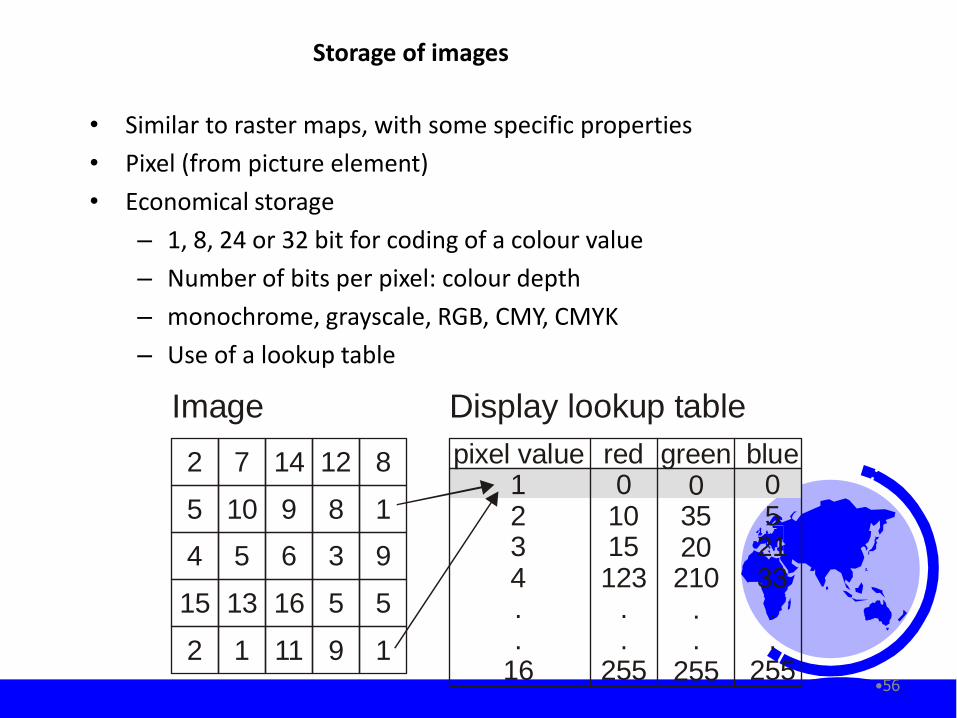
Storage of images
• Similar to raster maps, with some specific properties
• Pixel (from picture element)
• Economical storage
– 1, 8, 24 or 32 bit for coding of a colour value
– Number of bits per pixel: colour depth
– monochrome, grayscale, RGB, CMY, CMYK
– Use of a lookup table
pixel value1234..
16
red0
1015123
.
.255
green0
3520210
.
.255
blue05
2133..
255
Display lookup tableImage
2 7
5 10
1214 8
9 8 1
4 5 9
16
6
15 13 5 5
2 1 11 9 1
3

•57
•57
Georeferencing of images
• Depending on the orientation of the coordinate system, objects equal in nature are represented differently in the raster model
• If distortions of image are small (flat terrain) georeferencing by affine projection with >= 4 ground control points (polynomial transformation).
• Pixel are re-computed by interpolation or areal averaging, according to the type of variable loss of information

•58
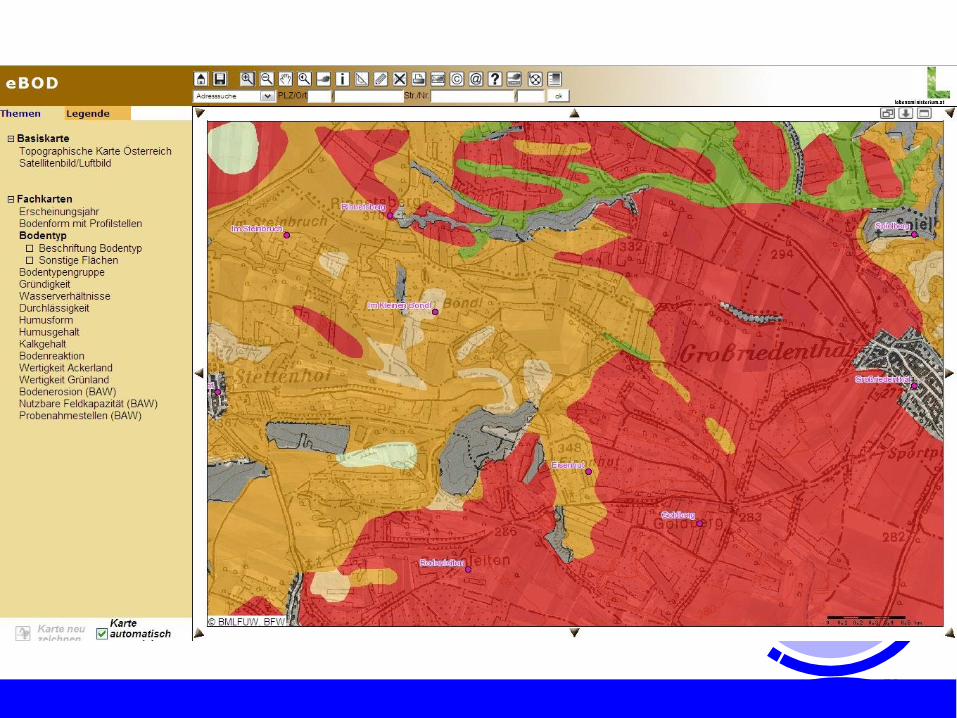
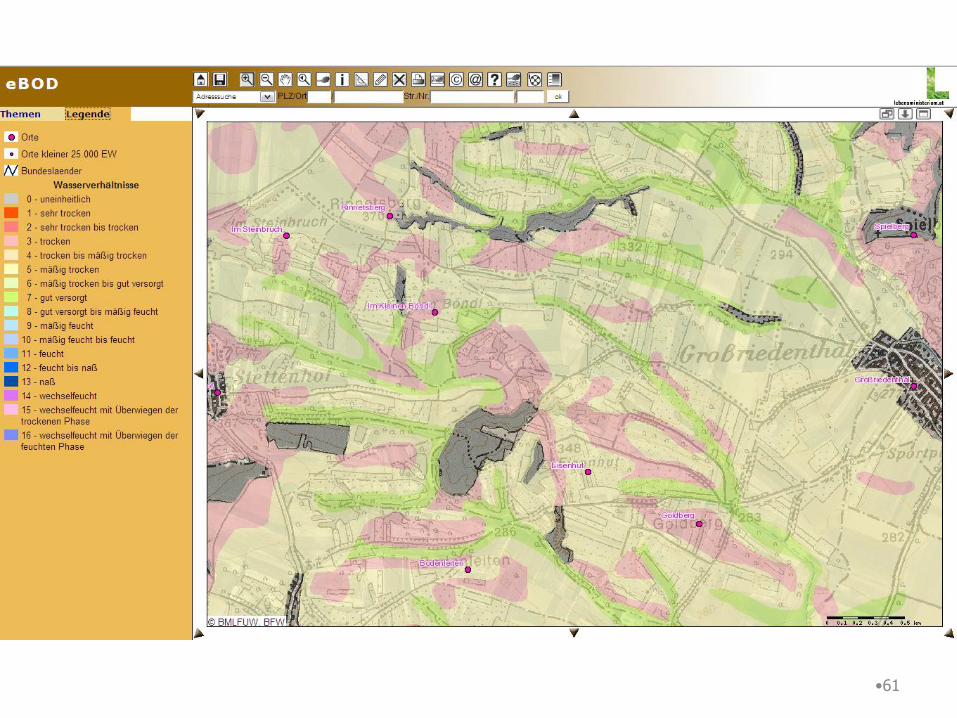
• Raster model can also represent points, lines and polygons
• Loss of spatial resolution, because location is only expressed by multiples of pixel size
• Contour maps: Entities or fields?
• e.g: soil map
•59

•60
•61

•62

•63
Triangulation of continuous fields
• Node list and triangle list
• Optimal TIN by Delaunay criteria
1
2
3
4
1
2
3
4
2 possible triangulations for 4 given points
1
2
3
4
This triangulation the Delaunay criteria, because the circle around triangle 1, 4, 3 contains node 2.
fails This triangulation the Delaunay criiteria because a circle around each triangle contains no other node
satisfies
1
2
3
4
5
67
8
A B
C
DE
F
G
TriangleABCDEFG
Node list1,2,32,4,34,5,35,6,33,6,81,3,86,7,8
Neighbours-,B,F-,C,A-,D,B-,E,CD,G,FA,E,--,-,E
TIN list of triangles
- no neighbour

•64
3 The Concepts of GIS
•65
GIS Concepts
• GIS Concept #1:
• Features have attributes associated with them.
• These attributes describes the properties and characteristics of these features.
• Each Feature on the map has one record in the database associated with it.

•66
GIS Concepts
•Example:
•Using GIS we can map the location of wells, and identify which attributes belong to which well.
•We can know what information relates to which well

•67
GIS Concepts
• GIS Concept #2:
• Information is separated into layers.
• Each layer carries information about features of the same type (streets, rivers)
• Layers represent data in a variety of ways (Raster, Vector or Tin layers)
•68
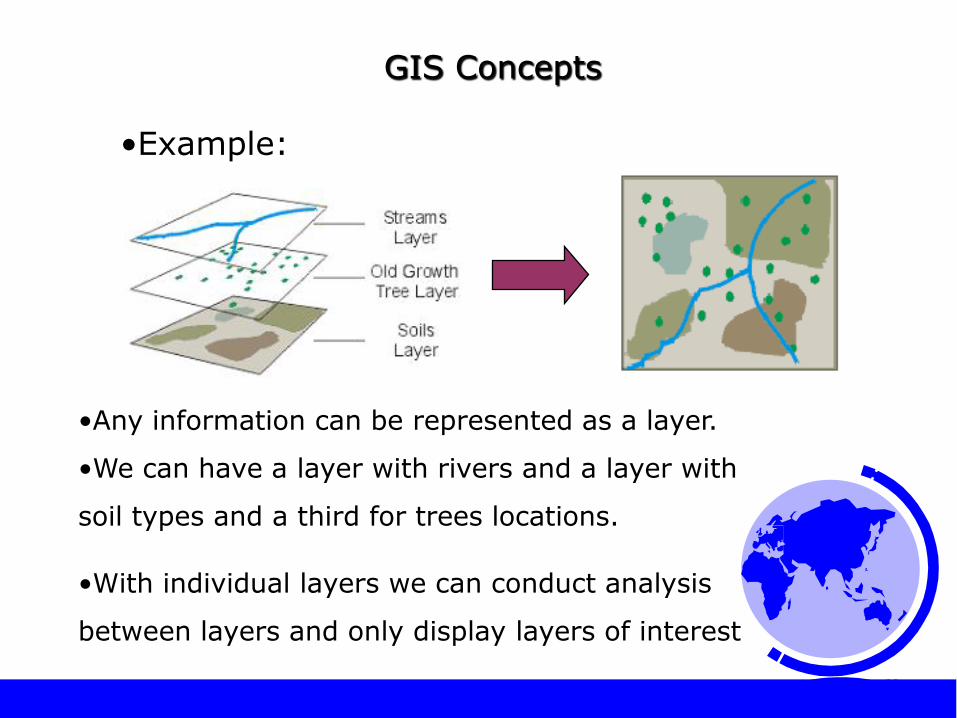
GIS Concepts
•Example:
•Any information can be represented as a layer.
•We can have a layer with rivers and a layer with
soil types and a third for trees locations.
•With individual layers we can conduct analysis
between layers and only display layers of interest

•69
•70
Coordinate Systems and Map Projections
•70

•71
Introduction
• Coordinate system:
reference system for geographic location Georeferencing
• Map projection:
Mapping of 3D earth surface to plane
•71

•72
Georeferencing
• Longitude l and latitude f
– Angle from equator: latitude f
– Angle east of Greenwich: longitude l
• Coordinate systems are based on agreements
• Coordinates relative to a „model“ of the earth
• Heights must refer to the irregular field of gravitation N
S
l
A
Äquator
Nu
l l -M
er i d
i an G
r ee
nw
ich
f
•72
•73
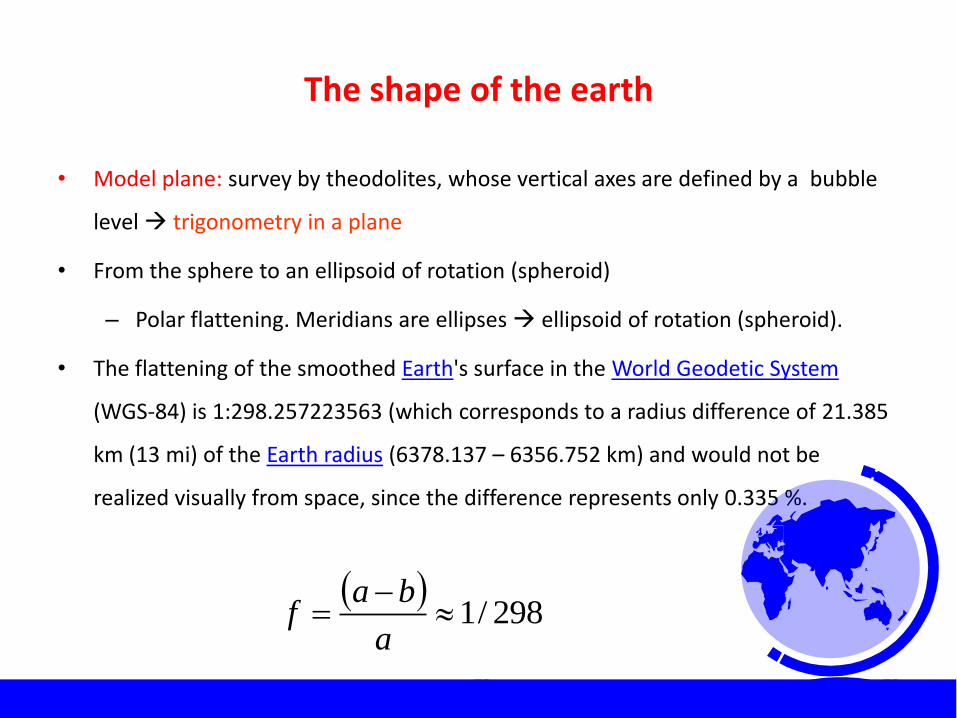
The shape of the earth
• Model plane: survey by theodolites, whose vertical axes are defined by a bubble
level trigonometry in a plane
• From the sphere to an ellipsoid of rotation (spheroid)
– Polar flattening. Meridians are ellipses ellipsoid of rotation (spheroid).
• The flattening of the smoothed Earth's surface in the World Geodetic System
(WGS-84) is 1:298.257223563 (which corresponds to a radius difference of 21.385
km (13 mi) of the Earth radius (6378.137 – 6356.752 km) and would not be
realized visually from space, since the difference represents only 0.335 %.
298/1
a
baf
•73
•74
The shape of the earth
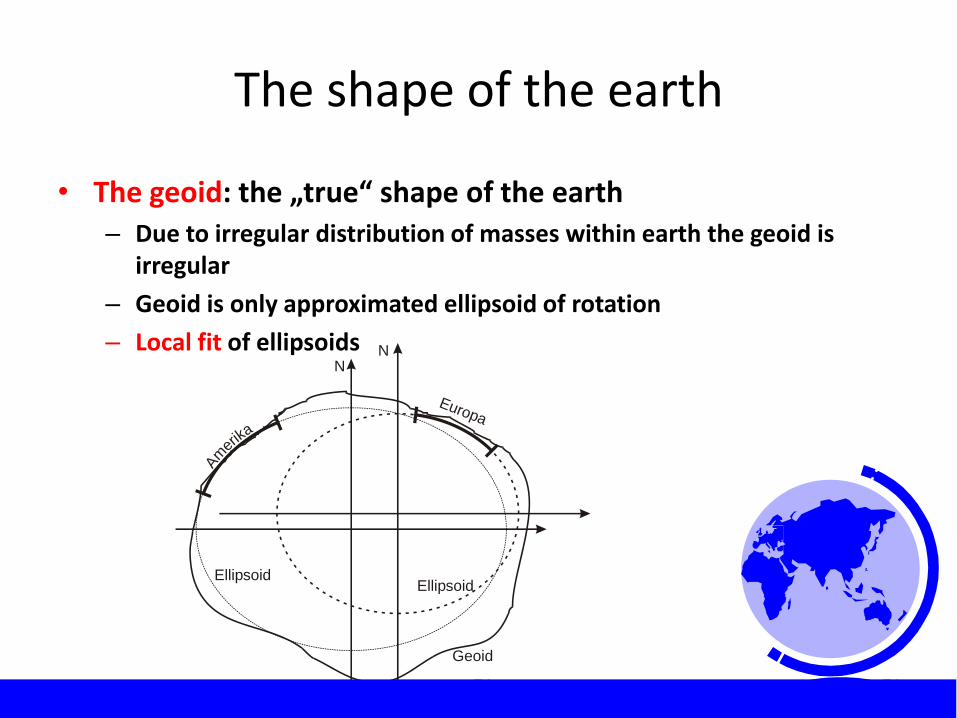
• The geoid: the „true“ shape of the earth – Due to irregular distribution of masses within earth the geoid is
irregular
– Geoid is only approximated ellipsoid of rotation
– Local fit of ellipsoids
N
N
Geoid
EllipsoidEllipsoid
Am
erika
Europa
•74
•75
The shape of the earth
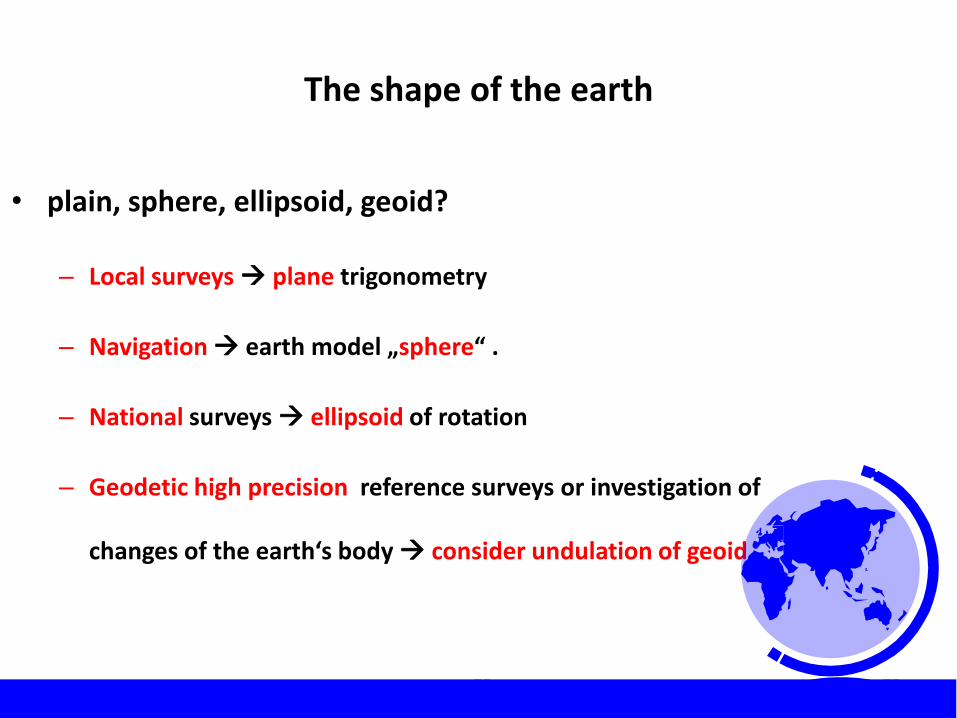
• plain, sphere, ellipsoid, geoid?
– Local surveys plane trigonometry
– Navigation earth model „sphere“ .
– National surveys ellipsoid of rotation
– Geodetic high precision reference surveys or investigation of
changes of the earth‘s body consider undulation of geoid
•75

•76
Heights
• Very important for many and other hydrological applications
• Height above ellipsoid h, height above geoid H, geoid undulation N
• Heights required relativ to level (level instrument!)
Ellipsoid
Er cdo hberflä e P
hH
N
Geoid
•76
•77
Geodetic reference systems
• Geodetic reference system: set of all theoretical conventions to define a
coordinate system for geodetic purposes.
• Reference surface (ellipsoid + rules for handling gedodetic
measurements).
• Datum: set of parameters defining a coordinate system, and a set of
control points whose geometric relationships are known, either through
measurement or calculation: origin, direction of axis, reference point for
elevations
•77
•78
Geodetic reference systems
• Reference network: geodetic implementation of reference system.
Computation of coordinates and heights of given points by means of
geodetic surveys
• Usually „grown“ over long time not free of contradiction. Unique
conversion between coordinate system, e.g. GPS, to e.g., Ain Al Abd, 1970
not possible. Fit by reference points into reference network.
• Austrian 3D geodetic reference field: 57.000 triangulation points and
263.000 additional points, average distance 400 to 1.500 m
•78

•79
•80
Map projections
• Properties of map projections
• Projection types (class)
• aspect
• Naming of projections
• Choice of appropriate projection
• Examples of important projections
•80
•81
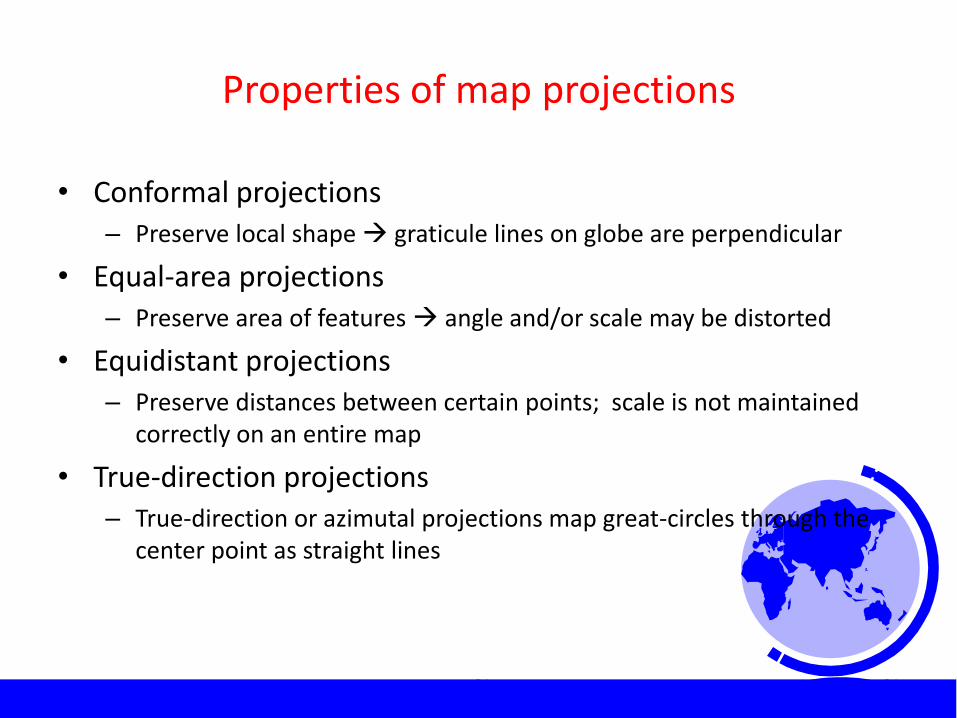
Properties of map projections
•81
• Conformal projections – Preserve local shape graticule lines on globe are perpendicular
• Equal-area projections – Preserve area of features angle and/or scale may be distorted
• Equidistant projections – Preserve distances between certain points; scale is not maintained
correctly on an entire map
• True-direction projections – True-direction or azimutal projections map great-circles through the
center point as straight lines

•82
Type of projection
• Projection onto geometric surfaces (plane, cone, cylinder), which can be flattened by unrolling
• Not just pure „optical“ projection, but rather mathematical expressions which preserve the desired properties.
•82

•83
Type of projection: conic projections
• Tangent at standard parallel
• Secant conic projections (2 standard parallels)
1. Schnittkreis
2. Schnittkreis
•83

•84
Type of projection: cylindrical projections
• Tangent or secant
• Mercator projection, touches at equator
• Transverse Mercator projection touches at meridian
Schnittkreis
Schnittkreis
•84
•85
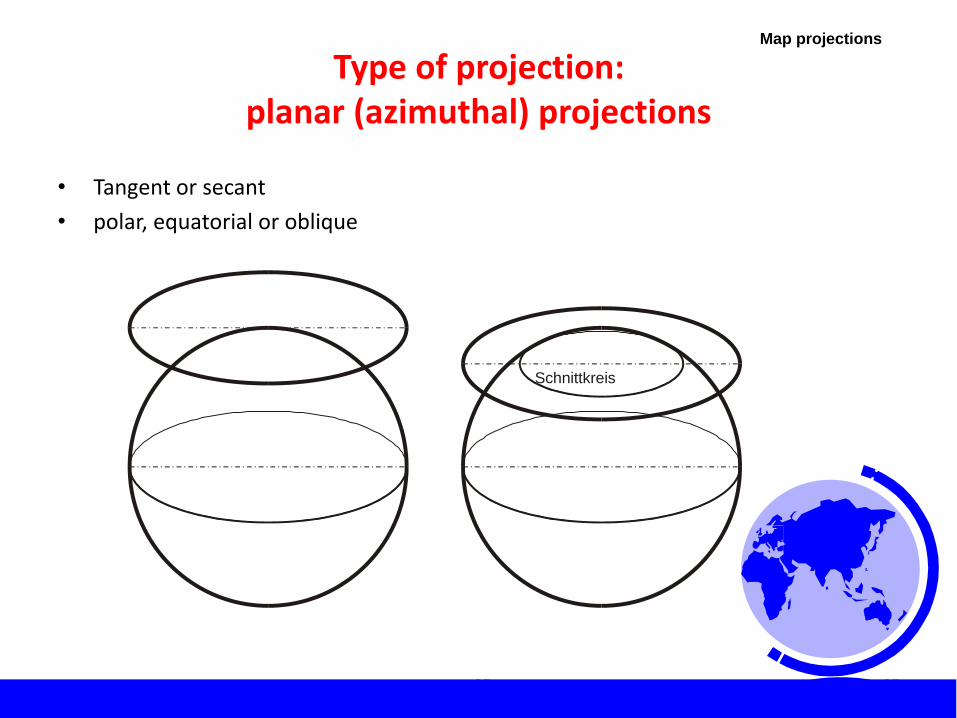
Type of projection: planar (azimuthal) projections
• Tangent or secant
• polar, equatorial or oblique
Schnittkreis
Map projections
•85

•86

•87
•88
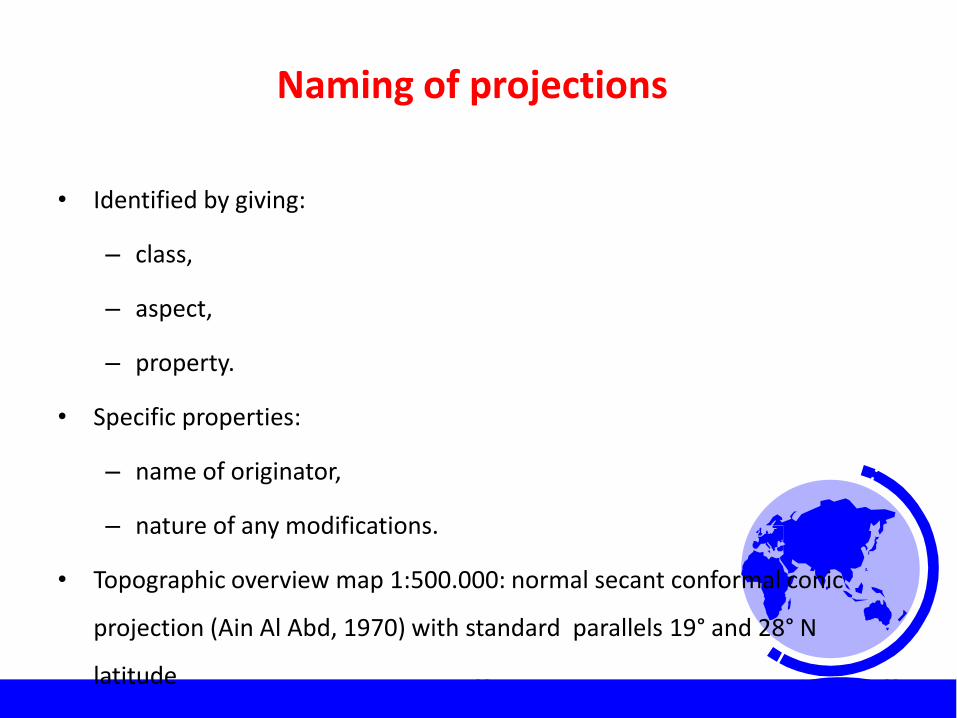
Naming of projections
•88
• Identified by giving:
– class,
– aspect,
– property.
• Specific properties:
– name of originator,
– nature of any modifications.
• Topographic overview map 1:500.000: normal secant conformal conic
projection (Ain Al Abd, 1970) with standard parallels 19° and 28° N
latitude

•89
Selecting a suitable map projection
• Considerations
– How can results be best presented on a map?
– For analysis in GIS, all maps must have a common reference
– To be able to quantify areas, lengths, etc. the respective accuracy must be determined
• Rules of thumb
– Errors and distortions increase from the origin of the projection towards its edges
– In tropical areas cylindrical projections
– In temperate latitudes conic projections
– Polar regions planar (azimuthal) projections
• Topographic maps: conformal projections
•89

•90
Examples of important map projections
• UTM (Universal Transverse Mercator) System – Ain El Abd, 1970 version of transverse Mercator projection.
– For cartography between 18° N and 31° S.
– 5 UTM zones :
Map projections
•90
•91
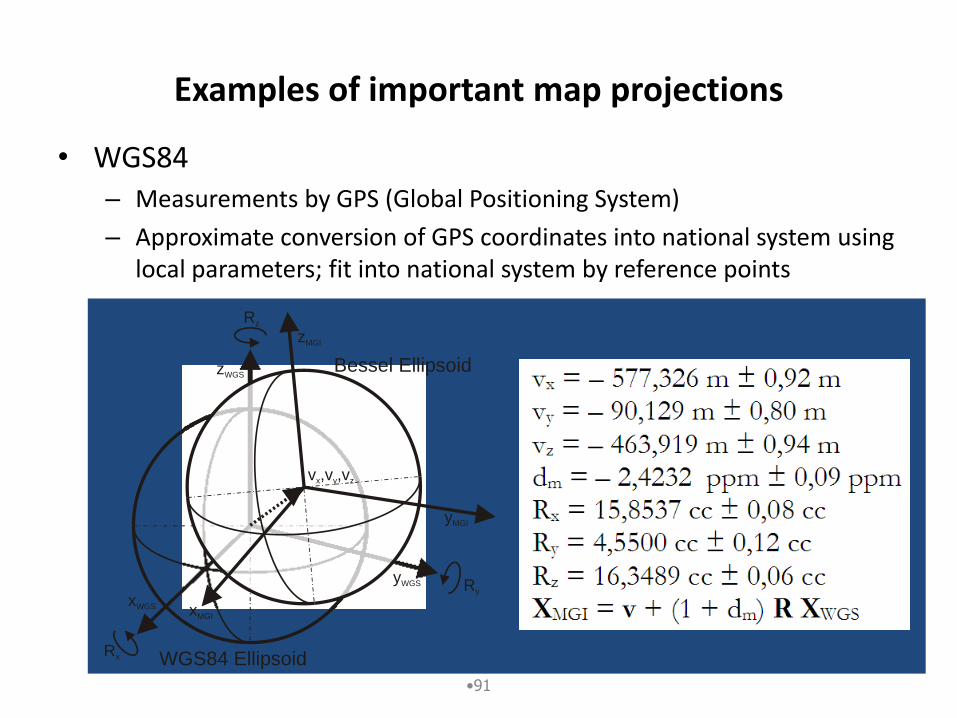
Examples of important map projections
• WGS84 – Measurements by GPS (Global Positioning System)
– Approximate conversion of GPS coordinates into national system using local parameters; fit into national system by reference points
xMGI
yMGI
zMGI
Rx
Rz
Ry
zWGS
yWGS
xWGS
v ,v ,vx y z
Bessel Ellipsoid
WGS84 Ellipsoid

•92
Examples of important map projections
• Ain Al Abd projection – Used frequently for overview maps
– Austria 1:500.000: standard parallels 46° and 49° N, central meridian 13° 20’. origin 47° 30’ N und 13° 20’ E, „false“ coordinates (400.000, 400.000)
•92
•93
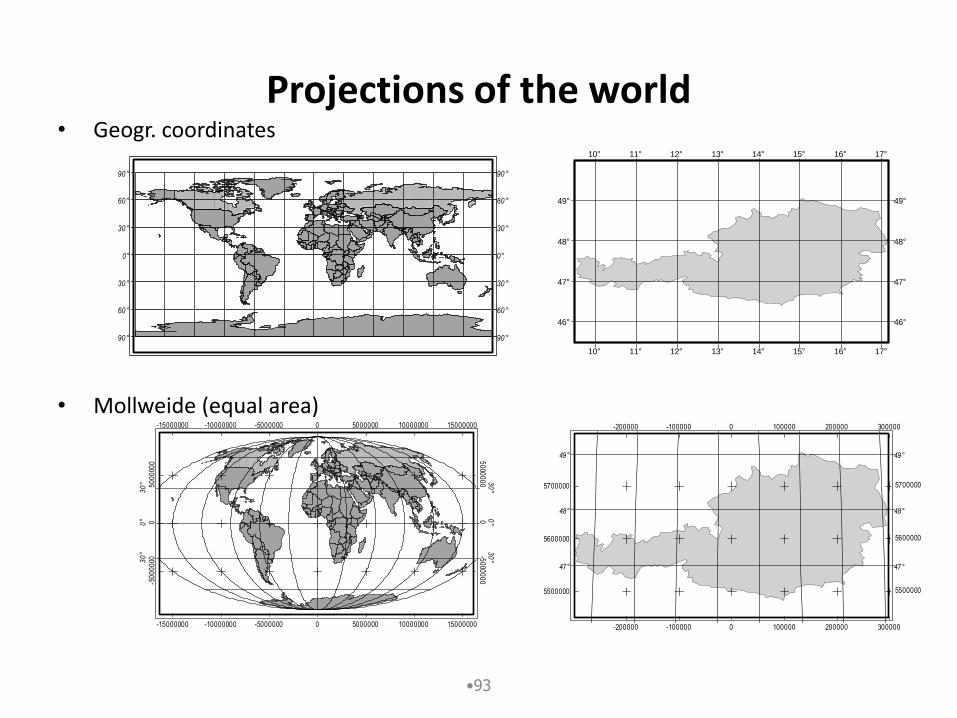
Projections of the world • Geogr. coordinates
• Mollweide (equal area)
90° 90°
60° 60°
30° 30°
0° 0°
30° 30°
60° 60°
90° 90°
30° 3
0°
0° 0
°
30° 3
0°
-15000000
-15000000
-10000000
-10000000
-5000000
-5000000
0
0
5000000
5000000
10000000
10000000
15000000
15000000
-50
00
000
-50
000
00
0
0
50
00
000
50
000
00
47° 47°
48° 48°
49° 49°
10°
10°
11°
11°
12°
12°
13°
13°
14°
14°
15°
15°
16°
16°
17°
17°-200000
-200000
-100000
-100000
0
0
100000
100000
200000
200000
300000
300000
5500000 5500000
5600000 5600000
5700000 5700000
46° 46°
47° 47°
48° 48°
49° 49°
10°
10°
11°
11°
12°
12°
13°
13°
14°
14°
15°
15°
16°
16°
17°
17°

•94
Summary
• Coordinates for georeference, map projections for presentation
• According to requirements and size of study area, earth‘s shape is
modelled as a plane, sphere, ellipsoid of rotation or geoid
• National coordinate systems are based on reference networks
• Position related to ellipsoid
• Gravitation field to be considered for heights
• Distortions due to projection: a projection cannot maintain conformity,
equal area, equidistance AND true direction at the same time
• important: UTM, Gauß-Krüger, Lambert conformal conic projection
•94


Analysis of Spatial Data
Learning objectives
• In this section you will learn:
– how thematic overlays work,
– overview of the diversity of spatial analysis tools and
– overview of methods to query and select by attributes and
spatial criteria to serve as a basis for GIS based decision
support.

•99
Outline
• Introduction
• Geometric overlay
• Analysis in attribute space
• Integrated analysis of spatial and thematic data
• Raster-GIS functions
• Example: Delineation of hydrologically similar areas
• Summary
•100
Introduction
• Most important functionality of GIS
• GIS data basis as a model of reality
• „single layer“ analyses
• „multiple layers“ analyses
• Useful distinction from a technical viewpoint:
– Functions for analysis in attribute space
– Functions for analysis by spatial (topological) criteria

•101
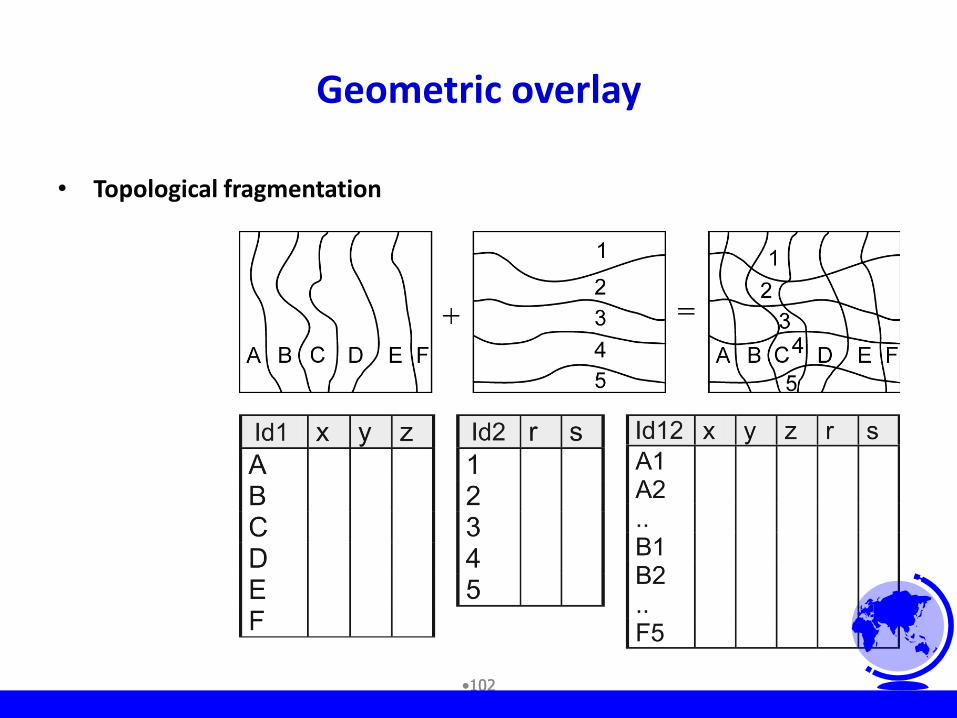
Geometric overlay
• Statements about a location combining information from 2 or more thematic maps „overlay“ of 2 or more maps
• requires common spatial reference
• In raster-GIS automatically met
• Geometric overlay (intersection) in vector-GIS required overlay operators
•102
Geometric overlay
• Topological fragmentation
•102
•103
Analysis in attribute space
• Query,
• Generalisation,
• Calculation.
•103

•104
Query
• Selection of attribute data, without changes in database
• SQL (Structured Query Language)
• ARCGIS 9.3
•104
•105
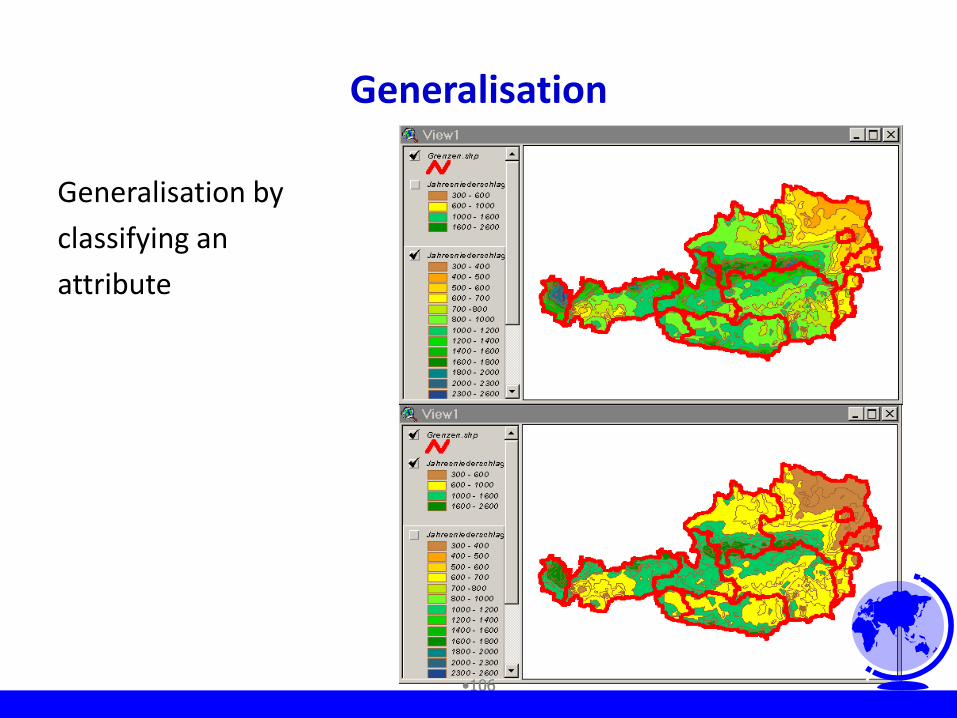
Generalisation
• Classification of data by user defined rules, without change of
existing attributes
– Clearer view of inherent patterns
• Examples:
– Weekly and monthly precipitation depths,
– Soil classification by hydrological criteria,
– Classification of slopes for stability analysis,
– Hydrological Response Units (HRU)
•105
•106
Generalisation
Generalisation by
classifying an
attribute
•106

•107
Calculations
• Operations:
– arithmetic,
– mathematical (functions) and
– logical (binary)
• E.g.: Amount of groundwater = Thickness x porosity
• SQL DBMS like Oracle or MS Access such attributes are commonly stored in a „view“ or „query“
•107

•108
Integrated analysis of spatial and thematic data
• The focus of GIS
• Power of analytical functions and software architecture varies
– Wide range from specialised modules for catchment analysis (e.g.,
WMS) to libraries of elementary general purpose spatial operators
•108 •108

•109
Selection, classification and measuring
• Combined spatial and attribute based selection
• E.g.: Select features of active themes that Are completely within the selected features of Gizan.shp
•109 •109

•110
Classification
• (Re-)assignment of thematic attributes
• Examples:
– Elevation zones from DEM
– Re-classification of a soil map by hydrological criteria
– Scale-dependent reduction of number of attribute values, e.g. in a map of land cover
•110 •110

•111
Measure
• Assess numbers, distances, lengths, areas, volumes
– Many of these are automatically maintained in GIS (area and perimeter of polygons, length of lines),
– Sometimes elaborate procedures (e.g. travel time as a function of road conditions, vehicle and current traffic)
•111 •111

•112
Overlays (Intersection)
• M:N relationship between entities of 2 maps with different geometrical
basis
• 1:N relationship between a polygon and ist attributes by geometric-
topological intersection
• After intersection analysis is done in a single layer
• Operations:
– arithmetic (addition, multiplication, ...) and
– logical (AND, OR, XOR) operations as well as
– Application of conditions (rules)
•112 •112 •112

•113
Overlays (Intersection)
• Example of arithmetic overlay
Intersect
WTID WTIEFE BFID BFEUCHTE PWASSER50 1 23 11575 1 23 17375 2 18 13589 1 23 20589 3 34 30389 2 18 160
122333
1/1
2/1
3/1
2/2
3/2
3/3
Pflanzenverfügbares Wasser [mm]
PWASSER = WTIEFE * BFEUCHTE / 10
BFID BFEUCHTE1 233 342 18
1
2
3
Bodenfeuchte [%]WTID WTIEFE123
507589
1
2
3
Durchwurzelungstiefe [cm]
Root depth Soil moisture
Water available for plants
•113 •113 •113
•114
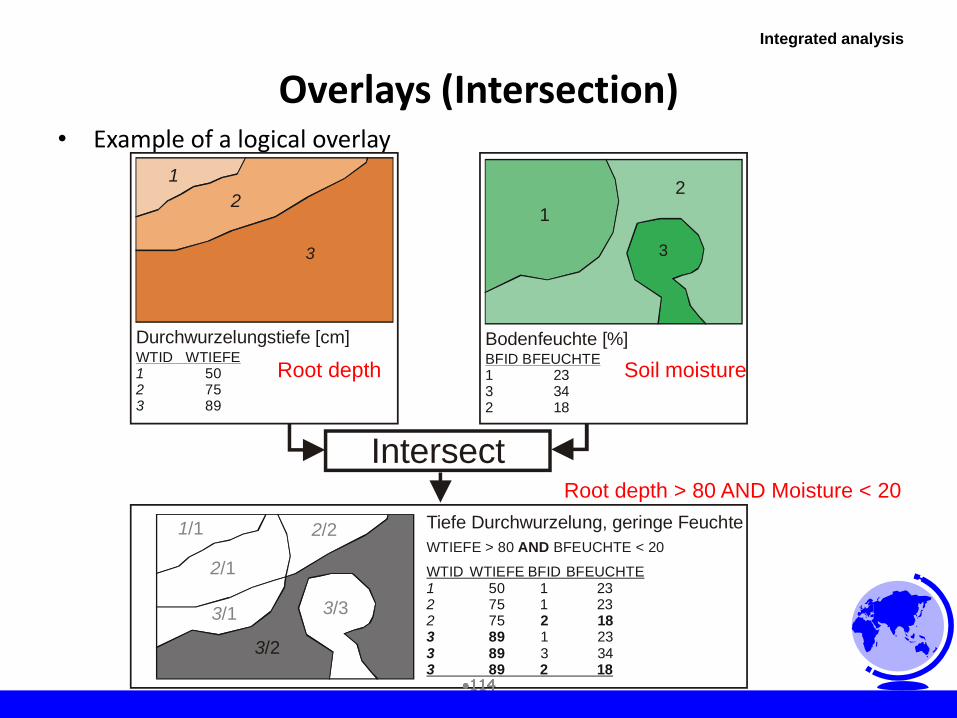
Overlays (Intersection) • Example of a logical overlay
Intersect
WTID WTIEFE BFID BFEUCHTE122
50 1 2375 1 2375
1 233 34
2 188989
333 89 2 18
1/1
2/1
3/1
2/2
3/2
3/3
Tiefe Durchwurzelung, geringe Feuchte
WTIEFE > 80 BFEUCHTE < 20AND
BFID BFEUCHTE1 233 342 18
1
2
3
Bodenfeuchte [%]WTID WTIEFE123
507589
1
2
3
Durchwurzelungstiefe [cm]
Integrated analysis
Root depth Soil moisture
Root depth > 80 AND Moisture < 20
•114 •114 •114
•115
Overlays (Intersection)
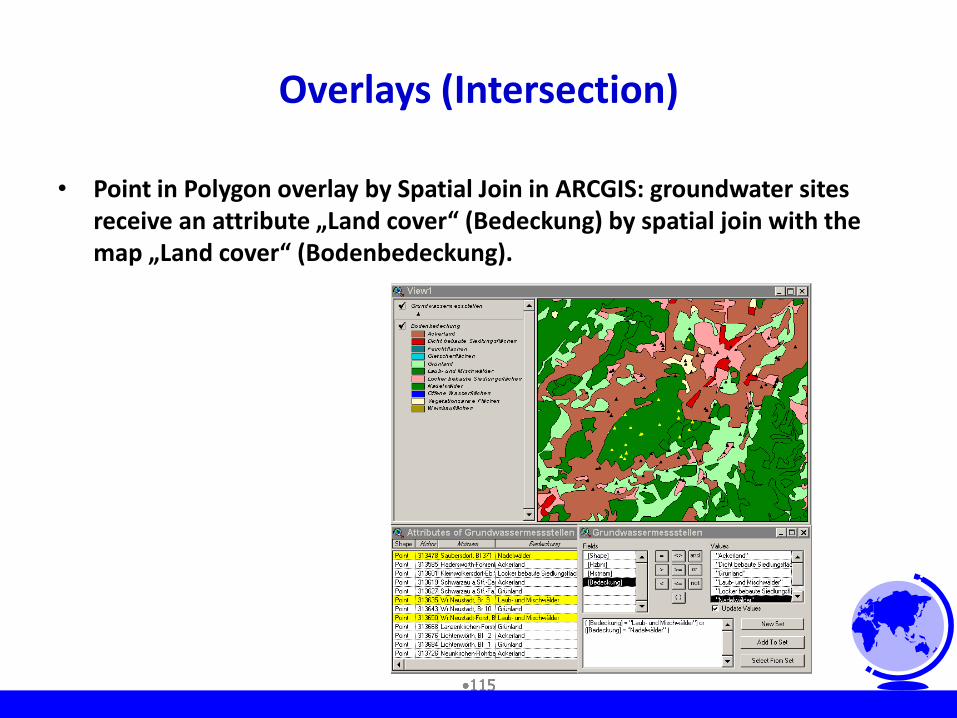
• Point in Polygon overlay by Spatial Join in ARCGIS: groundwater sites receive an attribute „Land cover“ (Bedeckung) by spatial join with the map „Land cover“ (Bodenbedeckung).
•115 •115 •115

•116
Overlays (Intersection)
• Line in Polygon overlay: rivers are assigned the surrounding
land cover by INTERSECT of the maps „Rivers“ and „Land cover“
Integrated analysis

•117
Surface operations
• neighbourhood of a point is included in the evaluation for this point
• Generally a „smooth“ surface is assumed
– Topographic functions (slope, aspect, relief),
– illumination (e.g. hillshading),
– Pseudo-3D displays (Perspective) and
– Interpolation.
•117 •117 •117

•118
Connectivity
• Entities with common properties AND spatial connection
– Contiguity
– Proximity: based on measures of distance, including time, cost, etc. E.g. buffer zones, Thiessen polygons, flow times).
– Spread: e.g. floods, pollutants.
– Seek: optimal paths, according to decision rules,
– Network functions: utilities, drainage network.
Integrated analysis

•119
Connectivity
• contiguity:
– E.g: nature reserve should contain forest, swamp and rivers, min. size 400 km2 and nowhere narrower than 10 km.
Wald
Sumpf
Acker
Fluss
Bodenbedeckung Zusammenhängende Flächen
Integrated analysis
•120
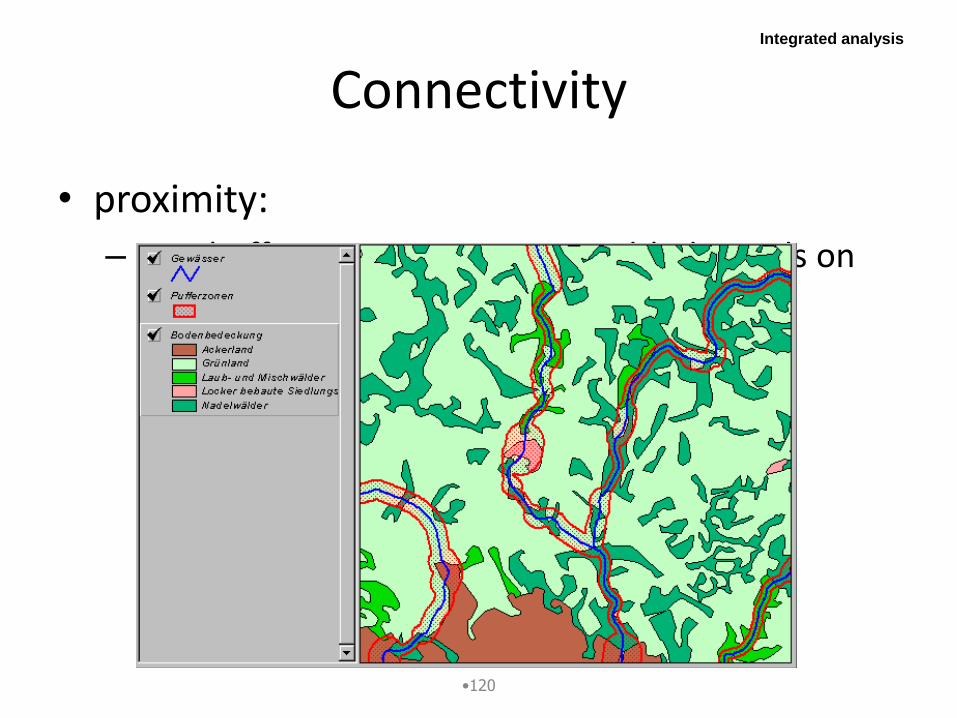
Connectivity
• proximity:
– E.g.: buffer zones near rivers: width depends on land cover
Integrated analysis

•121
Connectivity
• proximity:
– E.g: Thiessen-Polygons: raster based assign proximity, vector based line of symmetry
Integrated analysis

•122
Connectivity
• Spread (flood, noise, pollutants in groundwater)
– in GIS usually only simplified solutions
• Seek
– Find optimal path using decision rules
• Network functions (roads, sewers, utilities, rivers)
– Movement of resources
– Strahler order
11
1
2
1
2 2
1 1
13
3
1
1
2
2
1
1
1 2
11
2
3
77
Feldais
t
W
aldaist
Ais
t
Donau
Integrated analysis

•123
Raster-GIS functions
• Local functions
– Only one cell, neighbouring cells do not influence result
• Focal functions
– Result for a cell is based on neighbourhood cells (linear filter, mean, median, standard deviation )
• Zonal functions
– Evaluated for a zone, i.e. for all cells with a common value
• Global functions
– Calculations for the whole grid (distances,

•124
Example: Delineation of hydrological response units
• Semi-distributed conceptual models with HRU concept (e.g. PRMS)
• Important steps:
– Selection of input data: 5 layers, DEM (slope, aspect), land use, soil, geology
– classification input data into small number of categories (3-6).
– Overlay of input layers.
– Reduction of the resulting number of unique attribute combinations (HRU) by analysis and classification in DBMS

•125
Water balance of the Danube basin
• HRU using DEM (250 m resolution), maps of land cover and hydrological sub-basins
Bodenbedeckung11 Klassen
Klassifikation3 Klassen
Klassifikation3 Klassen
Overlay
Zonen (HRU) für BilanzmodellOverlay aus klassifiziertem DHM,Bodenbedeckung, Einzugs-gebietsgrenzen
BodenbedeckungWald, Gras, vegetationsfrei
•126
Summary
• Analysis of spatial data is the most important function of GIS
• Single-layer analysis is done within 1 layer
• Multi-layer analysis – Transform into single-layer problem by geometric-
topological intersection 1:M relationship between object and attributes.
• Analyses in attribute space include query, generalisation and calculations based on the attributes only
• Integrated analysis of spatial and attribut data involves attributes, location and topology

•127
Analysis of Spatial Data

•128
Learning objectives
• In this section you will learn:
– how thematic overlays work,
– overview of the diversity of spatial analysis tools
– overview of methods to query and select by attributes and spatial criteria to serve as a basis for GIS based decision support.
•129
Outline • Introduction
• Geometric overlay
• Analysis in attribute space
• Integrated analysis of spatial and thematic data
• Raster-GIS functions
• Example: Delineation of hydrologically similar areas
• Summary
•130
Introduction
• Most important functionality of GIS
• GIS data basis as a model of reality
• „single layer“ analyses
• „multiple layers“ analyses
• Useful distinction from a technical viewpoint:
– Functions for analysis in attribute space
– Functions for analysis by spatial (topological) criteria
•131
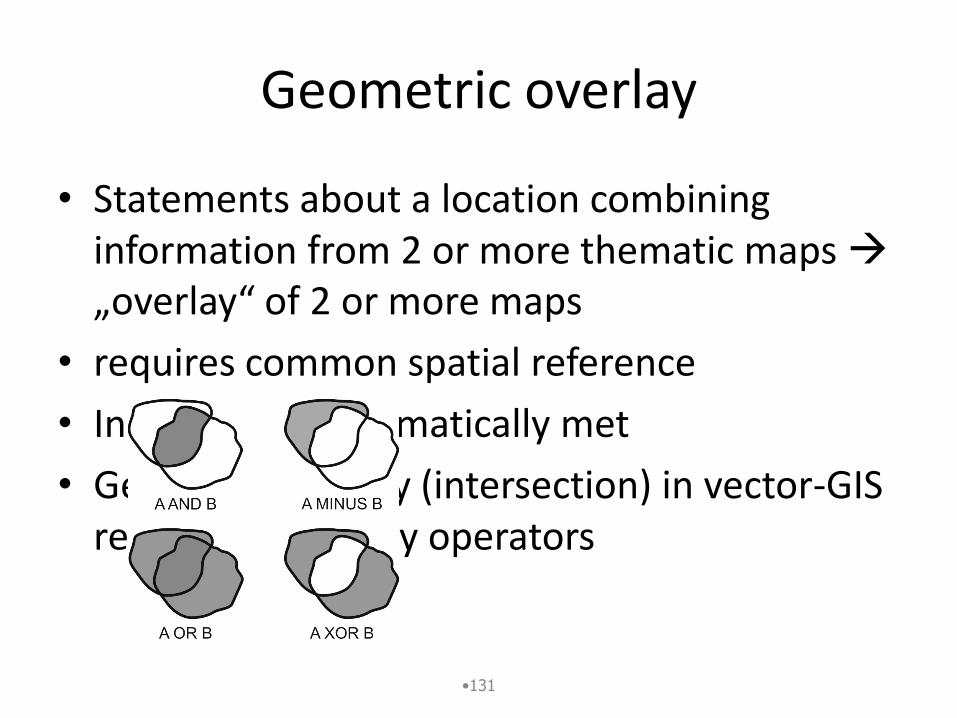
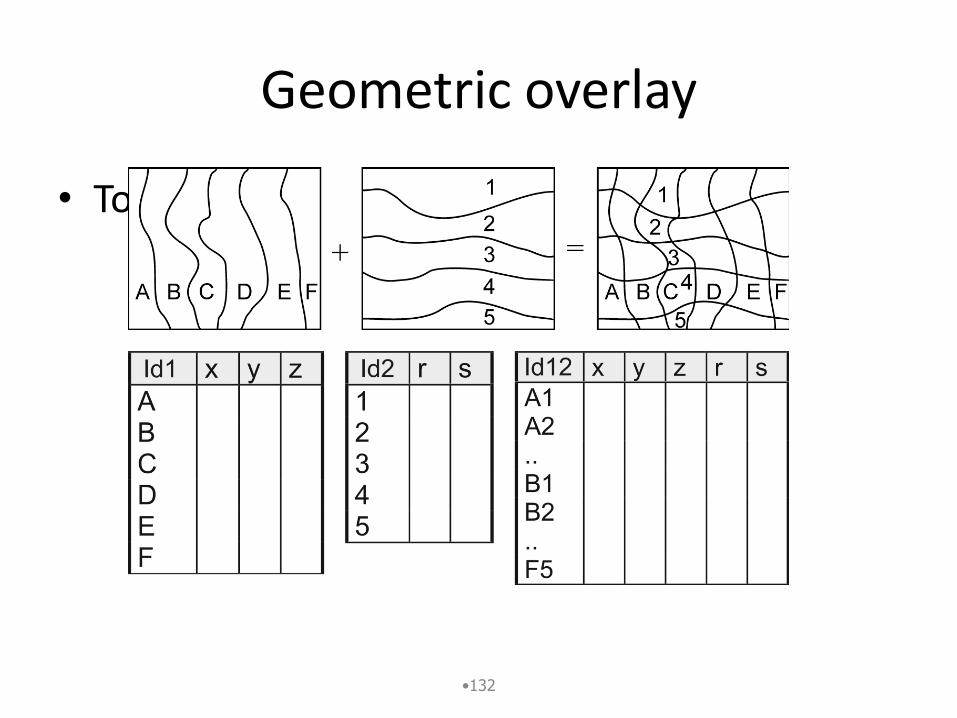
Geometric overlay
• Statements about a location combining information from 2 or more thematic maps „overlay“ of 2 or more maps
• requires common spatial reference
• In raster-GIS automatically met
• Geometric overlay (intersection) in vector-GIS required overlay operators
•132
Geometric overlay
• Topological fragmentation
•133
Analysis in attribute space
• query,
• generalisation,
• calculation.

•134
Query
• Selection of attribute data, without changes in database
• SQL (Structured Query Language)
SELECT KENNUNG, STATIONSNAME, X_KOORDINATE, Y_KOORDINATE,
MESSPUNKT
FROM HEADER_HYDRO
WHERE MESSVARIABLE = ´GRUNDWASSERSTAND´ AND MESSGERAET =
´LICHTLOT´;
• ArcView 3.x:
Analysis in attribute
space
•135
Generalisation
• Classification of data by user defined rules, without change of existing attributes
– Clearer view of inherent patterns
• Examples:
– Weekly and monthly precipitation depths,
– Soil classification by hydrological criteria,
– Classification of slopes for stability analysis,
– Hydrological Response Units (HRU)
Analysis in attribute
space

•136
Generalisation
• Generalisation by classifying an attribute
Analysis in attribute
space
•137
Calculations
• Operations:
– arithmetic,
– mathematical (funktions) and
– logical (binary)
• E.g.: Amount of groundwater = Thickness x porosity
• SQL DBMS like Oracle or MS Access such attributes are commonly stored in a „view“ or „query“
Analysis in attribute
space

•138
Integrated analysis of spatial and thematic data
• The focus of GIS
• Power of analytical functions and software architecture varies
– Wide range from specialised modules for catchment analysis (e.g., WMS) to libraries of elementary general purpose spatial operators

•139
Selection, classification and measuring
• combined spatial and attribute based selection
• E.g.: Select features of active themes that Are completely within the selected features of
Grenzen3.shp
Integrated analysis

•140
Classification
• (Re-)assignment of thematic attributes
• Examples:
– Elevation zones from DEM
– Re-classification of a soil map by hydrological criteria
– Scale-dependent reduction of number of attribute values, e.g. in a map of land cover
Integrated analysis
Top Related