


Languages
Pages
Legal


ENDANGERED SPECIES RESEARCHEndang Species Res
Vol. 31: 19–32, 2016doi: 10.3354/esr00744
Published September 5
INTRODUCTION
Recent studies have expressed concerns over thedepletion of global pelagic shark populations (Dulvyet al. 2008, Worm et al. 2013, Queiroz et al. 2016) and
the associated effects on ecosystem functioning(Myers et al. 2007). Declines in pelagic shark popula-tions have been documented in many areas, includ-ing the South Atlantic (Barreto et al. 2016), Gulf ofMexico (Baum & Myers 2004, Hayes et al. 2009),
© The authors 2016. Open Access under Creative Commons byAttribution Licence. Use, distribution and reproduction are un -restricted. Authors and original publication must be credited.
Publisher: Inter-Research · www.int-res.com
*Corresponding author: [email protected]
Spatial ecology of blue shark and shortfin mako insouthern Peru: local abundance, habitat preferences
and implications for conservation
Grant D. Adams1,2,3,*, Daniel Flores2, Oscar Galindo Flores2, Kim Aarestrup4, Jon C. Svendsen5,6
1Gulf Coast Research Laboratory, University of Southern Mississippi, 703 East Beach Drive, Ocean Springs, MS 39564, USA2Laboratorio Costero de Pisco, Instituto del Mar del Perú IMARPE, Av. Los Libertadores A-12, Urb. El Golf, Paracas, Ica, Peru
3Peace Corps Peru, 132 Vía Láctea, Surco, Peru4National Institute of Aquatic Resources, Technical University of Denmark, Vejlsøvej 39, 8600 Silkeborg, Denmark
5Interdisciplinary Centre of Marine and Environmental Research, University of Porto, 289 Rua dos Bragas, Porto 4050-123, Portugal6Section for Ecosystem based Marine Management, National Institute of Aquatic Resources (DTU-Aqua),
Technical University of Denmark, Jægersborg Allé 1, 2920 Charlottenlund, Denmark
ABSTRACT: While global declines of pelagic shark populations have been recognized for severalyears, conservation efforts remain hampered by a poor understanding of their spatial distributionand ecology. Two species of conservation concern are the blue shark Prionace glauca and theshortfin mako shark Isurus oxyrinchus. To improve management of these species, this study exam-ined their local abundance patterns, habitat preferences, and distribution in the Southeast Pacific.Catch per unit effort (CPUE) data from an artisanal fishery in Peru were used to identify geo-graphic hot spots and model abundance estimates as a function of environmental variables,including the El Niño Southern Oscillation (ENSO). A 10 yr data series revealed declining annuallandings since 2012, despite no changes in management structures. Significant aggregations ofboth species were found in southwestern Peruvian waters (74−76° W, 17−19° S), with both species-specific hot spots targeted by major fishing efforts. P. glauca CPUE increased during La Niña con-ditions (i.e. low water temperature anomaly), and CPUE of both species declined when waterdepths exceeded 1000 m. Correlations with lunar illumination and chlorophyll a were revealed inP. glauca and I. oxyrinchus, respectively. Modeling explained 57 to 61% of the deviance, indica-ting that other factors not included in the present study might account for unexplained variance inCPUE (e.g. thermocline depth, location of marine fronts, dissolved oxygen, and gear characteris-tics). Given the importance of the examined area to shark fisheries and the exploitation of multiplespecies of conservation concern, the information presented here can be used to inform manage-ment strategies designed to limit the depletion of pelagic sharks.
KEY WORDS: Artisanal fisheries · Blue shark · Catch per unit effort · Conservation · Spatial ecology · Generalized additive mixed model · Shortfin mako · Habitat preferences
OPENPEN ACCESSCCESS
Endang Species Res 31: 19–32, 2016
Western Pacific (Robbins et al. 2006, Clarke et al.2013), and the Mediterranean Sea (Ferretti et al.2008). In the last century, growth in Asian shark finmarkets (Dent & Clarke 2015) and rising global fish-ing demands have led to increased capture of pelagicsharks either as by-catch or by directed effort (David-son et al. 2016). Research by Davidson et al. (2016)found that recent declines in the global chondrich-thyan catches are strongly correlated to increasedfishing pressure and weakly correlated to the ofteninsufficient implementation of management regimes,indicating likely population declines. This is espe-cially concerning as the population growth of manyspecies is unable to match fishing mortality due tolife-history constraints including low fecundity andlate sexual maturity (Stevens et al. 2000, Worm et al.2013).
Two species of conservation concern, because ofdeclining populations and exposure to high fishingmortality, are the blue shark Prionace glauca and theshortfin mako Isurus oxyrinchus. P. glauca is the mostcommonly caught species of pelagic shark (Clarke etal. 2006, FAO 2011), mainly as by-catch of pelagiclongline fisheries (Campana et al. 2006). Global I.oxyrinchus catches originate from both directedlongline fleets and by-catch (Dulvy et al. 2008). Bothspecies are globally distributed and highly migra-tory, making conservation and management an inter-national effort. However, data are often geographi-cally limited or inconsistent, adding high levels ofuncertainty to assessments (Rice et al. 2014). In addi-tion, both species are moderately productive (Dulvyet al. 2008), limiting recovery to high fishing pres-sure. P. glauca and I. oxyrinchus are therefore classi-fied by the IUCN as Near Threatened and Vulnera-ble, re spectively (Cailliet et al. 2009, Stevens 2009).
In the Southeast Pacific, shark fisheries are poorlymonitored and regulated, because fisheries manage-ment agencies with limited resources tend to focuson the dominant fisheries of small pelagics andignore the growing shark catches (Velez-Zuazo et al.2015). This problem is exacerbated by the fact thatmost shark populations in the Southeast Pacific aretargeted by artisanal fisheries (Bustamante et al.2014, Gonzalez-Pestana et al. 2014), whose openaccess can lead to overexploitation and whose localmanagement agencies often lack the capacity toundertake effective fishery assessments (Salas et al.2007). However, despite the relatively small size offishing vessels, artisanal fisheries can have large eco-logical impacts through destructive fishing techniquesand large fleet size and activity (Alfaro-Shigueto etal. 2010, Shester & Micheli 2011).
Peru is the top shark-fishing nation in the South-east Pacific (Fischer et al. 2012). P. glauca andI. oxy rinchus are the most caught shark species inPeru (Gonzalez-Pestana et al. 2014), with artisanallongline fisheries being the principal harvesters(Gilman et al. 2007). Artisanal vessels are defined inPeru as boats with a maximum of 32.6 m3 gross reg-istered tonnage (GRT), up to 15 m in length, andoperating predominantly using manual labor (Alfaro-Shigueto et al. 2010). The longline artisanal fisherieshave 2 distinct seasons: one for dolphinfish Cory -phaena hippurus between December and Februarywhere shark catches, while retained, are mostlyincidental; the second season is the di rected sharkfishery, which is mainly active between March andNovember (Doherty et al. 2014). The shark fisheryprincipally targets P. glauca and I. oxyrinchus (Alfaro-Shigueto et al. 2010). Currently, there are no regula-tions on the finning of sharks, and there are nocatch quotas in Peru. Al though there is a minimumsize limit for both shark species (160 and 170 cmtotal length for P. glauca and I. oxyrinchus, respec-tively), this is rarely en forced (Gilman et al. 2007,Fischer et al. 2012, Doherty et al. 2014). Concernsregarding the expansion of the longline fishery inPeru (>350% between 1995 and 2005; Alfaro-Shigueto et al. 2010), rising exports of shark prod-ucts (Gonzalez-Pestana et al. 2014), and largelyabsent management warrant further study of thesespecies to help address the status of shark fisheriesin this region.
Understanding how and why animals are spatiallyand temporally distributed is a fundamental compo-nent of ecology and is essential for effective conser-vation and management (Arendt et al. 2012, Kessel etal. 2014, Stehfest et al. 2014, Afonso & Hazin 2015),partly because spatial ecology can be used to predictvulnerability to marine fisheries. For example, simpledescriptors of habitat use can predict the probabilityof marine species being threatened as defined by theIUCN (Dulvy et al. 2014). Likewise, predictable geo-graphic distributions and aggregations of sharks sig-nal a high potential for overexploitation (Kessel et al.2014), so distribution knowledge is crucial for themanagement of protected shark species, particularlyif these are perceived as a nuisance or economicopportunity for other fisheries (Gilman et al. 2007).Understanding the biotic and abiotic factors drivingshark abundance patterns is important in the contextof environmental variation and future climatic sce-narios (Kessel et al. 2014) and may help identify themechanistic bases of species declines, because mar-ine conditions (e.g. primary production and tempera-
20

Adams et al.: Distribution and ecology of pelagic sharks
ture) affect pelagic resources (Bigelow et al. 1999, Suet al. 2011). For example, interannual climate varia-tion in the form of the El Niño Southern Oscillation(ENSO) has led to boom and bust fisheries in theSoutheast Pacific because of poor knowledge of spe-cies’ responses to ENSO and a lack of management(Wolff et al. 2007). ENSO greatly alters oceano-graphic conditions every 2 to 7 yr, which affects thestatus of pelagic fisheries (Ñiquen & Bouchon 2004,Su et al. 2011, Quiñones et al. 2015). However, therelationship between ENSO and the local abundanceof pelagic shark species remains poorly understood,hampering conservation efforts.
Understanding the distribution and ecology ofsharks in Peru, and the effects of climate variationand fishing, can lead to a more accurate index ofabundance which can increase the accuracy of futureconservation and assessment efforts (Abascal et al.2011, Doherty et al. 2014, Gonzalez-Pestana et al.2014). To that end, we modeled P. glauca and I. oxy -rinchus catch rates using a 10 yr data set from thesmall-scale longline fisheries in southern Peru. Usingspatial-temporal and environmental variables, weaimed to (1) test the effects of ENSO on P. glauca andI. oxyrinchus; (2) investigate the ecology of these spe-
cies in Peruvian waters; (3) report on the spatial dis-tribution of the shark fishery; and (4) examine thetemporal development in annual landings.
MATERIALS AND METHODS
Catch data
Catch data for Prionace glauca and Isurus oxy rin -chus captured by the artisanal longline fleet in thewaters of southern Peru (i.e. Arequipa, Moqueguaand Tacna Regions) between 2005 and September2014 were provided by the Instituto del Mar del Perú(IMARPE; Fig. 1). The area covers the principal land-ing port (by biomass) for sharks in Peru (Ilo,Moquegua) as well as the principal P. glauca and I.oxyrinchus fishing grounds (Gonzalez-Pestana et al.2014).
For each trip, port observers recorded catch perspecies (kg), vessel GRT, date of landing, and fishingarea (Estrella et al. 1998, 1999). While gear and baitare not recorded by IMARPE observers for each fish-ing trip, on-board observers and port surveys havereported that artisanal longline shark fisheries typi-
21
Fig. 1. Fishing locations of blue shark Prionace glauca and shortfin mako shark Isurus oxyrinchus caught by the pelagic arti-sanal longline fishery in southern Peru from January 2005 to September 2014. Fishing grounds are shown as black dots, land-ing ports as open circles, and the capital of Peru (Lima) as a star (inset). Depth contours represent the 2000 (solid line) and 4000 m
(dashed lines) isobaths
Endang Species Res 31: 19–32, 2016
cally use large J hooks, nylon multifilament cordbranchlines and cable leaders with humboldt squidDosidicus gigas, flying fish Exocoetus volitans, chubmackerel Scomber japonicus, porcupinefish Diodonhystrix, Peruvian Pacific sardine Sardinops sagaxsagax and small cetacean meat as bait (Alfaro-Shigueto et al. 2010, Doherty et al. 2014). During thedolphinfish season, vessels deploy 7.4 ± 1.6 (mean ±SD) sets per trip with 676.6 ± 64.6 hooks per set andduring the shark season vessels deploy 7.1 ± 0.9 setsper trip with 705.1 ± 89.8 hooks per set (Doherty et al.2014). Nominal catch per unit effort (CPUE) was cal-culated as catch (kg) per day, which was estimatedby dividing the recorded landings by the number ofdays at sea for each trip. Due to data quality con-straints, the nominal CPUE could not be reported inmore standardized units, such as catch per set or catchper 1000 hooks.
Environmental data
Environmental data included in modeling of CPUEwere ENSO anomalies, sea surface temperature(SST; °C), chlorophyll a (chl a) concentration (mgm–3), water depth (bathymetry; µ), and lunar illumi-nation (%). Monthly oceanic ENSO climate variationdata were obtained from the Multivariate ENSO In-dex (MEI) provided by NOAA’s Earth System Re-search Laboratory (http://www.esrl.noaa.gov/ psd/enso/ mei/). The MEI is calculated using the first prin-cipal component of sea-level pressure, zonal andmeridional surface wind components, SST, surface airtemperature, and total cloudiness fraction of the skyfrom the tropical Pacific (Niño 3.4 region) normalizedfor the reference period of 1950 to 1993 (Wolter &Timlin 2011). Positive MEI values re present El Niñophase-like conditions and negative values representLa Niña phase-like conditions. Monthly blended SSTand chlorophyll a data with a 4 km2 resolution wereretrieved from the Moderate Resolution ImagingSpectrometer Aqua via the Oceancolor Data Down-loader QGIS plugin developed by the Mapping andGeographic Information Centre at the British Antarc-tic Survey (Ireland & Connor 2015, QGIS Develop-ment Team 2015). Daily lunar illumination data at 12noon (Peru time zone) were extracted from the ‘lunar’package in R (R Core Team 2015, Lazaridis 2014). Lu-nar illumination is the proportion of the Moon’s diskthat is illuminated and, therefore, new moons have anillumination of 0.0, full moons have an illumination of1.0, and quarter moons are intermediate (0.5). Thismeans that lunar illumination corresponds directly to
lunar phase. Bathymetry data were obtained from theGeneral Bathymetric Chart of the Oceans global 30arc-second grid data set (IOC et al. 2003). While fish-ing area recorded by IMARPE is reported to be accu-rate within 1 nautical mile (Estrella Arellano & Swartz -man 2010), locations of each set are not recorded anda single point denoting the fishing area is recordedfor each trip. To account for possible vessel movementin relation to the recorded fishing area, SST, chl a,and depth within a 13.9 km radius from each fishinglocation were averaged. In addition, given the differ-ences in time coverage between environmental vari-ables and fishing trips, the weighted average of envi-ronmental variables was calculated over the durationof each fishing trip.
GAMM modeling
To examine the relationships of pelagic shark catchrates with spatial-temporal and environmental vari-ables, generalized additive mixed models (GAMMs;Wood 2006) were fit to the CPUE data (Bigelow et al.1999, Bustamante & Bennett 2013, Mitchell et al.2014). Vessel-specific heterogeneity was included asa random effect (random intercept) to remove theassumption of homogeneity of gear and fishing char-acteristics among vessels and improve standardiza-tion of CPUE. To reduce Type I and II errors, GAMMswere constructed using cubic regression splines andfitted using restricted maximum likelihood to maxi-mize stability (Marra & Wood 2011). In addition, the‘double penalty’ shrinkage variable selection proce-dure was used to reduce uncertainty inherent instepwise variable selection procedures (Marra &Wood 2011). Employing log transformed CPUE datafor each species to meet the assumption of normality,GAMMs were fitted using a normal distribution andan identity link function to fit the response:
log(CPUE+1) ~ s(MEI) + s(SST) + s(chl a) + s(lunarillumination) + s(depth) + s(month) + s(year) + s(latitude) + s(longitude) + s(GRT) + αi
where s is the smoothing function applied to eachcovariate, αi is the vessel-specific random effect, anda constant of 1 was added to CPUE. The effect ofmonth was modeled using cyclic cubic regressionsplines. Spatial prediction maps of CPUE were cre-ated for both species using the modeled effect of lat-itude and longitude. GAMM analyses were com-pleted using the ‘gamm4’ package in R 3.2.1 (Wood &Scheipl 2014, R Core Team 2015), with significanceaccepted at p < 0.01.
22
Adams et al.: Distribution and ecology of pelagic sharks
Spatial distribution
Distributional patterns of pelagic sharks off thesoutheast coast of Peru were identified using theOptimized Hot Spot Analysis tool (Getis-Ord Gi* statistic) in ArcGIS 10.2.2 (Environmental SystemsResearch Institute), similar to Love et al. (2015) andQueiroz et al. (2016). CPUE of each species was aver-aged over 0.25 × 0.25° grid cells for analysis by theGi* statistic (Robinson & Graham 2013). The Gi* sta-tistic indicates the level of clustering of CPUE, withpositive and negative values noting areas wherepelagic sharks are most (hot spots) and least (coldspots) encountered, respectively. A standard dis-tance calculation was used to determine the optimaldistance band based on the average distance to the30 nearest neighbors after removing locational out-liers, features more than 3 standard deviations awayfrom their closest non-coincident neighbor. Areaswere considered significantly hot (positive Gi*) orcold (negative Gi*) at p ≤ 0.05. Catch data fromMarch to November (i.e. shark season) and Decem-ber to February (i.e. dolphinfish season) were ana-lyzed separately because fishing techniques andgear characteristics of vessels vary for each distinctfishing season.
RESULTS
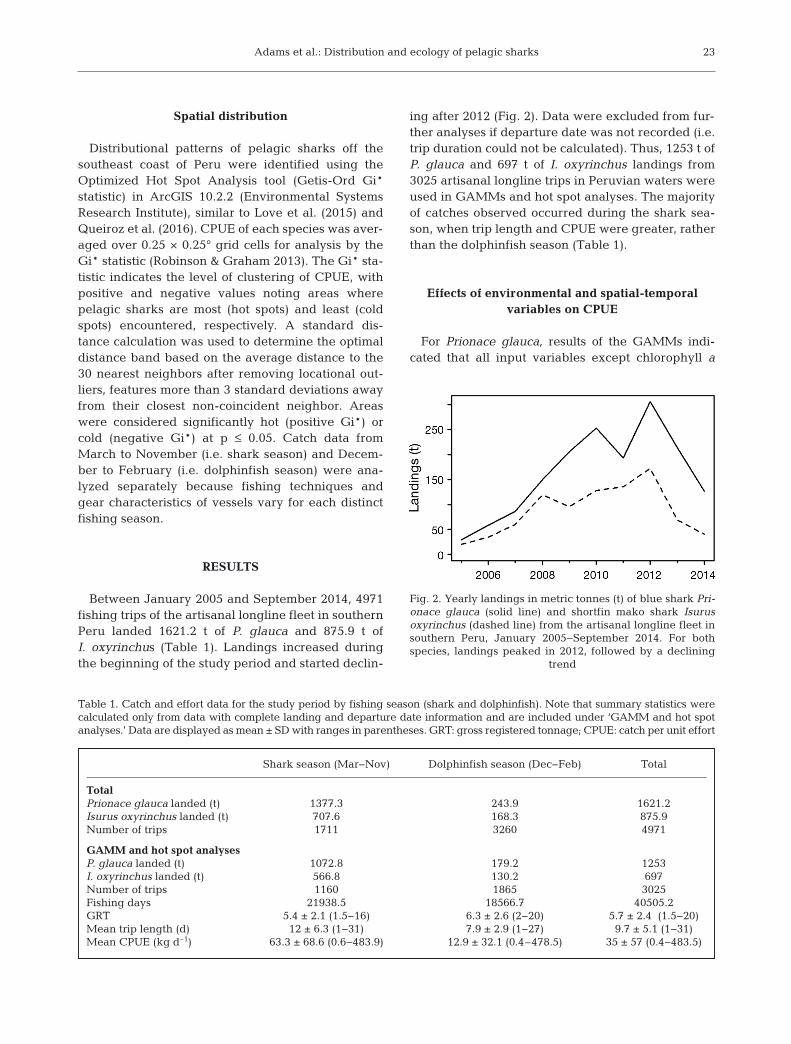
Between January 2005 and September 2014, 4971fishing trips of the artisanal longline fleet in southernPeru landed 1621.2 t of P. glauca and 875.9 t ofI. oxyrinchus (Table 1). Landings increased duringthe beginning of the study period and started declin-
ing after 2012 (Fig. 2). Data were excluded from fur-ther analyses if departure date was not recorded (i.e.trip duration could not be calculated). Thus, 1253 t ofP. glauca and 697 t of I. oxyrinchus landings from3025 artisanal longline trips in Peruvian waters wereused in GAMMs and hot spot analyses. The majorityof catches observed occurred during the shark sea-son, when trip length and CPUE were greater, ratherthan the dolphinfish season (Table 1).
Effects of environmental and spatial-temporalvariables on CPUE
For Prionace glauca, results of the GAMMs indi-cated that all input variables except chlorophyll a
23
Shark season (Mar−Nov) Dolphinfish season (Dec−Feb) Total
TotalPrionace glauca landed (t) 1377.3 243.9 1621.2Isurus oxyrinchus landed (t) 707.6 168.3 875.9Number of trips 1711 3260 4971
GAMM and hot spot analysesP. glauca landed (t) 1072.8 179.2 1253I. oxyrinchus landed (t) 566.8 130.2 697Number of trips 1160 1865 3025Fishing days 21938.5 18566.7 40505.2GRT 5.4 ± 2.1 (1.5−16) 6.3 ± 2.6 (2−20) 5.7 ± 2.4 (1.5−20)Mean trip length (d) 12 ± 6.3 (1−31) 7.9 ± 2.9 (1−27) 9.7 ± 5.1 (1−31)Mean CPUE (kg d−1) 63.3 ± 68.6 (0.6−483.9) 12.9 ± 32.1 (0.4–478.5) 35 ± 57 (0.4−483.5)
Table 1. Catch and effort data for the study period by fishing season (shark and dolphinfish). Note that summary statistics were calculated only from data with complete landing and departure date information and are included under ‘GAMM and hot spotanalyses.’ Data are displayed as mean ± SD with ranges in parentheses. GRT: gross registered tonnage; CPUE: catch per unit effort
Fig. 2. Yearly landings in metric tonnes (t) of blue shark Pri-onace glauca (solid line) and shortfin mako shark Isurusoxyrinchus (dashed line) from the artisanal longline fleet insouthern Peru, January 2005−September 2014. For bothspecies, landings peaked in 2012, followed by a declining
trend

Endang Species Res 31: 19–32, 2016
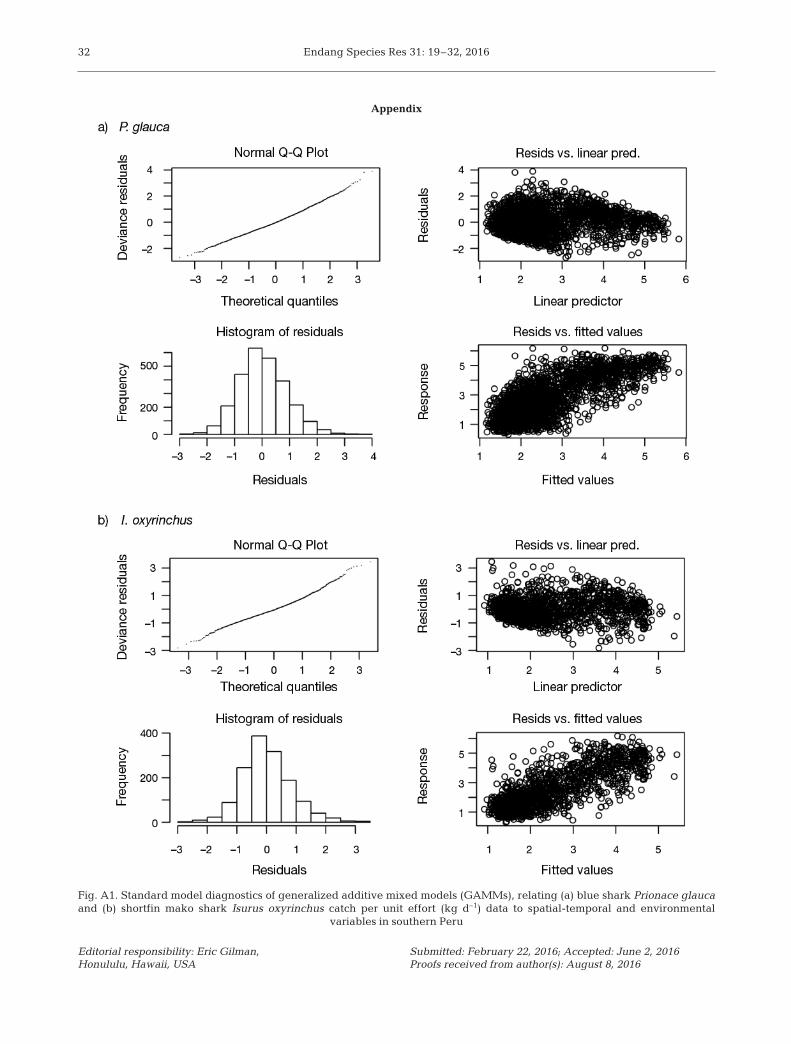
were significant predictors of CPUE (Table 2). ForIsurus oxyrinchus, 8 of the 10 input variables weresignificant predictors of CPUE (Table 2). Modellingexplained the majority of the deviance for P. glauca(adjusted r2 = 0.58) and I. oxyrinchus (adjusted r2 =0.61). Standard model diagnostics suggested that bothmodels fit the data well (Fig. A1 in the Appendix).
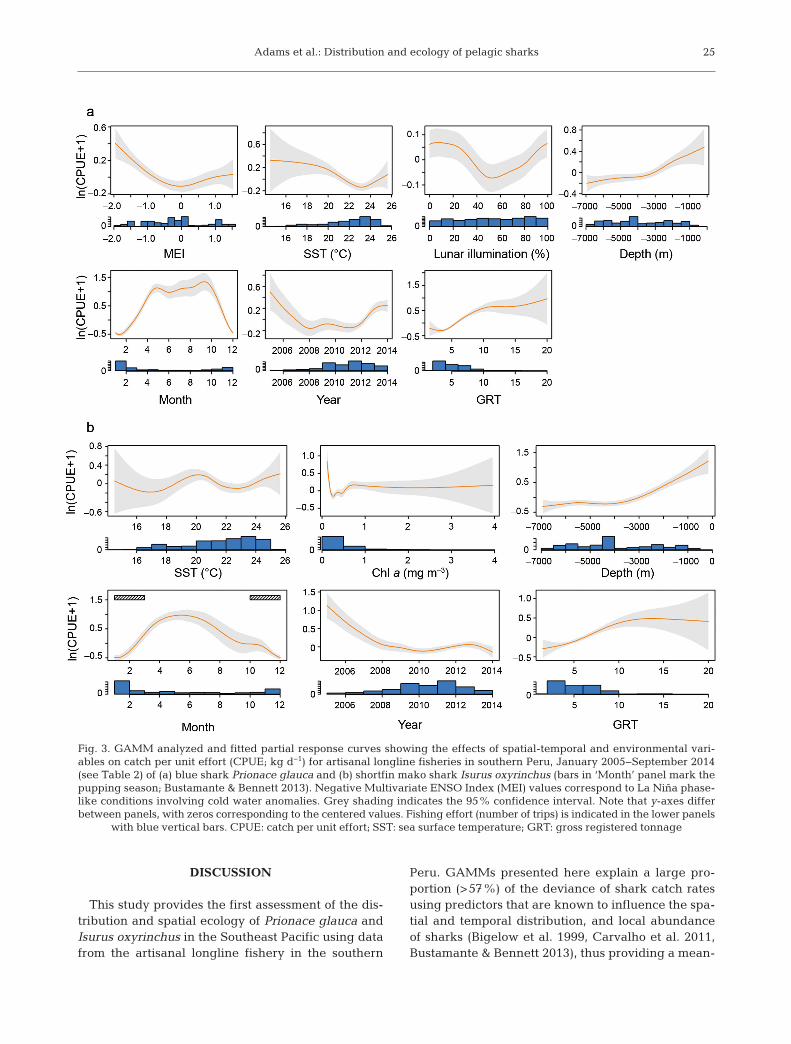
The effect of the MEI variable on P. glauca andI. oxyrinchus peaked at −2.0, dropping as MEI in -creased, indicating a positive correlation betweenCPUE and La Niña ENSO phase-like conditions (i.e.cooling events; Fig. 3). MEI values between 0.5 and1.5 had no effect on P. glauca CPUE. Peak P. glaucaCPUE occurred when lunar illumination was 0 and100% (Fig. 3a). The influence of SST on P. glaucaCPUE peaked between 14.5 and 20°C, while 20°CSST coincided with elevated CPUE in I. oxyrinchus(Fig. 3b). CPUE of I. oxyrinchus was much greater atchl a values approaching 0 mg m−3, then decreaseddrastically to plateau until 4 mg m−3 (Fig. 3b). Thedepth covariate demonstrated much higher P. glaucaand I. oxyrinchus CPUE at ~1000 m sea depth,decreasing as depth increased. The month predictor
showed that CPUE of P. glauca is highly seasonal,with elevated values from April to October (Fig. 3a).For I. oxyrinchus, peak CPUE was between April andJuly (Fig. 3b). For both species, the year predictordemonstrated steady declines in CPUE until 2008 (P.glauca) and 2010 (I. oxy rin chus), followed by increas-ing and plateauing trends for P. glauca and I. oxy -rinchus towards the end of the study period, respec-tively (Fig. 3). CPUE also in creased for both specieswith increasing GRT, at least up to 10 to 15 GRT(Fig. 3).
CPUE spatial predictions (based on GAMMs) in -dicated much higher CPUE of P. glauca in thesouthwest and north of the study area (Fig. 4a). Incontrast, I. oxyrinchus CPUE was greatest in thesouthwest corner of the study area, declining steeplynorth and eastwards (Fig. 4b). However, the extentof spatial predictions for I. oxyrinchus CPUE wasless than for P. glauca, given the lack of capturesbeyond ~75.5°W.
CPUE spatial distribution and hot spots
Hot spot analyses revealed 3 distinct, and highlyoverlapping (i.e. sympatric), clusters of greaterprobability of encountering P. glauca and I. oxy -rinchus (CPUE) by artisanal longline fisheries dur-ing both the dolphinfish season (December to Feb-ruary) and the shark fishing season (March toNovember; Fig. 5). For P. glauca, 16.5 and 5.4% ofthe area examined in which sharks were presentwas considered a hot spot during the shark anddolphinfish season, respectively (i.e. 15 of 91 and 5of 93 grid cells, respectively). Hot spots of P. glaucaCPUE were located in the southwest corner of thestudy area (Fig. 5). For I. oxyrinchus, 10 and 8% ofthe area in which sharks were captured was con-sidered a hot spot during the shark and dolphinfishseason, respectively (i.e. 8 of 80 and 6 of 75 gridcells, respectively). The I. oxyrinchus hot spotswere located in the southwest and southeast cornerof the study area (Fig. 5). In addition, cold spots foreach species and season were identified along thecoast (Fig. 5, blue region). Overall, 775.1 and 34.7 tof P. glauca and 489 and 82.4 t of I. oxyrinchuswere caught from the identified hot spots duringthe shark and dolphinfish seasons, respectively,indicating the importance of these areas to pelagicsharks in the region. However, only 3.5 and 2.2 t ofI. oxyrinchus were captured during the shark anddolphinfish seasons, respectively, from the hot spotin the southeast of the study area.
24
Predictor edf F p-value
P. glaucaMEI 3.0 8.8 <<0.0001SST 4.0 4.7 <<0.0001Lunar illumination 2.5 2.0 0.0038Depth 3.3 5.6 <<0.0001Month 7.0 98.9 <<0.0001Year 5.7 7.8 <<0.0001GRT 4.7 32.8 <<0.0001Latitude 4.4 10.9 <<0.0001Longitude 7.1 16.0 <<0.0001
I. oxyrinchusSST 5.1 3.8 0.002Chlorophyll a 6.6 6.6 <<0.0001Depth 4.0 17.6 <<0.0001Month 5.9 67.2 <<0.0001Year 5.1 11.0 <<0.0001GRT 3.0 15.9 <<0.0001Latitude 1.0 109.4 <<0.0001Longitude 1.3 44.9 <<0.0001
Table 2. Summary of generalized additive mixed models(GAMMs), relating blue shark Prionace glauca and shortfinmako shark Isurus oxyrinchus catch per unit effort (kg d−1)data to spatial-temporal and environmental variables insouthern Peru (cutoff for significance set at α = 0.01). Datafor the analyses are described in detail in Table 1. MEI: Multivariate ENSO Index; SST: sea surface temperature;GRT: gross registered tonnage; edf: estimated degrees of
freedom
Adams et al.: Distribution and ecology of pelagic sharks
DISCUSSION
This study provides the first assessment of the dis-tribution and spatial ecology of Prionace glauca andIsurus oxyrinchus in the Southeast Pacific using datafrom the artisanal longline fishery in the southern
Peru. GAMMs presented here explain a large pro-portion (>57%) of the deviance of shark catch ratesusing predictors that are known to influence the spa-tial and temporal distribution, and local abundanceof sharks (Bigelow et al. 1999, Carvalho et al. 2011,Bustamante & Bennett 2013), thus providing a mean-
25
Fig. 3. GAMM analyzed and fitted partial response curves showing the effects of spatial-temporal and environmental vari-ables on catch per unit effort (CPUE; kg d−1) for artisanal longline fisheries in southern Peru, January 2005−September 2014(see Table 2) of (a) blue shark Prionace glauca and (b) shortfin mako shark Isurus oxyrinchus (bars in ‘Month’ panel mark thepupping season; Bustamante & Bennett 2013). Negative Multivariate ENSO Index (MEI) values correspond to La Niña phase-like conditions involving cold water anomalies. Grey shading indicates the 95% confidence interval. Note that y-axes differbetween panels, with zeros corresponding to the centered values. Fishing effort (number of trips) is indicated in the lower panels
with blue vertical bars. CPUE: catch per unit effort; SST: sea surface temperature; GRT: gross registered tonnage

Endang Species Res 31: 19–32, 2016
ingful interpretation of the ecological processes thatmay affect these species in the Southeast Pacific.Given the importance of artisanal fisheries in theregion (Alfaro-Shigueto et al. 2010, Estrella Arellano& Swartzman 2010) and related conservation con-cerns, the present study addresses pertinent gaps inour understanding of the distribution and ecology ofpelagic sharks in the Southeast Pacific.
Impacts of ENSO
The study assessed for the first time the non-lineareffects of ENSO on P. glauca and I. oxyrinchus insouthern Peru. Previously, Gonzalez-Pestana et al.(2014) found a positive correlation between ENSOand P. glauca and I. oxyrinchus monthly landings bythe artisanal longline fishery in Peru using linearregression. The use of CPUE and GAMMs suggeststhat these models more accurately reveal possiblenon-linear effects of ENSO on shark fisheries insouthern Peru. In contrast to Gonzalez-Pestana et al.(2014), the present study found that P. glauca isimpacted by strong La Niña events (i.e. when MEIwas negative) and ENSO has no significant impacton I. oxyrinchus. Further differences between the
results of the present study and those ofGonzalez-Pestana et al. (2014) may bedue to latitude, interdecadal climateregime (i.e. El Viejo vs. La Vieja), orarea-specific effects of ENSO, as Gon-zalez- Pestana et al. (2014) analyzeddata from the entire country coveringmultiple interdecadal climate regimes.The time period of the present studylacked strong El Niño events and rep-resents the La Vieja regime, marked bycooler waters and the dominance of an -chovies over sardines (Chavez et al.2003). Thus, further study is warrantedto examine the impacts of El Viejo andstrong positive ENSO anomalies. Giventhe large horizontal distributions of theexamined species beyond the studyarea and exclusion of a temporal lag toaccount for possible population growth,ENSO most likely alters the local abun-dance of P. glauca in southern Peru.ENSO anomalies influence the distri-bution of large pelagic species such asblue marlin Makaira nigricans by alter-ing the location of favorable habitat (i.e.temperature and primary production)
(Su et al. 2011). In addition, alterations in the hori-zontal distribution and abundance of prey speciesdue to ENSO (Ñiquen & Bouchon 2004, Adams & Flo-res 2016) could act as a driver of local shark abun-dances, as documented for other upper trophic levelspecies (Cury et al. 2000).
Ecology
Environmental predictors such as SST and chl aplay significant roles in the local abundance patternsof pelagic sharks due to optimal thermal ranges andfood availability (Bigelow et al. 1999, Carvalho et al.2011, Mitchell et al. 2014). As demonstrated by ourresults, CPUE was greatest at 14.5 to 20°C for P.glauca and 20°C for I. oxyrinchus. These results aresimilar to studies in the North Pacific (Walsh &Kleiber 2001) and South and North Atlantic (Car-valho et al. 2011, Vandeperre et al. 2014) which re -ported that P. glauca CPUE was greatest at tempera-tures ranging from 16 to 21°C. Furthermore, taggingof I. oxyrinchus by Abascal et al. (2011) in Chileanwaters found that relative time spent at a certaintemperature peaked between 20 and 22°C. Similar towork in the northern Pacific (Walsh & Kleiber 2001),
26
Fig. 4. Spatial distribution of GAMM-predicted natural log-transformedcatch per unit effort (CPUE; kg d−1) of (a) blue shark Prionace glauca and (b)shortfin mako shark Isurus oxyrinchus caught by the artisanal longline fleetin southern Peru, January 2005−September 2014. Colour scale indicated by
the numbers next to the isopleths

Adams et al.: Distribution and ecology of pelagic sharks
we noticed an increase in P. glauca CPUE at the high-est temperatures ob served, al though the underpin-ning mechanism is unknown.
Primary production may act as a proxy of prey avail-ability because many of the prey species of pelagicsharks are reliant on primary production (Chassot etal. 2010). Correspondingly, chl a plays a significantrole in abundance patterns of pelagic sharks (Car-valho et al. 2011). In eastern boundary upwellingecosystems (EBUEs) migratory sharks forage prima-rily on the edge of highly productive upwelling envi-ronments (Chavez & Messié 2009). Thus, as expected,I. oxy rinchus catch rates were highest when primaryproduction was lowest.
Lunar illumination and lunar phase affect fish spe-cies in multiple manners, including visual detectionof prey and predator camouflage, and may changefish distribution, thermal exposure, and activity pat-
terns (Metcalfe et al. 1997, Hanson et al. 2008, Aare-strup et al. 2009, Afonso & Hazin 2015, Papastama-tiou et al. 2015, Schabetsberger et al. 2015). Sharkprey species may modify vertical distributions ac -cording to the lunar phase (Schabetsberger et al.2013, 2015), suggesting that lunar phase (and illumi-nation) influences the distribution of foraging sharks.Because lunar effects on pelagic sharks are unknownin the Southeast Pacific, the effects of lunar illumina-tion were tested on P. glauca and I. oxyrinchusCPUE. Despite the fact that the 2 species are sym-patric and may have been foraging on similar preyspecies, results revealed contrasting findings, withno lunar effects on I. oxyrinchus, whereas P. glaucaCPUE varied with lunar illumination. Previous stud-ies of lunar effects on P. glauca and I. oxyrinchushave not reported consistent findings. In the northernAtlantic Ocean, Vandeperre et al. (2014) found that
27
Fig. 5. Long-term distributional patterns in (a) blue shark Prionace glauca and (b) shortfin mako shark Isurus oxyrinchus catchper unit effort (CPUE; kg d−1). Spatial patterns for each species were computed using the Getis-Ord hot spot analysis Gi* sta-tistic (z-score), with positive and negative Gi* statistics indicating hot (red) and cold (blue) areas, respectively, for the proba-bility of encountering each species in southern Peru. Circles represent CPUE hot spots during the dolphinfish season (Decem-ber to February) and squares represent CPUE hot spots from the shark fishing season (March to November). Areas wereconsidered significantly hot or cold at p ≤ 0.05 (|Gi*| ≥ 1.96). Open circles along the shoreline indicate ports significant to the
pelagic artisanal fishery. Depth contours represent the 2000 (solid line) and 4000 m (dashed lines) isobaths

Endang Species Res 31: 19–32, 2016
P. glauca CPUE peaked at intermediate moons,partly supported by Lowry et al. (2007) who reportedthat CPUE of P. glauca and I. oxyrinchus peaked dur-ing the waxing crescent in the western South Pacific.Poisson et al. (2010) reported no lunar effects onCPUE of P. glauca and Isurus spp. in the westernIndian Ocean. In support of the present study, Bigelowet al. (1999) found that P. glauca CPUE tended topeak during new moon and full moon in the NorthPacific. The varying findings indicate that the mech-anistic basis for lunar effects on shark CPUE maycomprise a complex array of factors, perhaps includ-ing the behavior of various prey species. However,the effects of mixed-layer depth, thermocline, loca-tions of marine fronts, oxygen concentration, andother oceanographic factors not included in the pres-ent study may contribute to unexplained deviance inthe present modeling approach.
Spatial distribution
Both I. oxyrinchus and P. glauca are primarilypelagic species with global distributions (Compagno2001). Many shark species, however, aggregate forforaging or reproduction purposes, and hot spots inabundance and aggregations of pelagic sharks havebeen found in the Northeast Pacific (Williams et al.2010) and the North Atlantic (Vandeperre et al. 2014,Queiroz et al. 2016). The present study adds to thesefindings by describing hot spots in the Southeast Pa-cific. Hypotheses for the importance of shark ag -gregation include reproductive and feeding opportu-nities. Comparable with other species (Williams et al.2010), the tendency of many pelagic sharks to aggre-gate makes them especially vulnerable to overex-ploitation (Litvinov 2006, Dulvy et al. 2008). In thepresent study, the greatest abundance of P. glaucaand I. oxyrinchus was found far offshore (>150 kmfrom the shore) in the southwest corner of the studyarea where there was a statistically significant clus-tering of elevated CPUE (hot spots), corroboratinghigh catch rates in the study area identified by on-board observers (Doherty et al. 2014). The importanceof the hot spots in the southwest is indicated by thefact that a greater percentage of all shark capturesoriginated from these hot spot areas. However, hotspots for I. oxyrinchus in the southeast of the studyarea were primarily driven by 2 fishing trips with rela-tively high CPUE and therefore these areas are likelynot as significant to local shark populations and theartisanal fishery. GAMMs indicate another concentra-tion of elevated CPUE for P. glauca further north in
the study area. While fishing effort is minimal in thisregion, aggregations of P. glauca have previouslybeen found associated with the Nasca Ridge (Litvinov2006; Fig. 1). Given that GAMMs standardize CPUEto vessel size (GRT), temporal, and environmentalpredictors, spatial distribution of CPUE as predictedby GAMMs may more accurately portray the true dis-tribution of the examined species than hot spot analy-sis. In addition, both methods indicate that the studyarea does not completely cover the population centersof these sharks, and international effort is required tofully elucidate the distribution of both species.
Temporal patterns
As described previously, the shark fishery in Peruis seasonal (Doherty et al. 2014). Bait species de-scribed by Doherty et al. (2014) follow seasonal abun-dance patterns (Estrella Arellano & Swartzman 2010)that correspond to peak shark CPUE. Thus, sharkabundance patterns in the study area may follow sea-sonal prey abundance patterns to take advantage ofgreater prey availability. However, because gearcharacteristics and fishing techniques change de-pending on the season (Alfaro-Shigueto et al. 2010),seasonal trends in CPUE in our GAMMs may partlyreflect gear- specific selectivity and fleet direction.Therefore, fishery-independent research is nee ded toexamine seasonal migration and abundance patterns.
Corroborating the increasing landings up until2010 (Gonzalez-Pestana et al. 2014) and contrary toCPUE reported by previous studies (Doherty et al.2014), the present study found a decline in the CPUEof P. glauca and I. oxyrinchus from the beginning ofthe study period to around 2009. In more recentyears, annual landings of P. glauca have declinedalthough CPUE has increased. While assessments ofP. glauca and I. oxyrinchus are absent for the South-east Pacific, assessments from the North Pacificfound declining trends of P. glauca abundance in the2000s when using CPUE data from the Secretariat ofthe Pacific Community’s observer program and ob -servers on longline vessels based in Hawaii (Rice etal. 2014). However, when CPUE series from theJapanese longline fleet were used, abundance esti-mates were more optimistic. In the Southwest Pacific,CPUE for P. glauca and I. oxy rinchus generally in -creased between 2005 and 2013 (Francis et al. 2014).Differences between studies are likely due to geo-graphic differences in local population dynamics,fishing pressure and mortality, temporal span of theCPUE series, and CPUE standardization techniques.
28
Adams et al.: Distribution and ecology of pelagic sharks
CONCLUSION
Due to biological constraints related to life history,combined with increasing fishing pressures, P. glau caand I. oxyrinchus have been listed as species of con-servation concern by the IUCN Red List. Despite theseconcerns, the availability of fishery and biological datacontinues to be limited, especially in the Southeast Pa-cific, thus restricting conservation possibilities forthese species. In particular, while Estrella Arellano &Swartzman (2010) note that the accuracy of location offishing site recorded by IMARPE is to within 1 nauticalmile, the present study is limited by the lack of infor-mation on the start and end locations of sets. Soaktime, bait, and gear for each trip, which can affectcatch rates of pelagic sharks, are not recorded by portobservers (Gallagher et al. 2014). Furthermore, due toa lack of available information on the number of setsper trip and hooks per set, the definition of CPUE usedhere may be biased. The present study addressedthese issues by averaging environmental data overlarge grid space to account for possible vessel move-ment, using the most detailed definition of CPUE pos-sible given the data available from the fishery, and us-ing a mixed model structure to account for inter-vesselheterogeneity in gear and fishing techniques. Thesimilarity between these results and previous studies(Walsh & Kleiber 2001, Chavez & Messié 2009, Abas-cal et al. 2011, Doherty et al. 2014, Vandeperre et al.2014) in terms of greater CPUE on the southern borderof the study area, seasonality of the fishery, associa-tions between CPUE at SST, and greater CPUE of I.oxyrinchus at low chlorophyll levels adds credibility tothe findings, despite the apparent limitations. How-ever, more extensive data from fishery (e.g. number ofsets per trip, number of hooks per set, and negativecatch data) and fishery-independent studies areneeded to better evaluate and understand the status,ecology, and distribution of P. glauca and I. oxyrinchusin this region. For example, effort by the artisanallongline fleet has been recorded in Chilean waters(Doherty et al. 2014); however, catch data from theseareas are not accurately georeferenced. Therefore,further effort to improve portside data collection andfisheries-independent surveys are necessary to exam-ine the ecology and distribution of pelagic sharks tothe south of the present study.
Acknowledgments. We thank the staff at IMARPE Ilo andCamaná for their assistance with the acquisition of catchdata and the staff of IMARPE Pisco for their valuable sup-port. This research was supported by a grant (SFRH/ BPD/89473/2012) from the Foundation for Science and Technol-ogy (FCT) in Portugal to J.C.S.
LITERATURE CITED
Aarestrup K, Okland F, Hansen MM, Righton D and others(2009) Oceanic spawning migration of the European eel(Anguilla anguilla). Science 325: 1660
Abascal FJ, Quintans M, Ramos-Cartelle A, Mejuto J (2011)Movements and environmental preferences of the short-fin mako, Isurus oxyrinchus, in the southeastern PacificOcean. Mar Biol 158: 1175−1184
Adams GD, Flores D (2016) Influencia de El Niño Oscilacióndel Sur en la disponibilidad y abundancia de recursoshidrobiológicos de la pesca artesanal en Ica, Perú. RevBiol Mar Oceanogr 51: 265–272
Afonso AS, Hazin FHV (2015) Vertical movement patternsand ontogenetic niche expansion in the tiger shark,Galeocerdo cuvier. PLoS ONE 10: e0116720
Alfaro-Shigueto J, Mangel JC, Pajuelo M, Dutton PH, Semi-noff JA, Godley BJ (2010) Where small can have a largeimpact: structure and characterization of small-scalefisheries in Peru. Fish Res 106: 8−17
Arendt MD, Boynton J, Schwenter JA, Byrd JI and others(2012) Spatial clustering of loggerhead sea turtles incoastal waters of the NW Atlantic Ocean: implications formanagement surveys. Endang Species Res 18: 219−231
Barreto R, Ferretti F, Mills J, Amorim A, Andrade H, WormB, Lessa R (2016) Trends in the exploitation of SouthAtlantic shark populations. Conserv Biol 30:792–804
Baum JK, Myers RA (2004) Shifting baselines and thedecline of pelagic sharks in the Gulf of Mexico. Ecol Lett7: 135−145
Bigelow KA, Boggs CH, He X (1999) Environmental effectson swordfish and blue shark catch rates in the US NorthPacific longline fishery. Fish Oceanogr 8: 178−198
Bustamante C, Bennett MB (2013) Insights into the repro-ductive biology and fisheries of two commercially ex -ploited species, shortfin mako (Isurus oxyrinchus) andblue shark (Prionace glauca), in the south-east PacificOcean. Fish Res 143: 174−183
Bustamante C, Vargas-Caro C, Bennett MB (2014) Not allfish are equal: functional biodiversity of cartilaginousfishes (Elasmobranchii and Holocephali) in Chile. J FishBiol 85: 1617−1633
Cailliet GM, Cavanagh RD, Kulka DW, Stevens JD and others (2009) Isurus oxyrinchus. The IUCN Red List ofThreatened Species 2009: e.T39341A10207466. http: // dx.doi.org/10.2305/IUCN.UK.2009-2.RLTS. T39341A10207466.en (accessed 10 Aug 2015)
Campana SE, Marks L, Joyce W, Kohler NE (2006) Effects ofrecreational and commercial fishing on blue sharks (Pri-onace glauca) in Atlantic Canada, with inferences on theNorth Atlantic population. Can J Fish Aquat Sci 63: 670−682
Carvalho FC, Murie DJ, Hazin FHV, Hazin HG, Leite-Mourato B, Burgess GH (2011) Spatial predictions of blueshark (Prionace glauca) catch rate and catch probabilityof juveniles in the Southwest Atlantic. ICES J Mar Sci 68: 890−900
Chassot E, Bonhommeau S, Dulvy NK, Mélin F, Watson R,Gascuel D, Le Pape O (2010) Global marine primary pro-duction constrains fisheries catches. Ecol Lett 13: 495−505
Chavez FP, Messié M (2009) A comparison of eastern bound-ary upwelling ecosystems. Prog Oceanogr 83: 80−96
Chavez FP, Ryan J, Lluch-Cota SE, Niquen CM (2003) Fromanchovies to sardines and back: multidecadal change inthe Pacific Ocean. Science 299: 217−221
29

Endang Species Res 31: 19–32, 2016
Clarke SC, McAllister MK, Milner-Gulland EJ, KirkwoodGP and others (2006) Global estimates of shark catchesusing trade records from commercial markets. Ecol Lett9: 1115−1126
Clarke SC, Harley SJ, Hoyle SD, Rice JS (2013) Populationtrends in Pacific oceanic sharks and the utility of regula-tions on shark finning. Conserv Biol 27: 197−209
Compagno LJV (2001) Sharks of the world. An annotatedand illustrated catalogue of shark species known to date.FAO, Rome
Cury P, Bakun A, Crawford R, Jarre A, Quiñones R, Shan-non L, Verheye H (2000) Small pelagics in upwelling sys-tems: patterns of interaction and structural changes in‘wasp-waist’ ecosystems. ICES J Mar Sci 57: 603−618
Davidson LNK, Krawchuk MA, Dulvy NK (2016) Why haveglobal shark and ray landings declined: improved man-agement or overfishing? Fish Fish 17: 438−458
Dent F, Clarke S (2015) State of the global market for sharkproducts. FAO Fisheries and Aquaculture TechnicalPaper No. 590. FAO, Rome
Doherty PD, Alfaro-Shigueto J, Hodgson DJ, Mangel JC,Witt MJ, Godley BJ (2014) Big catch, little sharks: insightinto Peruvian small-scale longline fisheries. Ecol Evol 4: 2375−2383
Dulvy NK, Baum JK, Clarke S, Compagno LJV and others(2008) You can swim but you can’t hide: the global statusand conservation of oceanic pelagic sharks and rays.Aquat Conserv 18: 459−482
Dulvy NK, Fowler SL, Musick JA, Cavanagh RD and others(2014) Extinction risk and conservation of the world’ssharks and rays. eLife 3:e00590
Estrella C, Guevara-Carrasco R, Palacios J (1998) Informeestadístico de los recursos hidrobiológicos de la pescaartesanal por especies, artes, caletas y meses durante elprimer semestre de 1998. Instituto del Mar del Perú,Callao
Estrella C, Guevara-Carrasco R, Medina A, Palacios J, AvilaYW (1999) Informe estadístico de los recursos hidrobi-ológicos de la pesca artesanal por especies, artes, caletasy meses durante el segundo semestre de 1998. Institutodel Mar del Perú, Callao
Estrella Arellano C, Swartzman G (2010) The Peruvian arti-sanal fishery: changes in patterns and distribution overtime. Fish Res 101: 133−145
FAO (2011) Review of the state of world marine fisheryresources. FAO, Rome
Ferretti F, Myers RA, Serena F, Lotze HK (2008) Loss of largepredatory sharks from the Mediterranean Sea. ConservBiol 22: 952−964
Fischer J, Erikstein K, D’Offay B, Guggisberg S, Barone M(2012) Review of the implementation of the InternationalPlan of Action for the Conservation and Management ofSharks. FAO, Rome
Francis M, Clarke SC, Griggs L, Hoyle SD (2014) Indicatorbased analysis of the status of New Zealand blue, makoand porbeagle sharks. New Zealand fisheries assessmentreport 2014/69. Ministry for Primary Industries, Wellington
Gallagher AJ, Orbesen ES, Hammerschlag N, Serafy JE(2014) Vulnerability of oceanic sharks as pelagic longlinebycatch. Glob Ecol Conserv 1: 50–59
Gilman E, Clarke S, Brothers N, Alfaro-Shigueto J and oth-ers (2007) Shark depredation and unwanted bycatch inpelagic longline fisheries: industry practices and atti-tudes, and shark avoidance strategies. Western PacificRegional Fishery Management Council, Honolulu, HI
Gonzalez-Pestana A, Kouri JC, Velez-Zuazo X (2014) Sharkfisheries in the Southeast Pacific: a 61-year analysis fromPeru. F1000 Res 3: 164
Hanson KC, Arrosa S, Hasler CT, Philipp DP, Niezgoda G,Cooke SJ (2008) Effects of lunar cycles on the activitypatterns and depth use of a temperate sport fish, thelargemouth bass, Micropterus salmoides. Fish ManagEcol 15: 357−364
Hayes CG, Jiao Y, Cortés E (2009) Stock assessment of scal-loped hammerheads in the western North Atlantic Oceanand Gulf of Mexico. N Am J Fish Manage 29: 1406−1417
Ireland L, Connor D (2015) oceancolor_downloader: v1.1.1. IOC, IHO, BODC (2003) Centenary edition of the GEBCO
Digital Atlas (CD-ROM). British Oceanographic DataCentre, Liverpool
Kessel ST, Chapman DD, Franks BR, Gedamke T and others(2014) Predictable temperature-regulated residency,movement and migration in a large, highly mobile mar-ine predator (Negaprion brevirostris). Mar Ecol Prog Ser514: 175−190
Lazaridis E (2014) lunar: Lunar phase & distance, seasonsand other environmental factors (Version 0.1-04). http: //statistics.lazaridis.eu (accessed 20 Jan 2016)
Litvinov FF (2006) On the role of dense aggregations ofmales and juveniles in the functional structure of therange of the blue shark Prionace glauca. J Ichthyol 46: 613−624
Love JW, Newhard JJ, Greenfield B (2015) A geospatialapproach for estimating suitable habitat and populationsize of the invasive northern snakehead. J Fish WildlManag 6: 145−157
Lowry M, Williams D, Metti Y (2007) Lunar landings−relationship between lunar phase and catch rates for anAustralian gamefish-tournament fishery. Fish Res 88: 15−23
Marra G, Wood SN (2011) Practical variable selection forgeneralized additive models. Comput Stat Data Anal 55: 2372−2387
Metcalfe NB, Valdimarsson SK, Fraser NHC (1997) Habitatprofitability and choice in a sit-and-wait predator: juve-nile salmon prefer slower currents on darker nights.J Anim Ecol 66: 866−875
Mitchell JD, Collins KJ, Miller PI, Suberg LA (2014) Quanti-fying the impact of environmental variables upon catchper unit effort of the blue shark Prionace glauca in thewestern English Channel. J Fish Biol 85: 657−670
Myers RA, Baum JK, Shepherd TD, Powers SP, Peterson CH(2007) Cascading effects of the loss of apex predatorysharks from a coastal ocean. Science 315: 1846−1850
Ñiquen M, Bouchon M (2004) Impact of El Niño events onpelagic fisheries in Peruvian waters. Deep Sea Res II 51: 563−574
Papastamatiou YP, Watanabe YY, Bradley D, Dee LE, WengK, Lowe CG, Caselle JE (2015) Drivers of daily routinesin an ectothermic marine predator: hunt warm, restwarmer? PLoS ONE 10: e0127807
Poisson F, Gaertner JC, Taquet M, Durbec JP, Bigelow K(2010) Effects of lunar cycle and fishing operations onlongline-caught pelagic fish: fishing performance, cap-ture time, and survival of fish. Fish Bull 108: 268−281
QGIS Development Team (2015) QGIS Geographic Informa-tion System. Open Source Geospatial Foundation Pro-ject. www.qgis.org
Queiroz N, Humphries NE, Mucientes G, Hammerschlag Nand others (2016) Ocean-wide tracking of pelagic sharks
30
Adams et al.: Distribution and ecology of pelagic sharks 31
reveals extent of overlap with longline fishing hotspots.Proc Natl Acad Sci USA 113: 1582−1587
Quiñones J, Mianzan H, Purca S, Robinson KL, Adams GD,Marcelo Acha E (2015) Climate-driven population sizefluctuations of jellyfish (Chrysaora plocamia) off Peru.Mar Biol 162: 2339−2350
R Core Team (2015) R: a language and environment for sta-tistical computing. R Foundation for Statistical Comput-ing, Vienna. www.r-project.org (accessed 15 July 2015)
Rice J, Harley S, Kai M (2014) Stock assessment of blueshark in the North Pacific Ocean using stock synthesis.WCPFC-SC10-2014/ SA-WP-08. Western Pacific RegionalFishery Management Council, Majuro, Marshall Islands
Robbins WD, Hisano M, Connolly SR, Choat JH (2006)Ongoing collapse of coral-reef shark populations. CurrBiol 16: 2314−2319
Robinson KL, Graham WM (2013) Long-term change in theabundances of northern Gulf of Mexico scyphomedusaeChrysaora sp. and Aurelia spp. with links to climate vari-ability. Limnol Oceanogr 58: 235−253
Salas S, Chuenpagdee R, Seijo JC, Charles A (2007) Chal-lenges in the assessment and management of small-scalefisheries in Latin America and the Caribbean. Fish Res87: 5−16
Schabetsberger R, Økland F, Aarestrup K, Kalfatak D andothers (2013) Oceanic migration behaviour of tropicalPacific eels from Vanuatu. Mar Ecol Prog Ser 475: 177−190
Schabetsberger R, Økland F, Kalfatak D, Sichrowsky U andothers (2015) Genetic and migratory evidence for sym-patric spawning of tropical Pacific eels from Vanuatu.Mar Ecol Prog Ser 521: 171−187
Shester GG, Micheli F (2011) Conservation challenges forsmall-scale fisheries: bycatch and habitat impacts oftraps and gillnets. Biol Conserv 144: 1673−1681
Stehfest KM, Patterson TA, Barnett A, Semmens JM (2014)Intraspecific differences in movement, dive behavior andvertical habitat preferences of a key marine apex preda-tor. Mar Ecol Prog Ser 495: 249−262
Stevens J (2009) Prionace glauca. The IUCN Red List ofThreatened Species 2009: e.T39381A10222811. http: // dx.
doi.org/10.2305/IUCN.UK.2009-2.RLTS.T39381A10222811.en (accessed 10 Aug 2015)
Stevens J, Bonfil R, Dulvy NK, Walker P (2000) The effects offishing on sharks, rays, and chimaeras (chondrichthy-ans), and the implications for marine ecosystems. ICES JMar Sci 57: 476−494
Su NJ, Sun CL, Punt AE, Yeh SZ, Dinardo G (2011) Model-ling the impacts of environmental variation on the distri-bution of blue marlin, Makaira nigricans, in the PacificOcean. ICES J Mar Sci 68: 1072−1080
Vandeperre F, Aires-da-Silva A, Santos M, Ferreira R,Bolten AB, Serrao Santos R, Afonso P (2014) Demogra-phy and ecology of blue shark (Prionace glauca) in thecentral North Atlantic. Fish Res 153: 89−102
Velez-Zuazo X, Alfaro-Shigueto J, Mangel J, Papa R,Agnarsson I (2015) What barcode sequencing revealsabout the shark fishery in Peru. Fish Res 161: 34−41
Walsh WA, Kleiber P (2001) Generalized additive model andregression tree analyses of blue shark (Prionace glauca)catch rates by the Hawaii-based commercial longlinefishery. Fish Res 53: 115−131
Williams R, Okey TA, Wallace SS, Gallucci VF (2010) Sharkaggregation in coastal waters of British Columbia. MarEcol Prog Ser 414: 249−256
Wolff M, Taylor M, Mendo J, Yamashiro C (2007) A catchforecast model for the Peruvian scallop (Argopecten pur-puratus) based on estimators of spawning stock and set-tlement rate. Ecol Model 209: 333−341
Wolter K, Timlin MS (2011) El Niño/Southern Oscillationbehaviour since 1871 as diagnosed in an extended multi-variate ENSO index (MEI.ext). Int J Climatol 31: 1074−1087
Wood SN (2006) Generalized additive models: an introduc-tion with R, 1st edn. Chapman & Hall/CRC, Boca Raton,FL
Wood SN, Scheipl F (2014) gamm4: Generalized additivemixed models using mgcv and lme4. http: //CRAN.R-project. org/package=gamm4 (accessed 14 Jan 2016)
Worm B, Davis B, Kettemer L, Ward-Paige CA and others(2013) Global catches, exploitation rates, and rebuildingoptions for sharks. Mar Policy 40: 194−204
➤
➤
➤
➤
➤
➤
➤
➤
➤
➤
➤
➤
➤
➤
➤
➤
Endang Species Res 31: 19–32, 201632
Fig. A1. Standard model diagnostics of generalized additive mixed models (GAMMs), relating (a) blue shark Prionace glaucaand (b) shortfin mako shark Isurus oxyrinchus catch per unit effort (kg d–1) data to spatial-temporal and environmental
variables in southern Peru
Editorial responsibility: Eric Gilman, Honululu, Hawaii, USA
Submitted: February 22, 2016; Accepted: June 2, 2016Proofs received from author(s): August 8, 2016
Appendix
Top Related