


Languages
Pages
Legal


South East Route 2011/12 Scour Assessment Programme
Detailed Scour Assessment Report
Bridge: ESK-1209 at 111miles 0968yards
June 2012
Network Rail – South East Route
General Offices
Waterloo Station
LONDON
SE1 8SW

2012_ESK_1209_S3.doc
JBA Office
JBA Consulting The Old School House St. Joseph’s Street Tadcaster North Yorkshire LS24 9HA
JBA Project Manager
Matthew Kendall
Revision History
Revision Ref / Date Issued Amendments Issued to
1.0 / June 2012 - Stuart Hines-Randle
Contract
This report describes work commissioned by Network Rail. Network Rail’s representative for the contract was Stuart Hines-Randle. Matthew Kendall and Richard Buck of JBA Consulting carried out this work.
Prepared by .................................................. Ben Darville HND
Assistant Engineer
Reviewed by ................................................. Matthew Kendall, HNC
Project Manager
Approved by .................................................. Richard Buck BEng CEng MICE MCIWEM
Director
Purpose
This document has been prepared solely as a Detailed Scour Assessment for Network Rail South East Route. JBA Consulting accepts no responsibility or liability for any use that is made of this document other than by the Client for the purposes for which it was originally commissioned and prepared.
Copyright
© Jeremy Benn Associates Limited 2012

2012_ESK_1209_S3.doc
Contents 1. Introduction .......................................................................................................... 1
1.1 Background ............................................................................................................ 1 1.2 About this report .................................................................................................... 1
2. Data gathering ...................................................................................................... 2
2.1 Site location and access ........................................................................................ 2 2.2 Asset data .............................................................................................................. 2 2.3 Structure description .............................................................................................. 2 2.4 Previous Analyses ................................................................................................. 2 2.5 Underwater Examinations...................................................................................... 3 2.6 Archive Drawings ................................................................................................... 3
3. Method .................................................................................................................. 4
3.1 Design flood, water levels and velocities ............................................................... 4 3.2 Depth of scour ....................................................................................................... 4 3.3 Priority category ..................................................................................................... 5
4. Results .................................................................................................................. 6
4.1 Design floods, water levels and velocities ............................................................. 6 4.2 Depth of scour ....................................................................................................... 6 4.3 Priority category ..................................................................................................... 6 4.4 Superstructure ....................................................................................................... 7
5. Conclusions and recommendations .................................................................. 8
5.1 Conclusions ........................................................................................................... 8 5.2 Recommendations ................................................................................................. 8
References......................................................................................................................... 9
A. Appendix A - Figures ........................................................................................... 10
B. Appendix B - Archive Drawing ........................................................................... 13

2012_ESK_1209_S3.doc
List of Tables
Table 2-1: Asset data ...................................................................................................... 2
Table 4-1: Catchment characteristics ........................................................................... 6
Table 4-2: Design floods, water levels and velocities ................................................. 6
Table 4-3: Scour and foundation depths ...................................................................... 6
Table 4-4: Priority category ........................................................................................... 6
Table 5-1: Priority categories and recommended actions ......................................... 8
List of Figures
Figure 1: Location plan (Scale 1:200,000) .................................................................... 10
Figure 2: Location plan (Scale 1:5,000) ........................................................................ 10
Figure 3: Site Plan and Elevation .................................................................................. 11
Figure 4: Photographs ................................................................................................... 12

2012_ESK_1209_S3.doc 1
1. Introduction
1.1 Background
As part of a nationwide survey of railway bridges and culverts over water or likely to be affected by floodwaters, Network Rail South East Route are implementing a rolling programme of assessments in accordance with the Specification NR/SP/CIV/080 Management of Existing Bridges and Culverts, Issue 1, April 2004, and Company Standard NR/CS/CIV/032 Managing Existing Structures, Issue 1, April 2004.
As part of this programme, Network Rail South East Route has let a contract for the inspection and assessment of 320 Underbridges to Jeremy Benn Associates Limited of which the current report forms part.
1.2 About this report
ESK-1209 was assessed in March 2007 using the EX2502 preliminary Scour Assessment Procedure. The findings of the site survey and EX2502 calculation showed the structure to have a Priority Rating of 15.36 i.e. a structure of Medium Priority for scour.
The purpose of this detailed assessment is to undertake a more detailed analysis of scour potential using a combination of computational modelling and further site investigation, if required, to estimate scour depths. A study to determine likely flows, water levels and velocities at the structure for given return periods has been undertaken to establish the risk (if any) posed by floodwaters on the structure and line. The results of these analyses have then been used to re-calculate the Priority Score using the EX2502/BSIS Assessment Procedure.

2012_ESK_1209_S3.doc 2
2. Data gathering
2.1 Site location and access
The site is located between Beccles and Oulton Broad South Stations. Location plans are given in Figures 1 and 2 at the back of this report.
Access to the structure was gained from the A146 heading east from Beccles then taking Marsh Lane through North Cove to Great Carr. After parking at the level crossing, cross the track and then immediately bear left following the drain through woodland towards the structure.
2.2 Asset data
Asset data is given in Table 2-1 below.
Table 2-1: Asset data
Carrs Guid: 3978559D1EBA45D9E04400306E4AD01A
ELR: East Suffolk
Mileage: 111 miles 968yards
Local Route: Anglian
OS NGR: TM 457 907 (645729, 290734)
OS 1:50,000 Sheet: 134
Watercourse Name: River Yare
Watercourse Type: Main River
Agency Region: Anglia Region
Agency Area: Eastern Area
Existing Flood Marker: None Present
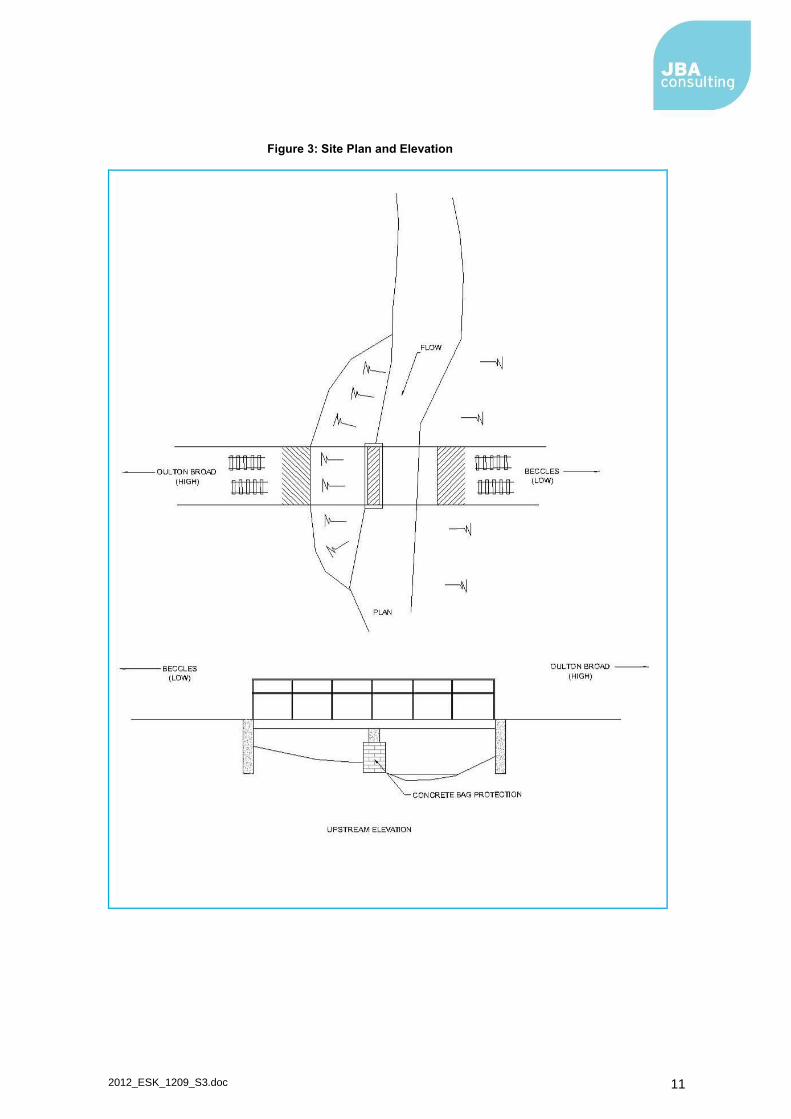
2.3 Structure description
A sketch plan and upstream elevation of the structure is given in Figure 3.
The structure is a two span underbridge with equal 5.5m spans. The abutments and pier are of concrete construction and support a 8.75m wide concrete beam deck.
The central pier is protected by concrete bagwork although archive drawings (dated 1917) suggest this pier and both abutments are actually constructed on timber piles.
The water course is a small drainage channel of flat slope passing through flat dense deciduous woodland. Clearance between bed level and the deck underside is limited to approximately 2.2m. The channel flows through span 1 of the structure, span 2 acting as flood relief. The bed of span 2 was heavily silted and clearance reduced to approximately 1.2m.
The depth and clarity of the water in the channel at the time of inspection prevented any observations being made about the presence of any scour protection on the bed.
2.4 Previous Analyses
JBA Initial Assessment (March 2007): PR 15.36

2012_ESK_1209_S3.doc 3
2.5 Underwater Examinations
Bridgezone (February 2011): The structure was found to be in an overall poor condition with undermining to pier 1 identified as a significant defect. It was strongly recommended that an intrusive structural assessment of pier 1 was carried out to ascertain the impact of the undermining.
However, as it is now known that the structure is founded on timber piles, the works recommended above are not considered appropriate. The undermining identified by the underwater report is simply an undermining of the concrete capping rather than of the bridge substructure itself. The defect therefore has no detrimental effect on the overall of structural stability of the bridge.
2.6 Archive Drawings
An archive drawing of the structure is available a copy of which is shown in Appendix B. The drawing, dated 1917, shows that the bridge supports are founded on timber piles. JBA adopt an assumed foundation of 3m for structures supported by timber piles (see below):

2012_ESK_1209_S3.doc 4
3. Method
3.1 Design flood, water levels and velocities
The design flood is the flood that a structure should withstand without suffering damage, the probability of which is normally expressed by the return period, the average period between events of a similar magnitude. For T-year return period flood, the lifetime probability of exceedance r during a design life N is given by
rT
n1 11
( ) (3.1)
where
r = lifetime probability of exceedance (%)
T = return period of event (years)
N = design life (years)
The design flood for 10 to 200-year return periods were estimated using the Flood Estimation Handbook (Reed, et al, 1999) and in-house Flood Estimation Software (FES) Version 2.0 (JBA Consulting, 2007). The median annual flood (QMED) was estimated from catchment characteristics then scaled up to the design peak flows using a pooled growth curve. The effects of climate change are not considered. The findings are given in Section 4.1.
The design water levels and velocities were estimated using a simple one-dimensional hydraulic model of the watercourse in the vicinity of the structure. The model software was HEC-RAS model (Version 4.1.0, US Army Corps of Engineers, 2010) and the model geometry comprised four cross-sections, two upstream and two downstream of the bridge, based on measurements taken from the topographic survey of the upstream elevation. The modelled water levels and flow velocities are given in Section 4.1. It should be noted that greater confidence in the results could be obtained using topographical survey data of a section of watercourse channel and floodplain.
3.2 Depth of scour
The depth of scour at a structure is the sum of the general scour (also known as contraction scour) and local scour. The depth of general scour dg at the bridge was estimated using NR Scour (JBA Consulting, 1997), which is based on the Bridge scour information system (BSIS) (Bullen and Partners, 1990) and Hydraulic aspects of bridges: assessment of the risk of scour (EX2502) (HR Wallingford, 1993).
The depth of local scour at piers ds was estimated using the method in the Manual on scour at bridges and other hydraulic structures (MAY ET AL, 2002, pp. 70-82), with a safety factor to allow for the probability of scour depth being exceeded during a flood event, and a debris factor to allow for an increase in effective width due to debris accumulation. This method was adopted by JBA Consulting in March 2012 and replaces the method used in previous scour assessments (Melville & Sutherland, 1988). Benefits include a wide range of pier shape factors, user-friendly formulae for alignment, depth and velocity factors. The method was applied using an in-house spreadsheet Local scour at bridges v1.23.xls (JBA Consulting, 2012).
debrisFvelocitydepthshapeangles FSFFFFDd ..... (3.1)
where
ds = depth of local scour (m)
D = width of pier or abutment (m)
Fangle = alignment factor (piers only) (-)
Fshape = shape factor (-)

2012_ESK_1209_S3.doc 5
Fdepth = flow depth factor for piers (-)
Fvelocity = velocity factor (-)
SF = safety factor (-)
Fdebris = debris factor (-)
The depth of local scour at an abutment is given by (Melville, 1995), from Bridge scour (Melville and Coleman, 2000). Local scour depth is related to the discharge intercepted by the embankment rather than the length of the embankment itself. This is an envelope equation and no safety factor is required.
GsyDs KKKKy ... (3-2)
where
KyD = flow depth-foundation width factor (-)
Ks = foundation shape factor (-)
Kθ = foundation alignment factor (-)
KG = approach channel geometry factor (-)
For all calculations it was assumed that there was no scour protection and that the bed material was unchanged with depth.
3.3 Priority category
The preliminary priority rating (PR) was calculated for each bridge element after EX2502 (HR Wallingford, 1993). The PR is a function of the ratio between scour depth and bridge foundation depth and indicates the risk of bridge failure due to scour (Equation 3.3).
f
t
d
dPPR ln15
(3.3)
where
PPR = priority rating (range 10.0-21.0)
dt = depth of total scour below bed level (m)
df = depth of foundation below bed level (m)
If the load bearing material is rock, a satisfactory invert or scour protection is present, then the final priority rating PR is
Priority rating = 10 (Low priority) (3.4)
For all other cases, PR is
Priority rating = PPR + TR + LBM (3.5)
where
PPR = Preliminary priority rating (-)
TR = correction factor for river type (-)
LBM = correction factor for load-bearing material (-)
Finally, a priority score, priority category and recommended action were assigned to each bridge element in accordance with EX2502 (HR Wallingford, 1993) (Table 5-1).
2012_ESK_1209_S3.doc 6
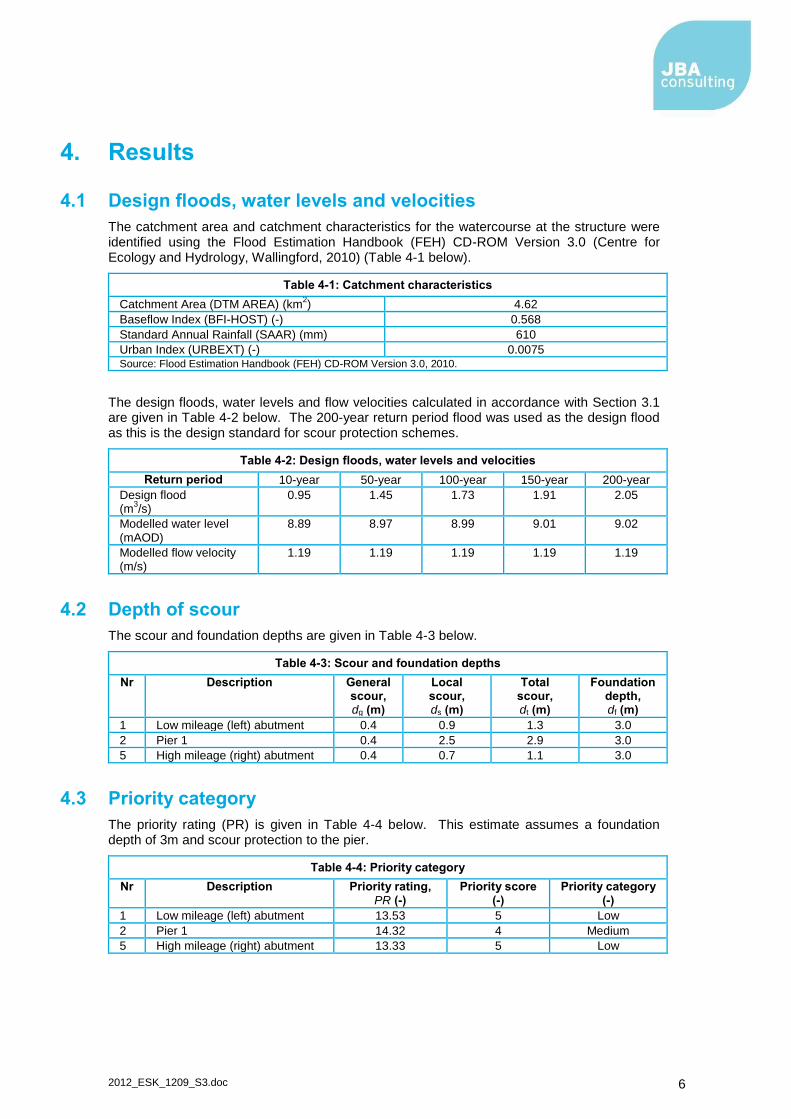
4. Results
4.1 Design floods, water levels and velocities
The catchment area and catchment characteristics for the watercourse at the structure were identified using the Flood Estimation Handbook (FEH) CD-ROM Version 3.0 (Centre for Ecology and Hydrology, Wallingford, 2010) (Table 4-1 below).
Table 4-1: Catchment characteristics
Catchment Area (DTM AREA) (km2) 4.62
Baseflow Index (BFI-HOST) (-) 0.568
Standard Annual Rainfall (SAAR) (mm) 610
Urban Index (URBEXT) (-) 0.0075 Source: Flood Estimation Handbook (FEH) CD-ROM Version 3.0, 2010.
The design floods, water levels and flow velocities calculated in accordance with Section 3.1 are given in Table 4-2 below. The 200-year return period flood was used as the design flood as this is the design standard for scour protection schemes.
Table 4-2: Design floods, water levels and velocities
Return period 10-year 50-year 100-year 150-year 200-year
Design flood (m
3/s)
0.95 1.45 1.73 1.91 2.05
Modelled water level (mAOD)
8.89 8.97 8.99 9.01 9.02
Modelled flow velocity (m/s)
1.19 1.19 1.19 1.19 1.19
4.2 Depth of scour
The scour and foundation depths are given in Table 4-3 below.
Table 4-3: Scour and foundation depths
Nr Description General scour, dg (m)
Local scour, ds (m)
Total scour, dt (m)
Foundation depth, df (m)
1 Low mileage (left) abutment 0.4 0.9 1.3 3.0
2 Pier 1 0.4 2.5 2.9 3.0
5 High mileage (right) abutment 0.4 0.7 1.1 3.0
4.3 Priority category
The priority rating (PR) is given in Table 4-4 below. This estimate assumes a foundation depth of 3m and scour protection to the pier.
Table 4-4: Priority category
Nr Description Priority rating, PR (-)
Priority score (-)
Priority category (-)
1 Low mileage (left) abutment 13.53 5 Low
2 Pier 1 14.32 4 Medium
5 High mileage (right) abutment 13.33 5 Low

2012_ESK_1209_S3.doc 7
4.4 Superstructure
The bridge soffit is 10.00mALD and design flood water level is 9.02mALD. During the design flood, the bridge has a freeboard of 0.98 metres and flood water levels are unlikely to reach the deck or cause track flooding.
However, the risk of flooding or surcharging may increase in the future due to blockage at the structure, accumulations of sediment, climate change or changes within the catchment area.

2012_ESK_1209_S3.doc 8
5. Conclusions and recommendations
5.1 Conclusions
5.1.1 Priority Rating
For an assumed foundation depth of 3.0 metre, this bridge falls within the Low priority category, with a priority score of 4 and a preliminary priority rating of 14.32.
5.1.2 Superstructure
For the design flood, the bridge has a freeboard of 0.98 metres and there is a low risk of surcharging of the bridge or inundation of the track.
5.2 Recommendations
5.2.1 Flood warning procedure
The EX2502 procedure for Medium priority bridges should be adopted for this bridge, in accordance with NR/SP/CIV/080 (Table 5-1).
Table 5-1: Priority categories and recommended actions
Priority rating Priority score
Priority category
Recommended Action
17.01 - 21.0 Priority 1 High Detailed Hydraulic Assessment. If the High Priority is confirmed then the structure is to be included in the flood warning plan or physical protection works to be constructed. Whilst at High Priority the structure should have yearly underwater exams. The priority should be reviewed following protection works, a flood event or underwater exam.
16.01 – 17.00 Priority 2
15.01 – 16.00 Priority 3 Medium Repeat of EX2502 assessment and underwater exams (where necessary) every 3 years. The priority should be reviewed following protection works, a flood event or underwater exam.
14.01 – 15.00 Priority 4
13.01 – 14.00 Priority 5 Low Repeat of EX2502 assessment every 6 years and underwater exams (where necessary) every 3 years. The priority should be reviewed following protection works, a flood event or underwater exam.
10.00 – 13.00 Priority 6
5.2.2 Foundations
Coring is not considered necessary at this structure.
5.2.3 Routine examinations
In addition regular inspections for scour and flood damage, particularly following a major flood, should be carried out and the bridge reassessed using the EX2502 calculation procedure at a minimum interval of every 3 years.
Furthermore, it is also recommended that underwater examinations of the structure be undertaken every 3 years dependent on the results of first examination.
5.2.4 Remedial works
It is recommended that the recently installed concrete bagwork is removed and replaced with rock armour around the base of Pier 1 to prevent any further loss of bed material.
5.2.5 Superstructure
We consider it unnecessary to include this structure in the current zonal flood plan for water pressure.
2012_ESK_1209_S3.doc 9
References
BULLEN AND PARTNERS (1994) Bridge scour information system
HIGHWAYS AGENCY (1994) The design of highway bridges for hydraulic action, Advice Note BA59/94.
HIGHWAYS AGENCY (1998) Assessment of Scour at Highway Bridges, Revision D, Advice Note.
HR WALLINGFORD (1993) Hydraulic Aspects of Bridges - Assessment of the Risk of Scour, Report EX2502, HR Wallingford, Wallingford. This is the Preliminary Scour Assessment Procedure developed for British Rail which provides an indicative assessment of scour at a structure based on a site visit, measurement of key structure dimensions and a simple assessment of river geomorphology.
JBA CONSULTING (1997) NR Scour. Replaces the former BSIS (Bridge Scour Information System). A database developed for British Rail Engineering Technical Support Group, Kings Cross, NR Scour is essentially a computerised version of the EX2502 scour assessment procedure and contains information on: ELR, Bridge Name, Mileage, Watercourse crossed, Bridge and stream type, Details of diving and coring surveys, Details of EX2502 scour assessments.
MAY, R.W.P., ACKERS, J.C. and KIRBY, A.M. (2002) Manual on scour at bridges and other hydraulic structures, Report C551, Construction Industry Research and Information Association (CIRIA), London.
MELVILLE B.W. & SUTHERLAND, A.J. (1988) Design Method for Local Scour at Bridge Piers, In: Journal of Hydraulic Engineering, Vol.114(10), 1988, ASCE.
NETWORK RAIL (2004) Management of Existing Bridges and Culverts, Issue 1, Specification NR/SP/CIV/080.
NETWORK RAIL (2004) Managing Existing Structures, Issue 1, Company Standard NR/CS/CIV/032.
REED D. et al (1999) Flood Estimation Handbook, 5 Volumes. CEH Institute of Hydrology, Wallingford.

2012_ESK_1209_S3.doc 10
A. Appendix A - Figures
Figure 1: Location plan (Scale 1:200,000)
Scale 1:200,000
Contains Ordnance Survey data © Crown copyright and database right 2012
Figure 2: Location plan (Scale 1:5,000)
Scale 1:5,000
Contains Ordnance Survey data © Crown copyright and database right 2012
2012_ESK_1209_S3.doc 11
Figure 3: Site Plan and Elevation

2012_ESK_1209_S3.doc 12
Figure 4: Photographs
Photograph 1 Downstream elevation
Photograph 2 View downstream

2012_ESK_1209_S3.doc 13
B. Appendix B - Archive Drawing

Offices at
Atherstone
Doncaster
Edinburgh
Haywards Heath
Limerick
Newcastle upon Tyne
Newport
Saltaire
Skipton
Tadcaster
Wallingford
Warrington
Registered Office South Barn
Broughton Hall
SKIPTON
North Yorkshire
BD23 3AE
t:+44(0)1756 799919 e:[email protected]
Jeremy Benn Associates Ltd Registered in England 3246693
Visit our website
www.jbaconsulting.com
Top Related