


Languages
Pages
Legal


INTEGRATED MASTER IN ENVIRONMENTAL ENGINEERING 2015/2016
SOLAR EVAPORATION SYSTEM: MODELING AND CONTROLLING BRINE TREATMENT PONDS
Maria Luís Almeida e Sousa
Dissertation submitted for the degree of
MASTER IN ENVIRONMENTAL ENGINEERING
President of the jury: Assistant Professor Cidália Maria de Sousa Botelho from the Chemical Engineering Department of the Faculty of Engineering University of Porto.
Supervisor at the University: Associate Professor Luís Miguel Palma Madeira from the Chemical Engineering Department of the Faculty of Engineering University of Porto.
Supervisors at the hosting institution: Eng. Mario Heredero and Eng. Jordi Maciá of CTM (Centre Tecnologic Manresa)
March 2016

SOLAR EVAPORATION SYSTEM: MODELING AND CONTROLLING BRINE TREATMENT PONDS.
2
March 2016

SOLAR EVAPORATION SYSTEM: MODELING AND CONTROLLING BRINE TREATMENT PONDS.
3
Agradecimentos/ Acknowledgements
Aos meus orientadores no CTM, Jordi Mácia e Mario Heredero que além de serem grandes
pessoas se preocuparam em integrar-me e ajudar-me ao longo do projecto tornando-o “mais
fácil”. E também obrigada por tudo que aprendi e por terem tornado a estadia fora ainda melhor.
Ao meu orientador da FEUP, Prof. Miguel Madeira por tornar esta tese o melhor possível.
Aos meus pais, por todas as oportunidades que me proporcionaram para chegar onde estou
porque sem eles não seria possível. Também por toda ajuda e carinho e por acreditarem.
Também gostaria de agradecer a Chivas e ao Scott pelo apoio e momentos de distracção e
carinho que proporcionaram.
Às minhas melhores amigas, Piu. Eduarda e Madalena, por todo o apoio, preocupações e ajuda
ao longo destes 5 anos de estudante e não só. Sem elas seria muito mais difícil conseguir
finalmente chegar a esta recta final.
Aos meus amigos por todo o apoio que deram ao longo destes meses (e não só) e em especial
ao Paulo Moreira Ferreira, Hugo Vasconcelos, António Fernandes, Carlos Guerreiro e Rui Silva
Carvalho, não só pelo apoio mas pela ajuda que me proporcionaram apesar de ter estado fora.
Também quero agradecer ao Francisco Magalhães e ao Francisco Ortigão.
Ao José Maria Cudell por ser um grande amigo e sempre me ter ajudado ao longo dos meus
tempos de estudante e principalmente por me ter ajudado bastante no início desta fase final.
A todos os meus grandes amigos que fiz ao longo dos 5 anos na faculdade que nunca pensei
que faria, por serem como são e por terem tornado tudo muito fácil e tornando-me mais feliz.
Ao Filipe Martinho.
SOLAR EVAPORATION SYSTEM: MODELING AND CONTROLLING BRINE TREATMENT PONDS.
4
Sumário
O planeta Terra está a sofrer um problema de escassez de água que pode ser causado por
quatro diferentes causas: alterações climáticas, poluição, agricultura e crescimento populacional.
De maneira a tentar resolver este problema, várias técnicas foram estudadas e estão a ser
melhoradas, mas a melhor aposta será a dessalinização da água do mar.
Existem vários processos de dessalinização: dessalinização térmica (dessalinização multi-flash,
dessalinização multi efeito e compressão de vapor) e dessalinização por membranas (osmose
inversa e electrodiálise).
O projecto em que esta tese é baseada chama-se Zelda: dessalinização com descarga zero.
No projecto Zelda, a água do mar é tratada por osmose inversa e electrodiálise metátese e um
dos produtos finais, a salmoura, é sujeita a um tratamento por evaporação solar em dois tanques
(um aberto e outro fechado com uma ventoínha).
Os tanques são estudados nesta tese e o objectivo é criar um modelo em Matlab que consiga
prever o comportamento dos tanques no que diz respeito à transferência de calor e massa
(avaliando o nível de água dos tanques) e avaliar se funcionam como previsto para se conseguir
cumprir o objectivo do projecto Zelda: recuperar os sais e evitar a sua descarga outra vez nos
oceanos, o que pode provocar impactes negativos no ecossitema.
Para criar este modelo foram escritos dois sub-modelos em Matlab, baseados num projecto
designado por AQUASOL. Um dos sub-modelos é o mesmo que no projecto AQUASOL (Modelo
2) e o outro sub-modelo foi posteriormente desenvolvido pelo CTM de acordo com as restrinções
e casos previstos (Modelo 1).
Após comparação dos dois sub-modelos e aquisição dos dados foi obtido um modelo final de
modo a prever as transferências de calor e massa que ocorrem dentro dos tanques.
Palavras-chave: dessalinização, evaporação solar, transferência de calor.

SOLAR EVAPORATION SYSTEM: MODELING AND CONTROLLING BRINE TREATMENT PONDS.
5
Abstract
Our planet Earth is facing a water scarcity problem that can be caused by four different factors:
climate changes, pollution, agriculture and population growth.
In order to solve this problem, many techniques have been developed and are being improved,
but the best bet is seawater desalination.
There are many processes for water desalination: thermal desalination (multi flash distillation,
multi effect distillation and vapor compression) and desalination by membranes (reverse osmosis
and electrodialysis).
This thesis is about the final part of a project called Zelda: Zero Liquid Discharge Desalination.
In the Zelda project the seawater is treated by reverse osmosis and electrodialysis methatesis
processes and one of the final products, the brine, is treated by a solar evaporation process in
two ponds (one open and the other closed with a fan).
The ponds are the ones being studied in this thesis and the objective is to create a Matlab model
that can predict the behaviour of the ponds in what concerns heat and mass transfer (assessing
the water level in the ponds) and analyse if they work as expected in order to fullfill the main
objective of the Zelda project: recover the salts and avoid their release back to the oceans, which
can provoque negative impacts on the ecosystem.
In order to create this Matlab model, two sub-models were written, based on a project called
AQUASOL. One of the models is the same as in the AQUASOL project, and the other one was
developed by the CTM team and me with all the restritions and conditions of the ponds.
After comparation of both sub-models and data acquisition, a new final model was written in a
way that the heat and mass transfers inside the ponds could be estimated.
Key words: desalination, solar evaporation, heat tranfer.
SOLAR EVAPORATION SYSTEM: MODELING AND CONTROLLING BRINE TREATMENT PONDS.
6
Index
Notation ....................................................................................................................................... 10
Glossary ....................................................................................................................................... 11
1 Introduction .......................................................................................................................... 12
1.1 Zelda project ................................................................................................................ 15
2 Desalination Processes ....................................................................................................... 16
2.1 Reverse Osmosis (RO) ................................................................................................ 16
2.2 Multistage Flash Distillation (MSF) ............................................................................... 18
2.3 Multi Effect Distillation (MED) ....................................................................................... 19
2.4 Vapor Compression (VC) ............................................................................................. 20
2.5 Electrodialysis (ED) ...................................................................................................... 21
2.6 Comparing the processes ............................................................................................ 22
2.7 Plants in the world, main companies ............................................................................ 24
2.7.1 Arab States of the Gulf (GCC) ................................................................................. 24
3 The Zelda project description ............................................................................................... 27
3.1 Pilot plant: Almeria ....................................................................................................... 28
3.2 Electrodialysis metathesis (EDM) ................................................................................ 28
3.3 Advanced solar evaporation plant description .............................................................. 30
4 Solar Evaporation pilot plant ................................................................................................ 36
4.1 Heat transfer theoretical background ........................................................................... 36
4.1.1 Conduction ............................................................................................................... 36
4.1.2 Natural and forced convection ................................................................................. 36
4.1.3 Radiation .................................................................................................................. 37
4.1.4 Combined heat transfer exercice ............................................................................. 37
4.2 Advanced Solar Evaporator simulation model ............................................................. 40
4.2.1 Theoretical background............................................................................................ 40

SOLAR EVAPORATION SYSTEM: MODELING AND CONTROLLING BRINE TREATMENT PONDS.
7
5 Experimental part ................................................................................................................. 44
5.1 Data acquisition ........................................................................................................... 44
5.1.1 Comparing the models ............................................................................................. 46
5.2 Model fitting.................................................................................................................. 47
6 Proposals for further development ....................................................................................... 49
7 Conclusions ......................................................................................................................... 50
8 References........................................................................................................................... 51
ANNEX I – Ponds control unit ...................................................................................................... 54
ANNEX II – Matlab code of the exemple ...................................................................................... 55
ANNEX III – ZELDA ..................................................................................................................... 57

SOLAR EVAPORATION SYSTEM: MODELING AND CONTROLLING BRINE TREATMENT PONDS.
8
List of figures
Figure 1: Distribution of Earth’s Water. ....................................................................................... 12
Figure 2: Reverse osmosis. ........................................................................................................ 17
Figure 3: Scheme of a reverse osmosis installation. ................................................................... 17
Figure 4: Multistage flash distillation. ......................................................................................... 18
Figure 5: Multi-effect distillation system example. ....................................................................... 20
Figure 6: Example of Vapor Compression Technique. ................................................................ 20
Figure 7: Electrodialysis process. ............................................................................................... 22
Figure 8: Map of the Arab States of the Gulf. .............................................................................. 24
Figure 9: Contribution of each State to the total desalination capacity in 2008 in the GCC. ....... 25
Figure 10: Contribution of each process to the total desalination capacity in 2008 in the GCC. . 25
Figure 11: Electrodialysis metathesis process used in Zelda project. ......................................... 28
Figure 12: Interior of the membranes in the EDM. ...................................................................... 29
Figure 13: Evaporation ponds (uncovered and covered). ........................................................... 31
Figure 14: Picture of the covered pond. ...................................................................................... 32
Figure 15: Picture of the fan for the covered pond. ..................................................................... 33
Figure 16: Picture of the side of the covered pond. ..................................................................... 33
Figure 17: Picture of the covered pond while being constructed showing the side openings. ..... 34
Figure 18: Picture of the sensors installed in the uncovered pond. ............................................. 34
Figure 19: Picture of the open pond filled with water. ................................................................. 35
Figure 20: Picture of the two ponds working. .............................................................................. 35
Figure 21: Sketch of the problem being studied. ......................................................................... 38
Figure 22: All the temperatures for a year of simulation. ............................................................. 39
Figure 23: Energy Balance of a brine layer. ................................................................................ 41
Figure 24: Depth of the uncovered pond with real data (Model 2). ............................................. 44
Figure 25: Mass of evaporated water for the uncovered pond (Model 2). ................................... 45

SOLAR EVAPORATION SYSTEM: MODELING AND CONTROLLING BRINE TREATMENT PONDS.
9
Figure 26: Depth of the covered pond (Model 2). ........................................................................ 45
Figure 27: Natural Level with the simulations model (Model 1). .................................................. 46
Figure 28: Picture of the monitor used to control the ponds. ....................................................... 54
Figure 29: Almería desalination plant. ......................................................................................... 60
List of tables
Table 1: Conditions of freshwater scarcity according to Falkenmark. .......................................... 14
Table 2: Requirements of water consumption according to Gleic. ............................................... 14
Table 3: Advantages of the RO treatment for desalination. ......................................................... 17
Table 4: Disadvantages of Reverse Osmosis treatment for desalination. ................................... 18
Table 5: Advantages and Disadvantages of the MSF process. ................................................... 19
Table 6: Advantages and disadvantages regarding the VC process. .......................................... 21
Table 7: Costs for the main desalination processes. ................................................................... 22
Table 8: Global costs for the main desalination processes in euro/m3 of potable water produced.
..................................................................................................................................................... 23
Table 9: Comparing sizes of plants with costs for several processes. ......................................... 23
Table 10: Distillation and desalination processes and their capacity in the GCC countries. ........ 26
Table 11: Main characteristics of the EDM pilot plan. .................................................................. 30
Table 12: Specifications for the pilot plant. .................................................................................. 32
Table 13: Parameters and values of the variables and of the results. ......................................... 39
Table 14: Variables used in Equation 20 and their meaning. ...................................................... 48
Table 15: Values for the β coefficients in the Equation 20. .......................................................... 48
Table 16: List of Deliverables to be produced during the first half of the Project. ........................ 62
Table 17: List of Milestones to be produced during the first half of the project ............................ 62

SOLAR EVAPORATION SYSTEM: MODELING AND CONTROLLING BRINE TREATMENT PONDS.
10
Notation
ε – Emissivity (between 0 and 1)
σ – Stefan-Boltzmann constant, W/m2.K4
Be – Baumé scale, ºBe
Cevap – Evaporation coefficient depending on the brine saline concentration and referred to
distilled after evaporation.
Cl – Vaporization latent heat.
Cp,brine – Heat capacity of the brine, J/K
d – Depth (m)
Fs – Fraction of the solar energy absorbed by the brine layer.
Hh – Global irradiation in the horizontal plane.
h – heat transfer coefficient, W/m2.ºC
k – Thermal conductivity, W/m.ºC
K – Soil conductivity, W/m.ºC
l – Total thickness, m
Ps,Tbrine – Saturation pressure at brine temperature, Pa
Ps,Tair - Saturation pressure at air temperature, Pa
qb – Conduction heat transfer, W/m2
qc – Convection heat transfer, W/m2
qe – Evaporation heat transfer, W/m2
qr – Radiation heat transfer, W/m2
v – Air flow velocity, m/s
𝝆𝒃𝒓𝒊𝒏𝒆 – Density of the brine, kg/m3

SOLAR EVAPORATION SYSTEM: MODELING AND CONTROLLING BRINE TREATMENT PONDS.
11
Glossary
CGP - Carrier Gas Process
CTM – Centre Tecnologic de Manresa
ED – Electrodialysis
GHG – Green House Gases
GOR - Gain Output Ratio
HDH - Solar Humidification Dehumidification
MD - Membrane Ditillation
MSF - Multistage Flash Distillation
MED - Multi Effect Distillation
RO - Reverse Osmosis
VC – Vapor Compression
WFD – Water Framework Directive
WHO – World Health Organization
ZLD – Zero Liquid Discharge

SOLAR EVAPORATION SYSTEM: MODELING AND CONTROLLING BRINE TREATMENT PONDS.
12
1 Introduction
This is the year 2016, 21st century, and despite all the evolutions and developments, since many
years ago we are still facing problems related to the base of all types of life in our planet Earth:
water scarcity.
Water scarcity occurs when the existing resources are less than the needed to fulfill the demand.
Attention should be paid to not confuse water scarcity with drought. Drought is when the
availability of the resource (in this case water) decreases when, for example, it doesn’t rain for a
long period of time [1].
The surface of the earth is mostly constituted by water, about 97% is the ocean and the other 3%
is fresh water in which about 1% is available for human use [2].
Water is always recycling, it’s called the Water Cycle which is a process of water transfer through
its many states and is responsible for the natural recharge of aquifers, lakes and rivers that are
the main sources of water supply for human use. But still, it is a finite resource [2].
It is important to mention that the fresh water distribution isn’t uniform and that’s why the access
is limited in some regions and abundant in others. Its availability varies from year to year and
region to region [2].
In Figure 1 it’s possible to see more specifically the earth’s water distribution.
Figure 1: Distribution of Earth’s Water [2].

SOLAR EVAPORATION SYSTEM: MODELING AND CONTROLLING BRINE TREATMENT PONDS.
13
Why are we facing water scarcity all over the world?
It is estimated that about 783 million people don’t have access to freshwater, 2.5 billion don’t
have access to basic sanitation, more than 300 million from Africa suffer from water scarcity, 1.2
billion people live in scarcity areas and only 67% of the population have access to basic
sanitation [2] [3].
In 2025 is expected that two thirds of the world population will be facing water shortages.
There are four main causes for water scarcity: climate changes, pollution, agriculture and
population growth [4].
Climate changes are related to the emission of carbon dioxide (CO2) and other greenhouse
gases (GHG) to the atmosphere. These gases affect the weather and water conditions and as a
result we have floods or droughts. One of the things that happens is the increase of the
temperature that causes glaciers to disappear and affect the freshwater supplies [4].
With all of these changes there’s less water available for agriculture, energy generation, cities
and ecosystems [4].
Regarding the pollution, it comes in many ways, for example, from agriculture (pesticides and
fertilizers that are washed away), untreated wastewater and also from industrial waste [4].
Agriculture uses 70% of the water available but about 60% of this 70% is waste because of many
leaks or human mistakes [4] [5] [6].
India, China, Australia, Spain and USA are some countries that produce lots of food and are
reaching their water resource limit [4].
The population growth affects the water scarcity because with this growth comes economic
development and industrialization which causes water ecosystems transformations and loss of
biodiversity [4].
Over the years the population has been facing the process of urbanization that means that there
is an increase of the population and there are technological and industrial developments. With
this increase and developments the amount of water needed and the production of waste
increases and we started to use more than we have. It’s possible to say that the people are not
taking care of our limited resources and they are making a fast consumption of natural resources.
Despite of this consumption people also “ruin” water resources with other actions like: introducing
toxic materials in the fresh water and residues from water treatment techniques. They also affect
the water quality by untreated sewage, not controlling industrial effluents, destroying basins and
not controlling the agriculture consumption [3].
Brown and Matlock quoted Falkenmark saying that the freshwater scarcity is function of available
water resources and human population as illustrated in Table 1 [7].

SOLAR EVAPORATION SYSTEM: MODELING AND CONTROLLING BRINE TREATMENT PONDS.
14
Table 1: Conditions of freshwater scarcity according to Falkenmark [7].
Water avaiability (m3 per capita/ year) Condition
> 1700 No stress
1000 – 1700 Stress
500 – 1000 Scarcity
< 500 Absolute Scarcity
Brown and Matlock also quoted Gleick that wrote about minimum requirements regarding the
consumption of freshwater as can be evaluated in Table 2 [7].
Table 2: Requirements of water consumption according to Gleick [7].
Requirement L / person/ day
Minimum drinking water 5
Basic for sanitation 20
Basic for bathing 15
Basic for food preparation 10
There is a way to evaluate the freshwater consumption by a tool called the Water Footprint. This
tool can indicate the volume of freshwater that is consumed by a country, organization, person,
product or activity [8].
The Water Footprint of a product can be defined as the total volume of freshwater that is used
from the “cradle to the grave” (i.e., since the extraction of raw materials until the product
production) and there are three different footprints: green (consumption of stored rain water in the
soil as humidity, and in the surface of the vegetation), blue (surface or underground water
consumption) and grey (indicator of polluted water as a result of human activities) [8].
There are many techniques for water treatment to produce potable water but depending on which
one they come with a high cost and are very complex. Other techniques use freshwater with the
minimum conditions to be treated and then to be used.
For all those reasons presented for water scarcity and because of the fact that 97% of the planet
Earth is the ocean, desalination techniques started to be used.
In the last decades desalination processes are being studied to produce potable water for the
many uses that is needed. These processes basically turn salty water to freshwater.

SOLAR EVAPORATION SYSTEM: MODELING AND CONTROLLING BRINE TREATMENT PONDS.
15
1.1 Zelda project
As written before, through the last decades there was na improvement in the desalination
techniques that can turn seawater into potable water in regions facing water scarcity. Despite the
fact that these tchnologies have a socio-economic positive impact they also can cause problems
to the environment.
Many of these technologies use membranes to separate the water from the dissolved salts in the
seawater, so the result is a highly saline solution (brine). What happens to the brine? Is returned
to the ocean and causes a negative impact to the marine ecosystem: destroying marine
ecosystems, diminishing the amount of flora and create salinity, promoting also temperature and
alkalinity gradients.
This thesis is about what happens to the brine obtained after the seawater desalination treatment.
Zelda stands for Zero Liquid Discharge Desalination and there’s a brine treatment based on a
combination of electro-separation processes and valuable compound recovery [9].
Basically the seawater suffers two different desalination treatments (reverse osmosis and
electrodialysis metathesis) and then the brine goes to solar evaporation ponds to further
treatment with the objective to return the salts, to avoid their release back to the oceans and
negative impact on the environment.
There are two ponds, one covered (that can be called ‘’forced’’ because it suffers from forced
convection) and one uncovered (natural), and the objective is to obtained a perfect model
explaining the evaporation in each pond (Model 3).
Increasing the water recovery of the existing desalination plants, decreasing the brine discharge
to water bodies and increasing the public awareness on the environmental impact of current brine
discharge strategies, are some of the objectives of the Zelda project [9].
Some of the brine discharge strategies are: direct dischare, deep well injection, discharge to a
wastewater facility and zero liquid discharge [33].
The main objective of the whole project is to compare environmental and economical impacts of
the new process, with conventional brine management strategies by means of a life cycle
analysis [9].
In Annex III there’s a full description of the project.

SOLAR EVAPORATION SYSTEM: MODELING AND CONTROLLING BRINE TREATMENT PONDS.
16
2 Desalination Processes
Desalination in basically a process involving the conversion of salty water into potable water for
human consum and human activities, like agriculture, energy production or colling systems [10].
Desalination can be made by several processes. Among them there is the thermal desalination
by distillation that includes Multistage Flash Distillation (MSF), Multi Effect Distillation (MED) and
Vapor Compression (VC) [10] [11].
The thermal desalination principals are: vapor formation by heat, separation of vapor from the
seawater and condensation of the vapor [10] [11].
Desalination can also be carried out by membrane processes like: Reverse Osmosis (RO) and
Electrodialysis (ED). These two types are the main technologies used but there are also other
processes like: Membrane Distillation (MD), Solar Humidification Dehumidification (HDH) and
Carrier Gas Process (CGP) [10] [11].
In the next chapters the thermal desalination processes will be explained along with the RO and
ED among the membrane processes.
2.1 Reverse Osmosis (RO)
Reverse osmosis in a simple way is the separation of a solvent from a solute through a
semipermeable membrane which is permeable to the solvent and impermeable to the solut. This
process has both commercial and industrial applications: water treatment (namely in the
production of pulp and paper), product recovery from wastewaters and ultrapure water production
for hemodialysis [11] [12] [13].
A high power pump makes a big pressure on the mixture reversing the way of the natural flow.
The membrane retains salts and harmful components to the human health. The pressure on the
concentrate side is bigger than the osmotic pressure and there is a flow of clean water until the
balance is achieved [11] [12] [13].
In figure 2 and 3 are illustrated the reverse osmosis concept and is provided the scheme of a
process including a RO unit, respectively.

SOLAR EVAPORATION SYSTEM: MODELING AND CONTROLLING BRINE TREATMENT PONDS.
17
Figure 2: Reverse osmosis [14].
Figure 3: Scheme of a reverse osmosis installation [13].
In Table 3 and Table 4 are explained some of the benefits and disadvantages of the reverse
osmosis process, respectively.
Table 3: Advantages of the RO treatment for desalination [12] [13].
Advantages
Low investment cost and energy consumption
The quality of the produced water is constant
The rejection rate of the rejected part can achieve 20-70%
Low maintenance
Can make use of an almost unlimited and reliable water source, the sea
Can be used to remove organic and inorganic contaminants
Has a negligible environmental impact
Minimal use of chemicals
Brine disposal
Feedwater
Feedwater
Treatment
Membrane modules
Pump Pos-treatment
Energy recovery
Desalinated
water

SOLAR EVAPORATION SYSTEM: MODELING AND CONTROLLING BRINE TREATMENT PONDS.
18
Table 4: Disadvantages of Reverse Osmosis treatment for desalination [12] [13].
Disadvantages
Membranes are sensitive
The feed water usually needs to be pretreated to remove particulates (in order to prolong membrane life)
Requires a high quality standard for materials and equipment
Require a reliable energy source
Brine must be carefully disposed off to avoid negative environmental imapacts
2.2 Multistage Flash Distillation (MSF)
MSF is a process with several stages and has three main sections: heat input, heat recovery and
heat rejection. In Figure 4 is illustrated an example of this process.
Figure 4: Multistage flash distillation [15].
Basically the seawater is firstly heated to its maximum temperature, in the brine heater, through
an external heat vapor. The vapor pressure is controlled so that the brine can enter the stages
with the proper pressure and temperature to occur the evaporation [13] [16].
The feed enters the first stage and the flashing occurs because of the vapor production from the
steam release, until the temperature of the water is in thermodynamic equilibrium with the vapor
pressure [16] [17].
The water continues to pass the stages and in each stage the brine temperature decreases
proportionally to the steam produced and the concentration of salt increases [16] [17].

SOLAR EVAPORATION SYSTEM: MODELING AND CONTROLLING BRINE TREATMENT PONDS.
19
In Table 5 are listed a few advantages and disadvantages about this desalination process.
Table 5: Advantages and Disadvantages of the MSF process [18].
Advantages Disadvantages
Low operating cost when waste heat is used High operating costs when waste heat is not
available
Quality of the feed water is not as important as
for a reverse osmosis system Requires both thermal and mechanical energy
High GOR - Gain Output Ratio Operates at high temperatures that increase
corrosion and scale formation
Adding stages improves efficiency and
increases water production Adding stages increases costs and operational
complexity
2.3 Multi Effect Distillation (MED)
In a MED process there are many stages and several consecutive horizontal cells in which the
first one is hot and the last one is cold [13] [18].
The steam is condensed in one side of the pipes and the sea water is evaporated on the other
side; the energy used in this evaporation comes from the heat generated by the steam
condensation [13] [18].
Each stage uses the energy produced in the one before and part of the brine evaporates while
the other part follows to the next stage where gets heated and evaporates again. In the last stage
the brine is pumped out since the pressure is lower than the atmosphere pressure [13] [18].
This process operates with low temperature and pressure, which prevents corrosion, and is very
economical because it can be use aluminum or other kind of materials that are cheap. Moreover,
the sea water doesn’t need pre-treatment, so it’s easy to operate and has a low maintenance cost
[13] [18].
Other benefits about MED process are the following:
Low energy consumption compared to other thermal processes;
Can work all day, everyday with minimum supervision;
Can be adapted to any heat source, including hot water, waste heat from power
generation, industrial processes, or solar heating;
An example of MED is shown in Figure 5.

SOLAR EVAPORATION SYSTEM: MODELING AND CONTROLLING BRINE TREATMENT PONDS.
20
Figure 5: Multi-effect distillation system example [19].
2.4 Vapor Compression (VC)
In this process (VC) the water evaporation is caused by vacuum inside the evaporation chamber,
which is caused by a mechanical compressor that can work by electric motor or a steam injector.
The evaporation produces a vapor that will be compressed and becomes the heat source to
evaporate the feed water.
The tubes contain salty water and the pressurized vapor enters them condensating on the outside
part of the tubes and also heating the salt inside the tubes [13] [18].
This last part of the process also produces water vapor which will be compressed again so the
cycle will continue to produce condensed water as a product [13] [18].
In figure 6 is represented an example of this kind of process.
Figure 6: Example of Vapor Compression Technique [20].

SOLAR EVAPORATION SYSTEM: MODELING AND CONTROLLING BRINE TREATMENT PONDS.
21
In Table 6 are described a few advantages and disadvantages of the vapor compression process.
Table 6: Advantages and disadvantages regarding the VC process [21].
Advantages Disadvantages
Operating costs lower than MSF and MED Maintenance on compressors and heat exchangers
Equipment is smaller than the MSF and MED High energy consumption
High costs
2.5 Electrodialysis (ED)
Electrodialysis is a process that separates ions by using membranes permeable only to positive
ions and other membranes only permeable to negative ones that are intercalated [22].
The ions start to migrate through the membranes when is added an electrical current to the water
that is going to be desalinated [22].
There are many advantages related with this technique like the fact that it doesn’t need high
investments costs or special operational people.
Some other benefits about his process are listed next [22]:
Can operate with minimal fouling or scaling, or chemical addition;
Low pressure requirements;
Installations are “quieter” than RO installations;
Membranes have a long life;
In feed water pretreatment are used few chemicals.
The low efficiency to highly concentrated salty water and the need of a pre-treatment of the water
are some of the disadvantages of this technique [22].
In Figure 7 there is an example of the ED process.

SOLAR EVAPORATION SYSTEM: MODELING AND CONTROLLING BRINE TREATMENT PONDS.
22
Figure 7: Electrodialysis process [23].
2.6 Comparing the processes
After presenting the most important desalination processses used all over the world, in this
section is presented a comparision among them about several aspects.
In Table 7 is represented a comparison among the various processes according to heat and
electrical energy costs.
Table 7: Costs for the main desalination processes [13].
Process Heat energy (kWh/m3) Electrical Energy (kWh/m3)
MED 63.8 1.6
MSF 81.2 3
VC 0 8.7
RO 0 3.5
After analysing Table 7 the conclusion is that the process that uses the most heat energy is MSF
and in second is the MED process. Regarding the electrical energy, the processes that use more
are the VC firstly and then the RO process.
In Table 8 we are able to see the costs related to the energy, labor, chemical products and
maintenance.

SOLAR EVAPORATION SYSTEM: MODELING AND CONTROLLING BRINE TREATMENT PONDS.
23
Table 8: Global costs for the main desalination processes in euro/m3 of potable water produced [13].
MSF MED VC RO
Energy Fuel 0.40 0.30 - -
Electricity 0.20 0.11 0.60 0.25
Labor 0.04 0.04 0.07 0.07
Chemical products 0.05 0.04 0.04 0.05
Replacement of membranes 0.00 0.00 0.00 0.02
Maintenance 0.03 0.03 0.02 0.03
Total 0.72 0.52 0.73 0.42
Regarding the total costs of each process the more expensive ones are the MSF and the VC.
This cost is big because of the energy necessary to make the process work.
The process less costly is the reverse osmosis with 0.42 €/m3.
In Table 9 is represented a comparasion of the size of the plants with the costs for each process.
Table 9: Comparing sizes of plants with costs for several processes [24].
Processes Size of plant (m3/day) Cost (€/per m3)
MED
< 100 2.00 – 8.00
12 000 – 55 000 0.76 – 1.56
> 91 000 0.42 – 0.81
MSF 23 000 – 528 000 0.42 – 1.40
VC 1 000 – 1 200 1.61 – 2.13
After analysing Table 9 we can see that bigger the size of the plant for the MED process the
lowest is the cost.

SOLAR EVAPORATION SYSTEM: MODELING AND CONTROLLING BRINE TREATMENT PONDS.
24
2.7 Plants in the world, main companies
2.7.1 Arab States of the Gulf (GCC)
The Arab States of the Gulf (GCC) include: United Arab Emirates (UAE), Kingdom of Bahrain,
Kingdom of Saudi Arabia (KSA), Sultanate of Oman, State of Qatar and State of Kuwait.
Figure 8: Map of the Arab States of the Gulf [25].
The GCC are located in the south west of the Asian continent. This part of Asia is considered an
arid/semi-arid region that suffers from water scarcity and its primary source for freshwater is the
groundwater [26].
These countries have been living several developments in the economical, industrial and
agricultural areas. With these developments came the population growth and the increasing of
demand related to freshwater.
Where the groundwater is not the primary source for freshwater, people depend on desalination
processes as the main source of drinking water, so the GCC are concerned with looking for more
effective, demanding less energy and less expensive processes.
The first use of reverse osmosis process in the GCC countries was in the KSA in 1968. Later on
in 1987, 13 RO plants were built in Kuwait with the capacity of 1196 m3/day and then, in 1993,
were built 20 more plants [26].
UAE was the first to introduce the MED process with a plant with 91 m3/day of capacity. Then, in
1981 they built two more units with the capacity of 825 m3/day and then 9 plants with the total
capacity of 227 273 m3/day [26].
In 2008 the total desalination capacity was about 14.84 million m3/day.

SOLAR EVAPORATION SYSTEM: MODELING AND CONTROLLING BRINE TREATMENT PONDS.
25
In Figures 9 and 10 is represented the contribution of each state and each process, respectively,
for that total capacity.
Figure 9: Contribution of each State to the total desalination capacity in 2008 in the GCC [26].
Analyzing Figure 9 is possible to observe that the Kingdom of Saudi Arabia has a more direct
bearing in the total desalination capacity and the Sultanate of Oman has a less one.
Figure 10: Contribution of each process to the total desalination capacity in 2008 in the GCC [26].
39%
33%
13%
7% 5% 3%
Contribution of each State to the total desalination capacity in 2008
KSA
UAE
State of Kuwait
State of Qatar
Kingdom of Bahrain
Sultanate of Oman
21.2%
0.004%
8 %
70.2%
Contribution of each process to the total desalination capacity in 2008
ED
VC
MED
MSF

SOLAR EVAPORATION SYSTEM: MODELING AND CONTROLLING BRINE TREATMENT PONDS.
26
From Figure 10 it’s possible to see that the process with more influence is the MSF process and
the less used is the VC.
In Table 10 are shown the installed units and the indication of which distillation or destilation
process is used in the GCC countries along with their capacities [26].
Table 10: Distillation and desalination processes and their capacity in the GCC countries [26].
Local Date Process type Total capacity (m3/day)
State of Kwait 1960 MSF / Recycle (2 units) 9091
State of Qatar 1962 MSF / Long tubes 6818
Kingdom of South Arabia 1967 MSF / Once trough 198
198
State of Qatar 1968 MSF (2 units) 9000
Kingdom of Bahrain 1975 MSF / Recycle 22728
Sultunate of Oman 1976 MSF / Recycle 22728
15
United Arab Emirates 1977
MED 91
MSF / Recycle 68183
RO 4545.5
Sultunate of Oman 1979 VC 100
Sultunate of Oman and
State of Qatar 1982 RO 100
Sultunate of Oman 1983 ED 100
Kingdom of Bahrain 1984 RO 4545.5
1985 VC 144
State of Qatar 1996 MED 9091
Kingdom of Bahrain 2004 MED 31818

SOLAR EVAPORATION SYSTEM: MODELING AND CONTROLLING BRINE TREATMENT PONDS.
27
3 The Zelda project description
The project entitled Zelda, despite of aiming to solve the world’s water scarcity, also cares about
the brine produced and its final destination as mentioned in chapter 1.
Many companies are involved in Zelda project: CTM, Fujifilm, Albengoa and the European Water
Supply and Sanitation Technology Platform.
The final objective of the Zelda project is a zero liquid discharge (ZLD), which means that the
concentrate is treated to produce water and there is no discharge of liquid waste from the
process.
In fact, the destination of the brine produced during water desalination is a problem because
normally the final destination of the brine is the sea where it is diluted again in its natural medium.
However the brine isn’t only salty waste. When the feed water enters the treatment processes,
chemicals can be added, so that in the end they are sent to the ocean along with the brine.
When sent to the ocean they can cause several damages such us destroying marine
ecosystems, diminishing the amount of flora and create salinity, promoting also temperature and
alkalinity gradients [28].
The Zelda project has duration of 4 years and this thesis is about the task related with the
demonstration of the technology in a real desalination plant located in Almeria for seawater
desalination.
In Zelda Project it’s used the electrodialysis metathesis (EDM) for the brine desalination, after
RO, and valuable compound recovery processes are implemented to prove the technical viability
and economical sustainability in decreasing the global impacts caused by the desalination
systems used to produce potable water.
The main objectives are concerned mainly with versatile brine treatment, performance and
operational costs assessement, analysis ofthe influence of the brine composition and operating
conditions of the EDM-ZLD system on the overall sustainability of the desalination process.
Decrease the discharge into the ocean, increase water recovering, reduce the environmental
impact and grow the public concerns on the environmental impact of current brine discharge
strategies are also objectives from the Zelda project.

SOLAR EVAPORATION SYSTEM: MODELING AND CONTROLLING BRINE TREATMENT PONDS.
28
3.1 Pilot plant: Almeria
The pilot plant is where the solar evaporation treatment is applied after the RO and the EDM
treatments and consists in two ponds, one covered (forced air convection) and the other one
uncovered (natural), to compare both natural and advanced evaporation as shown below in
Figure 13.
It’s located in Almeria, south of Spain, and the objective is to evaporate the water from the brine
plus drying to obtain salt.
3.2 Electrodialysis metathesis (EDM)
In the Zelda project is used an EDM process, after the RO, that we can call an improvement of
the ED process. Comparing with the ED process the main difference (but isn’t the only one) is the
number of compartments of membranes that are used.
This process is used to remove ions from water and the objective is to maximize the water
production and the salt recovery.
EDM is implemented with four cells and four membranes that yield: one dilute and two
concentrate compartments, a Sodium Chloride (NaCl) compartment, one anion and one cation
exchange membrane, one monovalent selective anion and another one for cation membranes.
The desalination concentrate from the reverse osmosis process is fed to the process and after
applying a certain voltage the cations start to move to the right and the anions to the left as
shown in Figure 11 [27].
Figure 11: Electrodialysis metathesis process used in Zelda project [28].

SOLAR EVAPORATION SYSTEM: MODELING AND CONTROLLING BRINE TREATMENT PONDS.
29
When combined with the NaCl, the cation forms a chloride salt concentrate stream and the
anions form a sodium salt concentrate stream. Then, these salt streams contain not so soluble
compounds like: Calcium Chloride (CaCl2) and Sodium Sulfate (Na2SO4). The sparingly soluble
salts such as Calcium Sulfate (CaSO4), Magnesium Sulfate (MgSO4) or Calcium Carbonate
(CaCO3), are not produced in neither of the concentrate streams [27].
This unique configuration is designed to separate EDM concentrate into two streams of highly
soluble salts: one containing sodium with anions and the other containing chloride with cations.
This characteristic of EDM provides a significant advantage in treating RO concentrates because
the membrane-fouling potentials of typical scalants such as CaSO4 and CaCO3 do not increase
with recovery, as is the case with RO, nanofiltration, and other forms of electrodialysis, such as
electrodialysis reversal (EDR) [27].
There are also other applications for this process: food processing, glycerin purification, capacitor
electrolyte fluids, oil and gas dehydration, conditioning and processing solutions [27].
The advantages of this process are the fact that it is an improvement of the ED process and when
compared with the RO the water recovery is higher. Previous work has shown that it is possible to
recover up to 98% of the water from RO concentrate with EDM and the streams are highly
concentrated facilitating the recovery of salts [27].
But it also has disadvantages like the fact that is a bit expensive and is needed someone with
skills to work with it [27].
In Figure 12 is provided a scheme illustrating how the membrane process works.
Figure 12: Interior of the membranes in the EDM [28].
SOLAR EVAPORATION SYSTEM: MODELING AND CONTROLLING BRINE TREATMENT PONDS.
30
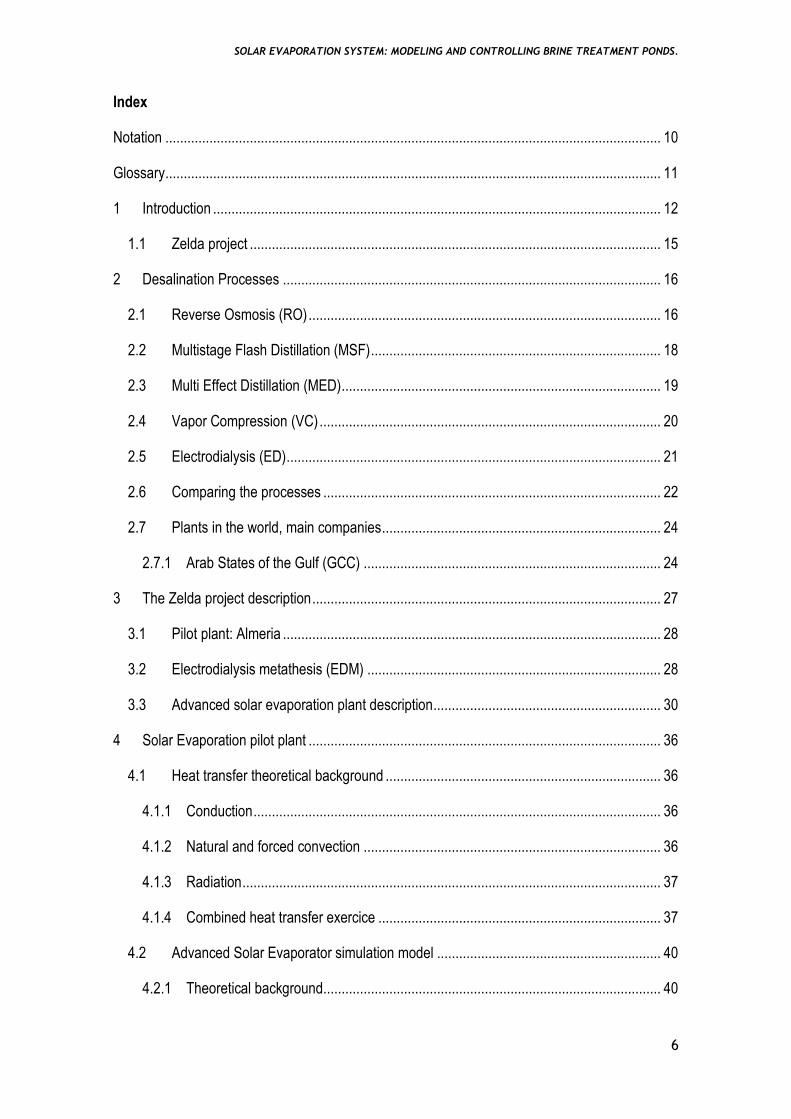
The characteristics of the EDM plant are summarized in Table 11.
Table 11: Main characteristics of the EDM pilot plant [28].
Capacity of RO brine feed 0.5 - 1.5 m3/h
Minimum brine production capacity 25 - 100 L/h
Maximum voltage total stack 300 V
Maximum current 50 A
Max. allowed temperature range of stack 10 - 40 °C
Expected temperature range inside the container -5 - 50 °C
Expected temperature range outsider the container 0 - 45 °C
Internal leakage stack < 0.5 mL/min.cell
Feed RO TDS range 3 - 60 g/L
Feed NaCl TDS range 5 - 100 g/L
Output diluate streams (D1 and D2) 0.02 - 6 g/L
Output concentrate streams (C1 and C2) 30 - 120 g/L
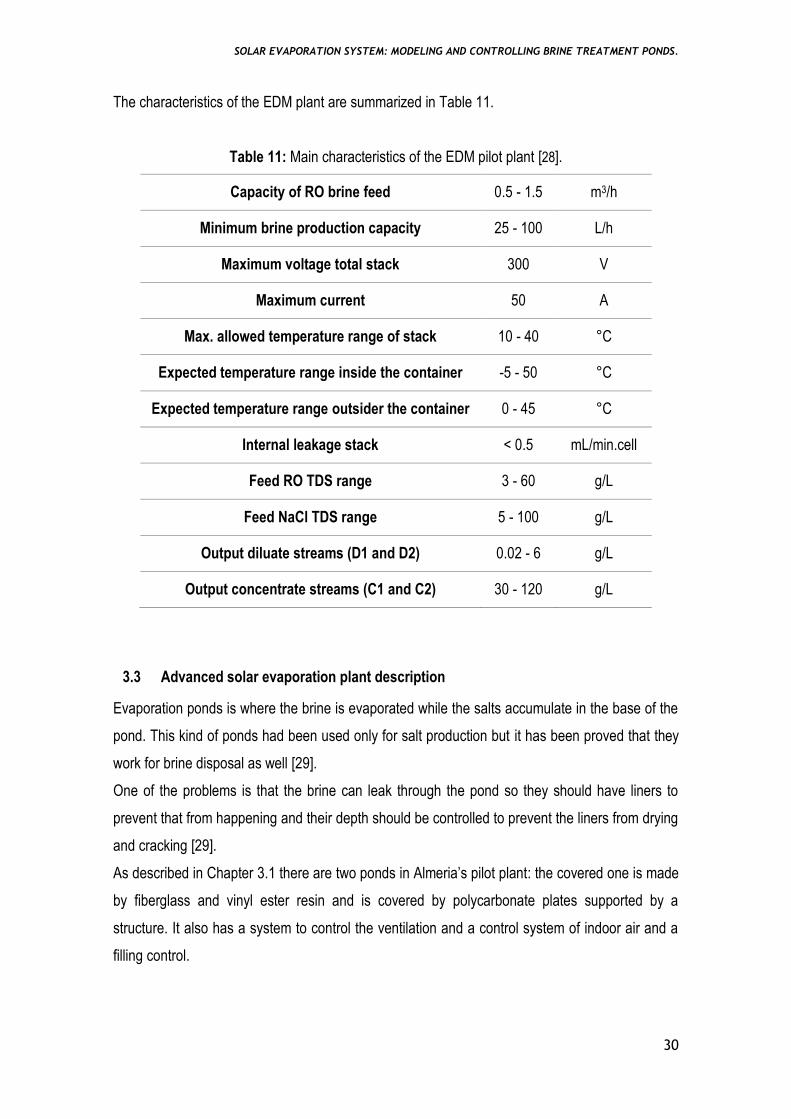
3.3 Advanced solar evaporation plant description
Evaporation ponds is where the brine is evaporated while the salts accumulate in the base of the
pond. This kind of ponds had been used only for salt production but it has been proved that they
work for brine disposal as well [29].
One of the problems is that the brine can leak through the pond so they should have liners to
prevent that from happening and their depth should be controlled to prevent the liners from drying
and cracking [29].
As described in Chapter 3.1 there are two ponds in Almeria’s pilot plant: the covered one is made
by fiberglass and vinyl ester resin and is covered by polycarbonate plates supported by a
structure. It also has a system to control the ventilation and a control system of indoor air and a
filling control.
SOLAR EVAPORATION SYSTEM: MODELING AND CONTROLLING BRINE TREATMENT PONDS.
31
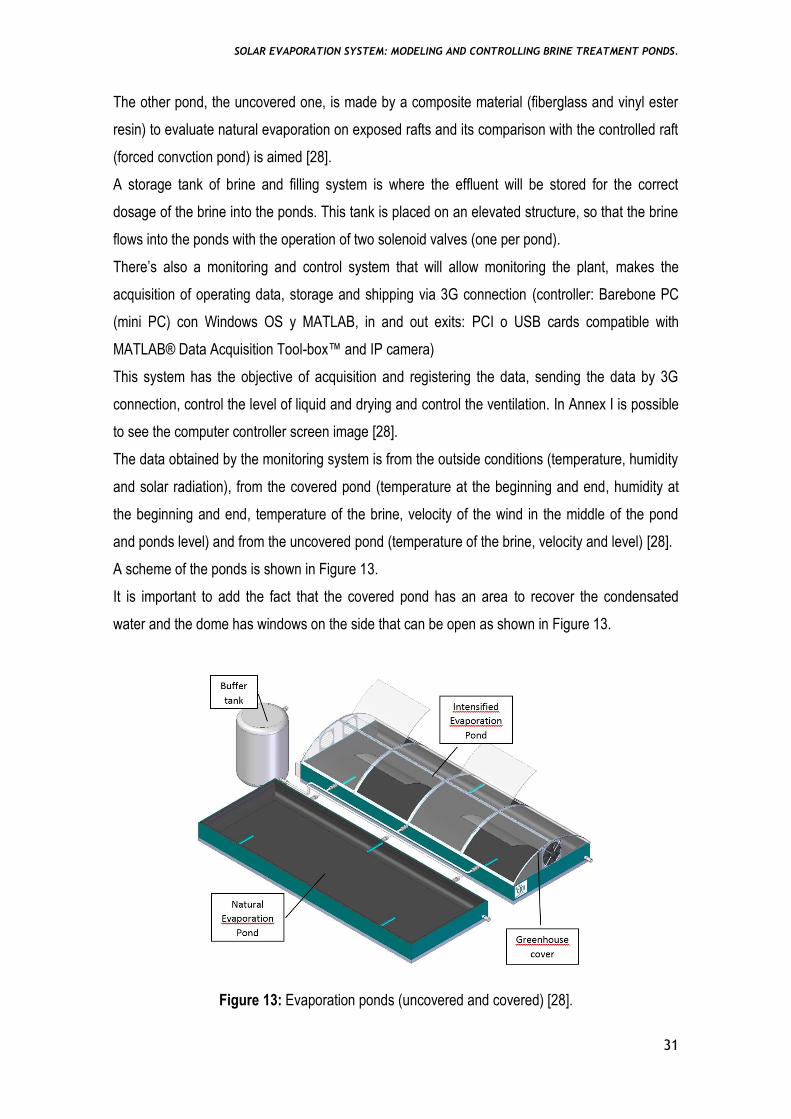
The other pond, the uncovered one, is made by a composite material (fiberglass and vinyl ester
resin) to evaluate natural evaporation on exposed rafts and its comparison with the controlled raft
(forced convction pond) is aimed [28].
A storage tank of brine and filling system is where the effluent will be stored for the correct
dosage of the brine into the ponds. This tank is placed on an elevated structure, so that the brine
flows into the ponds with the operation of two solenoid valves (one per pond).
There’s also a monitoring and control system that will allow monitoring the plant, makes the
acquisition of operating data, storage and shipping via 3G connection (controller: Barebone PC
(mini PC) con Windows OS y MATLAB, in and out exits: PCI o USB cards compatible with
MATLAB® Data Acquisition Tool-box™ and IP camera)
This system has the objective of acquisition and registering the data, sending the data by 3G
connection, control the level of liquid and drying and control the ventilation. In Annex I is possible
to see the computer controller screen image [28].
The data obtained by the monitoring system is from the outside conditions (temperature, humidity
and solar radiation), from the covered pond (temperature at the beginning and end, humidity at
the beginning and end, temperature of the brine, velocity of the wind in the middle of the pond
and ponds level) and from the uncovered pond (temperature of the brine, velocity and level) [28].
A scheme of the ponds is shown in Figure 13.
It is important to add the fact that the covered pond has an area to recover the condensated
water and the dome has windows on the side that can be open as shown in Figure 13.
Figure 13: Evaporation ponds (uncovered and covered) [28].

SOLAR EVAPORATION SYSTEM: MODELING AND CONTROLLING BRINE TREATMENT PONDS.
32
In ANNEX I there is a photograph of the remote access to the ponds screen from where everyday
data was collected and temperatures, levels, water flow, air renewal and humidity were recorded.
In Table 12 are demonstrated the specifications of the pilot plant in Almeria regarding the
estimated performance for the natural and forced systems, the ponds surface area, the
evaporation surface and the total plant capacity.
Table 12: Specifications for the pilot plant [28].
Advanced evaporation estimated performance 2 m3/m2.year
Natural evaporation estimated performance 1.2 m3/m2.year
Pond surface 8.3 m × 3 m = 25 m2
Total evaporation surface 50 m2
Total plant capacity 80 m3.year
Figures 14 to 20 are real pictures of the ponds.
Figure 14: Picture of the covered pond.

SOLAR EVAPORATION SYSTEM: MODELING AND CONTROLLING BRINE TREATMENT PONDS.
33
Figure 15: Picture of the fan for the covered pond.
Figure 16: Picture of the side of the covered pond.
SOLAR EVAPORATION SYSTEM: MODELING AND CONTROLLING BRINE TREATMENT PONDS.
34
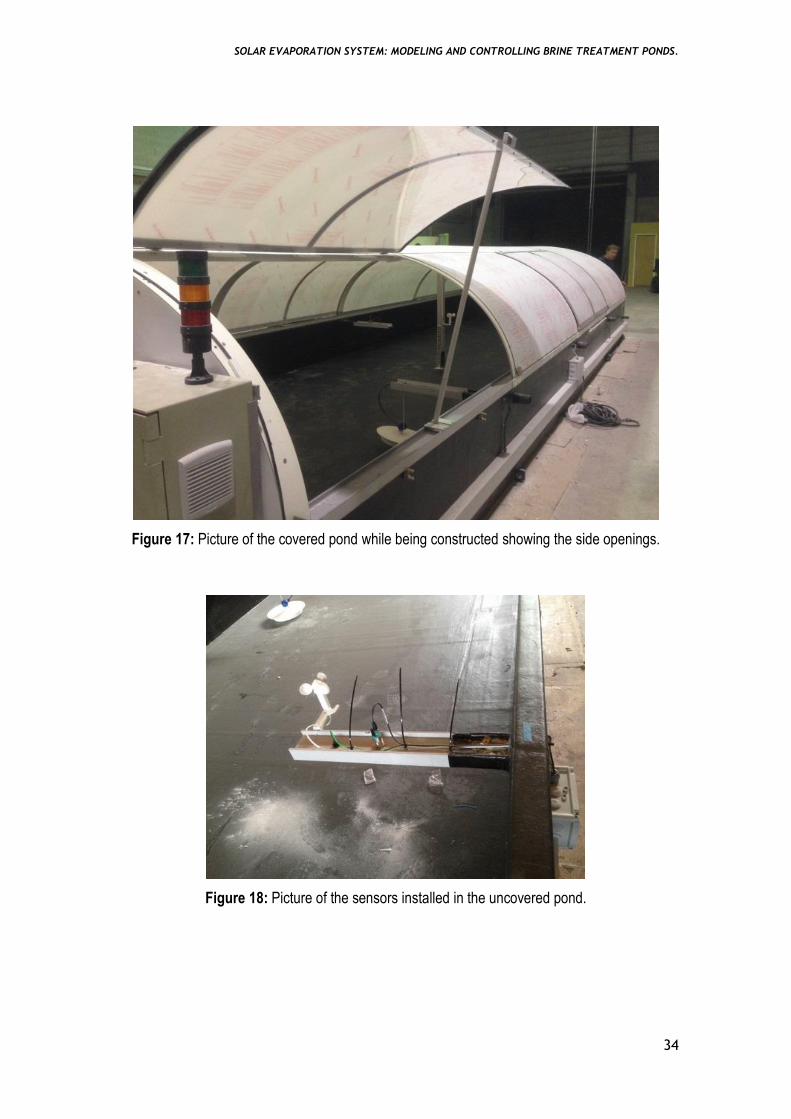
Figure 17: Picture of the covered pond while being constructed showing the side openings.
Figure 18: Picture of the sensors installed in the uncovered pond.

SOLAR EVAPORATION SYSTEM: MODELING AND CONTROLLING BRINE TREATMENT PONDS.
35
Figure 19: Picture of the open pond filled with water.
Figure 20: Picture of the two ponds working.

SOLAR EVAPORATION SYSTEM: MODELING AND CONTROLLING BRINE TREATMENT PONDS.
36
4 Solar Evaporation pilot plant
In this chapter will be reviewed some basic notions about heat transfer that will be important for
the next chapters and then the pilot plant modeling will be presented.
4.1 Heat transfer theoretical background
Heat is the energy in transition between two points in space that have a temperature difference.
When studying heat transfer we are studying how the energy is transferred in a heat form. This
way one calculates the velocity at which the heat change occurs and the temperatures
distribution in a substrate [30].
There are three mechanisms for heat transfer: conduction, convection and radiation, as
summarized in the next sections.
4.1.1 Conduction
This type of mechanism only occurs in solids and fluids and is based in the energy transfer
between molecules or atoms that collide with each other. There’s a law that is used to calculate
the heat transfer through this mechanism: the Fourier Law, which is described in Equation 1 [30].
𝑄 = −𝑘. 𝐴.𝑑𝑇
𝑑𝑥 Equation 1
where the variables have the following meaning:
Q – Heat flow, W/m2
k – Thermal conductivity, W/m.ºK
A – Area of the heat transfer, m2
dT
dx – Temperature gradient, K/m
x – distance, m
4.1.2 Natural and forced convection
The convection type has two different mechanisms. The first one concerns the movement of
macroscopic pieces of fluid, which means, molecules moving all together from a part of the fluid
to another. The other mechanism is about individual molecules colliding with each other inside
the fluid or against a solid surface in contact with the fluid. There are two types of convection:
natural and forced [30] [32].
Natural convection occurs when there’s no global movement of the fluid, or the movement is
irrelevant, but there’s a movement by parts of the fluid because of the difference of densities that
comes from the different temperatures [30] [32].

SOLAR EVAPORATION SYSTEM: MODELING AND CONTROLLING BRINE TREATMENT PONDS.
37
Forced convection is when the fluid moves due to an outside action like a pump, the wind or a
fan.
Equation 2 – Newton Law - is the model for the heat transfer by convection in which Ts is the
temperature of the surface (ºC), 𝑇∞ is the temperature of the fluid far from the surface (ºC) and h
is the convection heat transfer coefficient (W/m2.ºK) [30] [32].
𝑄 = ℎ. 𝐴. (𝑇𝑠 − 𝑇∞) Equation 2
4.1.3 Radiation
A substance emits radiation in the form of electromagnetic waves when there is variation in the
electron configuration of the atoms or molecules. The radiation goes through everything, including
the void. The Equation that describes the heat transfer by radiation is the Stefan – Boltzmann
Law [30] [32]:
Qemi = ε. σ. A. Ts4 Equation 3
where: ε – Emissivity (between 0 and 1); σ – Stefan Boltzmann constant = 5.6703x10⁻⁸ W/m2.K4
4.1.4 Combined heat transfer exercice
In order to understand better the heat transfer mechanisms, in Figure 21 there’s an example of a
heat transfer problem that is solved by a Matlab code using the main equations of heat transfer
(Equatons 1, 2 and 3). In this example one considers the existence of two walls separated by 2
meters with air between them and the objective is to find the values of T1o and T1i after a year.
Qconvection
Qconduction
Qsolar
T1i
T1o T2 = 300 K
Tair
L = 2 m
H = 1.5
m
W = 2 m
e = 0.1 m
SOLAR EVAPORATION SYSTEM: MODELING AND CONTROLLING BRINE TREATMENT PONDS.
38
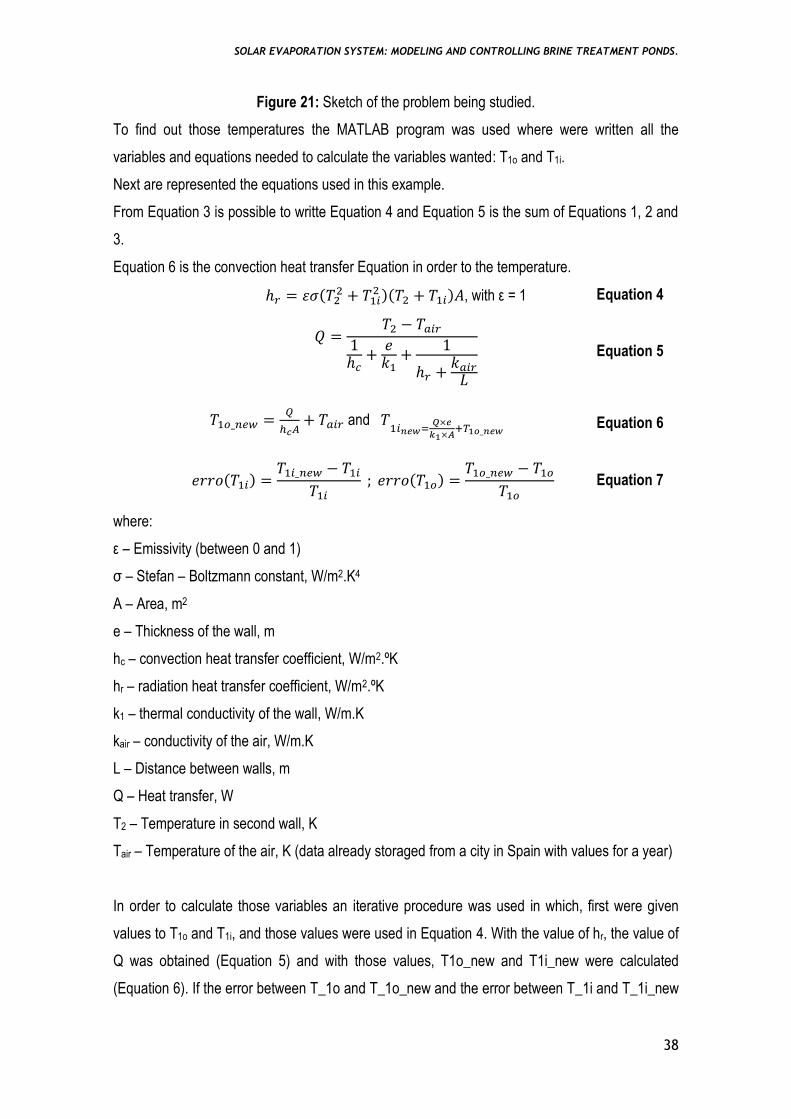
Figure 21: Sketch of the problem being studied.
To find out those temperatures the MATLAB program was used where were written all the
variables and equations needed to calculate the variables wanted: T1o and T1i.
Next are represented the equations used in this example.
From Equation 3 is possible to writte Equation 4 and Equation 5 is the sum of Equations 1, 2 and
3.
Equation 6 is the convection heat transfer Equation in order to the temperature.
ℎ𝑟 = 𝜀𝜎(𝑇22 + 𝑇1𝑖
2 )(𝑇2 + 𝑇1𝑖)𝐴, with ε = 1 Equation 4
𝑄 =
𝑇2 − 𝑇𝑎𝑖𝑟
1ℎ𝑐
+𝑒
𝑘1+
1
ℎ𝑟 +𝑘𝑎𝑖𝑟
𝐿
Equation 5
𝑇1𝑜_𝑛𝑒𝑤 =𝑄
ℎ𝑐𝐴+ 𝑇𝑎𝑖𝑟 and 𝑇
1𝑖𝑛𝑒𝑤=𝑄×𝑒
𝑘1×𝐴+𝑇1𝑜_𝑛𝑒𝑤
Equation 6
𝑒𝑟𝑟𝑜(𝑇1𝑖) =𝑇1𝑖_𝑛𝑒𝑤 − 𝑇1𝑖
𝑇1𝑖 ; 𝑒𝑟𝑟𝑜(𝑇1𝑜) =
𝑇1𝑜_𝑛𝑒𝑤 − 𝑇1𝑜
𝑇1𝑜 Equation 7
where:
ε – Emissivity (between 0 and 1)
σ – Stefan – Boltzmann constant, W/m2.K4
A – Area, m2
e – Thickness of the wall, m
hc – convection heat transfer coefficient, W/m2.ºK
hr – radiation heat transfer coefficient, W/m2.ºK
k1 – thermal conductivity of the wall, W/m.K
kair – conductivity of the air, W/m.K
L – Distance between walls, m
Q – Heat transfer, W
T2 – Temperature in second wall, K
Tair – Temperature of the air, K (data already storaged from a city in Spain with values for a year)
In order to calculate those variables an iterative procedure was used in which, first were given
values to T1o and T1i, and those values were used in Equation 4. With the value of hr, the value of
Q was obtained (Equation 5) and with those values, T1o_new and T1i_new were calculated
(Equation 6). If the error between T_1o and T_1o_new and the error between T_1i and T_1i_new

SOLAR EVAPORATION SYSTEM: MODELING AND CONTROLLING BRINE TREATMENT PONDS.
39
was below a certain value the interaction would stop, otherwise the iterative procedure should
continue till the error value is achieved. The MATLAB code used is included in ANNEX II.
Table 13 contains all the values for the parameters used in this example.
Table 13: Parameters and values of the variables and of the results.
Parameter Value Units
Time 8760 Hour
hc 5 W/m2.K
k1 0.2 W/m.K
kair 0.0219 W/m.ºK
T1i_new 75.53 ºC
T1o_new 24.94 ºC
Analysing Table 13 it’s possible to see that the exercise was for a year of iterations and the final
values obtained for the wanted temperatures were 75.53 ºC for T1i_new and 24.94 ºC for
T1o_new.
Figure 22 represents the results regarding the temperatures for a complete year of iteractions.
Figure 22: All the temperatures for a year of simulation.
In the last Figure it’s possible to see how the temperatures vary over the year except T2 that is
always constant at 26.85 ºC (300 K).
0 2000 4000 6000 8000 10000-20
0
20
40
60
80
100
Time (Hour)
Tem
pera
ture
(ºC
)
Different Temperatures
T 1o
T 1i
T air
T 2

SOLAR EVAPORATION SYSTEM: MODELING AND CONTROLLING BRINE TREATMENT PONDS.
40
4.2 Advanced Solar Evaporator simulation model
4.2.1 Theoretical background
The models (Model 1 and 2) used in developing this thesis are based on the article: advanced
solar dryer for salt recovery from brine effluent of desalination MED plant [31].
The project of the article is called AQUASOL-enhanced Zero Discharge Seawater Desalination
using Hybrid Solar Technology and the objective is to promote the use of solar energy in the
desalination process and in the effluent treatment to improve the energy and environmental
performance to make the MED desalination technology less expensive [31].
This decreasing cost will be obtained by associating the lower energy consumption in the MED
process with the exploitation of sodium chloride that is obtained as sub product for the brine
treatment.
In a solar saltwork the evaporation occurs in a natural way and it depends on several
characteristics of the atmosphere, like air temperature and velocity, moisture and solar irradiation.
The brine conditions are also importante [31].
When evaporating the water from the brine the salts start to precipitate from the least soluble
(CaCO3, CaSO4) and occurs the production of NaCl (Sodium Chloride), Mg (Magnesium) and K
(Potassium) salts (KCl, MgSOx, MgClx) [31].
The extraction of the NaCl happens when submiting the brine to flow through a series of
connected evaporation ponds.
To measure the concentration of salt produced it’s used the Baumé scale (ºBe) (Equation 8), only
used for fluids heavier than water at 15,5 ºC.
𝑠𝑝𝑒𝑐𝑖𝑓𝑖𝑐 𝑑𝑒𝑛𝑠𝑖𝑡𝑦 = 145/(145 − °𝐵𝑒) Equation 8
The evaporation has five distinct stages, the first three are called evaporators, the fourth stage is
called the heater and the last one is where the NaCl is obtained and it’s called the crystallizer.
In the first stage there’s none salt precipitation and occurs the brine volume reduction. In the
second one is visible the precipitation of about 55% of the CaCO3 and of all the iron oxides.
Calcium sulfate starts to precipate at stage 3 and at this stage all of de CaCO3 has been
precipitated.
In the heaters of fourth stage, continues the precipitation of CaSO4 and in the final stage
continues the same precipitaion and also the precipitation of Mg salts and sodium bromide [31].
It is importante to refer that along these stages the initial brine volume is being reduced [31].
In this paper (AQUASOL) was adopted a mathematical model and used Equation 9 as the
representation of the energy balance (Figure 23).

SOLAR EVAPORATION SYSTEM: MODELING AND CONTROLLING BRINE TREATMENT PONDS.
41
d
𝑑𝜌𝑏𝑟𝑖𝑛𝑒𝐶𝑝𝑏𝑟𝑖𝑛𝑒
(𝑇𝑏𝑟𝑖𝑛𝑒 − 𝑇𝑖𝑛𝑖𝑡𝑖𝑎𝑙𝑏𝑟𝑖𝑛𝑒)
∆𝑡= 𝐹𝑠𝐻ℎ−𝑞𝑒 − 𝑞𝑐−𝑞𝑟 − 𝑞𝑏 Equation 9
where:
𝜌𝑏𝑟𝑖𝑛𝑒 – Density of the brine, kg/m3
Fs – Fraction of the solar energy absorbed by the brine layer.
Hh – Global irradiation in the horizontal plane.
Figure 23: Energy Balance of a brine layer [31].
In which:
d – depth, m
Hh – Global irradiation in the horizontal plane.
qb – Conduction heat transfer, W/m2
qc – Convection heat transfer, W/m2
qe – Evaporation heat transfer, W/m2
qr – Radiation heat transfer, W/m2
The follow equations represent the convection losses (10, 11), the evaporation losses (12),
radiactive losses (13) and conduction losses to the soil (14).
𝑞𝑐 = ℎ𝑐(𝑇𝑏𝑟𝑖𝑛𝑒 − 𝑇𝑎𝑖𝑟) Equation 10
ℎ𝑐 = 2.8 + 3.0𝑣 Equation 11
hc – coefficient adopted for the calculation of the convection losses, W/m2.ºC
v – air flow velocity, m/s
Brine
qc
qr
Hh
qb
qe

SOLAR EVAPORATION SYSTEM: MODELING AND CONTROLLING BRINE TREATMENT PONDS.
42
𝑞𝑒 = 0.0163ℎ𝑐(𝑃𝑠,𝑇𝑏𝑟𝑖𝑛𝑒 − ∅𝑃𝑠,𝑇𝑎𝑖𝑟) Equation 12
𝑞𝑟 = 𝜀𝜎(𝑇𝑏𝑟𝑖𝑛𝑒4 − 𝑇𝑠𝑘𝑦
4 )
𝑞𝑏 =𝐾
𝑙(𝑇𝑏𝑟𝑖𝑛𝑒 − 𝑇𝑠𝑜𝑖𝑙)
Equation 13
Equation 14
where:
ε – Emissivity (between 0 and 1)
σ – Stefan-Boltzmann constant, W/m2.K4
hc – convection heat transfer coefficient, W/m2.ºK
K – Soil conductivity, W/m.ºC
𝑙 – Total thickness, m
Ps,Tbrine – Saturation pressure at brine temperature, Pa
Ps,Tair - Saturation pressure at air temperature, Pa
qb – Conduction heat transfer, W/m2
qc – Convection heat transfer, W/m2
qe – Evaporation heat transfer, W/m2
qr – Radiation heat transfer, W/m2
Tair – Temperature of the air, K
Tbrine – Temperature of the brine, K
Tsky – Temperature of the sky, K
Tsoil – Temperature of the soil, K
v – Air flow velocity, m/s
∅ - Values of the relative humidity (obtained directly from the ponds)
Using all these equations it is possible to calculate the mass of evaporated water (kg/m2) by using
equation 15.
𝑚 =𝑞𝑒∆𝑡
𝐶𝑙𝐶𝑒𝑣𝑎𝑝 Equation 15
In which:
Cl – vaporization latent heat
Cevap – evaporation coeficiente depending on the brine saline concentration and referred to
distilled after evaporation, assuming values under 1.

SOLAR EVAPORATION SYSTEM: MODELING AND CONTROLLING BRINE TREATMENT PONDS.
43
These were the equations in which the model written was based on and it will be demonstrated
more forward.
To put the model with all the conditions needed to test the ponds, the variables from Equations 10
to 14 were all substituted with real values obtained from the data from the ponds.
For exemple, the ‘v’ in Equation 11 is the velocity of the natural wind and the values come from
the sensors in the pond.
The temperature of the brine is obtained by the natural temperature in the ponds measured with
the sensors.
SOLAR EVAPORATION SYSTEM: MODELING AND CONTROLLING BRINE TREATMENT PONDS.
44
5 Experimental part
5.1 Data acquisition
Two codes were written (Model 2): one for the uncovered pond (natural convection) and another
for the covered pond (forced air convection).
These codes were based in the equations represented in the AQUASOL project. In this case,
Model 2, is the same as in AQUASOL project (Equations 8-15).
The ponds are eqquiped with sensors to read temperature, humidity, wind velocity and radiation,
so the data used was obtained from there. The data used is only from 26th November 2015 till
28th January 2016 (two months).
Due to the timing of the project it wasn’t possible to perform the study during the most favorable
evaporation season so in these two months the analysis was performed in the lowest
performance expected season.
Before the calculations there was a data treatment, which means that the data first of all was
smoothed and then the data frequency was resized to fewer points spaced regularly along time.
For the natural convection were used equations 10 and 11 in which the values of the Tbrine, Tair
and v were obtained from the real data from the ponds. The same ocurred for equations 12, 13
and 14: the equations are the same and the data was obtained directly from the ponds.
The objective is to compare the level of the water and the mass of water evaporated between the
two ponds.
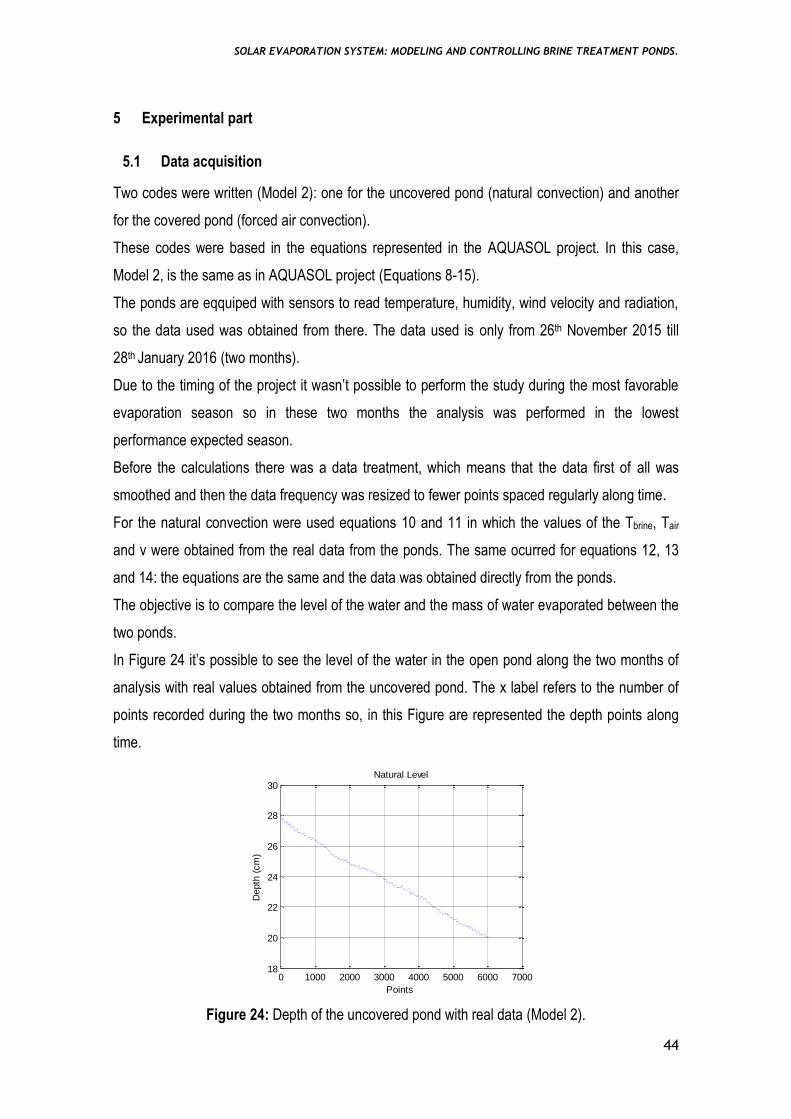
In Figure 24 it’s possible to see the level of the water in the open pond along the two months of
analysis with real values obtained from the uncovered pond. The x label refers to the number of
points recorded during the two months so, in this Figure are represented the depth points along
time.
Figure 24: Depth of the uncovered pond with real data (Model 2).
0 1000 2000 3000 4000 5000 6000 700018
20
22
24
26
28
30
Points
Depth
(cm
)
Natural Level

SOLAR EVAPORATION SYSTEM: MODELING AND CONTROLLING BRINE TREATMENT PONDS.
45
In Figure 24 the maximum point is 28.13 cm and the minimum point is 19.86 cm. With this it’s
possible to conclude that the water level decreased 8.27 cm, which means this is the value that
was evaporated in the two months of data acquisition.
In Figure 25 it’s possible to see the variation of the calculated mass of water evaporated in the
uncovered pond along the two months of analysis.
Figure 25: Mass of evaporated water for the uncovered pond (Model 2).
Analysing Figure 25 it’s possible to see that the mass of water evaporated in the two months is
always between about 1 and 2 kg everytime the depth decreased.
In figure 26 it is possible to see the depth evolution of the covered pond.
Figure 26: Depth of the covered pond (Model 2).
0 1000 2000 3000 4000 5000 6000 70000
0.5
1
1.5
2
2.5Mass of evaporated water
Mass (
kg)
Time (hour)
0 1000 2000 3000 4000 5000 6000 700017
18
19
20
21
22
23
24
25Forced Level
Depth
(cm
)
Points
Mass
(kg)
/ T
ime

SOLAR EVAPORATION SYSTEM: MODELING AND CONTROLLING BRINE TREATMENT PONDS.
46
Analysing Figure 26 it is possible to conlude that the level of the water decreased from 24.32 cm
to 17.63 cm, which means it lost about 6.70 cm of water: less than in the uncovered pond.
The covered pond evaporating less than the uncovered pond is not an expected result because
the covered pond should work like a greenhouse with higher temperatures.
Due to the time available, the code wasn’t finished and because of that will not be compared and
will not be used to obtained the perfect regression Equation for the heat transfer.
5.1.1 Comparing the models
For comparing the models, in Model 1 all the meterological variables were replaced with the
meteorological data from the ponds and the conditions were changed with the real conditions of
the uncovered pond (area, daily production, thermal conductivity, heat transfer coefficients, etc).
Figure 27 represents the depth in the natural pond using Model 1.
Figure 27: Natural Level with the simulations model (Model 1).
After anlysing Figure 27 and by comparing with the results from Figure 24 the conclusion is that
the results are not so different. With the first model the depth decreased 8.27 cm and in this case
the depth decreased 6.73 cm, about 20% different.
0 1000 2000 3000 4000 5000 6000 70000.21
0.22
0.23
0.24
0.25
0.26
0.27
0.28
0.29
X: 6070
Y: 0.2144
Pond depth
Depth
(m
)

SOLAR EVAPORATION SYSTEM: MODELING AND CONTROLLING BRINE TREATMENT PONDS.
47
5.2 Model fitting
After getting all the data and all the models working this is the part where the coefficients are
obtained (he and hc). Another model was written (Model 3) and to calculate the coefficients
Equations 10 to 14 were used.
First, it is possible to associate two of the heat coefficients by Equation 16:
𝜔ℎ𝑐 = ℎ𝑒 Equation 16
where 𝜔 is a constant that will be calculated and:
hc – convection heat transfer coefficient, W/m2.ºC
he – evaporation heat transfer coefficient, W/m2.ºC
From Equation 9 it’s possible to call the variables in the the right side - Qa:
𝑑𝜌𝐶𝑝
∆𝑇
∆𝑡= 𝑄𝑎 Equation 17
And replacing Equation 17 in Equation 9:
−𝑄𝑎 + 𝐹𝑠𝐻𝑠 − 𝑞𝑒 − 𝑞𝑟 − 𝑞𝑏 = 𝑞𝑐 Equation 18
With the Equation 15 used to calculate the mass of water evaporated:
𝑚𝑒𝑣𝑎𝑝 = ∆𝑑𝜌 =𝑞𝑒
𝐶𝑙. 𝐶𝑒𝑣𝑎𝑝. Δ𝑡 → 𝑞𝑒 =
∆𝑑𝜌𝐶𝑙
𝐶𝑒𝑣𝑎𝑝∆𝑡 Equation 19
With Model 3 was made a regression with some of the variables to relate all the points in order to
obtain our own model. The Equation obtained is Equation 20 with a coefficient of determination
(R2) of 0.7.
The value of the coefficient of determination should be bigger than 0.9 to make sure that the
regression is perfect but 0.7 was the best obtained and it proves that is a good regression.
The original format for the Equation obtained from the regresion is:
𝑞𝑒 = 𝛽0 + 𝛽1𝑥1 + 𝛽2𝑥2 + 𝛽3𝑥3+𝛽4𝑥4 + 𝛽5𝑥1𝑥2 + 𝛽5𝑥1𝑥3 + 𝛽6𝑥1𝑥4 + 𝛽5𝑥2𝑥3𝛽5𝑥1𝑥3
+ 𝛽6𝑥2𝑥3+𝛽7𝑥3𝑥4+𝛽8𝑥12 + 𝛽9𝑥2
2 + 𝛽10𝑥32 + 𝛽11𝑥4
2
Analysing all the beta (β) values some of them were cut off because they were nearly zero. So
after cutting off all the variables Equation 20 was obtained.
The variables used and their meaning, and the values of coefficients β are represented in tables
14 and 15, respectively.

SOLAR EVAPORATION SYSTEM: MODELING AND CONTROLLING BRINE TREATMENT PONDS.
48
𝑞𝑒 = 𝛽0 + 𝛽1𝑥1 + 𝛽2𝑥2 + 𝛽3𝑥3+𝛽4𝑥1𝑥2 + 𝛽5𝑥1𝑥3 + 𝛽6𝑥2𝑥3+𝛽7𝑥2
2
+ 𝛽8𝑥32
Equation 20
Table 14: Variables used in Equation 20 and their meaning.
𝒙𝟏 𝒙𝟐 𝒙𝟑 𝒙𝟒
Pressure difference
(ΔP)
Temperature of the
brine (Tb) Air Temperature (Tair)
Outside Radiation
(OutRad)
In Table 14, all the values are obtained from the ponds measured by the sensors.
The values of x2 and x3, for exemple, are the values used in the calculation of the qc (Equation
10).
x1 is used in Equation 12 to calculate qe.
Table 15: Values for the β coefficients in the Equation 20.
β0 β1 β2 β3 β4 β5 β6 β7 β8
10.6703 -8.2103 -14.4062 -8.0319 19.8506 -13.0358 -30.2846 14.1762 32.2475
The same kind of regression was made to find out the qc, obtaining Equation 21.
𝑞𝑐 = 𝛽1𝑥1 + 𝛽2𝑥2 Equation 21
β1 = 6,4911
β2 = 0,9400
𝑥1= qe
𝑥2= Outside radiation (data from the ponds)
With Equation 20 and Equation 21 is now possible to predict the behaviour of the ponds.
Knowing the variables needed in the equations it’s possible to calculate the convection heat
transfer and the evaporation heat transfer in the pond.
After making the regressions for the remain heat transfer like qb and qr is possible to calculate
the amount of water evaporated by the energy balance in Equation 9:
𝑑𝜌𝑏𝑟𝑖𝑛𝑒𝐶𝑝𝑏𝑟𝑖𝑛𝑒
(𝑇𝑏𝑟𝑖𝑛𝑒 − 𝑇𝑖𝑛𝑖𝑡𝑖𝑎𝑙𝑏𝑟𝑖𝑛𝑒)
∆𝑡= 𝐹𝑠𝐻ℎ−𝑞𝑒 − 𝑞𝑐−𝑞𝑟 − 𝑞𝑏 <=>
<=> 𝑑 = 𝐹𝑠𝐻ℎ−𝑞𝑒 − 𝑞𝑐−𝑞𝑟 − 𝑞𝑏
𝜌𝑏𝑟𝑖𝑛𝑒𝐶𝑝𝑏𝑟𝑖𝑛𝑒(𝑇𝑏𝑟𝑖𝑛𝑒 − 𝑇𝑖𝑛𝑖𝑡𝑖𝑎𝑙𝑏𝑟𝑖𝑛𝑒)
∆𝑡

SOLAR EVAPORATION SYSTEM: MODELING AND CONTROLLING BRINE TREATMENT PONDS.
49
6 Proposals for further development
After studying the Matlab models and the ponds behaviour it’s possible to make some notes on
what should be improved to get better results.
The most importante thing is to make the study for a minimum of one year to see the behaviour
over the four seasons. As mentioned before, this two months of study weren’t during the best
season.
Another important thing is to finish the matlab code for the covered pond in order to see how it
works and improve it, if necessary, to obtain the best results and the equations to predict the
evaporation behaviour inside it.
It is also important to compare it with the uncovered pond to see which one is better but the
expectation is that the covered pond will be a best option because it creats a greenhouse effect,
so the temperatures are higher and mass of evaporated water should be higher too.
Is importante to mention that the covered pond also has a part that recovers water from
condensation that can be recovered as potable water for human use.
After modeling and optimization the ponds will be ready to use and then will be tested to see how
they work with the seawater and with salts recovery.
If the ponds work as expected, later they can be used to test how they work for another kind of
wastewater treatment instead of seawater desalination. For exemple, probably they can be used
to treat olive mil wastewater which is a difficult task because of all the oil that is released: all the
water is evaporated and then the olive oil can probably be reused for different purposes.

SOLAR EVAPORATION SYSTEM: MODELING AND CONTROLLING BRINE TREATMENT PONDS.
50
7 Conclusions
In order to try to solve the world’s water scarcity, deslination tecnologies are being studied and
improved.
This thesis studies the solar evaporation of the brine that comes from RO and EDM processes
that are studied in the Zelda project.
To study the solar evaporation process, two ponds were built: one covered and the other
uncovered.
The tests were written in Matlab based on heat and mass transfer phenomena based on another
project, the AQUASOL.
The first model (Model 1) was developed by the CTM team with the restritions and caracteristics
of the ponds and the second model (Model 2) is the same as in the AQUASOL project.
With the data obtained from the ponds, during two months, both models were compared to see if
the behaviour was similar, it was found out that: in both ponds the evaporation predicted by both
models was basically the same.
According to the model predictions, the uncovered pond was working perfectly and evaporating a
reasonable amount of water during the two months of experience but the covered pond wasn’t
studied due the time that wasn’t enough to finish the Matlab code.
After testing the similar behaviour between the variables used to calculate the heat transfer were
made regressions with the variables and two new heat transfer equations for convection and
evaporation were obtained (Model 3).
Calculate the rest of the terms of Equation 1 and finally calculate the depth variation from
Equation 6.
With the convection and evaporation equations obtined it is possible to calculate the heat transfer
coefficient for both and the amount of water mass evaporated.

SOLAR EVAPORATION SYSTEM: MODELING AND CONTROLLING BRINE TREATMENT PONDS.
51
8 References
[1] European comission (2015). Water Scarcity & Droughts in the European Union. Available in:
http://ec.europa.eu/environment/water/quantity/about.htm
[2] Few resources.org (11/9/2015). Water scarcity. Available in:
http://www.fewresources.org/water-scarcity-issues-were-running-out-of-water.html
[3] Unwater (2015). Available in: http://www.unwater.org/water-cooperation-2013/water-
cooperation/facts-and-figures/en/
[4] World Wild Life. Water scarcity. Available in: http://www.worldwildlife.org/threats/water-
scarcity
[5] WWF. Farming: Wasteful water use. Available in:
http://wwf.panda.org/what_we_do/footprint/agriculture/impacts/water_use/
[6] Pacific Institute. Water, Food, and Agriculture. Available in: http://pacinst.org/issues/water-
food-and-agriculture/
[7] Brown, A., & Matlock, M. D. (2011). A Review of Water Scarcity Indices and Methodologies.
Arkansas: University of Arkansas. PDF. Available in: https://www.sustainabilityconsortium.org/wp-
content/themes/sustainability/assets/pdf/whitepapers/2011_Brown_Matlock_Water-Availability-
Assessment-Indices-and-Methodologies-Lit-Review.pdf
[8] Dias, Ana Claudia (2014). A pegada da água. Porto, Portugal. FEUP. Contents of the course.
[9] ZELDA. Available in: http://life-zelda.eu/en
[10] Business Inteligence Unit. Aicep Protugal Global. Available in:
http://www.portugalglobal.pt/PT/Biblioteca/LivrariaDigital/INOV/Dessalinizacao_Agua.pdf
[11] Fernandes, Vanize Eliane - USO DA DESSALINIZAÇÃO NO ABASTECIMENTO DE ÁGUA
PARA O CONSUMO HUMANO EM REGIÕES COM CLIMAS ÁRIDOS OU SEMI- ÁRIDOS.
Faculdade de Ciencias e Tecnologia da Universidade Nova de Lisboa. Setembro 2013. Tese de
Mestrado.
[12] Desalination by reverse osmosis. Available in:
https://www.oas.org/dsd/publications/Unit/oea59e/ch20.htm
[13] Alves, Célia. (2007). Tratamento de Águas de Abastecimento. Publindustria. Livro.
[14] http://puretecwater.com/what-is-reverse-osmosis.html

SOLAR EVAPORATION SYSTEM: MODELING AND CONTROLLING BRINE TREATMENT PONDS.
52
[15] http://www.ee.co.za/wp-content/uploads/2014/12/09-mr-water-desalination-final-Fig.021.jpg
[16] Multiple Stage Flash Processes. Available in: http://www.sidem-
desalination.com/Process/MSF/
[17] Desalination by distillation. Available in:
https://www.oas.org/dsd/publications/Unit/oea59e/ch21.htm
[18] Shatat, Mahmoud and RiffatInternational, Saffa B. Journal of Low-Carbon Technologies
Advance Access published April 6, 2012. Water desalination technologies utilizing conventional
and renewable energy sources. UK
[19] http://www.ee.co.za/article/water-desalination-energy.html
[20]http://www.ci.laredo.tx.us/city-council/council-activities/council-minutes/2007Min/M2007-W-
10.htm
[21] Vapor Compression Distillation. Available in:
https://people.uwec.edu/piercech/desalination/VCD.htm
[22] Sadrzadeh, M., & Mohammadi, T. (2007). Sea water desalination using electrodialysis. Iran.
PDF. Available in: http://www.sciencedirect.com/
[23] Banasiaka, L. J., Kruttschnittb, T. W., & Schäfer, A. I. Volume 205, Issues 1–3, 5 February
2007, Pages 38–46. Desalination using electrodialysis as a function of voltage and salt
concentration. PDF. Available in: http://www.sciencedirect.com/
[24] Karagiannis, I. C., & Soldatos , P. G. Volume 223, Issues 1–3, 1 March 2008, Pages 448–
456. Water desalination cost literature: review and assessment. PDF. Available in:
http://www.sciencedirect.com/
[25]https://www.google.pt/search?q=Arab+States+of+the+Gulf+(GCC)&source=lnms&tbm=isch&
sa=X&ved=0ahUKEwiDsvab_tfLAhVELhoKHcjWCBIQ_AUICCgC&biw=1366&bih=643#imgrc=cH
-zyJPjxpSXwM%3ª
[26] Group, P. b. (2014). DESALINATION In the GCC: The History, the Present & the
Future.Available in: sites.gcc-sg.org/DLibrary/download.php?B=673
[27] Adil, D. ASSESSMENT OF BEST AVAILABLE TECHNOLOGIES FOR DESALINATION IN
RURAL/LOCAL AREAS. PDF. Available in: http://www.swim-
sm.eu/files/BAT_on_Desalination_Final.pdf
[28] CTM. Midterm Report Version 6, 2016. Manresa, Spain.

SOLAR EVAPORATION SYSTEM: MODELING AND CONTROLLING BRINE TREATMENT PONDS.
53
[29] Younos, Tamim (2005). Environmental Issues of Desalination. Virginia Polytectnic Institute
and State University. JOURNAL OF CONTEMPORARY WATER RESEARCH & EDUCATION.
PDF. Available in: http://onlinelibrary.wiley.com/doi/10.1111/j.1936-
704X.2005.mp132001003.x/epdf
[30] Luís Manuel Ferreira Melo. (2013). Fenomenos de Transfrência. Porto, Portugal. FEUP.
Contents of the course.
[31] Collares-Pereira, Manuel; Farinha Mendes, João; Horta, Pedro. ADVANCED SOLAR
DRYER FOR SALT RECOVERY FROM BRINE EFFLUENT OF DESALINATION MED PLANT.
ISES Solar World Congress 2003. Göteborg, Sweden. Available in:
http://www.psa.es/en/projects/aquasol/files/Congresos/ISES2003_O5_40_Aquasol.pdf
[32] Çengel, Yunus A.; Heat transfer. ISBN: 0-07-115150-8. Chapter 1
[33] Rick Bonde t al., Florida Water Resources Journal, 36-44, July 2011.

SOLAR EVAPORATION SYSTEM: MODELING AND CONTROLLING BRINE TREATMENT PONDS.
54
ANNEX I – Ponds control unit
Figure 28: Picture of the monitor used to control the ponds.

SOLAR EVAPORATION SYSTEM: MODELING AND CONTROLLING BRINE TREATMENT PONDS.
55
ANNEX II – Matlab code of the exemple
clear; clc;
Meteo = importdata('meteo_files\ZonaC3.csv',';',2);
T_air = Meteo.data(:,4) + 273.15;
rad_normal = Meteo.data(:,8);
Anys = 1;
final_hour = size (T_air, 1);
T_2=zeros (final_hour, 1) + 300;
h_c=5;
k1=2;
e1=0.1;
L=2;
W=2;
H=1.5;
A=W*H;
k_air=100;
const_boltz = 5.67e-8;
Epsilon = 1;
T_1i (1) = 300;
T_1o (1) = 320;
max_error = 1e-03;
e = max_error+1;
fr = 1.0;
iteration=0;
time(1)=1;
for h=1:final_hour
time(h+1)=h;
while e > max_error
h_r = epsilon*const_boltz*((T_2 (h) ^2 + T_1i (h) ^2)*(T_2 (h)-T_1i (h)));
U = ((1/h_c)+(e1/k1))+(1/(h_r+(k_air/L)));
Qs = rad_normal (h);
Q = ((T_2 (h)-T_air (h)) + (Qs/h_c))/U;
T_1o_new = (Q / (h_c)) + T_air (h);
SOLAR EVAPORATION SYSTEM: MODELING AND CONTROLLING BRINE TREATMENT PONDS.
56
T_1i_new = ((Q*e1) / (k1)) + T_1o_new;
e_T_1i = abs ((T_1i_new-T_1i (h))/T_1i (h));
e_T_1o = abs((T_1o_new-T_1o (h))/T_1o (h));
e = max(e_T_1i,e_T_1o);
T_1i (h) = fr * (T_1i_new-T_1i (h)) + T_1i (h);
T_1o (h) = fr * ( T_1o_new-T_1o (h))+T_1o (h);
iteration = iteration+1;
End
disp(['Hour= ',num2str(h),' iteration n= ',num2str(iteration),' Error= ',num2str(e)]);
e = max_error+1;
iteration = 1;
T_1i (h+1) = T_1i (h);
T_1o (h+1) = T_1o (h);
End
T_1o (end) = [ ];
T_1i (end) = [ ];
Time (end) = [ ];

SOLAR EVAPORATION SYSTEM: MODELING AND CONTROLLING BRINE TREATMENT PONDS.
57
ANNEX III – ZELDA
“The main objective of the ZELDA project is to demonstrate and disseminate the technical
feasibility and economical sustainability of decreasing the overall environmental impact of
desalination systems for freshwater production by adopting brine management strategies based
on the use of electrodialysis metathesis (EDM) and valuable compound recovery processes with
the final aim of reaching a zero liquid discharge (ZLD) process.
The first stage of the new process will have a clear demonstrative character and its main
objective will be to prove the performance of the innovative EDM technology to highly concentrate
the brines before entering the second stage of the process. The second stage of the new brine
management process proposed in the ZELDA project has the final aim to achieve Zero Liquid
Discharge (ZLD) desalination by means of recovery valuable compounds through precipitation,
concentration and evaporation.
To demonstrate the environmental benefits of the new EDM-ZLD in the desalination brine
treatment, a pilot plant has been constructed and will be installed and operated in the Almería,
where brines from the RO-EDM treatment will be treated. The pilot plant constructed in the
ZELDA project is divided in two steps: EDM and recovery of valuable compounds (ZLD).
The main result expected after the execution of the ZELDA project is to increase the sustainability
of brackish water and seawater desalination systems for freshwater production, being some
specific results the following ones:
To design and construct a versatile brine treatment system based on EDM and recovery of
valuable compounds.
Performance and operational costs of the two stages of the process.
To increase water recovery of the existing desalination plants.
To decrease brine discharge into water bodies and, consequently, to reduce the
environmental impact of current brine management strategies.
To increase public awareness on the environmental impact of current brine discharge
strategies.
The Life+ ZELDA project consortium consists on a Coordinating Beneficiary of the project,
Fundació CTM Centre Tecnològic, and three associated beneficiaries: Fujifilm, Abengoa and
European Water Supply and Sanitation Technology Platform.
The ZELDA project started on July of 2013.
Over the last decades, advances in desalination technology enabled obtaining freshwater from
seawater or brackish water in regions with water scarcity. Although desalination technologies

SOLAR EVAPORATION SYSTEM: MODELING AND CONTROLLING BRINE TREATMENT PONDS.
58
have a huge socio-economic positive impact, they also entail environmental drawbacks. Most of
desalination plants use membranes to separate water from dissolved salts that are present in
seawater or brackish water, thus leaving a highly saline solution named concentrate and also
known as brine.
In case of seawater desalination, brine is usually discharged back into the sea. The whole
scientific community agrees that brine discharge is a potential menace for marine ecosystem,
generating environmental impacts in reception point such as diminishing the amount of flora and
also creating salinity, temperature and alkalinity gradients. This impact is much more severe in
case of brackish water desalination, when this concentrate is discharged into the surface or
groundwater bodies because of higher salinity gradients.
The aim of LIFE+ ZELDA is to demonstrate the technical and economical feasibility of a new
brine treatment system to reach zero liquid discharge (ZLD) desalination in both, seawater and
brackish water desalination processes. Therefore, the main objective of the project will be to
reduce the high environmental impact that nowadays brine discharge is causing in water
ecosystems and increase the overall sustainability of desalination.
The innovative brine treatment system is based on electrodialysis metathesis (EDM) and
recovery of valuable compounds (ZLD). In the EDM configuration, the sparingly soluble salts such
as CaSO4, MgSO4 or CaCO3, are not produced in neither of the concentrate streams. As a result,
the brine can be more concentrated than in conventional electrodialysis (ED) process, increasing
the overall recovery of desalination systems. In order to reach a ZLD desalination, and also to
make the brine management more economically feasible, the EDM process will be coupled to a
second stage aimed to recover valuable compounds. This second stage or ZLD stage involves
controlled chemical reactions using non-hazardous chemicals. Depending on the chemical
composition of EDM concentrates, the process will involve one or more precipitation routes
combined with higher efficiency volume reduction technologies, such as brine concentrators.
Furthermore to reach ZLD natural and intensive evaporation will be evaluated. It is expected that
compounds such CaCO3, CaSO4, Mg(OH)2, Na2SO4 and NaCl will be recovered.
To achieve ZELDA objectives, an EDM-ZLD pilot plant will be designed, constructed and
implemented in the Almería SWDP. The technology will be evaluated and applied to treat
different brines from Almería SWDP and from two BWDP, El Atabal and Helios. Furthermore the
possibility of treat other brines will be considered.
In order to demonstrate overall environmental benefits and economical sustainability resulting
from implementation of EDM-ZLD technology, results obtained during pilot plant operation will be
analyzed using standardized and widely accepted Life Cycle Assessment (LCA) and Life Cycle

SOLAR EVAPORATION SYSTEM: MODELING AND CONTROLLING BRINE TREATMENT PONDS.
59
Cost (LCC) procedures and databases. Furthermore the overall sustainability of the proposed
technology will be compared with brine discharge as well as the conventional processes for
obtaining the recovered compounds, including mining activities.
Below there are listed the main results and environmental benefits expected after the execution of
the LIFE+ ZELDA project:
Versatile brine treatment system based on EDM-ZLD technology.
Performance and operational costs of the new EDM-ZLD system to treat brines from both,
seawater and brackish water desalination plants.
The influence of the brine composition and operating conditions of the EDM-ZLD system on
the overall sustainability of the desalination process.
To increase the water recovery of the existing desalination plants.
To decrease the brine discharge into water bodies.
To decrease the environmental impact of obtaining valuable compounds recovered via
conventional mining activities.
To increase the public awareness on the environmental impact of current brine discharge
strategies.
Moreover, the ZELDA project is completely in line with some of the most important policies and
directives regarding water management at European level. The Water Framework Directive
(WFD) (2000/60/EC) and the European Marine Strategy (EMS) (2008/56/EC) constitute the main
legal framework at European level for the protection of aquatic systems. Brine discharge into
water bodies, which is the most common option of current seawater and brackish water
desalination plants, is in clear conflict with the objective of both, the WFD and the EMS.
Furthermore, unfortunately, there is no specific legislation prohibiting the brine discharge.
With the results obtained in the ZELDA project, it is expected to demonstrate the high
environmental gains of a Zero Liquid Discharge desalination compared with current brine
management strategies, contributing to the implementation of new European legislation focused
on brines.

SOLAR EVAPORATION SYSTEM: MODELING AND CONTROLLING BRINE TREATMENT PONDS.
60
Figure 29: Almería desalination plant.
Information about the Life+ ZELDA Project has also been published in the WssTP newsletter
(October 2013), the CTM newsletter (December 2013), the CTM magazine (November 2013) and
also in the ABENGOA webpage.
ZELDA project has also gained visibility through its participation at large European conferences
as Water Innovation Europe 2014 and EIP Water Conference 2014.
It has been demonstrated at laboratory scale that the proposed new EDM-ZLD process is
technically feasible, allowing achieve zero liquid discharge in water desalination. Furthermore,
results obtained during the first half of the project allowed design and construct a pilot plant in
order to validate the technical and economical viability of the EDM-ZLD implementation. The pilot
plant was going to be installed at Almería on June 2015 (supposly) but was installed in November
2015, and during the following two years different brines will be treated. During pilot plant
operation results will be more visible. It will be possible to consult real-time data from pilot plant in
the ZELDA website demonstrating the technical feasibility of the EDM-ZLD process.
Brine management and disposal, especially for inland applications, is currently one of the most
challenging issues associated with water desalination. The disposal of brine from desalination
plants into water bodies conflicts with the objectives of the Water Framework Directive
(2000/60/EC) and, therefore, it is necessary to implement brine management strategies that do
not include its release into the environment.

SOLAR EVAPORATION SYSTEM: MODELING AND CONTROLLING BRINE TREATMENT PONDS.
61
ZELDA project will contribute on the accomplishment of WFD by developing a new process for
brine treatment. The new EDM-ZLD process will allow achieving zero liquid discharge in seawater
and brackish water desalination reducing its environmental impact and increasing the overall
sustainability of desalination. So, the main environmental benefits associated to EDM-ZLD
process are:
• Reducing the amount of brine discharged to the water bodies.
• Increase freshwater production in desalination processes.
• The new EDM-ZLD process will convert brine to a secondary source allowing the
recovery of valuable compounds and reducing the natural resources consumption.
• Improve status of water bodies, not only the sea, also aquifers and rivers.
• Reduction of water scarcity.
Furthermore, the project ZELDA is clearly a climate change adaptation project.”

SOLAR EVAPORATION SYSTEM: MODELING AND CONTROLLING BRINE TREATMENT PONDS.
62
Table 16: List of Deliverables to be produced during the first half of the Project.
Deliverable Status
Project Logo
Main characteristics of Almería seawater
Novel ion-exchange membranes characterization and performance
P&I Diagram and main component description of the EDM stage
Compound recovery strategies from seawater and brackish water
brines
P&I Diagram and main component description of the ZLD stage
Fully automated EDM system with capacity of handling around 1 m3/h
of brine
Zero Liquid Discharge stage of the pilot plant constructed
Project website completed
At the time this report was written the last three deliverables weren’t finished and they were
estimated to be finished in June 2015.
That finishing line wasn’t fulfilled, they were all finished till November 2015.
Table 17: List of Milestones to be produced during the first half of the project
Milestone Status
Nomination of the Project Manager and the Steering Comitee
Best membrane configuration for EDM selected
Project website activated
Environmental and economical impact calculation methodology

SOLAR EVAPORATION SYSTEM: MODELING AND CONTROLLING BRINE TREATMENT PONDS.
63
EDM-ZLD pilot plant continuosly operating in Almería seawater desalination
plant
The EDM-ZLD pilot plant continuosly operating in Almería seawater desalination plant started to
be operated in November 2015.
Top Related