


Languages
Pages
Legal


INSTITUTE OF INFORMATION TECHNOLOGY
UNIVERSITY OF DHAKA
Software Testing & Quality Assurance
Submitted by
Minhas Kamal
Roll- BSSE0509
Submitted to
Alim-ul-Giash
Lecturer
Institute of Information Technology,
University of Dhaka
Data: 08-Oct-15
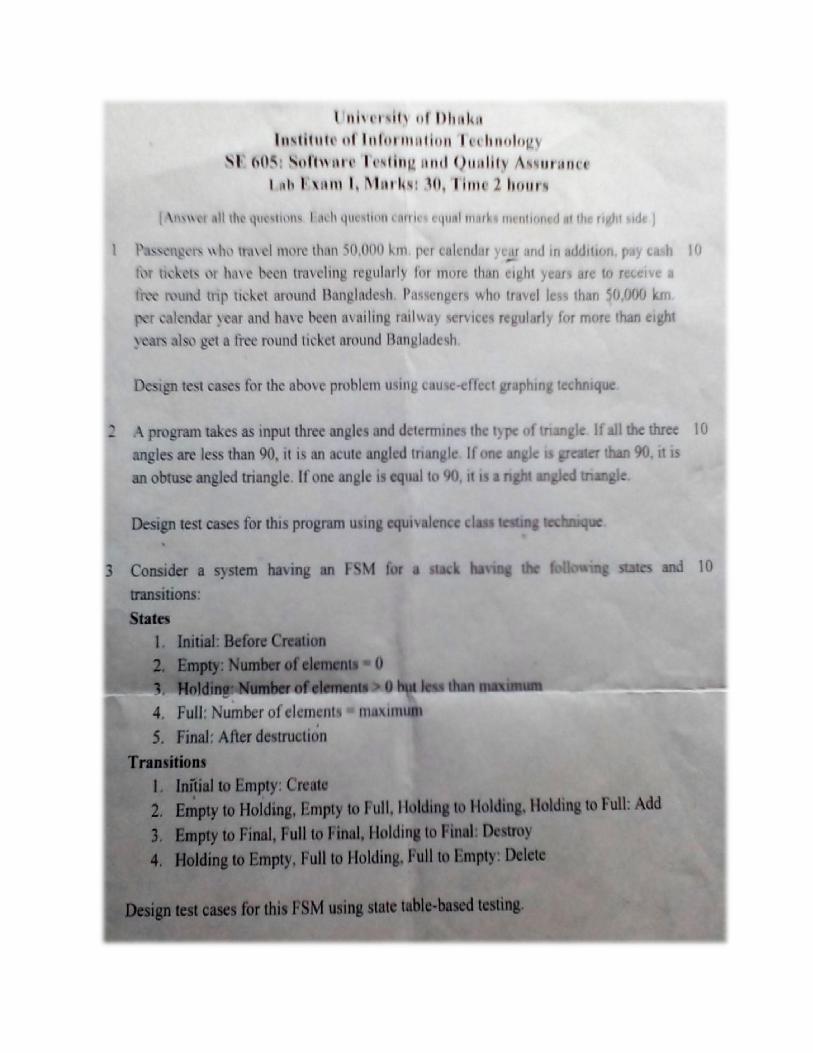
Answer to the question no
Let,
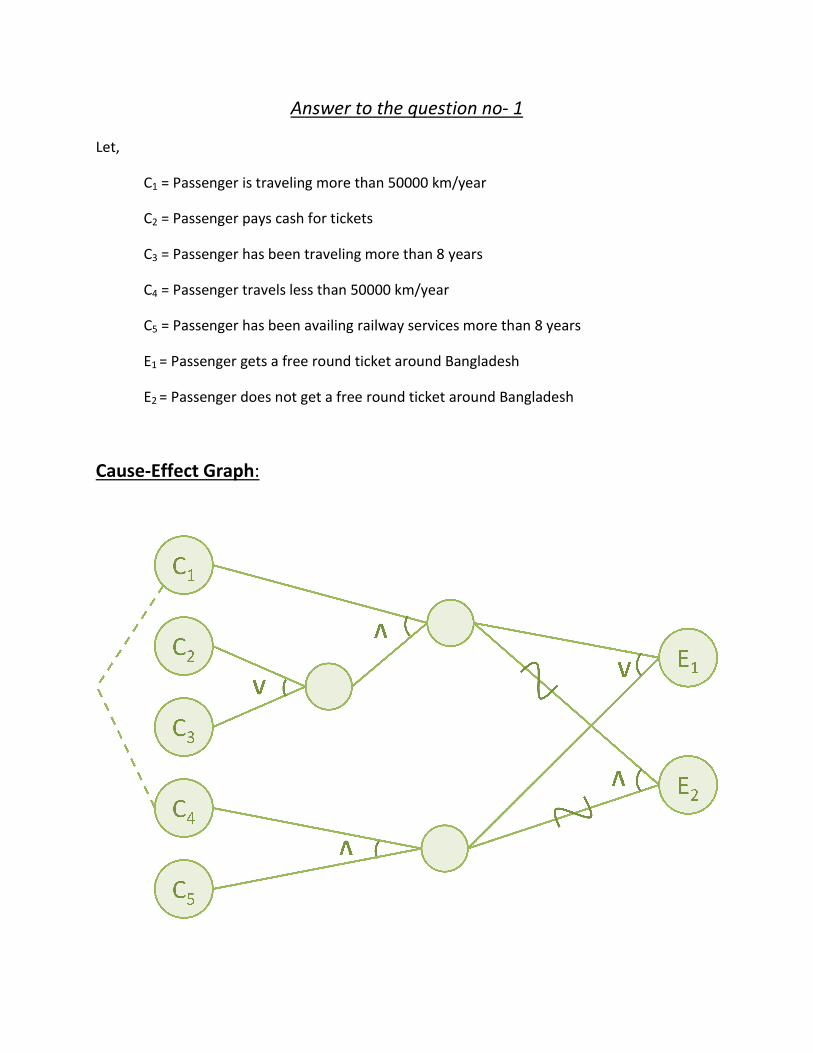
C1 = Passenger is traveling more than 50000 km/year
C2 = Passenger pays cash for tickets
C3 = Passenger has been traveling more than 8 years
C4 = Passenger travels less than 50000 km/year
C5 = Passenger has been availing railway services more than 8 years
E1 = Passenger gets a free round ticket around Bangladesh
E2 = Passenger does not get a free
Cause-Effect Graph:
Answer to the question no- 1
= Passenger is traveling more than 50000 km/year
= Passenger pays cash for tickets
= Passenger has been traveling more than 8 years
= Passenger travels less than 50000 km/year
= Passenger has been availing railway services more than 8 years
= Passenger gets a free round ticket around Bangladesh
= Passenger does not get a free round ticket around Bangladesh
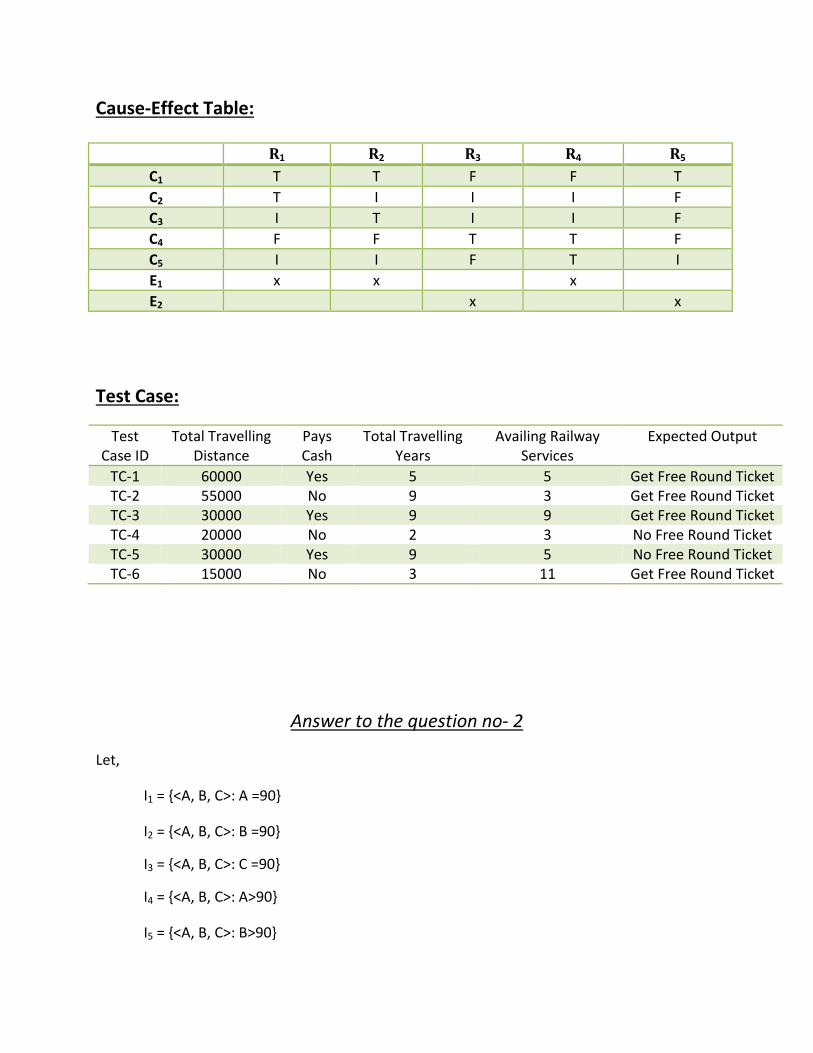
Cause-Effect Table:
Test Case:
Test Case ID
Total Travelling Distance
Pays Cash
Total Travelling Years
Availing Railway Services
Expected Output
TC-1 60000 Yes 5 5 Get Free Round Ticket TC-2 55000 No 9 3 Get Free Round Ticket TC-3 30000 Yes 9 9 Get Free Round Ticket TC-4 20000 No 2 3 No Free Round Ticket TC-5 30000 Yes 9 5 No Free Round Ticket TC-6 15000 No 3 11 Get Free Round Ticket
Answer to the question no- 2
Let,
I1 = {<A, B, C>: A =90}
I2 = {<A, B, C>: B =90}
I3 = {<A, B, C>: C =90}
I4 = {<A, B, C>: A>90}
I5 = {<A, B, C>: B>90}
R1 R2 R3 R4 R5
C1 T T F F T
C2 T I I I F
C3 I T I I F
C4 F F T T F
C5 I I F T I
E1 x x x
E2 x x
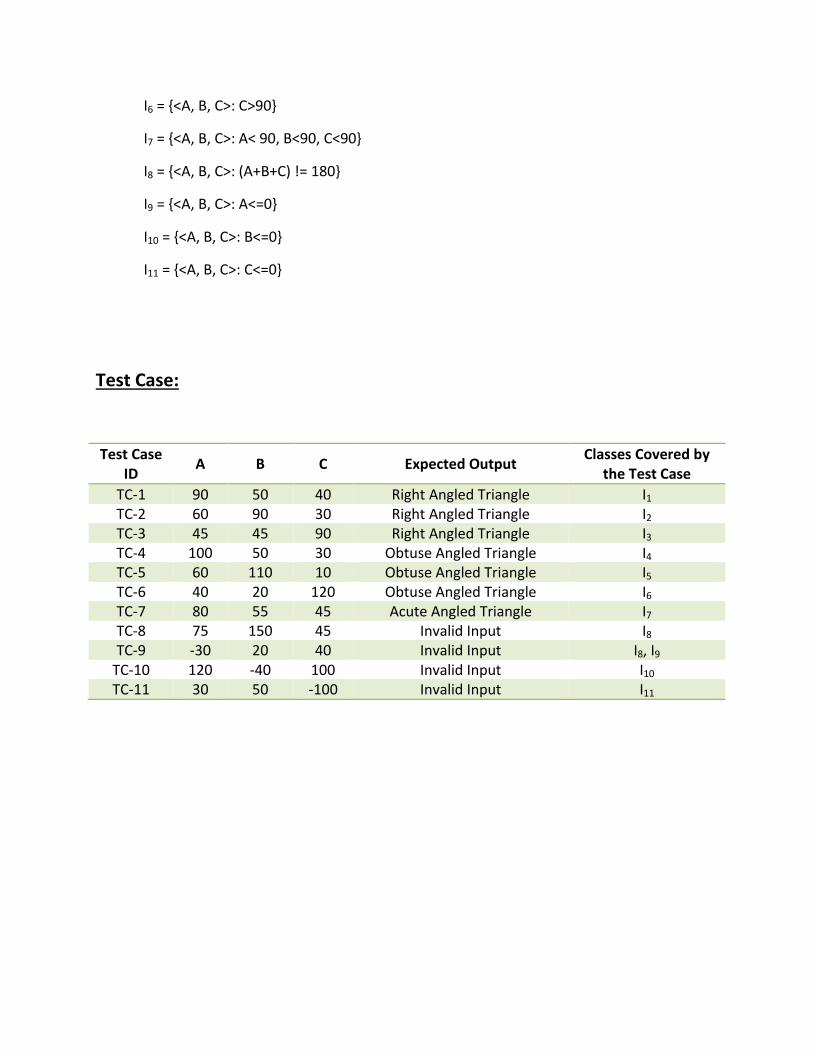
I6 = {<A, B, C>: C>90}
I7 = {<A, B, C>: A< 90, B<90, C<90}
I8 = {<A, B, C>: (A+B+C) != 180}
I9 = {<A, B, C>: A<=0}
I10 = {<A, B, C>: B<=0}
I11 = {<A, B, C>: C<=0}
Test Case:
Test Case ID
A B C Expected Output Classes Covered by
the Test Case
TC-1 90 50 40 Right Angled Triangle I1 TC-2 60 90 30 Right Angled Triangle I2 TC-3 45 45 90 Right Angled Triangle I3 TC-4 100 50 30 Obtuse Angled Triangle I4 TC-5 60 110 10 Obtuse Angled Triangle I5 TC-6 40 20 120 Obtuse Angled Triangle I6 TC-7 80 55 45 Acute Angled Triangle I7 TC-8 75 150 45 Invalid Input I8 TC-9 -30 20 40 Invalid Input I8, I9
TC-10 120 -40 100 Invalid Input I10 TC-11 30 50 -100 Invalid Input I11
Answer to the question no
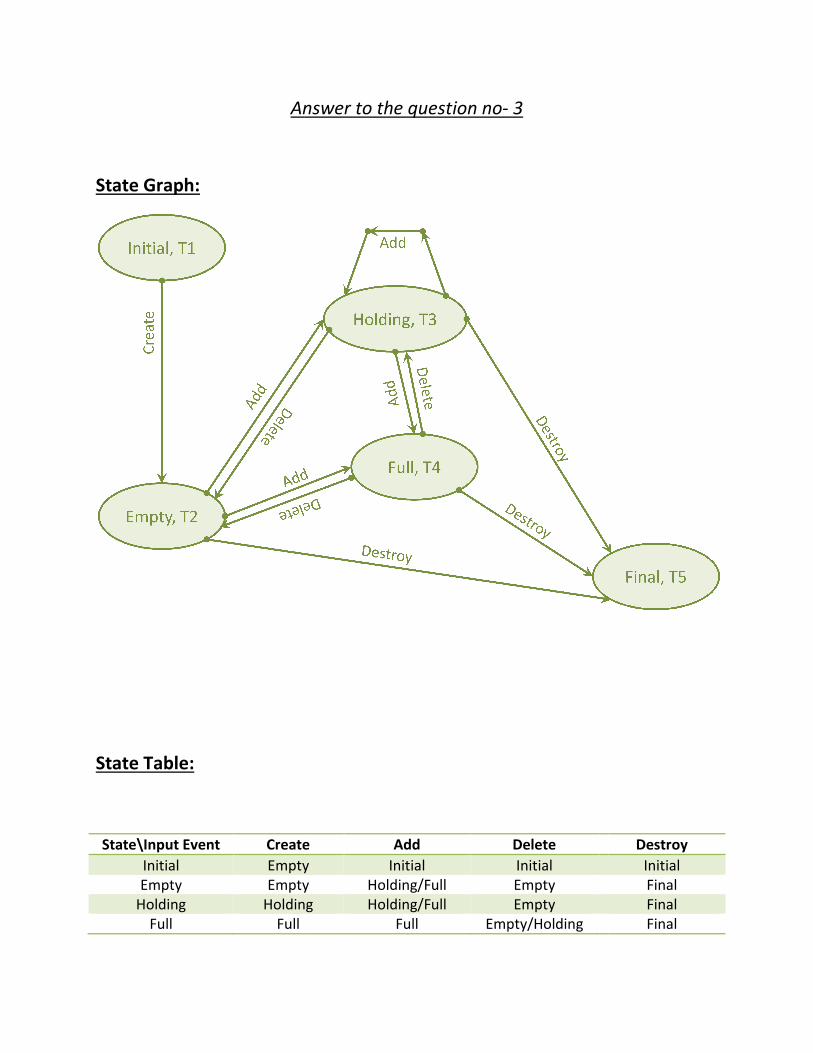
State Graph:
State Table:
State\Input Event Create
Initial EmptyEmpty Empty
Holding HoldingFull Full
Answer to the question no- 3
Create Add Delete
Empty Initial Initial Empty Holding/Full Empty
Holding Holding/Full Empty Full Empty/Holding
Destroy
Initial Final Final Final
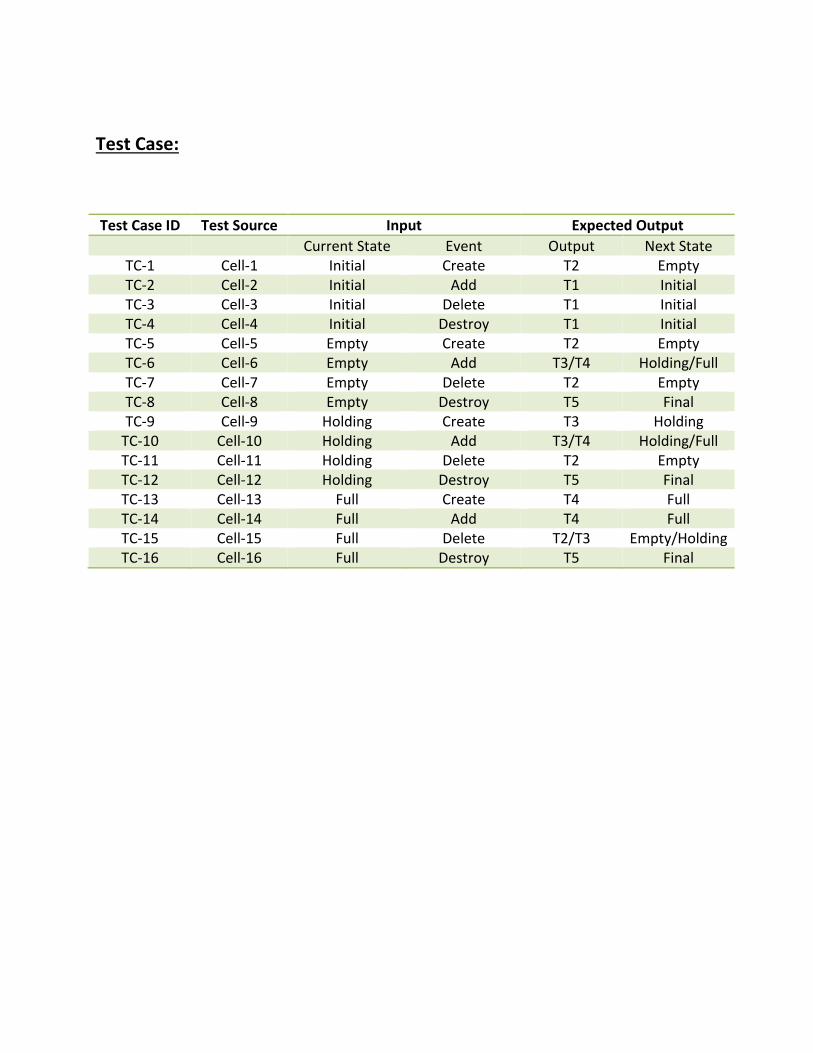
Test Case:
Test Case ID Test Source Input Expected Output
Current State Event Output Next State TC-1 Cell-1 Initial Create T2 Empty TC-2 Cell-2 Initial Add T1 Initial TC-3 Cell-3 Initial Delete T1 Initial TC-4 Cell-4 Initial Destroy T1 Initial TC-5 Cell-5 Empty Create T2 Empty TC-6 Cell-6 Empty Add T3/T4 Holding/Full TC-7 Cell-7 Empty Delete T2 Empty TC-8 Cell-8 Empty Destroy T5 Final TC-9 Cell-9 Holding Create T3 Holding
TC-10 Cell-10 Holding Add T3/T4 Holding/Full TC-11 Cell-11 Holding Delete T2 Empty TC-12 Cell-12 Holding Destroy T5 Final TC-13 Cell-13 Full Create T4 Full TC-14 Cell-14 Full Add T4 Full TC-15 Cell-15 Full Delete T2/T3 Empty/Holding TC-16 Cell-16 Full Destroy T5 Final
Top Related