


Languages
Pages
Legal

SOFTWARE MANAGEMENT: SECURITY IMPERATIVE, BUSINESS OPPORTUNITY
www.bsa.org
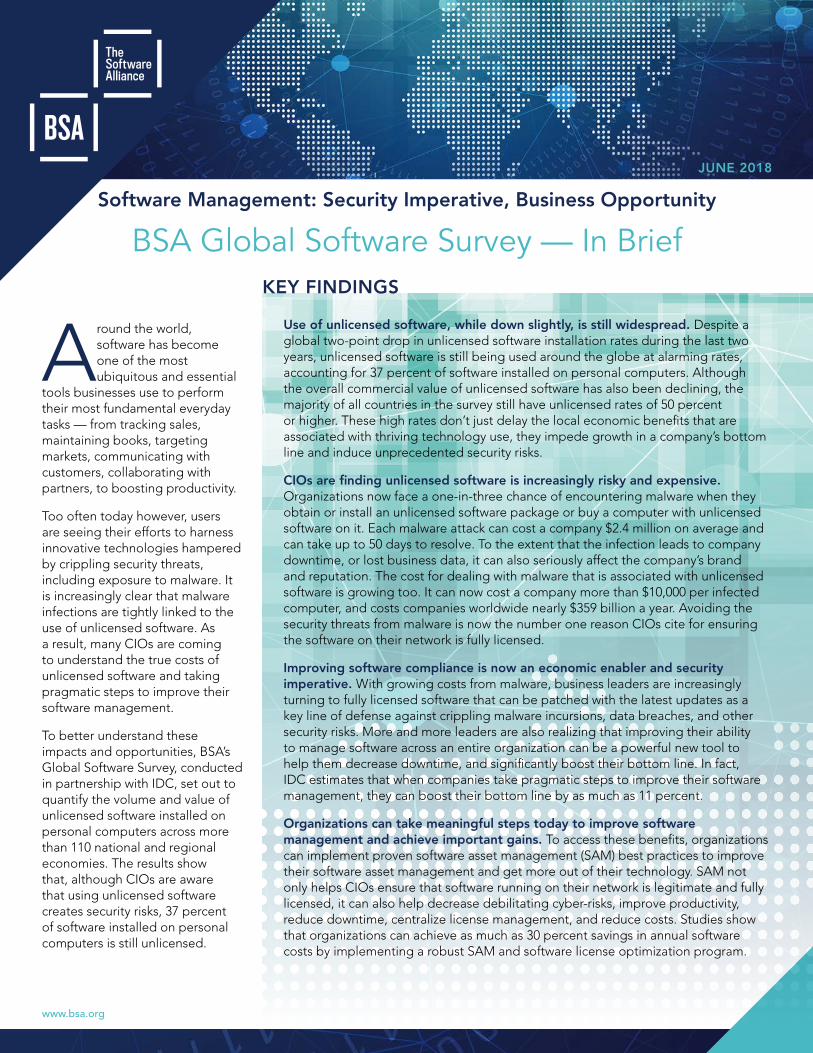
Software Management: Security Imperative, Business Opportunity
JUNE 2018
BSA Global Software Survey — In Brief
Around the world, software has become one of the most ubiquitous and essential
tools businesses use to perform their most fundamental everyday tasks — from tracking sales, maintaining books, targeting markets, communicating with customers, collaborating with partners, to boosting productivity.
Too often today however, users are seeing their efforts to harness innovative technologies hampered by crippling security threats, including exposure to malware. It is increasingly clear that malware infections are tightly linked to the use of unlicensed software. As a result, many CIOs are coming to understand the true costs of unlicensed software and taking pragmatic steps to improve their software management.
To better understand these impacts and opportunities, BSA’s Global Software Survey, conducted in partnership with IDC, set out to quantify the volume and value of unlicensed software installed on personal computers across more than 110 national and regional economies. The results show that, although CIOs are aware that using unlicensed software creates security risks, 37 percent of software installed on personal computers is still unlicensed.
Use of unlicensed software, while down slightly, is still widespread. Despite a global two-point drop in unlicensed software installation rates during the last two years, unlicensed software is still being used around the globe at alarming rates, accounting for 37 percent of software installed on personal computers. Although the overall commercial value of unlicensed software has also been declining, the majority of all countries in the survey still have unlicensed rates of 50 percent or higher. These high rates don’t just delay the local economic benefits that are associated with thriving technology use, they impede growth in a company’s bottom line and induce unprecedented security risks.
CIOs are finding unlicensed software is increasingly risky and expensive. Organizations now face a one-in-three chance of encountering malware when they obtain or install an unlicensed software package or buy a computer with unlicensed software on it. Each malware attack can cost a company $2.4 million on average and can take up to 50 days to resolve. To the extent that the infection leads to company downtime, or lost business data, it can also seriously affect the company’s brand and reputation. The cost for dealing with malware that is associated with unlicensed software is growing too. It can now cost a company more than $10,000 per infected computer, and costs companies worldwide nearly $359 billion a year. Avoiding the security threats from malware is now the number one reason CIOs cite for ensuring the software on their network is fully licensed.
Improving software compliance is now an economic enabler and security imperative. With growing costs from malware, business leaders are increasingly turning to fully licensed software that can be patched with the latest updates as a key line of defense against crippling malware incursions, data breaches, and other security risks. More and more leaders are also realizing that improving their ability to manage software across an entire organization can be a powerful new tool to help them decrease downtime, and significantly boost their bottom line. In fact, IDC estimates that when companies take pragmatic steps to improve their software management, they can boost their bottom line by as much as 11 percent.
Organizations can take meaningful steps today to improve software management and achieve important gains. To access these benefits, organizations can implement proven software asset management (SAM) best practices to improve their software asset management and get more out of their technology. SAM not only helps CIOs ensure that software running on their network is legitimate and fully licensed, it can also help decrease debilitating cyber-risks, improve productivity, reduce downtime, centralize license management, and reduce costs. Studies show that organizations can achieve as much as 30 percent savings in annual software costs by implementing a robust SAM and software license optimization program.
KEY FINDINGS
2 BSA | The Software Alliance
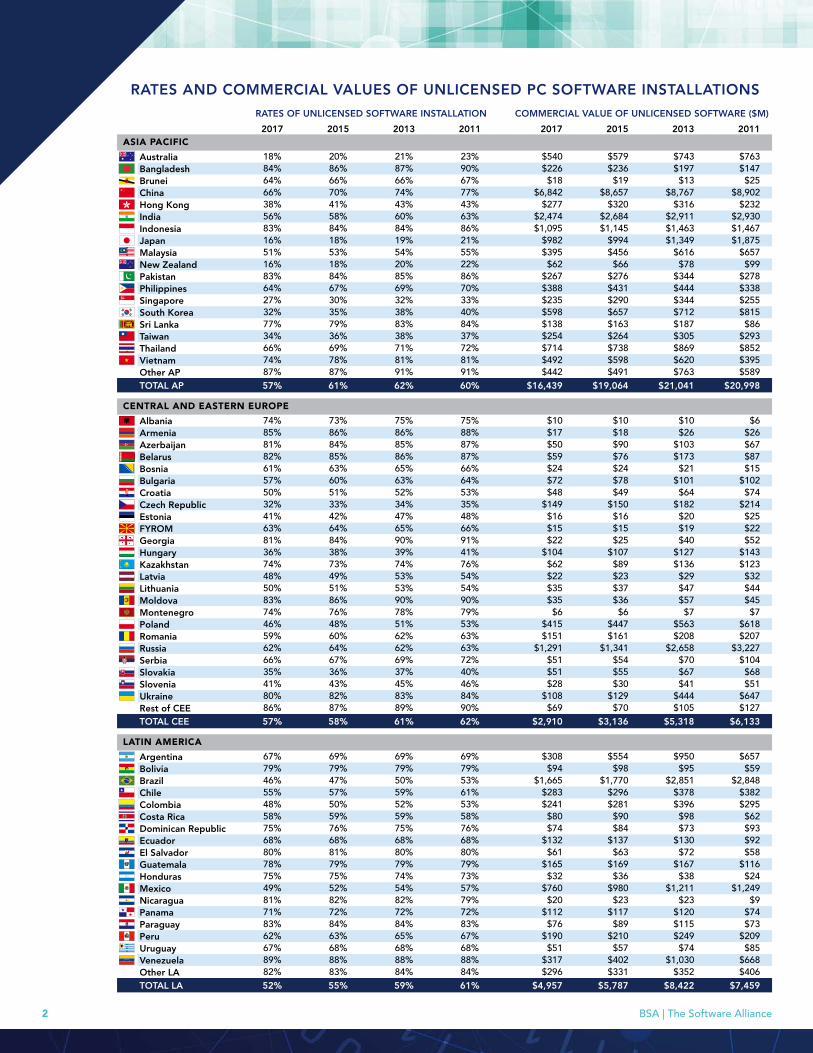
RATES OF UNLICENSED SOFTWARE INSTALLATION COMMERCIAL VALUE OF UNLICENSED SOFTWARE ($M)
2017 2015 2013 2011 2017 2015 2013 2011ASIA PACIFIC
Australia 18% 20% 21% 23% $540 $579 $743 $763 Bangladesh 84% 86% 87% 90% $226 $236 $197 $147 Brunei 64% 66% 66% 67% $18 $19 $13 $25 China 66% 70% 74% 77% $6,842 $8,657 $8,767 $8,902 Hong Kong 38% 41% 43% 43% $277 $320 $316 $232 India 56% 58% 60% 63% $2,474 $2,684 $2,911 $2,930 Indonesia 83% 84% 84% 86% $1,095 $1,145 $1,463 $1,467 Japan 16% 18% 19% 21% $982 $994 $1,349 $1,875 Malaysia 51% 53% 54% 55% $395 $456 $616 $657 New Zealand 16% 18% 20% 22% $62 $66 $78 $99 Pakistan 83% 84% 85% 86% $267 $276 $344 $278 Philippines 64% 67% 69% 70% $388 $431 $444 $338 Singapore 27% 30% 32% 33% $235 $290 $344 $255 South Korea 32% 35% 38% 40% $598 $657 $712 $815 Sri Lanka 77% 79% 83% 84% $138 $163 $187 $86 Taiwan 34% 36% 38% 37% $254 $264 $305 $293 Thailand 66% 69% 71% 72% $714 $738 $869 $852 Vietnam 74% 78% 81% 81% $492 $598 $620 $395 Other AP 87% 87% 91% 91% $442 $491 $763 $589 TOTAL AP 57% 61% 62% 60% $16,439 $19,064 $21,041 $20,998
CENTRAL AND EASTERN EUROPE
Albania 74% 73% 75% 75% $10 $10 $10 $6 Armenia 85% 86% 86% 88% $17 $18 $26 $26 Azerbaijan 81% 84% 85% 87% $50 $90 $103 $67 Belarus 82% 85% 86% 87% $59 $76 $173 $87 Bosnia 61% 63% 65% 66% $24 $24 $21 $15 Bulgaria 57% 60% 63% 64% $72 $78 $101 $102 Croatia 50% 51% 52% 53% $48 $49 $64 $74 Czech Republic 32% 33% 34% 35% $149 $150 $182 $214 Estonia 41% 42% 47% 48% $16 $16 $20 $25 FYROM 63% 64% 65% 66% $15 $15 $19 $22 Georgia 81% 84% 90% 91% $22 $25 $40 $52 Hungary 36% 38% 39% 41% $104 $107 $127 $143 Kazakhstan 74% 73% 74% 76% $62 $89 $136 $123 Latvia 48% 49% 53% 54% $22 $23 $29 $32 Lithuania 50% 51% 53% 54% $35 $37 $47 $44 Moldova 83% 86% 90% 90% $35 $36 $57 $45 Montenegro 74% 76% 78% 79% $6 $6 $7 $7 Poland 46% 48% 51% 53% $415 $447 $563 $618 Romania 59% 60% 62% 63% $151 $161 $208 $207 Russia 62% 64% 62% 63% $1,291 $1,341 $2,658 $3,227 Serbia 66% 67% 69% 72% $51 $54 $70 $104 Slovakia 35% 36% 37% 40% $51 $55 $67 $68 Slovenia 41% 43% 45% 46% $28 $30 $41 $51 Ukraine 80% 82% 83% 84% $108 $129 $444 $647 Rest of CEE 86% 87% 89% 90% $69 $70 $105 $127 TOTAL CEE 57% 58% 61% 62% $2,910 $3,136 $5,318 $6,133
LATIN AMERICA
Argentina 67% 69% 69% 69% $308 $554 $950 $657 Bolivia 79% 79% 79% 79% $94 $98 $95 $59 Brazil 46% 47% 50% 53% $1,665 $1,770 $2,851 $2,848 Chile 55% 57% 59% 61% $283 $296 $378 $382 Colombia 48% 50% 52% 53% $241 $281 $396 $295 Costa Rica 58% 59% 59% 58% $80 $90 $98 $62 Dominican Republic 75% 76% 75% 76% $74 $84 $73 $93 Ecuador 68% 68% 68% 68% $132 $137 $130 $92 El Salvador 80% 81% 80% 80% $61 $63 $72 $58 Guatemala 78% 79% 79% 79% $165 $169 $167 $116 Honduras 75% 75% 74% 73% $32 $36 $38 $24 Mexico 49% 52% 54% 57% $760 $980 $1,211 $1,249 Nicaragua 81% 82% 82% 79% $20 $23 $23 $9 Panama 71% 72% 72% 72% $112 $117 $120 $74 Paraguay 83% 84% 84% 83% $76 $89 $115 $73 Peru 62% 63% 65% 67% $190 $210 $249 $209 Uruguay 67% 68% 68% 68% $51 $57 $74 $85 Venezuela 89% 88% 88% 88% $317 $402 $1,030 $668 Other LA 82% 83% 84% 84% $296 $331 $352 $406 TOTAL LA 52% 55% 59% 61% $4,957 $5,787 $8,422 $7,459
RATES AND COMMERCIAL VALUES OF UNLICENSED PC SOFTWARE INSTALLATIONS
www.bsa.org 3
SOFTWARE MANAGEMENT: SECURITY IMPERATIVE, BUSINESS OPPORTUNITY
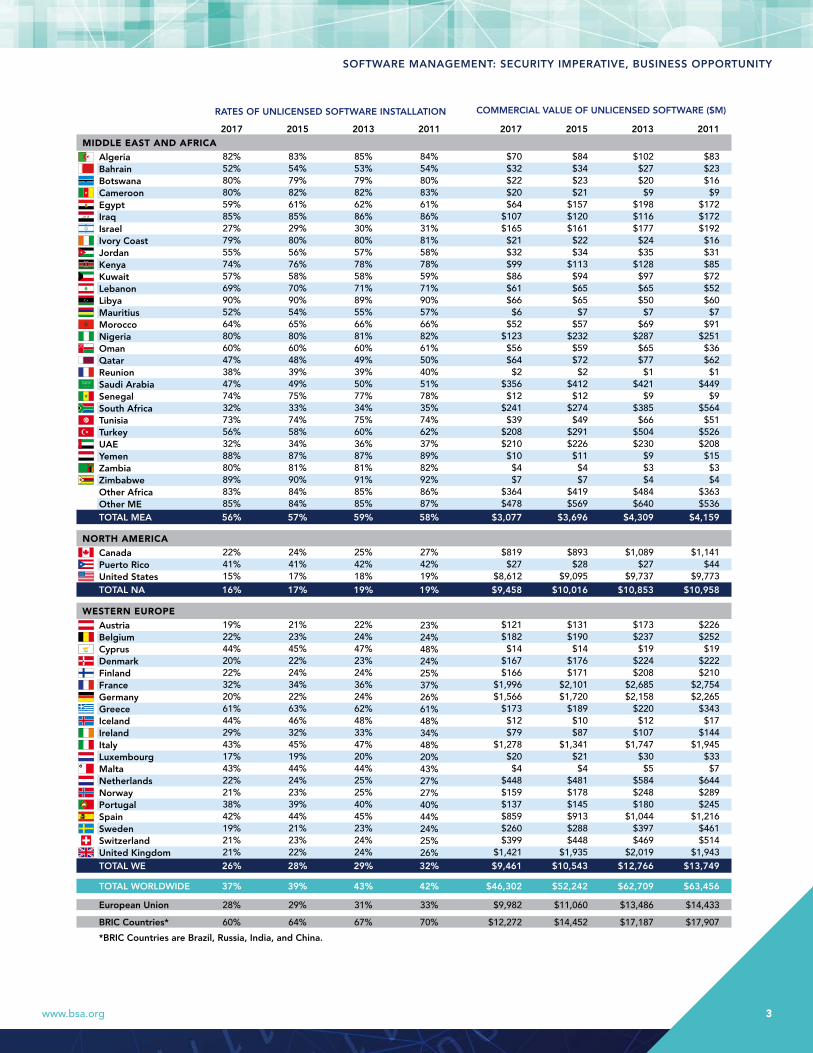
RATES OF UNLICENSED SOFTWARE INSTALLATION COMMERCIAL VALUE OF UNLICENSED SOFTWARE ($M)
2017 2015 2013 2011 2017 2015 2013 2011
MIDDLE EAST AND AFRICA
Algeria 82% 83% 85% 84% $70 $84 $102 $83 Bahrain 52% 54% 53% 54% $32 $34 $27 $23 Botswana 80% 79% 79% 80% $22 $23 $20 $16 Cameroon 80% 82% 82% 83% $20 $21 $9 $9 Egypt 59% 61% 62% 61% $64 $157 $198 $172 Iraq 85% 85% 86% 86% $107 $120 $116 $172 Israel 27% 29% 30% 31% $165 $161 $177 $192 Ivory Coast 79% 80% 80% 81% $21 $22 $24 $16 Jordan 55% 56% 57% 58% $32 $34 $35 $31 Kenya 74% 76% 78% 78% $99 $113 $128 $85 Kuwait 57% 58% 58% 59% $86 $94 $97 $72 Lebanon 69% 70% 71% 71% $61 $65 $65 $52 Libya 90% 90% 89% 90% $66 $65 $50 $60 Mauritius 52% 54% 55% 57% $6 $7 $7 $7 Morocco 64% 65% 66% 66% $52 $57 $69 $91 Nigeria 80% 80% 81% 82% $123 $232 $287 $251 Oman 60% 60% 60% 61% $56 $59 $65 $36 Qatar 47% 48% 49% 50% $64 $72 $77 $62 Reunion 38% 39% 39% 40% $2 $2 $1 $1 Saudi Arabia 47% 49% 50% 51% $356 $412 $421 $449 Senegal 74% 75% 77% 78% $12 $12 $9 $9 South Africa 32% 33% 34% 35% $241 $274 $385 $564 Tunisia 73% 74% 75% 74% $39 $49 $66 $51 Turkey 56% 58% 60% 62% $208 $291 $504 $526 UAE 32% 34% 36% 37% $210 $226 $230 $208 Yemen 88% 87% 87% 89% $10 $11 $9 $15 Zambia 80% 81% 81% 82% $4 $4 $3 $3 Zimbabwe 89% 90% 91% 92% $7 $7 $4 $4 Other Africa 83% 84% 85% 86% $364 $419 $484 $363 Other ME 85% 84% 85% 87% $478 $569 $640 $536 TOTAL MEA 56% 57% 59% 58% $3,077 $3,696 $4,309 $4,159
NORTH AMERICA
Canada 22% 24% 25% 27% $819 $893 $1,089 $1,141 Puerto Rico 41% 41% 42% 42% $27 $28 $27 $44 United States 15% 17% 18% 19% $8,612 $9,095 $9,737 $9,773 TOTAL NA 16% 17% 19% 19% $9,458 $10,016 $10,853 $10,958
WESTERN EUROPE
Austria 19% 21% 22% 23% $121 $131 $173 $226 Belgium 22% 23% 24% 24% $182 $190 $237 $252 Cyprus 44% 45% 47% 48% $14 $14 $19 $19 Denmark 20% 22% 23% 24% $167 $176 $224 $222 Finland 22% 24% 24% 25% $166 $171 $208 $210 France 32% 34% 36% 37% $1,996 $2,101 $2,685 $2,754 Germany 20% 22% 24% 26% $1,566 $1,720 $2,158 $2,265 Greece 61% 63% 62% 61% $173 $189 $220 $343 Iceland 44% 46% 48% 48% $12 $10 $12 $17 Ireland 29% 32% 33% 34% $79 $87 $107 $144 Italy 43% 45% 47% 48% $1,278 $1,341 $1,747 $1,945 Luxembourg 17% 19% 20% 20% $20 $21 $30 $33 Malta 43% 44% 44% 43% $4 $4 $5 $7 Netherlands 22% 24% 25% 27% $448 $481 $584 $644 Norway 21% 23% 25% 27% $159 $178 $248 $289 Portugal 38% 39% 40% 40% $137 $145 $180 $245 Spain 42% 44% 45% 44% $859 $913 $1,044 $1,216 Sweden 19% 21% 23% 24% $260 $288 $397 $461 Switzerland 21% 23% 24% 25% $399 $448 $469 $514 United Kingdom 21% 22% 24% 26% $1,421 $1,935 $2,019 $1,943 TOTAL WE 26% 28% 29% 32% $9,461 $10,543 $12,766 $13,749
TOTAL WORLDWIDE 37% 39% 43% 42% $46,302 $52,242 $62,709 $63,456
European Union 28% 29% 31% 33% $9,982 $11,060 $13,486 $14,433
BRIC Countries* 60% 64% 67% 70% $12,272 $14,452 $17,187 $17,907
*BRIC Countries are Brazil, Russia, India, and China.
4 BSA | The Software Alliance
BSA Worldwide Headquarters
20 F Street, NWSuite 800Washington, DC 20001
+1.202.872.5500
@BSAnews
@BSATheSoftwareAlliance
BSA Asia-Pacific
300 Beach Road#25-08 The ConcourseSingapore 199555
+65.6292.2072
@BSAnewsAPAC
BSA Europe, Middle East & Africa
65 Petty FranceGround FloorLondon, SW1H 9EUUnited Kingdom
+44.207.340.6080
@BSAnewsEU
www.bsa.org
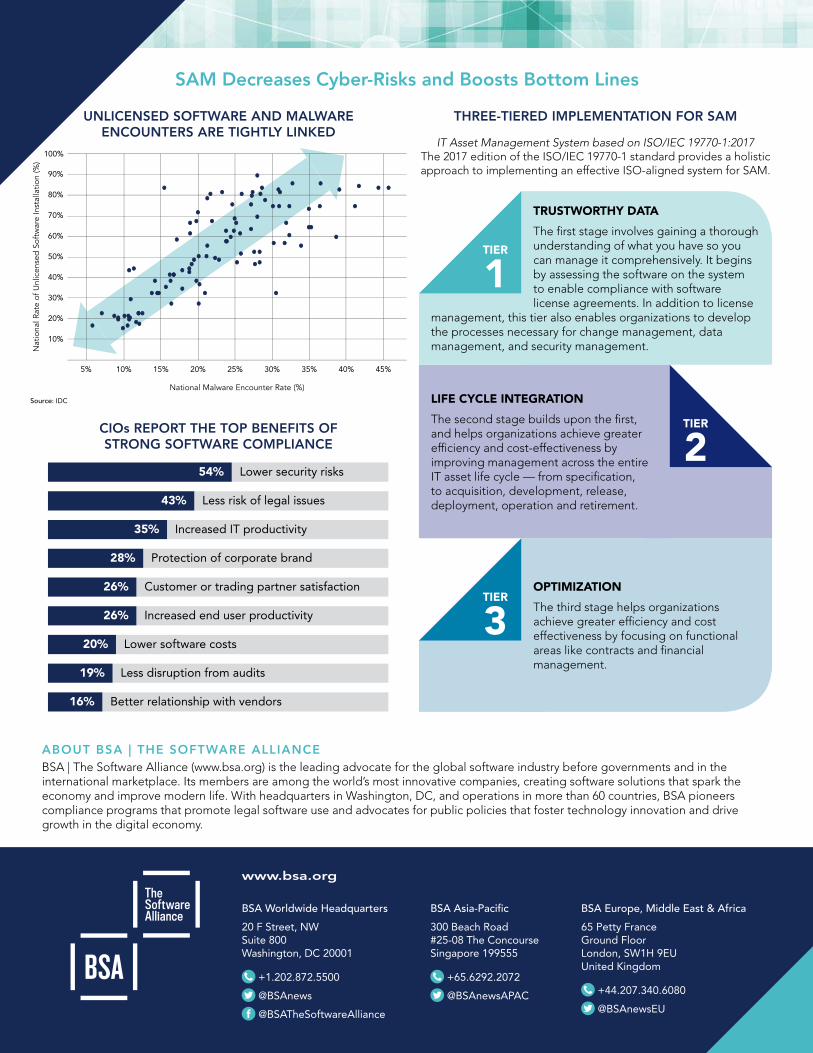
THREE-TIERED IMPLEMENTATION FOR SAM
IT Asset Management System based on ISO/IEC 19770-1:2017 The 2017 edition of the ISO/IEC 19770-1 standard provides a holistic approach to implementing an effective ISO-aligned system for SAM.
CIOs REPORT THE TOP BENEFITS OF STRONG SOFTWARE COMPLIANCE
ABOUT BSA | THE SOFTWARE ALLIANCEBSA | The Software Alliance (www.bsa.org) is the leading advocate for the global software industry before governments and in the international marketplace. Its members are among the world’s most innovative companies, creating software solutions that spark the economy and improve modern life. With headquarters in Washington, DC, and operations in more than 60 countries, BSA pioneers compliance programs that promote legal software use and advocates for public policies that foster technology innovation and drive growth in the digital economy.
0 20 40 60 80 100
54% Lower security risks
Less risk of legal issues43%
Increased IT productivity35%
Protection of corporate brand28%
Customer or trading partner satisfaction 26%
Increased end user productivity26%
Lower software costs20%
Less disruption from audits19%
Better relationship with vendors16%
TRUSTWORTHY DATA
The first stage involves gaining a thorough understanding of what you have so you can manage it comprehensively. It begins by assessing the software on the system to enable compliance with software license agreements. In addition to license
management, this tier also enables organizations to develop the processes necessary for change management, data management, and security management.
OPTIMIZATION
The third stage helps organizations achieve greater efficiency and cost effectiveness by focusing on functional areas like contracts and financial management.
LIFE CYCLE INTEGRATION
The second stage builds upon the first, and helps organizations achieve greater efficiency and cost-effectiveness by improving management across the entire IT asset life cycle — from specification, to acquisition, development, release, deployment, operation and retirement.
TIER
1
TIER
2
TIER
3
UNLICENSED SOFTWARE AND MALWARE ENCOUNTERS ARE TIGHTLY LINKED
10%
20%
30%
40%
50%
60%
70%
80%
90%
100%
5% 10% 15% 20% 25% 30% 35% 40% 45%
Nat
iona
l Rat
e of
Unl
icen
sed
Sof
twar
e In
stal
latio
n (%
)
National Malware Encounter Rate (%)
Source: IDC
SAM Decreases Cyber-Risks and Boosts Bottom Lines
Top Related