


Languages
Pages
Legal


1
Slides developed by Sondra Stein, Katie Landeros,& Tim WerwathAmerican Institutes for Research
Key Findings from the Program for the International Assessment of Adult
Competencies (PIAAC), 2012David J. Rosen, Ed.D. , Newsome Associates
April 4, 2014 MCAE Network 2014

What is PIAAC? International large-scale assessment administered in 2011-12 in 23 countries 16- to 65-year-olds, non-institutionalized, residing in the country, irrespective of
nationality, citizenship, or language status Laptop computer or paper-and-pencil:
In the U.S., 80% took the computer tests and 15% took the paper-and-pencil tests.
Assessment subjects: Literacy, Numeracy, and Problem Solving in Technology-Rich Environments
Conducted in English in the U.S.: Background survey in English or Spanish. About 4% could not complete the
questionnaire because of language difficulties or learning or mental disabilities, and 1% could not complete it for other reasons.
2

3
2012 2015AustraliaAustriaBelgiumCanadaCyprusCzech RepublicDenmarkEstoniaFinlandFranceGermanyIreland
ItalyJapan Korea, Rep ofNetherlandsNorwayPolandSlovak RepublicSpainSwedenUnited Kingdom United States
ChileGreece IndonesiaIsraelLithuaniaNew ZealandSingaporeSloveniaTurkey
3
Participating Countries

How did the U.S. do on PIAAC?https://www.youtube.com/watch?v=UgRwgFD-Ynk
4

5
Below international average in all subject areas Ranked better in literacy than in numeracy or problem
solving in technology-rich environments Higher percentage at low proficiency levels than
international average Percentages of top performers similar to or slightly lower
than international average, depending on the subject
General patterns of U.S. results

Literacy:“understanding, evaluating, using and engaging with written text to participate in society, to achieve one’s goals and to develop one’s knowledge and potential.”
Numeracy:“the ability to access, use, interpret, and communicate mathematical information and ideas, to engage in and manage mathematical demands of a range of situations in adult life.”
6
Definitions:

Problem solving in technology rich environments (PS-TRE):“using digital technology, communication tools, and networks to acquire and evaluate information, communicate with others, and perform practical tasks.”
Reading components: “measuring literacy skills of adults at the lower end of the literacy spectrum, focusing on reading components that are comparable across the range of languages (reading vocabulary, sentence comprehension, and basic passage comprehension and fluency).”
7
Definitions

8
Average Scores: Reported on a scale of 0-500 for all domains.
Proficiency Levels: Reported as the percentages of adults scoring at six performance levels in literacy and
numeracy and at four performance levels in problem solving in technology-rich environments.
What PIAAC Reports

9
Lower than in 12 countries:Japan, Finland, Netherlands, Australia, Sweden, Norway, Estonia, Flanders-Belgium, Czech Republic, Slovak Republic, Canada, Republic of Korea
Not significantly different than in 5 countries:England and Northern Ireland- U.K., Denmark, Germany, Austria, Cyprus
Higher than in 5 countries:Poland, Ireland, France, Spain, Italy
U.S. average literacy score (270) lower than the international average (273)

10
Locate single piece of information in familiar texts.
Read relatively short digital, print or mixed texts to locate single text.
Make matches between text and information that may require low level para-phrasing and drawing low-level inferences.
Identify, interpret, or evaluate one or more pieces of information and often require varying levels of inference.
Perform multiple-step operations to integrate, interpret, or synthesize information from complex texts, and may require complex inferences.
Integrate information across multiple, dense texts; construct syntheses, ideas or points of view; or evaluate evidence based arguments.
Below Level 1
Level 1
Level 2
Level 3Level 4
Level 5Literacy proficiency levels

11
Distribution of literacy skills

*p < .05. U.S. average score is significantly different from PIAAC international average.
Graduate or professional degreeBachelor's degree
Associate's degreeHigh school credential
Below high school
Graduate or professional degreeBachelor's degree
Associate's degreeHigh school credential
Below high school
PIAA
C in
tern
ation
al a
vera
ge
0 50 100 150 200 250 300 350
310298
283262*
230*
307298
285271
246
Least educated adults below the international average in literacy

Lower than in 18 countries:Japan, Finland, Flanders-Belgium, Netherlands, Sweden, Norway, Denmark, Slovak Republic, Czech Republic, Austria, Estonia, Germany, Australia, Canada, Cyprus, Republic of Korea, England and Northern Ireland- U.K., Poland
Not significantly different than in 2 countries:Ireland, France
Higher than in 2 countries:Italy, Spain
13
U.S. average numeracy score (253) lower than the international average (269)

14
Perform basic tasks: counting, arithmetic operations with whole numbers.
Perform one-step tasks: count; sort; arithmetic operations; understanding simple percent (ex. 50%).
Perform 2 or more calculations, simple measurement; spatial representation; estimation; and interpret simple tables, graphs.
Understand & work with mathematical patterns, proportions, basic statistics expressed in verbal or numerical form.
Perform analysis, complex reasoning, statistics and chance; spatial relationships; and communicat-ing well-reasoned explanations for answers.
Understand complex abstract mathema-tical and statistical ideas, embedded in complex texts, draw inferences; arguments or models; justify, reflect on solutions or choices.
Below Level 1
Level 1
Level 2
Level 3
Level 4
Level 5Numeracy proficiency levels

15
Distribution of numeracy skills

Lower than in 14 countries:Japan, Finland, Australia, Sweden, Norway, Netherlands, Austria, Denmark, Czech Republic, Republic of Korea,
Germany, Canada, Slovak Republic,
Flanders-Belgium
Not significantly different than in 4 countries:England and Northern Ireland- U.K.,
Estonia, Ireland, Poland
16
U.S. average problem solving in technology-rich environments score (277) lower than the international average (283)

17
Tasks are well-defined involving use of only one function within a generic interface.
Tasks require little or no navigation, and only a few steps to access information for solving the problem. There are few monitoring demands.
Tasks require some navigation across pages and applications for solving the problem. Evaluating the relevance, some integration and inferential reasoning may be needed.
Task may involve multiple steps and operators, navigation across pages and applications. There are typically high monitoring demands, and evaluation of relevance and reliability of information.
Below Level 1
Level 1
Level 2
Level 3
Problem solving in technology-rich environments (digital problem solving) proficiency levels

18
Distribution of digital problem solving skills in the U.S. and other countries

Low “basic” (Below Level 1 and Level 1) skills are more common in U.S. than on average in participating countries• Nearly 1 in 3 have weak numeracy skills in the U.S. compared
to the international average of 1 in 5.
• About 1 in 6 adults in the U.S. have low literacy skills compared to 1 in 20 in Japan.
19
US: International Average:
Time for the U.S. to Reskill? What the Survey of Adult Skills Says (an OECD report)

Approximately 36 million U.S. adults have low skills.
Roughly the same population of Minnesota, New York, and Michigan states combined.
20
MN NY
MI+ +
Time for the U.S. to Reskill? What the Survey of Adult Skills Says (an OECD report) continued

21
Adults in the U.S. at level 2 and below

22
Grad or prof. degree (10%)
Bachelor’s degree (16%)
Associate’s degree (9%)
High school credential
(50%)
Below high school (15%)
0
5
10
15
20
25
30
35
40
45
Below Level 1 Level 1 Level 2
Pe
rce
nta
ge
of
po
pu
lati
on
Who are the low-skilled adults in the U.S. in literacy?
Educational attainment

23
16-24 (18%) 25-34 (20%) 35-44 (20%) 45-54 (22%) 55-65 (19%)0
5
10
15
20
25
30
35
40
Below Level 1 Level 1 Level 2
Pe
rce
nta
ge
of
po
pu
lati
on
Who are the low-skilled adults in the U.S. in literacy?
Age

24
English as first language (85%)
Other as first language (15%)0
5
10
15
20
25
30
35
40
Below Level 1 Level 1 Level 2
Pe
rce
nt
of
su
bp
op
ula
tio
n
Who are the low-skilled adults in the U.S. in literacy?
First language

25
Born in U.S. (85%) Not Born in U.S. (15%)0
5
10
15
20
25
30
35
40
Below Level 1 Level 1 Level 2
Pe
rce
nta
ge
of
su
bp
op
ula
tio
n
Who are the low-skilled adults in the U.S. in literacy?
Immigration status

26
White, non-Hispanic (65%)
Black, non-Hispanic (13%)
Hispanic (14%) Other (8%)0
5
10
15
20
25
30
35
40
45
Below Level 1 Level 1 Level 2
Pe
rce
nta
ge
of
su
bp
op
ula
tio
nWho are the low-skilled adults in the U.S. in literacy?
Race/ethnicity

27
Men (49%) Women (51%)0
5
10
15
20
25
30
35
40
Below Level 1 Level 1 Level 2
Pe
rce
nta
ge
of
po
pu
lati
on
Who are the low-skilled adults in the U.S. in literacy?
Gender

28
U.S. Pop. 16-65 = approx. 200 million
Percent of subpopulation
Percent of population
Below Level
1 Level 1 Level 2All U.S. 16-65 100 4 14 33 Employment status Employed full-time 52 4 12 31 Employed part-time 12 4 15 36 Unemployed 8 5 24 41 In school 10 2 10 35 Retired 4 3 16 36 Permanently disabled 5 14 29 40 Looking after family 6 3 14 38 Other 3 5 12 35
Who are the low-skilled adults in the U.S. in literacy?
Employment status

29
Const
ruct
ion (7
%)
Admini
stra
tive
(6%
)
Trans
porta
tion
(4%
)
Accom
mod
ation
and
food
ser
vice
(7%
)
Retail
trad
e (1
2%)
Man
ufac
turin
g (1
1%)
Health
(14%
)
Oth
er (3
%)
Arts a
nd e
nter
tainm
ent (
2%)
Public
adm
inist
ratio
n (7
%)
Financ
ial s
ervic
es (5
%)
Educa
tion
(9%
)
Info
rmat
ion a
nd c
omm
unica
tion
(4%
)
Profe
ssion
al an
d sc
ientifi
c (5
%)
0
5
10
15
20
25
30
35
40
45
50
Below Level 1 Level 1 Level 2
Pe
rce
nta
ge
of
su
bp
op
ula
tio
n
Who are the low-skilled adults in the U.S. in literacy?
Industry

30
Elem
enta
ry o
ccup
atio
ns (8
%)
Mac
hine
ope
rato
rs (6
%)
Crafts
and
trad
es w
orke
rs (9
%)
Servic
e wor
kers
/sale
s (21
%)
Clerk
s (8%
)
Techn
ician
s and
ass
ocia
tes (
16%
)
Legi
slato
rs, o
fficia
ls, a
nd m
anag
ers (
10%
)
Profe
ssio
nals
(21%
)05
101520253035404550
Below Level 1 Level 1 Level 2
Pe
rce
nt
of
su
bp
op
ula
tio
nWho are the low-skilled adults in the U.S. in literacy?
Occupation

31
Comparing Gaps in Performance

32
U.S. gaps in literacy scores larger than international average by parental education and nativity status

33
In literacy, U.S. gaps larger by educational attainment and skill level of job, but similar to international average by income and employment status

34
U.S. gaps in literacy scores similar to international average by gender, smaller by age, and larger by health status

35
U.S. gaps in numeracy scores larger than international average by parental education, not different by nativity status

36
In numeracy, U.S. gaps larger by educational attainment, income, and skill level of job, but similar to international average by employment status

37
In numeracy, U.S. gap similar to international average by gender, smaller by age, and larger by health status

Literacy skills in younger and older generations

Do a better job of assuring every American has a strong foundation of basic skills.
Do a better job of providing skills upgrading for immigrants to America.
Do a better job of providing skills upgrading to working adults at every level so they can keep pace with change.
Understand that improving the skills of our population is everybody’s business: we can educate our way to a better economy.
What does the data suggest about what we need to do differently?

What can we learn from key features of systems in countries that are high
performers?

Assure high quality initial education and high quality lifelong learningHigh performers: Invest in high quality early childhood education and initial
schooling, particularly for children from disadvantaged backgrounds.
Provide financial support targeted at disadvantaged. Provide opportunities and incentives for continued proficiency
development, both in and outside the workplace.

Make learning everybody’s businessHigh Performers: Recognize that individuals with poor skills are unlikely to engage
in learning on their own and tend to receive less employer-sponsored training.
Governments join together with employers, workers and parents to make effective and equitable arrangements as to who does what, when, and how.

Build effective links between learning and workHigh performers: Emphasize work based learning to allow people to develop hard
skills on modern equipment and soft skills through real world experience.
Employers engage in education and training with some assistance for smes.
Design learning to benefit both workplace and workers’ broader employability.

Identify those who can benefit most from learning Disadvantaged adults need to be encouraged to improve
learning Foreign-language migrants Older adults
Demonstrate to them how adults can benefit from learning, both economically and socially.
44

Improve Transparency Make sure information about learning opportunities, financial
assistance, etc. is easy to find and easy to use, even for those with low skills.
Provide good online access and good personal guidance counseling.
Recognize and certify skills proficiency.
45

Allow Workers to Adapt Learning
to their Lives Design content and delivery systems to assure
maximum flexibility (part time, modular, flexible hours, convenient)
Engage distance learning and open education resources

How can we educate our way to a better economy and stronger democracy in the U.S.?
Use PIAAC data to advocate for more investment in adult lifelong learning.
Use PIAAC data to strengthen program approaches to building lifelong career pathways.
Use PIAAC data to create and renew local, state, and national approaches to lifelong learning where learning is everybody’s business.
Use PIAAC data and tools to document successes.

48
The PIAAC Web Portal (online tables of detailed PIAAC data) is now live on the NCES PIAAC website!
OECD PIAAC Data Explorer available at PIAACGateway.com
Coming soon:• U.S. PIAAC Data Explorer• U.S. PIAAC public-use data file• U.S. PIAAC restricted-use file• U.S. PIAAC Technical Report• Education & Skills Online
PIAAC Data Tools

Education & Skills Online Developed through a joint initiative of the OECD and the
European Union An assessment tool designed to provide individual level results
linked to PIAAC Measures both cognitive and non-cognitive skills Can be downloaded on demand over the internet and includes
technical support Available in multiple languages/versions In the US it is available both in English and Spanish
49

Education & Skills Online Components Background Questionnaire Cognitive Items:
Literacy Numeracy Problem-solving in Technology rich environment (optional) Reading Components (optional)
Optional Non-Cognitive Module Reporting Scores:
Proficiency levels Descriptive reports of strengths and weaknesses in the skill areas
assessed Summary information for each of the non-cognitive areas Comparative information for both the cognitive and non-cognitive areas
50

Uses and Benefits of Education & Skills Online
Appropriate for use in both educational and workplace settings
Can be used to evaluate classes, programs or any group of respondents
Organizations will have access to their database for further analyses
Individuals and organizations have flexibility to determine which skills to assess
Link to trial version on PIAAC Gateway www.piaacgateway.com
51

52
For more information
http://nces.ed.gov/surveys/piaac/
http://piaacgateway.com

53
Election results
Stimulus consists of a short report of the results of a union election containing several brief paragraphs and a simple table identifying the three candidates in the election and the number of votes they received. The test-taker is asked to identify which candidate received the fewest
votes. He or she needs to compare the number of votes that the three
candidates received and identify the name of the candidate who received the fewest votes.
The word “votes” appears in both the question and in the table and nowhere else in the text.
Below level 1 literacy item

54
Generic medicineStimulus is a short newspaper article entitled “Generic medicines: Not for the Swiss.” It has two paragraphs and a table in the middle displaying the market share of generic medicines in 14 European countries and the U.S. The test-taker is asked to determine the number of countries with a
market share greater than 10%. The percentages are sorted in descending order to facilitate the search. The phrase “drug sales”, however, does not appear in the text;
therefore, the test-taker needs to understand that “market share” is a synonym of “drug sales” in order to answer the question.
Level 1 literacy item

55
Lakeside Fun RunStimulus is a simulated website containing information about an annual fun run/walk. The test-taker is directed to a page with several links, including “Contact Us” and
“FAQs”. Then asked to identify the link providing the phone number of the organizers of
the event. In order to answer this item correctly, the test-taker needs to click on the link
“Contact Us”. This requires navigating through a digital text and some understanding of web conventions.
While this task might be fairly simple for test takers familiar with web-based ‑texts, some respondents less familiar with web-based texts would need to make some inferences to identify the correct link.
Level 2 literacy item

Adults with weaker literacy skills are less likely to:• Feel trust in others• Believe that people like themselves have a say in what the
government does• Engage in the volunteer activities that sustain a rich civil society
On average across countries, adults who score at or below Level 1 on the literacy scale have over two times the odds of reporting “fair” to “poor” health than those who score at Level 4 or 5
56
Social outcomes: health, civic participation, trust in government or others

57
Who are the low skilled adults in the U.S. in literacy?Employment
status
U.S. Pop. 16-65 = approx. 200 million Percent of subpopulation
Percent of populatio
nBelow
Level 1 Level 1 Level 2All U.S. 16-65 100 4 14 33 Employment status Employed full-time 52 4 12 31 Employed part-time 12 4 15 36 Unemployed 8 5 24 41 In school 10 2 10 35 Retired 4 3 16 36 Permanently disabled 5 14 29 40 Looking after family 6 3 14 38 Other 3 5 12 35Estimates for labor force categories not shown do not meet reporting standards.

58
Who are the low skilled adults in the U.S. in literacy?Gender and age
Percent of subpopulation
Percent of populatio
nBelow
Level 1 Level 1 Level 2All U.S. 16-65 100 4 14 33 Gender Men 49 4 14 31 Women 51 4 13 34Age 16-24 18 2 12 37 25-34 20 4 12 30 35-44 20 3 14 31 45-54 22 6 14 32 55-65 19 5 16 34

59
Who are the low skilled adults in the U.S. in literacy?Educational attainment
Percent of subpopulation
Percent of
population
Below Level 1 Level 1 Level 2
All U.S. 16-65 100 4 14 33 Educational attainment Grad/professional degree 10 # 2 15 Bachelor’s degree 16 1 4 22 Associate’s degree 9 1 6 34 High school credential 50 3 17 41 Below high school 15 15 31 37

60
Who are the low-skilled adults in the U.S. in literacy?Occupation
Percent of subpopulation
Percent of
population Below Level 1 Level 1 Level 2All U.S. 16-65 100 4 14 33 Occupation classification
Legislators, officials, and managers 10 1 6 22
Professionals 21 * 3 20 Technicians and associates 16 2 8 32 Clerks 8 1 11 34 Service workers/sales 21 5 17 37 Crafts and trades workers 9 4 19 42 Machine operators 6 9 20 45 Elementary occupations 8 12 26 37 Estimates for occupations not shown do not meet reporting standards.

61
Who are the low-skilled adults in the U.S. in literacy?Industry
Percent of subpopulation
Percent of
population Below Level 1 Level 1 Level 2All U.S. 16-65 100 4 14 33Industry classification
Manufacturing 11 4 13 35
Construction 7 5 22 41
Retail trade 12 4 14 39
Transportation 4 7 22 35
Accommodation and food service 7 9 21 33
Information and communication 4 * 3 19
Financial services 5 1 9 22
Professional and scientific 5 1 2 19
Administrative 6 8 17 43
Public administration 7 1 8 25
Education 9 1 4 23
Health 14 4 12 34
Arts and entertainment 2 2 12 28
Other 3 3 9 34Estimates for industries not shown do not meet reporting standards.

62
Who are the low-skilled adults in the U.S. in literacy?Language, immigration status
Percent of subpopulation
Percent of
populationBelow Level
1 Level 1 Level 2
All U.S. 16-65 100 4 14 33 Language
English as first language 85 2 12 34
Other as first language 15 15 24 33
Immigration Status Born in U.S. 85 2 12 34
Not born in U.S. 15 15 25 31

63
Who are the low-skilled adults in the U.S. in literacy?Race/ethnicity
Percent of subpopulation
Percent of
populationBelow Level
1 Level 1 Level 2
All U.S. 16-65 100 4 14 33 Race/ethnicity
White, non-Hispanic 65 1 8 32
Black, non-Hispanic 13 6 28 41
Hispanic 14 16 26 38 Other 8 2 13 39

64
Emplo
yed fu
ll-tim
e (52%
)
Emplo
yed p
art-tim
e (12%
)
Unemplo
yed (8
%)
In s
chool (
10%)
Retired (4
%)
Permanently
disa
bled (5
%)
Looking a
fter f
amily
(6%
)
Oth
er (3%
)0
5
10
15
20
25
30
35
40
45
Below Level 1 Level 1 Level 2
Pe
rce
nta
ge
of
po
pu
lati
on
Who are the low-skilled adults in the U.S. in literacy?
Employment status
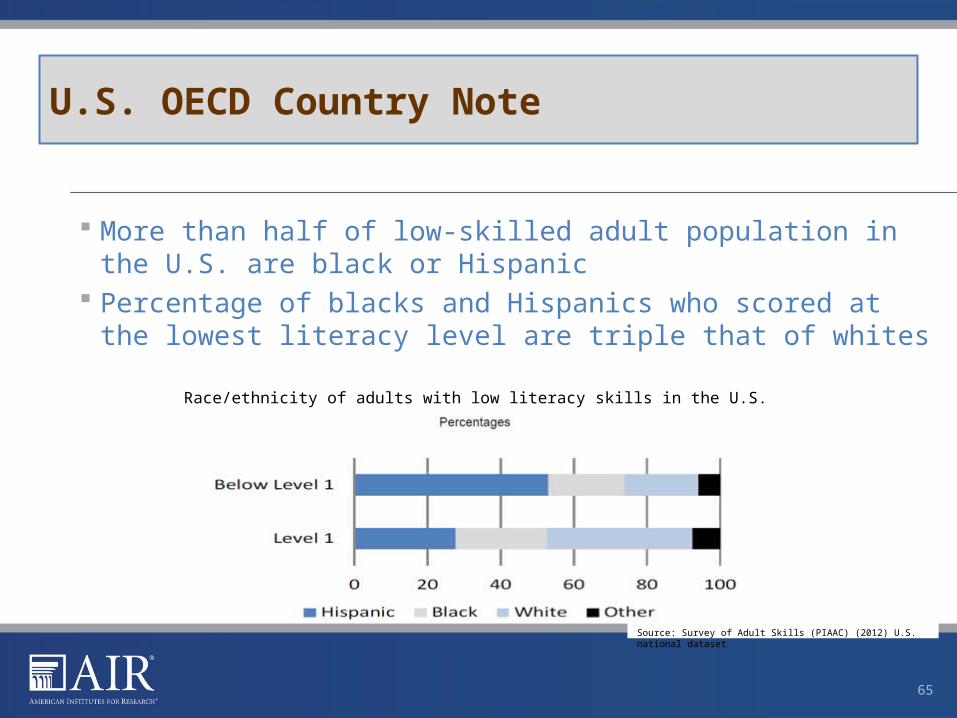
More than half of low-skilled adult population in the U.S. are black or Hispanic
Percentage of blacks and Hispanics who scored at the lowest literacy level are triple that of whites
65
Source: Survey of Adult Skills (PIAAC) (2012) U.S. national dataset
Race/ethnicity of adults with low literacy skills in the U.S.
U.S. OECD Country Note

NOTE: The following slides were created by David J. Rosen, not by AIR
66

http://bit.ly/1jY26ZD http://static.squarespace.com/static/51bb74b8e4b0139570ddf020/t/52ebc28ce4b0e18798dfdd98/1391182476687/AIR_PIAAC_Infographic_1.pdf
How would you use these with adult learners, colleagues, members of the community employers, policy makers?
AIR PIAAC Infographics
67

Economic competitivenessDemocracyCost of poor health to societyDeeper inequities and further polarization of
haves and have-nots
What are the implications of these results for our society?
68

Members of your communityEmployersColleaguesLearners – actual or potential
1.What is/could be the significance of these results for:
69

With teachers? Why or why not?With adult learners? Why or why not?
2. Would you consider using the online survey?
70

For example, Problem Solving in Technology-Rich Environments?
How are you teaching this now?
3. What implications do the data have for what you teach?
71

4. How could you/your program use the data for advocacy?
72

What is the most important takeaway for you?
What are your next steps?• Take the online assessment?• Presemt some of the slides to your colleagues?• Raise awareness of PIAAC results in your
community?• Other?
Evaluation
73
Top Related