


Languages
Pages
Legal

1
Sleep and pathological wakefulness at time of liberation
from mechanical ventilation
Martin Dres1,2, Magdy Younes3,4, Nuttapol Rittayamai1,5, Tetyana Kendzerska6, Irene Telias1,
Domenico Luca Grieco1, Tai Pham1, Detajin Junhasavasdikul1, Edmond Chau1, Sangeeta
Mehta8,11, M. Elizabeth Wilcox9,11, Richard Leung7, Xavier Drouot10, Laurent Brochard1,11
1Keenan Research Centre, Li Ka Shing Knowledge Institute, St. Michael's Hospital, Toronto, Canada 2AP-HP, Groupe Hospitalier Pitié-Salpêtrière Charles Foix, Service de Pneumologie, Médecine intensive – Réanimation (Département "R3S"), F-75013, Paris, France 3YRT Ltd, Winnipeg, Manitoba, Canada 4Sleep Disorders Centre, Winnipeg, Manitoba, Canada 5Division of Respiratory Diseases and Tuberculosis, Department of Medicine, Faculty of Medicine Siriraj Hospital, Mahidol University, Bangkok, Thailand 6Division of Respirology, the Ottawa Hospital Research Institute, Ottawa, Canada
7Respirology and Sleep laboratory, St Michael’s Hospital, Toronto 8Intensive Care Unit, Mount Sinai Hospital, Toronto, Canada 9Department of Medicine (Critical Care), Toronto Western Hospital, Toronto 10CHU de Poitiers, Neurophysiologie clinique et Explorations fonctionnelles, Poitiers, France 11Interdepartmental Division of Critical Care Medicine, University of Toronto, Canada Address for correspondence Laurent Brochard Medical and Surgical Intensive Care Unit St Michael’s Hospital 209 Victoria Street, 4th Floor, Room 4-079, Toronto, ON M5B 1T8 Toronto, Canada E-mail: [email protected] Phone: +1 416 864 5686
America
n Jou
rnal o
f Res
pirato
ry an
d Criti
cal C
are M
edici
ne
Copyri
ght ©
2019
Ameri
can T
horac
ic Soc
iety
2
Authors’ contributions:
MD, NR, RL and LB designed the study. MD coordinated the study. MD, IT, DLG, TP, EC, SM,
MEW, DJ and LB were responsible for patient screening, enrolment and follow-up. MD, MY,
XD and LB analysed the data. XD, MY and TK scored PSG. MD, MY and LB wrote the manuscript.
All authors had full access to all of the study data, contributed to drafting the manuscript or
critically revised it for important intellectual content, approved the final version of the
manuscript, and took responsibility for the integrity of the data and the accuracy of the data
analysis.
Funding:
MD was supported by The French Intensive Care Society (SRLF bourse de mobilité 2015); The
2015 Short Term Fellowship program of the European Respiratory Society; The 2015 Bernhard
Dräger Award for advanced treatment of ARF of the European Society of Intensive Care
Medicine; The Assistance Publique Hôpitaux de Paris; The Fondation pour la Recherche
Médicale (FDM 20150734498) and by MitacsGlobalink Sorbonne Universités. LB holds the
Keenan Chair in Critical Care and Acute Respiratory Failure.
Running head: Pathological wakefulness and separation from mechanical ventilation
Descriptor number: 4.13 Ventilation: Non-Invasive/Long-Term/Weaning.
Word count: 4042
America
n Jou
rnal o
f Res
pirato
ry an
d Criti
cal C
are M
edici
ne
Copyri
ght ©
2019
Ameri
can T
horac
ic Soc
iety
3
This article has an online data supplement, which is accessible from this issue's online table
of contents.
Conflict of interest: Martin Dres received personal fees from Pulsion Medical System and
Lungpacer. Laurent Brochard’s laboratory has research contracts with Covidien (PAV), Air
Liquide (CPR), Philips (equipment for sleep), Fisher Paykel (high flow therapy). Magdy Younes
is the inventor of the ORP technology and receives royalties and consultation fees from
Cerebra Health, the exclusive licensee of the technology. Nuttapol Rittayamai received a grant
from his home institution in Thailand. The other authors have no conflict of interest relevant
to this study.
At a glance commentary
Scientific Knowledge on the Subject:
Critically ill patients can develop EEG abnormalities in the intensive care unit. The impact of
these abnormalities at the time of liberation from mechanical ventilation is poorly established.
We conducted standard polysomnography and calculated the odds ratio product (ORP), which
is a continuous index evaluating sleep depth, 15 hours before a spontaneous breathing trial
(SBT) in patients deemed ready to attempt liberation from mechanical ventilation.
What this Study Adds to the Field:
Abnormal patterns of sleep and wakefulness were highly prevalent and sleep scoring by
conventional criteria did not differ between patients with successful and failed SBT. By
contrast, the level of wakefulness, as assessed by the ORP, was significantly higher in
patients with successful SBT. Poor correlation between sleep depth in right vs. left
hemispheres predicted SBT failure.
America
n Jou
rnal o
f Res
pirato
ry an
d Criti
cal C
are M
edici
ne
Copyri
ght ©
2019
Ameri
can T
horac
ic Soc
iety
4
Abstract
Background
Abnormal patterns of sleep and wakefulness exist in mechanically ventilated patients. This
study aimed at investigating polysomnographic indexes as well as a continuous index
evaluating sleep depth, the odds ratio product (ORP), to determine whether abnormal sleep
or wakefulness are associated with the outcome of spontaneous breathing trials (SBT).
Methods
Mechanically ventilated patients at three sites were enrolled if an SBT was planned the
subsequent day. Electroencephalogram was recorded using a portable sleep diagnostic device
15 hours prior to SBT. ORP was calculated from the power of 4 electroencephalogram
frequency bands relative to each other: it ranges from full wakefulness (2.5) to deep sleep (0).
Correlation between right and left hemispheres ORP (R/L) was calculated.
Results
Among 44 patients enrolled, 37 had technically adequate signals: eleven (30%) passed the SBT
and were extubated, 8 (21%) passed the SBT but were not deemed clinically ready for
extubation, and 18 (49%) failed the SBT. Pathological wake or atypical sleep were highly
prevalent but distribution of classical sleep stages was similar between groups. The mean ORP
and the proportion of time that the ORP was >2.2 were higher in extubated patients compared
to the other groups (P<0.05). R/L ORP was significantly lower in patients who failed the SBT
and the area under the ROC curve of R/L ORP to predict failure was 0.91 (95% CI 0.75–0.98).
Conclusion
Patients who pass an SBT and are extubated reach higher levels of wakefulness as indicated
by ORP, suggesting abnormal wakefulness in others. Hemispheric ORP correlation is much
poorer in patients who fail a SBT.
America
n Jou
rnal o
f Res
pirato
ry an
d Criti
cal C
are M
edici
ne
Copyri
ght ©
2019
Ameri
can T
horac
ic Soc
iety
5
Keywords: weaning, delirium, sedation, extubation, mechanical ventilation
America
n Jou
rnal o
f Res
pirato
ry an
d Criti
cal C
are M
edici
ne
Copyri
ght ©
2019
Ameri
can T
horac
ic Soc
iety
6
Introduction
Patients under mechanical ventilation in the intensive care unit (ICU) present a variety
of electroencephalographic (EEG) abnormalities both during wakefulness and sleep (1–3).
Excessive sleep fragmentation, reduced REM sleep and loss of normal circadian rhythm are
consistent across studies, suggesting frequent sleep deprivation (3–5). The EEG during
behaviorally-confirmed wakefulness is often abnormal in ICU patients, with an increase in
slow wave activity (seen during sleep in outpatients) and decrease in activity of higher
frequencies that characterize wakefulness (1,3,6,7). This pattern has been called “pathological
wakefulness”. Patients with pathological wakefulness also often show atypical EEG patterns
during sleep with marked reduction in EEG spindles and K complexes that help differentiate
different stages of non-REM sleep; this is referred to as “atypical sleep” (6). Accordingly, in
many ICU patients, it is difficult to distinguish wakefulness from sleep from the EEG alone
using the standard rules (7). The high prevalence of sleep loss/disruption in these patients,
and the fact that similar EEG changes are observed with experimental sleep deprivation (8,
9),suggest that sleep loss is an important contributing factor to these EEG abnormalities (10).
A recent study found that weaning time is longer in difficult-to-wean patients who
have atypical sleep than in those who display normal sleep patterns (11). Reasons for failing a
spontaneous breathing trial (SBT) are multifactorial (12, 13). Sleep deprivation may be a risk
factor for weaning-failure since it can reduce ventilatory responses to hypoxemia (14) and
decrease respiratory muscle endurance (15), impair immune responses (16, 17),
cardiovascular responses (18), neuroendocrine and metabolic function (19, 20),
neurocognitive function (21), and increase the incidence of delirium (22, 23).
In this study we evaluated the EEG of mechanically ventilated ICU patients during a 15-
hour period preceding a SBT. We hypothesized that patients with atypical Sleep or
America
n Jou
rnal o
f Res
pirato
ry an
d Criti
cal C
are M
edici
ne
Copyri
ght ©
2019
Ameri
can T
horac
ic Soc
iety
7
pathological wakefulness were more likely to fail an SBT. In addition to conventional scoring,
we used a digital scoring system (24, 25) that produces a number of EEG markers (Odds Ratio
Product (ORP) and spindle characteristics) that are relevant to identify pathological
wakefulness and atypical sleep as well as possible cerebral pathology (24). ORP is a continuous
index of sleep depth that ranges from 0 (very deep sleep) to 2.5 (full wakefulness. ORP is
derived from the relation of powers in different EEG frequencies to each other (24). ORP is
highly correlated with arousability (24) and is therefore a valid index of sleep depth. One of its
advantages is that it can distinguish between different levels of wakefulness since the awake
range extends from 2.5 (full wakefulness) to ≈1.8 (epochs still scored wake but contain some
sleep features). This would make it particularly useful for identifying Pathological Wakefulness
in which wake EEG contains some sleep features. In such cases, ORP during wakefulness would
be closer to 1.8 than to 2.5.
The rationale for this study is that over a prolonged period of observation (15 hours)
an individual who is neither sleep-deprived nor pathologically obtunded should have both
sleep periods and ORP levels close to 2.5 present over the period of recording.
America
n Jou
rnal o
f Res
pirato
ry an
d Criti
cal C
are M
edici
ne
Copyri
ght ©
2019
Ameri
can T
horac
ic Soc
iety
8
Methods
We conducted a prospective multicenter physiological study between January 2016
and May 2017 in three ICUs of three hospitals affiliated to the University of Toronto. The study
received approval by local Research Ethics Board (REB# 15-142) and was registered
(NCT02464735). Patients and/or next of kin gave consent before being included.
Patients
Intubated, mechanically ventilated patients were eligible for inclusion when a SBT was
planned by the clinical team for subsequent day. Exclusion criterion was impaired
consciousness with Glasgow Coma Scale ≤ 8T.
Sleep assessment
Sleep was monitored using a portable monitor (Alice PDx diagnostic system, Philips
Respironics) and included two central EEG electrodes, right and left electrooculography
electrodes, submental electromyography electrodes and electrocardiography electrodes,
from 5:00 pm to 8:00 am. Sleep assessment was performed off-line using manual and digital
techniques. These methods are described in detail in the online supplement. Briefly:
- Sleep recordings were manually scored, first quickly after the recording and second by
a sleep specialist with experience in ICU tracings (TK and XD) blinded to patient’s
status. The 2007 American Academy of Sleep Medicine (AASM) rules were applied (26).
When typical wake and sleep EEG patterns were absent, sleep was scored using the
alternative classification, including pathological wakefulness and atypical sleep (6).
- ORP was continuously quantified (MY, who was also blinded to patient status and
weaning outcome) (See online supplement for details). In six of the 37 patients the
EEG signals were technically unacceptable for this type of analysis. In the remaining 31
patients the following ORP-derived indices were calculated:
America
n Jou
rnal o
f Res
pirato
ry an
d Criti
cal C
are M
edici
ne
Copyri
ght ©
2019
Ameri
can T
horac
ic Soc
iety
9
• Average ORP over the entire 15 h total recording time.
• Percent of total recording time with ORP >1.5, >2.0, and >2.2.
• Intra-class correlation coefficient between ORP in the right and left hemispheres (R/L
ORP). Normally, sleep depth changes in parallel in both hemispheres and the intra-class
correlation for right vs. left ORP across the night is typically between 0.9 and 1.0. Lower values
indicate regional differences in sleep depth which would suggest disruption of the normal
processes that coordinate sleep throughout the brain.
In addition to ORP-related variables we also calculated density of spindles (number per
minute when ORP was <1.5 with no rapid eye movements, indicating likely non-REM sleep).
Weaning protocol
A daily screening was performed each afternoon and patients that were anticipated to
undergo an SBT the morning after were included. The morning following the sleep
assessment, if patient met the readiness-to-wean criteria, an SBT was performed. Criteria to
undergo SBT the following day were: SpO2 ≥ 92% on FiO2 ≤0.5 and positive end-expiratory
pressure ≤8 cmH2O, and low/no doses of vasopressors. SBT with common policy is standard
practice in all three ICUs (27) and SBT was done on the ventilator with no pressure assist of
any kind (28). SBT lasted up to 60 minutes. Success/failure of the SBT was determined by the
clinical team based on predefined criteria (29). Likewise, the decision for extubation after
successful SBT was made by the ICU team independently from the study.
Clinical data collection
Demographic data, comorbidities, admission diagnosis, Sequential Organ Failure
Assessment (SOFA) score upon admission and enrolment, duration of MV upon and after
enrolment, ICU and hospital stay were recorded. Blood pressure, heart rate, respiratory rate,
America
n Jou
rnal o
f Res
pirato
ry an
d Criti
cal C
are M
edici
ne
Copyri
ght ©
2019
Ameri
can T
horac
ic Soc
iety
10
SpO2, blood gases, analgesic and sedative medications, mode of ventilation and ventilator
settings were recorded at the time the polysomnography was started, at 8:00 am the next
day, and during the SBT. Neurological function was assessed twice daily by measuring the
Richmond Agitation Sedation Scale (RASS) and the Confusion Assessment Method (CAM-ICU)
score.
Study design
Polysomnography was set up at 5:00 PM. A trained investigator positioned the
electrodes and checked correct recording with a laptop equipped with dedicated software
(Sleepware G3, Philips Respironics). The following morning, the SBT was performed, usually
between 8:00 and 9:00 am.
Statistical analyses
Continuous variables are presented with means and standard deviation (SD), whereas
categorical variables are summarized using proportions and 95% confidence intervals (CI).
Normality of the distribution was checked by using the Kolmogorov-Smirnov test. We initially
sought to compare patients who passed vs. failed SBT, but decided to separate the patients
into three groups: those who failed the SBT, those who passed but were not extubated and
those who passed the SBT and were extubated (SBT failure, SBT success without extubation,
and SBT success with extubation). The groups were discriminated based on 1) a recent large
observational study on weaning from mechanical ventilation which found that less than 60%
of patients passing an SBT are extubated on the same day (30, 31); 2) the distinction between
the SBT which detects the ability to be separated from the ventilator and the extubation
criteria (32) and 3) the clinical practice in the 3 centres. The main comparisons were made
among the three groups (failed SBT, successful SBT with extubation and successful without
extubation). We also report in the supplement the comparisons between patients who passed
America
n Jou
rnal o
f Res
pirato
ry an
d Criti
cal C
are M
edici
ne
Copyri
ght ©
2019
Ameri
can T
horac
ic Soc
iety
11
the SBT versus those who failed the SBT. For sample size calculation, we assumed a
success/failure rate of the SBT of 55%/45% and planned to have a minimum of 15 patients per
group. We also anticipated a dropout rate of approximately 20% due to technical problems,
and thus planned to enroll 42 patients from the three sites.
Comparisons of proportions were made using Fisher exact tests. Continuous variables
were compared by analysis of variance, paired test or unpaired test as appropriate. Receiver
Operating Characteristic (ROC) curves were constructed to evaluate the ability of R/L ORP to
predict SBT success. Sensitivity, specificity and area under the ROC curve (AUC-ROC) were
calculated. A p value < 0.05 was considered significant
America
n Jou
rnal o
f Res
pirato
ry an
d Criti
cal C
are M
edici
ne
Copyri
ght ©
2019
Ameri
can T
horac
ic Soc
iety
12
Results
A total of 44 patients were enrolled and 37 had acceptable quality of polysomnography
recordings. Patients’ characteristics are shown in Table 1. The most common reason for
intubation was acute respiratory failure (49%). At enrollment, patients had been ventilated
for 6 ± 4 days and had a SOFA score of 8 ± 4. On the day of polysomnography, RASS was 0 ± 1
and delirium was present in 5 patients (14%).
SBT was successful in 19 patients (51%), 11 being extubated and 8 deemed not ready
for extubation by the clinical team, and was unsuccessful in 18 (49%). Reasons for SBT failure
and for not extubating those who passed are given in Table E1.
Characteristics of the patients and weaning outcome
Patients who failed SBT had a shorter duration of ICU stay compared to their
counterparts (Tables 1 and E2). RASS was similar between all groups and delirium was slightly
but not significantly higher in patients who passed the spontaneous breathing trial (5/19 vs.
0/18). Clinical variables at the time of the SBT did not differ.
Sleep characteristics and weaning outcome
Conventional and alternative visual polysomnography scoring:
Sleep duration and sleep quality during the night before SBT based on conventional
and alternative assessment of polysomnography are presented in Tables 2 and E3. Pathologic
wakefulness and atypical sleep were frequent but did not significantly differ across groups.
Pathological wakefulness and atypical sleep, as previously defined (6), were present in 39%
and 55% in patients who failed the SBT, 50% and 50% in patients who passed the SBT and
were not extubated, and 27% and 27% respectively in patients who passed the SBT. As a
consequence, only 61% of the patients could be scored according to classical stages. Total
sleep time based on this analysis was found to be shorter in patients who failed the SBT. When
America
n Jou
rnal o
f Res
pirato
ry an
d Criti
cal C
are M
edici
ne
Copyri
ght ©
2019
Ameri
can T
horac
ic Soc
iety
13
scorable, distribution of stages 3, REM-sleep and fragmentation index did not differ between
groups.
ORP analysis
ORP analysis was possible in only 31 of the 37 enrolled patients. Figures 1 and E1 shows
EEG tracings in seven 30-second epochs, representing different levels of wakefulness and
sleep in a patient with normal EEG patterns; note that the average ORP in each reflects the
visual differences between the seven strips. There was no correlation between the mean ORP
in the first third of the recording and the RASS measured at the start of the recording (Figure
E2).
ORP-derived indices prior to SBT showed significant differences between groups (Table
2). Patients who were successfully extubated had higher average ORP during total recording
time and more time with ORP>2.0 and >2.2 than in the other two groups (Table 2). Figures 2
and E3 show the probability of successful SBT in relation to time spent above specified ORP
levels. There was no significant difference among groups in spindle density.
R/L ORP ranged from 0 to 0.97 (0.68±0.24). Figure 3 shows three examples spanning
the entire spectrum and Figure 4 shows examples of EEG tracings with discrepancy between
right and left ORP. Average R/L ORP was significantly lower in patients who failed the SBT as
compared to their counterparts (Figures 5 and E4). When comparing SBT failure vs. all SBT
success, R/L ORP was 0.54±0.26 vs. 0.80±0.15 respectively (p=0.006). The area under the ROC
curve of R/L ORP to predict failure of SBT was 0.91 (95% CI 0.75–0.98). A R/L ORP value >0.70
predicted successful SBT with a sensitivity of 85% (95% CI, 56–98%) and a specificity of 88%
(95% CI, 62–98%). Interestingly, there was a non-linear relation between R/L ORP and % of
time spent above specified ORP levels. Figure 6 shows the relation between time >2.2 and R/L
ORP.
America
n Jou
rnal o
f Res
pirato
ry an
d Criti
cal C
are M
edici
ne
Copyri
ght ©
2019
Ameri
can T
horac
ic Soc
iety
14
Discussion
This study investigated quality and quantity of sleep using conventional sleep scoring
guidelines and an index (ORP) that measures where brain state lies on a continuous scale
between full wakefulness and deep sleep, in the 15 hours preceding SBT in patients clinically
deemed ready for attempting to terminate mechanical ventilation. The high prevalence of
stages referred to as pathological wakefulness or atypical sleep made the classical scoring of
sleep of limited value and the distribution of sleep stages did not differ. By contrast, the
degree of wakefulness was clearly lower in patients who failed the SBT based on ORP
assessment. The two main findings are that the likelihood of success of SBT and extubation is
highly correlated with the fraction of monitoring time spent in full wakefulness (ORP >2.2),
and that a poor correlation between sleep depth in the right and left brain hemispheres
predicts SBT failure. The group who passed SBT and was extubated was the only one
characterized by both high hemispheric correlation and full wakefulness.
Identification of abnormal wakefulness:
Identification of pathological wakefulness, the presence of sleep features in the EEG
during confirmed wakefulness, has been technically difficult. So far, identification of this state
required simultaneous direct observation of the patient (to establish behavioral wakefulness)
while monitoring the EEG for presence of slow activity typically associated with sleep (6,7).
Since direct observation over extended periods is not feasible, it is not possible to determine
whether such pattern, if present, represents the situation throughout wakefulness or
transient sleepiness during few minutes of observation, which may be normal. Furthermore,
identification of excessive slow activity in the EEG requires specialised expertise that is not
readily available in the ICU.
America
n Jou
rnal o
f Res
pirato
ry an
d Criti
cal C
are M
edici
ne
Copyri
ght ©
2019
Ameri
can T
horac
ic Soc
iety
15
ORP can distinguish between different levels of wakefulness (Figures 1A-1C) and has
been observed to decrease during wakefulness following sleep restriction (33) and during
sleep deprivation studies (34). Full wakefulness is typically associated with ORP>2.2 (Figure
1A). In this study 23/31 patients (74%) spent < 10 minutes out of 15 hours, with ORP >2.2. For
a perspective, ambulatory patients spend ≈10% of an 8 hour nocturnal study with ORP >2.2
(24). Obviously, if a normal ambulatory subject were monitored for 15 hours, the percentage
of time spent with ORP >2.2 would be close to 50% since the balance of time (7 hours) would
be mostly wake time. Only 4 patients (14%) approached this level of full wakefulness and all
passed the SBT. Thus, the vast majority of patients in this study had some degree of
obtundation or abnormal or incomplete wakefulness most of the time they were awake.
Whereas the EEG pattern of pathological wakefulness is consistent with sleep
deprivation (1) it may also be observed with other encephalopathies (35). This possibility is,
less likely, however, given that the patients were deemed ready for termination of ventilation
and their RASS score was consistently showing an awake state.
Wakefulness and Liberation from Mechanical Ventilation:
The current study demonstrated that success of SBT and subsequent extubation are
directly correlated with time spent with full wakefulness (Figure 2). Yet, the reasons for SBT
failure were primarily respiratory failure and desaturation (Table E1). Assuming that an
abnormal wakefulness is related to sleep deprivation, and given that sleep deprivation is
known to depress ventilatory responses to CO2 and hypoxia and reduce respiratory muscle
endurance (14, 15), one could speculate that sleep deprivation contributed to SBT failure
through failure to respond to hypoxemia/hypercapnia, resulting in desaturation without
distress (8 of 18 patients who failed, Table E1), or through impaired diaphragm endurance
(15), which would result in respiratory distress with or without desaturation (8 of the 18
America
n Jou
rnal o
f Res
pirato
ry an
d Criti
cal C
are M
edici
ne
Copyri
ght ©
2019
Ameri
can T
horac
ic Soc
iety
16
patients who failed). An adequate response to the load requires intact responses to CO2 and
hypoxia and reasonable respiratory muscle endurance.
A significant proportion of patients (8/19, 42%) who passed SBT were not extubated
since they were deemed not ready by the clinical team. This finding is in line with a recent
epidemiological study conducted in France where only 58% of the patients who passed the
SBT were actually extubated (30). In fact, that these patients had more abnormal wakefulness
than those extubated in our study (lower ORP levels; Table 2) suggests that the decision to
delay extubation had biological grounds.
Abnormal sleep and liberation from mechanical ventilation:
Recently, Thille et al. reported a longer duration of weaning in patients with atypical
sleep (11). Our results add support to their findings that abnormal EEG patterns influence
clinical outcome in ICU patients. However, when we used the same techniques they used to
identify patients with Atypical Sleep we found no differences between the three patient
groups (Table 2, Sleep Quality by alternative criteria).
There are several reasons the alternate methods they used were not discriminating in
our study. First, they studied patients who already failed SBT. Their patients may have had
more severe abnormalities capable of being identified by less sensitive techniques. Second,
the main diagnostic features of atypical sleep are visual absence of spindles and K complexes
(6). Agreement between manual scorers in spindle detection is poor (36, 37). Furthermore,
determining that spindles are completely absent is problematic as it requires careful
inspection of each epoch in the recording. Accordingly, lack of significant differences in
number of patients with absent spindles in our study (Table 2, Sleep Quality) and presence of
such differences in Thille’s study may reflect differences in manual scoring (11). Last, as in
America
n Jou
rnal o
f Res
pirato
ry an
d Criti
cal C
are M
edici
ne
Copyri
ght ©
2019
Ameri
can T
horac
ic Soc
iety
17
most sleep studies in the ICU, they selected non sedated patients, being off sedation since
several days.
We used an automatic validated (Warby S, personal communications) spindle detector.
Despite a stated absence of spindles by visual inspection in more than half the patients (Table
2) none of the patients had complete absence of spindles with digital analysis. Spindle density
was not significantly different among the 3 groups (p=0.15, table 2). However, it was
significantly higher in the extubated patients than in the other two groups combined
(0.59±0.56 min-1 vs. 0.27±0.33 min-1, p=0.03). It must be noted that spindle density was
markedly depressed in all three groups relative to the values obtained with the same digital
detector in non-ICU patients (2.65±1.62 min-1 per EEG channel). The highest spindle density in
the current study was 1.56 min-1, well below the average in non-ICU patients. Given that
spindles are involved in memory consolidation (38), it is tempting to speculate that spindle
suppression in ICU patients is a mechanism aimed at reducing memory of the unpleasant
experiences encountered in this environment. Whether such suppression is protective against
future psychopathology is debatable (39, 40).
Correlation between Sleep Depth in the Two Hemispheres:
This is the first time that agreement in sleep depth between right and left hemispheres
was examined in ICU patients. This correlation has been observed in hundreds of non-ICU
polysomnographic studies both in normal subjects and in patients with chronic sleep disorders
(M. Younes, unpublished observation). R/L ORP intra-class correlation in non-ICU patients is
only rarely below 0.90. Accordingly, finding that R/L ORP was <0.7 in nearly half the patients
(Figure 5) is remarkable and highly significant. Moreover, the fact that R/L ORP predicted
success or failure of SBT (area under the ROC curve =0.91), and that patients with values <0.7
spent little/no time with ORP >2.2 while in all patients who spent >11% of the time with
America
n Jou
rnal o
f Res
pirato
ry an
d Criti
cal C
are M
edici
ne
Copyri
ght ©
2019
Ameri
can T
horac
ic Soc
iety
18
normal wakefulness R/L ORP was normal, further emphasise the importance of this finding
and suggest that it is a feature that develops with extreme pathological wakefulness.
That R/L correlation may be relevant to success of SBT was coincidental. When ORP
was introduced in the clinical sleep laboratory of the author who developed ORP (MY) it was
noted that in occasional patients there was, at times, marked difference between ORP in the
left and right hemispheres. This tool was developed and added to a battery of new EEG
biomarkers he developed to help research to identify their significance (e.g. alpha intrusion
index, spindle characteristics…etc.). Other than the current findings, there is no prior literature
on its association with clinical disorders but its use in research is just beginning.
Although it is not possible at present to determine why SBT failure and poor R/L
correlation are associated the finding that a poor correlation is associated with severe
pathological wakefulness (Figure 6) suggests a possible link. As discussed previously,
pathological wakefulness in the ICU setting is likely the result of sleep deprivation. Sleep
deprivation may increase the risk of SBT failure through its negative effect on ventilatory
responses and respiratory muscle endurance. To the extent that poor R/L correlation reflects
more severe sleep deprivation, SBT failure when R/L correlation is poor may simply be a
reflection of more severe respiratory control abnormalities.
Poor R/L correlation is a form of regional differences in sleep (i.e. some parts of the
brain are asleep while others are awake). This form of sleep, often called unihemispheric
sleep, is widely utilized by dolphins and related mammals (41) as well as by birds (42) when
operating under physiological conditions that require long periods without sleep. It is possible
that this primitive adaptive mechanism is reactivated in humans under conditions where
natural sleep is deemed by the individual to be unsafe.
America
n Jou
rnal o
f Res
pirato
ry an
d Criti
cal C
are M
edici
ne
Copyri
ght ©
2019
Ameri
can T
horac
ic Soc
iety
19
When discrepancies are present, spectral analysis typically shows one EEG having
slightly higher power in the beta frequency (>14Hz) and lower power in the slow frequency
(<7 Hz). As illustrated in figure 4, which shows tracings from some of the most outliers in the
ORP scatter plots (arrows in figure 3), the difference in visual appearance of the two EEG
signals when discrepancies exist, is too subtle to detect by the naked eye unless it is very large.
Accordingly, such an abnormality can only be detected through digital analysis.
Clinical Implications:
1) Together, the current study and the previous study by Thille et al. (11) clearly indicate
that EEG abnormalities are an important risk factor for failure to wean. Given that patients
who fail weaning contribute disproportionately to cost of ICU care and to morbidity and
mortality(30), studies are clearly needed to determine why these abnormalities develop (sleep
deprivation, metabolic factors, drugs…) and how to prevent them.
2) Our study is hypothesis generating and the current findings suggest that EEG
monitoring throughout the ICU admission could allow early detection of pathological
wakefulness so that measures can be taken to mitigate its progression. Unless research
studies point to other etiologies, we suggest that appearance of pathological wakefulness
strongly suggest sleep deprivation and measures should be taken to ensure adequate sleep.
3) Visual inspection of the EEG is not sufficient to detect the EEG abnormalities of
pathological wakefulness (Figure 4).
4) That all patients with severe pathological wakefulness, including those with the most
severe form (<2% time with ORP >2.2 and R/L ORP <0.7), scored 0±1 on RASS, indicates that
RASS score is quite insensitive for detecting pathological wakefulness.
Strengths and limits:
America
n Jou
rnal o
f Res
pirato
ry an
d Criti
cal C
are M
edici
ne
Copyri
ght ©
2019
Ameri
can T
horac
ic Soc
iety
20
This study is the first to report the use of a new method that allows continuous
measuring of sleep depth in the ICU. In addition, this study was conducted in three ICUs from
three different hospitals. Assessment of PSG and ORP derived indices was made off-line by
sleep specialists (TK, XD and MY) blinded to patients’ conditions and SBT outcomes. This study
has also limitations including intrinsic limitations of the classical sleep scoring process.
Assessment of hemispheric EEG correlation with the R/L ORP was not correlated with specific
neurological investigation but there were no clinical grounds to suspect the presence of
primary brain disease.
Conclusion
Our findings indicate that quantifying abnormal wakefulness and hemispheric EEG
correlation are feasible and potentially helpful at the bedside to identify patients not ready to
be weaned from the ventilator. It also underlines a need for studies to determine the reasons
for these EEG abnormalities and how to avoid them. Time during full or normal wakefulness
(as assessed by ORP) was higher in patients who passed SBT and were extubated, and
hemispheric EEG correlation was much poorer in patients who failed SBT.
Acknowledgments
We would like to deeply thank the nurses and respiratory therapists at the three
different ICUS who were essential in the success of this project, as well as the research
coordinators at the three sites, especially Kurtis Salway, Gyan Sandhu, Jennifer Hodder and
Sumesh Shah. Special thanks also to Orla Smith, Jenny Gu and Carolyn Campbell for a great
America
n Jou
rnal o
f Res
pirato
ry an
d Criti
cal C
are M
edici
ne
Copyri
ght ©
2019
Ameri
can T
horac
ic Soc
iety
21
help in the overall organization, to Unmesh Edke for enrolling patients and for the attending
physicians for supporting the study.
We thank Philips for providing the devices for the study.
America
n Jou
rnal o
f Res
pirato
ry an
d Criti
cal C
are M
edici
ne
Copyri
ght ©
2019
Ameri
can T
horac
ic Soc
iety
22
References
1. Cooper AB, Thornley KS, Young GB, Slutsky AS, Stewart TE, Hanly PJ. Sleep in critically
ill patients requiring mechanical ventilation. Chest 2000;117:809–818.
2. Gabor JY, Cooper AB, Crombach SA, Lee B, Kadikar N, Bettger HE, Hanly PJ. Contribution
of the intensive care unit environment to sleep disruption in mechanically ventilated patients
and healthy subjects. Am J Respir Crit Care Med 2003;167:708–715.
3. Freedman NS, Gazendam J, Levan L, Pack AI, Schwab RJ. Abnormal sleep/wake cycles
and the effect of environmental noise on sleep disruption in the intensive care unit. Am J
Respir Crit Care Med 2001;163:451–457.
4. Elliott R, McKinley S, Cistulli P, Fien M. Characterisation of sleep in intensive care using
24-hour polysomnography: an observational study. Crit Care 2013;17:R46.
5. Friese RS, Diaz-Arrastia R, McBride D, Frankel H, Gentilello LM. Quantity and quality of
sleep in the surgical intensive care unit: are our patients sleeping? J Trauma 2007;63:1210–
1214.
6. Drouot X, Roche-Campo F, Thille AW, Cabello B, Galia F, Margarit L, d’Ortho M-P,
Brochard L. A new classification for sleep analysis in critically ill patients. Sleep Med 2012;13:7–
14.
7. Watson PL, Pandharipande P, Gehlbach BK, Thompson JL, Shintani AK, Dittus BS,
Bernard GR, Malow BA, Ely EW. Atypical sleep in ventilated patients: empirical
electroencephalography findings and the path toward revised ICU sleep scoring criteria. Crit
Care Med 2013;41:1958–1967.
8. Naitoh P, Kales A, Kollar EJ, Smith JC, Jacobson A. Electroencephalographic activity
after prolonged sleep loss. Electroencephalogr Clin Neurophysiol 1969;27:2–11.
9. Olbrich E, Landolt HP, Achermann P. Effect of prolonged wakefulness on
America
n Jou
rnal o
f Res
pirato
ry an
d Criti
cal C
are M
edici
ne
Copyri
ght ©
2019
Ameri
can T
horac
ic Soc
iety
23
electroencephalographic oscillatory activity during sleep. J Sleep Res 2014;23:253–260.
10. Younes M. To sleep: perchance to ditch the ventilator. Eur Respir J 2018;51:.
11. Thille AW, Reynaud F, Marie D, Barrau S, Rousseau L, Rault C, Diaz V, Meurice J-C,
Coudroy R, Frat J-P, Robert R, Drouot X. Impact of sleep alterations on weaning duration in
mechanically ventilated patients: a prospective study. Eur Respir J 2018;51:.
12. McConville JF, Kress JP. Weaning patients from the ventilator. N Engl J Med
2012;367:2233–2239.
13. Dres M, Demoule A. Diaphragm dysfunction during weaning from mechanical
ventilation: an underestimated phenomenon with clinical implications. Crit Care 2018;22:73.
14. White DP, Douglas NJ, Pickett CK, Zwillich CW, Weil JV. Sleep deprivation and the
control of ventilation. Am Rev Respir Dis 1983;128:984–986.
15. Chen HI, Tang YR. Sleep loss impairs inspiratory muscle endurance. Am Rev Respir Dis
1989;140:907–909.
16. Bryant PA, Trinder J, Curtis N. Sick and tired: Does sleep have a vital role in the immune
system? Nat Rev Immunol 2004;4:457–467.
17. Faraut B, Boudjeltia KZ, Vanhamme L, Kerkhofs M. Immune, inflammatory and
cardiovascular consequences of sleep restriction and recovery. Sleep Med Rev 2012;16:137–
149.
18. Khan MS, Aouad R. The Effects of Insomnia and Sleep Loss on Cardiovascular Disease.
Sleep Med Clin 2017;12:167–177.
19. Davies SK, Ang JE, Revell VL, Holmes B, Mann A, Robertson FP, Cui N, Middleton B,
Ackermann K, Kayser M, Thumser AE, Raynaud FI, Skene DJ. Effect of sleep deprivation on the
human metabolome. Proc Natl Acad Sci U S A 2014;111:10761–10766.
20. Spiegel K, Leproult R, Van Cauter E. Impact of sleep debt on metabolic and endocrine
America
n Jou
rnal o
f Res
pirato
ry an
d Criti
cal C
are M
edici
ne
Copyri
ght ©
2019
Ameri
can T
horac
ic Soc
iety
24
function. Lancet 1999;354:1435–1439.
21. Bonnet MH. Acute sleep deprivation. Princ Pract Sleep Med, Kryger MH, Roth T,
Dement WC, eds. Philadelphia: Elsevier Saunders; 2005. p. 51–66.
22. Babkoff H, Sing HC, Thorne DR, Genser SG, Hegge FW. Perceptual distortions and
hallucinations reported during the course of sleep deprivation. Percept Mot Skills
1989;68:787–798.
23. Roche Campo F, Drouot X, Thille AW, Galia F, Cabello B, d’Ortho M-P, Brochard L. Poor
sleep quality is associated with late noninvasive ventilation failure in patients with acute
hypercapnic respiratory failure. Crit Care Med 2010;38:477–485.
24. Younes M, Ostrowski M, Soiferman M, Younes H, Younes M, Raneri J, Hanly P. Odds
ratio product of sleep EEG as a continuous measure of sleep state. Sleep 2015;38:641–654.
25. Malhotra A, Younes M, Kuna ST, Benca R, Kushida CA, Walsh J, Hanlon A, Staley B, Pack
AI, Pien GW. Performance of an automated polysomnography scoring system versus
computer-assisted manual scoring. Sleep 2013;36:573–582.
26. Berry RB, Brooks R, Gamaldo C, Harding SM, Lloyd RM, Quan SF, Troester MT, Vaughn
BV. AASM Scoring Manual Updates for 2017 (Version 2.4). J Clin Sleep Med 2017;13:665–666.
27. Goligher EC, Detsky ME, Sklar MC, Campbell VT, Greco P, Amaral ACKB, Ferguson ND,
Brochard LJ. Rethinking Inspiratory Pressure Augmentation in Spontaneous Breathing Trials.
Chest 2017;151:1399–1400.
28. Sklar MC, Burns K, Rittayamai N, Lanys A, Rauseo M, Chen L, Dres M, Chen G-Q,
Goligher EC, Adhikari NKJ, Brochard L, Friedrich JO. Effort to Breathe with Various
Spontaneous Breathing Trial Techniques. A Physiologic Meta-analysis. Am J Respir Crit Care
Med 2017;195:1477–1485.
29. Boles J-M, Bion J, Connors A, Herridge M, Marsh B, Melot C, Pearl R, Silverman H,
America
n Jou
rnal o
f Res
pirato
ry an
d Criti
cal C
are M
edici
ne
Copyri
ght ©
2019
Ameri
can T
horac
ic Soc
iety
25
Stanchina M, Vieillard-Baron A, Welte T. Weaning from mechanical ventilation. Eur Respir J
2007;29:1033–1056.
30. Béduneau G, Pham T, Schortgen F, Piquilloud L, Zogheib E, Jonas M, Grelon F, Runge I,
Nicolas Terzi null, Grangé S, Barberet G, Guitard P-G, Frat J-P, Constan A, Chretien J-M,
Mancebo J, Mercat A, Richard J-CM, Brochard L, WIND (Weaning according to a New
Definition) Study Group and the REVA Network ‡. Epidemiology of Weaning Outcome
according to a New Definition. The WIND Study. Am J Respir Crit Care Med 2017;195:772–783.
31. MacIntyre N. Another Look at Outcomes from Mechanical Ventilation. Am J Respir Crit
Care Med 2017;195:710–711.
32. Thille AW, Richard J-CM, Brochard L. The decision to extubate in the intensive care
unit. Am J Respir Crit Care Med 2013;187:1294–1302.
33. PK Schweitzer, Griffin K, Younes M, Walsh J. Assessment of sleep depth and propensity
during sleep restriction using the Odds Ratio Product. Sleep 2018;A57-58.
34. Tanayapong P, Maislin G, Staley B, Pack F, Pack AI, Younes M. Odd Ratio Product : a
measure of sleep homeostasis following prolonged wakefulness. 2018;41:A83.
35. Sutter R, Kaplan PW, Valença M, De Marchis GM. EEG for Diagnosis and Prognosis of
Acute Nonhypoxic Encephalopathy: History and Current Evidence. J Clin Neurophysiol
2015;32:456–464.
36. Warby SC, Wendt SL, Welinder P, Munk EGS, Carrillo O, Sorensen HBD, Jennum P,
Peppard PE, Perona P, Mignot E. Sleep-spindle detection: crowdsourcing and evaluating
performance of experts, non-experts and automated methods. Nat Methods 2014;11:385–
392.
37. Wendt SL, Welinder P, Sorensen HBD, Peppard PE, Jennum P, Perona P, Mignot E,
Warby SC. Inter-expert and intra-expert reliability in sleep spindle scoring. Clin Neurophysiol
America
n Jou
rnal o
f Res
pirato
ry an
d Criti
cal C
are M
edici
ne
Copyri
ght ©
2019
Ameri
can T
horac
ic Soc
iety
26
2015;126:1548–1556.
38. Clawson BC, Durkin J, Aton SJ. Form and Function of Sleep Spindles across the Lifespan.
Neural Plast 2016;2016:6936381.
39. Schelling G, Stoll C, Haller M, Briegel J, Manert W, Hummel T, Lenhart A, Heyduck M,
Polasek J, Meier M, Preuss U, Bullinger M, Schüffel W, Peter K. Health-related quality of life
and posttraumatic stress disorder in survivors of the acute respiratory distress syndrome. Crit
Care Med 1998;26:651–659.
40. Jones C, Griffiths RD, Humphris G, Skirrow PM. Memory, delusions, and the
development of acute posttraumatic stress disorder-related symptoms after intensive care.
Crit Care Med 2001;29:573–580.
41. Lyamin OI, Manger PR, Ridgway SH, Mukhametov LM, Siegel JM. Cetacean sleep: an
unusual form of mammalian sleep. Neurosci Biobehav Rev 2008;32:1451–1484.
42. Rattenborg NC, Lima SL, Amlaner CJ. Half-awake to the risk of predation. Nature
1999;397:397–398.
America
n Jou
rnal o
f Res
pirato
ry an
d Criti
cal C
are M
edici
ne
Copyri
ght ©
2019
Ameri
can T
horac
ic Soc
iety
27
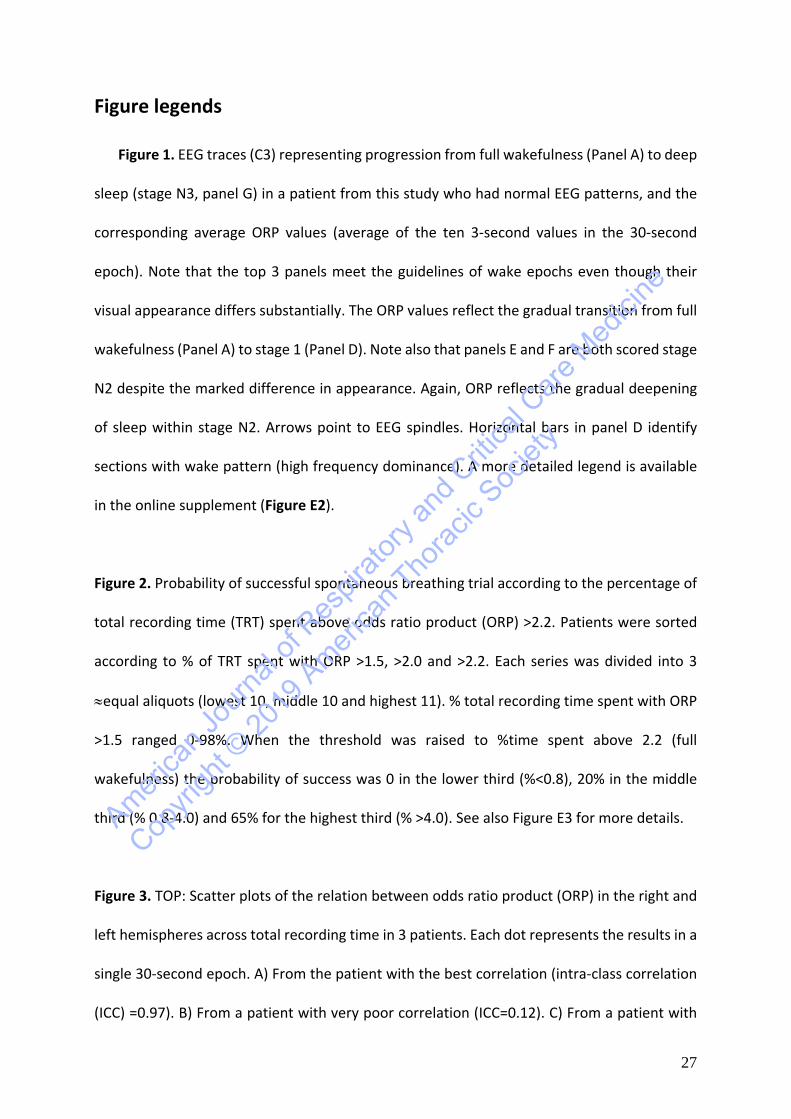
Figure legends
Figure 1. EEG traces (C3) representing progression from full wakefulness (Panel A) to deep
sleep (stage N3, panel G) in a patient from this study who had normal EEG patterns, and the
corresponding average ORP values (average of the ten 3-second values in the 30-second
epoch). Note that the top 3 panels meet the guidelines of wake epochs even though their
visual appearance differs substantially. The ORP values reflect the gradual transition from full
wakefulness (Panel A) to stage 1 (Panel D). Note also that panels E and F are both scored stage
N2 despite the marked difference in appearance. Again, ORP reflects the gradual deepening
of sleep within stage N2. Arrows point to EEG spindles. Horizontal bars in panel D identify
sections with wake pattern (high frequency dominance). A more detailed legend is available
in the online supplement (Figure E2).
Figure 2. Probability of successful spontaneous breathing trial according to the percentage of
total recording time (TRT) spent above odds ratio product (ORP) >2.2. Patients were sorted
according to % of TRT spent with ORP >1.5, >2.0 and >2.2. Each series was divided into 3
≈equal aliquots (lowest 10, middle 10 and highest 11). % total recording time spent with ORP
>1.5 ranged 0-98%. When the threshold was raised to %time spent above 2.2 (full
wakefulness) the probability of success was 0 in the lower third (%<0.8), 20% in the middle
third (% 0.8-4.0) and 65% for the highest third (% >4.0). See also Figure E3 for more details.
Figure 3. TOP: Scatter plots of the relation between odds ratio product (ORP) in the right and
left hemispheres across total recording time in 3 patients. Each dot represents the results in a
single 30-second epoch. A) From the patient with the best correlation (intra-class correlation
(ICC) =0.97). B) From a patient with very poor correlation (ICC=0.12). C) From a patient with
America
n Jou
rnal o
f Res
pirato
ry an
d Criti
cal C
are M
edici
ne
Copyri
ght ©
2019
Ameri
can T
horac
ic Soc
iety
28
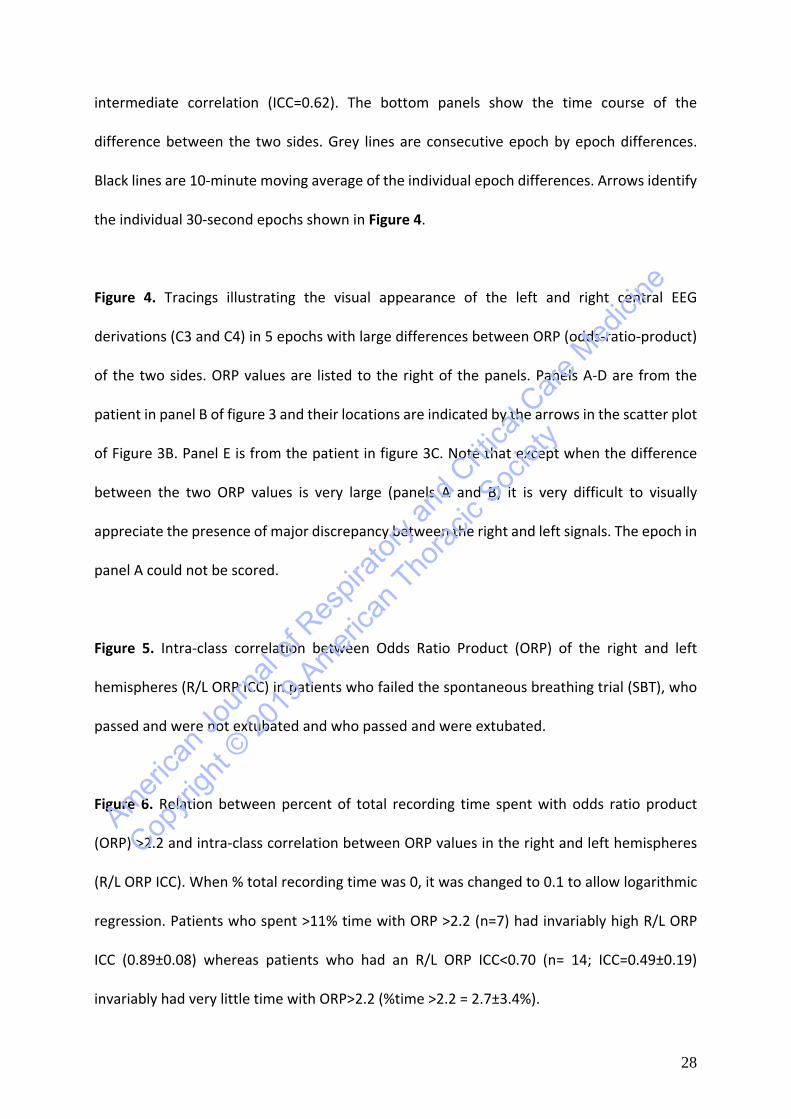
intermediate correlation (ICC=0.62). The bottom panels show the time course of the
difference between the two sides. Grey lines are consecutive epoch by epoch differences.
Black lines are 10-minute moving average of the individual epoch differences. Arrows identify
the individual 30-second epochs shown in Figure 4.
Figure 4. Tracings illustrating the visual appearance of the left and right central EEG
derivations (C3 and C4) in 5 epochs with large differences between ORP (odds-ratio-product)
of the two sides. ORP values are listed to the right of the panels. Panels A-D are from the
patient in panel B of figure 3 and their locations are indicated by the arrows in the scatter plot
of Figure 3B. Panel E is from the patient in figure 3C. Note that except when the difference
between the two ORP values is very large (panels A and B) it is very difficult to visually
appreciate the presence of major discrepancy between the right and left signals. The epoch in
panel A could not be scored.
Figure 5. Intra-class correlation between Odds Ratio Product (ORP) of the right and left
hemispheres (R/L ORP ICC) in patients who failed the spontaneous breathing trial (SBT), who
passed and were not extubated and who passed and were extubated.
Figure 6. Relation between percent of total recording time spent with odds ratio product
(ORP) >2.2 and intra-class correlation between ORP values in the right and left hemispheres
(R/L ORP ICC). When % total recording time was 0, it was changed to 0.1 to allow logarithmic
regression. Patients who spent >11% time with ORP >2.2 (n=7) had invariably high R/L ORP
ICC (0.89±0.08) whereas patients who had an R/L ORP ICC<0.70 (n= 14; ICC=0.49±0.19)
invariably had very little time with ORP>2.2 (%time >2.2 = 2.7±3.4%).
America
n Jou
rnal o
f Res
pirato
ry an
d Criti
cal C
are M
edici
ne
Copyri
ght ©
2019
Ameri
can T
horac
ic Soc
iety
29
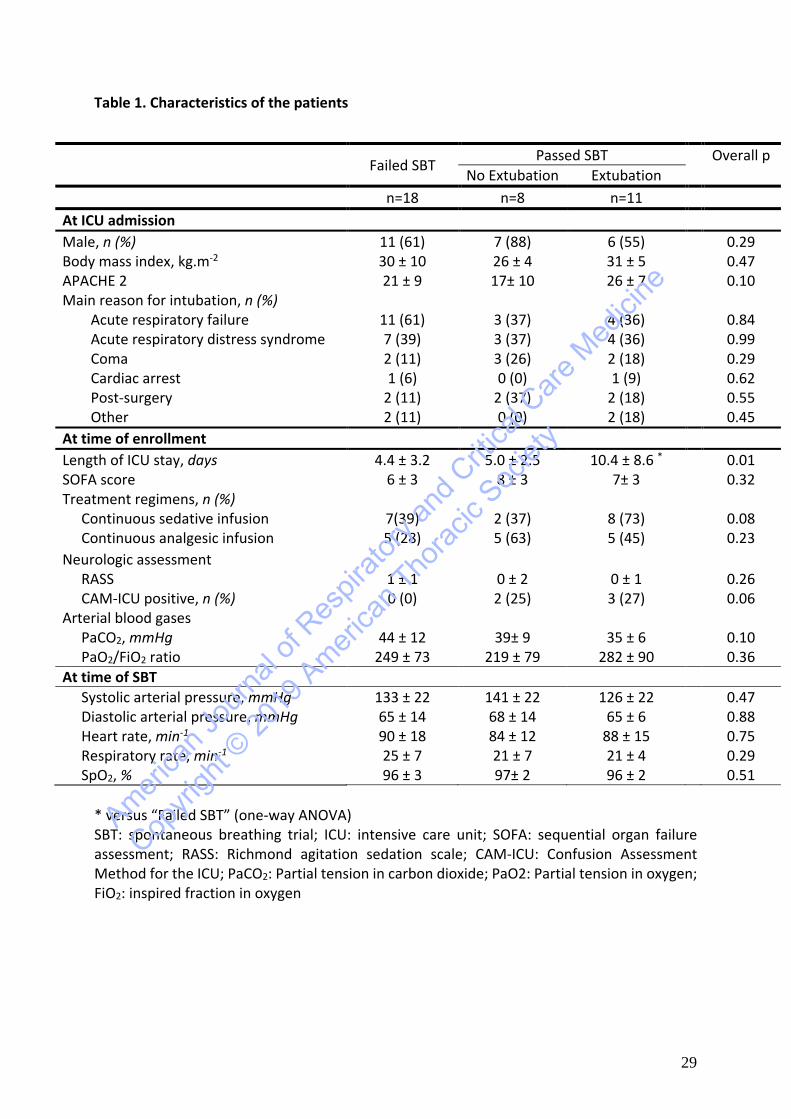
Table 1. Characteristics of the patients
* versus “Failed SBT” (one-way ANOVA) SBT: spontaneous breathing trial; ICU: intensive care unit; SOFA: sequential organ failure assessment; RASS: Richmond agitation sedation scale; CAM-ICU: Confusion Assessment Method for the ICU; PaCO2: Partial tension in carbon dioxide; PaO2: Partial tension in oxygen; FiO2: inspired fraction in oxygen
Failed SBT Passed SBT Overall p No Extubation Extubation
n=18 n=8 n=11 At ICU admission Male, n (%) 11 (61) 7 (88) 6 (55) 0.29 Body mass index, kg.m-2 30 ± 10 26 ± 4 31 ± 5 0.47 APACHE 2 21 ± 9 17± 10 26 ± 7 0.10 Main reason for intubation, n (%)
Acute respiratory failure 11 (61) 3 (37) 4 (36) 0.84 Acute respiratory distress syndrome 7 (39) 3 (37) 4 (36) 0.99 Coma 2 (11) 3 (26) 2 (18) 0.29 Cardiac arrest 1 (6) 0 (0) 1 (9) 0.62 Post-surgery 2 (11) 2 (37) 2 (18) 0.55 Other 2 (11) 0 (0) 2 (18) 0.45
At time of enrollment Length of ICU stay, days 4.4 ± 3.2 5.0 ± 2.5 10.4 ± 8.6 * 0.01 SOFA score 6 ± 3 8 ± 3 7± 3 0.32 Treatment regimens, n (%)
Continuous sedative infusion 7(39) 2 (37) 8 (73) 0.08 Continuous analgesic infusion 5 (28) 5 (63) 5 (45) 0.23
Neurologic assessment RASS 1 ± 1 0 ± 2 0 ± 1 0.26 CAM-ICU positive, n (%) 0 (0) 2 (25) 3 (27) 0.06
Arterial blood gases PaCO2, mmHg 44 ± 12 39± 9 35 ± 6 0.10 PaO2/FiO2 ratio 249 ± 73 219 ± 79 282 ± 90 0.36
At time of SBT Systolic arterial pressure, mmHg 133 ± 22 141 ± 22 126 ± 22 0.47 Diastolic arterial pressure, mmHg 65 ± 14 68 ± 14 65 ± 6 0.88 Heart rate, min-1 90 ± 18 84 ± 12 88 ± 15 0.75 Respiratory rate, min-1 25 ± 7 21 ± 7 21 ± 4 0.29 SpO2, % 96 ± 3 97± 2 96 ± 2 0.51
America
n Jou
rnal o
f Res
pirato
ry an
d Criti
cal C
are M
edici
ne
Copyri
ght ©
2019
Ameri
can T
horac
ic Soc
iety
30
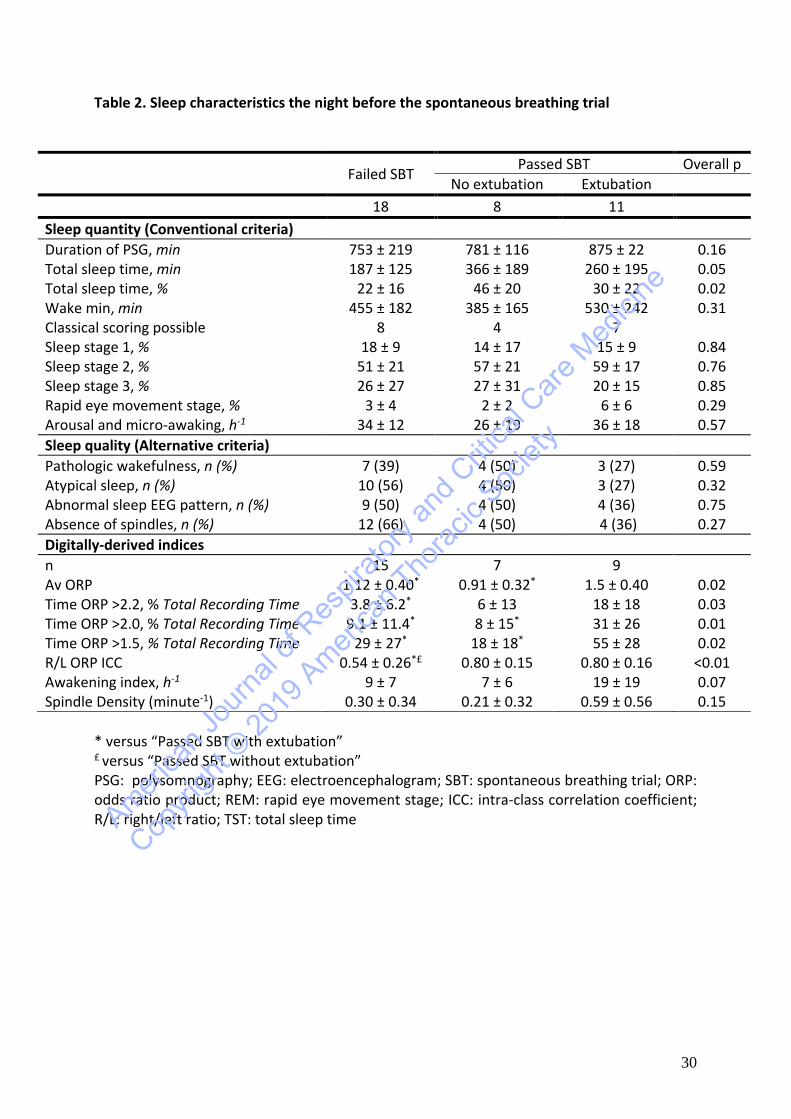
Table 2. Sleep characteristics the night before the spontaneous breathing trial
Failed SBT Passed SBT Overall p No extubation Extubation
18 8 11 Sleep quantity (Conventional criteria) Duration of PSG, min 753 ± 219 781 ± 116 875 ± 22 0.16 Total sleep time, min 187 ± 125 366 ± 189 260 ± 195 0.05 Total sleep time, % 22 ± 16 46 ± 20 30 ± 22 0.02 Wake min, min 455 ± 182 385 ± 165 530 ± 242 0.31 Classical scoring possible 8 4 7 Sleep stage 1, % 18 ± 9 14 ± 17 15 ± 9 0.84 Sleep stage 2, % 51 ± 21 57 ± 21 59 ± 17 0.76 Sleep stage 3, % 26 ± 27 27 ± 31 20 ± 15 0.85 Rapid eye movement stage, % 3 ± 4 2 ± 2 6 ± 6 0.29 Arousal and micro-awaking, h-1 34 ± 12 26 ± 19 36 ± 18 0.57 Sleep quality (Alternative criteria) Pathologic wakefulness, n (%) 7 (39) 4 (50) 3 (27) 0.59 Atypical sleep, n (%) 10 (56) 4 (50) 3 (27) 0.32 Abnormal sleep EEG pattern, n (%) 9 (50) 4 (50) 4 (36) 0.75 Absence of spindles, n (%) 12 (66) 4 (50) 4 (36) 0.27 Digitally-derived indices n 15 7 9 Av ORP 1.12 ± 0.40* 0.91 ± 0.32* 1.5 ± 0.40 0.02 Time ORP >2.2, % Total Recording Time 3.8 ± 6.2* 6 ± 13 18 ± 18 0.03 Time ORP >2.0, % Total Recording Time 9.1 ± 11.4* 8 ± 15* 31 ± 26 0.01 Time ORP >1.5, % Total Recording Time 29 ± 27* 18 ± 18* 55 ± 28 0.02 R/L ORP ICC 0.54 ± 0.26*£ 0.80 ± 0.15 0.80 ± 0.16 <0.01 Awakening index, h-1 9 ± 7 7 ± 6 19 ± 19 0.07 Spindle Density (minute-1) 0.30 ± 0.34 0.21 ± 0.32 0.59 ± 0.56 0.15
* versus “Passed SBT with extubation” £ versus “Passed SBT without extubation” PSG: polysomnography; EEG: electroencephalogram; SBT: spontaneous breathing trial; ORP: odds ratio product; REM: rapid eye movement stage; ICC: intra-class correlation coefficient; R/L: right/left ratio; TST: total sleep time
America
n Jou
rnal o
f Res
pirato
ry an
d Criti
cal C
are M
edici
ne
Copyri
ght ©
2019
Ameri
can T
horac
ic Soc
iety
Top Related