


Languages
Pages
Legal


Research
SKI Report 2008:01
ISSN 1104-1374ISRN SKI-R-08/01-SE
Reliability Data for Piping Components in Nordic Nuclear Power Plants “R-Book” Project Phase IRev 1
Bengt Lydell - Scandpower Risk Management Inc.Anders Olsson - Relcon Scandpower AB
January 2008

SKI-perspective SKI Report 2008:01 - “Reliability Data for Piping Components in Nordic Nuclear Power Plants - R-Book Project Phase I” – is a planning document for a new R&D project to develop a piping component reliability parameter handbook for use in probabilistic safety assessment (PSA) and related activities. Included in this handbook will be pipe leak failure rates and rupture frequencies that are derived from the service experience data that is stored in the “OECD Pipe Failure Data Exchange” (OPDE) database. This new R&D project is sponsored jointly by the Swedish Nuclear Power Inspectorate and the Swedish utility members of the Nordic PSA Group (NPSAG).
Established in 2002, OPDE is an international database on the service experience with piping in commercial nuclear power plants. The OPDE database captures information on damage and degradation mechanisms that result in repair or replacement of affected piping, including small-, medium- and large-diameter safety-related and non-safety-related piping systems. The “R-Book” project is one of a series of completed or ongoing OPDE application projects, including work by the Korea Institute of Nuclear Safety, Korea Atomic Energy Research Institute, and the Japan Nuclear Energy Safety Organization.
SKI Report 2008:1 describes the methods and techniques that are proposed for the derivation of piping reliability parameters. The report also outlines the technical scope of the analyses to be performed and the proposed detailed content of the R-Book.
Background
The history behind the current effort to produce a handbook of piping reliability parameters goes back to 1994 when SKI funded a 5-year R&D project to explore the viability of establishing an international database on the service experience with piping system components in commercial nuclear power plants. An underlying objective behind this 5-year program was to investigate the different options and possibilities for deriving pipe failure rates and rupture probabilities directly from service experience data as an alternative to probabilistic fracture mechanics. The R&D project culminated in an international piping reliability seminar held in the fall of 1997 in Sigtuna (Sweden) and a pilot project to demonstrate an application of the pipe failure database to the estimation of loss-of-coolant-accident (LOCA) frequency (SKI Report 98:30).
Scope The scope of the research project which is described in SKI Report 2008:01 is to derive piping component failure rates and rupture probabilities from piping failure reports stored in the OECD Nuclear Energy Agency OPDE database.
Results Since the completion of the original piping reliability R&D in 1998, a very large number of practical pipe failure database applications have been completed, some of which are referenced in this report. The insights and lessons learned from these applications, including the experience gained from the OPDE project, form the basis for developing the “R-Book.”. The results of the planning effort that are presented in this report are:

- Review of pipe failure databases and identification of technical features that are considered important to the statistical estimation processes that are considered for use in the R-Book development (Chapter 2: Existing Pipe Failure Databases).
- Review of methods for piping reliability parameter estimation (Chapter 3: Pipe Failure Parameter Estimation & Requirements on Data Sources).
- Development, distribution and evaluation of a questionnaire that addresses user requirements on the planned R-Book (content, including level of detail, and updating philosophy) (Chapter 4: Questionnaire – Database users).
During 2008, high-level presentations of the project, including technical progress reports will also be given at forthcoming international conferences.
Impact on the operation of SKI The usefulness of any component failure data collection depends on the way by which a stated purpose is translated into database design specifications and requirements for data input and validation, access rules, support and maintenance, and QA. SKI sees it as an important step to verify the content and quality of the OPDE database, and that interested parties strive against harmonized ways of creating reliability data to be used in safety analyses.
Continuing work within the research area During 2008 and 2009 the work continues in a phase 2, which is an implementation phase. Overall work strategy for the continuous work with the R-Book project in Phase 2 will be:
- Identification of already existing piping population databases, including those at Nordic nuclear power plants. These databases will provide critical input to exposure term definitions that are required for the calculation of pipe failure rates.
- For selected systems, qualitative and quantitative piping reliability information will be developed to demonstrate the R-Book document design and content.
- A seminar with representatives from the Nordic utilities and SKI will be held in the May-June 2008 timeframe. At this seminar the interim results will be presented. Comments and recommendations with respect to methodology and handbook content will be accounted for before the work continues to complete a first edition of the R-Book.
- Continued work to produce reliability data parameters for the R-Book.

Project information SKI Project Manager: Ralph Nyman
Project number: 2005 02 004
Dossier Number: SKI 2005/500
Earlier published reports1 related to the topic of this research project are: SKI Report 95:58, Reliability of Piping System Components. Volume 1: Piping Reliability – A Resource Document for PSA Applications, December 1995
SKI Report 95:59, Reliability of Piping System Components. Volume 2: Review of Methods for LOCA Frequency Assessment, December 1995
SKI Report 95:60, Reliability of Piping System Components. Volume 3: A Bibliography of Technical Reports and Papers Related to Piping Reliability, December 1995
SKI Report 95:61, Reliability of Piping System Components. Volume 4: The Pipe Failure Event Database, December 1995
SKI Report 1996:20, Piping Failures in United States Nuclear Power Plants: 1961-1995, February 1996
SKI Report 1996:24, An Overview of Stress Corrosion in Nuclear Reactors from the Late 1950s to the 1990s, February 1996
SKI Report 1996:39, Failure Frequencies and Probabilities Applicable to BWR and PWR Piping, March 1996
SKI Report 1997:26, Reliability of Piping System Components, December 1997
SKI Report 1997:32, Proceedings of Seminar on Piping Reliability, October 1997
SKI Report 1998:30, Failure Rates in Barsebäck-1 Reactor Coolant Pressure Boundary Piping, May 1999
SKI Report 02:50, Skador i svenska kärnkraftanläggningars mekaniska anordningar (1972-2000), December 2002 (For the period 1972-2000, this report includes a detailed review of the piping service experience at the Swedish nuclear power plants. The report is available in Swedish language only).
1 For more information go to www.ski.se


Research
SKI Report 2008:01
Reliability Data for Piping Components in Nordic Nuclear Power Plants “R-Book” Project Phase IRev 1
Bengt Lydell - Scandpower Risk Management Inc.Anders Olsson - Relcon Scandpower AB
January 2008
This report concerns a study which has been conducted for the Swedish Nuclear Power Inspectorate (SKI). The conclusions and viewpoints presented in the report are those of the author/authors and do not necessarily coincide with those of the SKI.


Sammanfattning Föreliggande dokument utgör planering för ett F&U projekt med syfte att ta fram en handbok innehållande tillförlitlighetsdata för rörkomponenter (den svenska benämningen på handboken är ”R-boken”) för att använda i PSA (Probabilistiska säkerhetsanalyser) samt andra aktiviteter relaterade till PSA.
Målet med projektet är att använda den databas som går under benämningen OPDE (OECD Nuclear Energy Agency “OECD Pipe Failure Data Exchange Project”) för att ta fram felfrekvenser med tillhörande brottsannolikheter. Dessa data ska sedan kunna användas vid analys av översvämning, rörbrott i högenergisystem, framtagande av riskinformerade rörprovningsprogram samt andra PSA-relaterade aktiviteter. Detta F&U projekt finansieras av medlemmar från den Nordiska PSA-Gruppen (NPSAG), nämligen Forsmark AB, OKG AB, Ringhals AB samt SKI.
Historien som gett upphov till projektet om R-boken går tillbaka till 1994 när SKI finansierade ett 5-årigt F&U projekt som syftade att undersöka möjligheten att ta fram en internationell databas innehållande erfarenhetsdata på rörkomponenter i kommersiella kärnkraftverksanläggningar. Ett bakomliggande motiv till detta 5-årsprogram var att undersöka möjligheterna att ta fram tillförlitlighetsdata för rörkomponenter utifrån erfarenhetsdata som ett alternativ till data framtaget m.h.a. probabilistisk strukturmekanik. Detta F&U projekt kulminerade hösten 1997 med ett internationellt seminarium i Sigtuna (Sverige) samt ett pilotprojekt som syftade att demonstrera framtagande av LOCA-frekvenser från erfarenhetsdata (SKI Rapport 98:30).
Ett särskilt viktigt resultat från det 5-åriga F&U projektet var ett beslut från SKI att överföra erfarenhetsdatabasen som tagits fram till ett internationellt samarbetsprojekt under OECD Nuclear Energy Agency. Under år 2000 pågick informationsinsamling och planeringsmöten och år 2001 organiserade OECD Nuclear Energy Agency det projekt som kom att gå under namnet OECD Pipe Failure Data Exchange Project (OPDE). Projektet startades officiellt upp i maj år 2002. I dag (per januari 2008) så stöds OPDE av organisationer från tolv länder och i november 2007 beslutades om projektets tredje period som kommer att omfatta åren 2008-2011. Generell information om OPDE kan hittas på www.nea.fr.
Sedan det ursprungliga F&U projektet från 1998 har ett stort antal praktiska applikationer genomförts baserat på olika databaser för rörkomponenter, vissa av dem finns refererade i föreliggande dokument. Insikter och lärdomar från dessa applikationer tillsammans med den kunskap som har byggts upp i samband med OPDE utgör grunden för framtagande av ”R-boken”. En viktig lärdom från föregående applikationer är vikten av att de inträffade händelser som återfinns i databasen är verifierade och kvalitetssäkrade samt att det verifieras att de händelsepopulationer sökningar i databasen resulterar i är tillräckligt fullständiga för att relevanta slutsatser ska kunna dras.

Summary This report constitutes a planning document for a new R&D project to develop a piping component reliability parameter handbook for use in probabilistic safety assessment (PSA) and related activities. The Swedish acronym for this handbook is “R-Book.”
The objective of the project is to utilize the OECD Nuclear Energy Agency “OECD Pipe Failure Data Exchange Project” (OPDE) database to derive piping component failure rates and rupture probabilities for input to internal flooding probabilistic safety assessment, high-energy line break” (HELB) analysis, risk-informed in-sevice inspection (RI-ISI) program development, and other activities related to PSA. This new R&D project is funded by member organizations of the Nordic PSA Group (NPSAG) – Forsmark AB, OKG AB, Ringhals AB, and the Swedish Nuclear Power Inspectorate (SKI).
The history behind the current effort to produce a handbook of piping reliability parameters goes back to 1994 when SKI funded a 5-year R&D project to explore the viability of establishing an international database on the service experience with piping system components in commercial nuclear power plants. An underlying objective behind this 5-year program was to investigate the different options and possibilities for deriving pipe failure rates and rupture probabilities directly from service experience data as an alternative to probabilistic fracture mechanics. The R&D project culminated in an international piping reliability seminar held in the fall of 1997 in Sigtuna (Sweden) and a pilot project to demonstrate an application of the pipe failure database to the estimation of loss-of-coolant-accident (LOCA) frequency (SKI Report 98:30).
A particularly important outcome of the 5-year project was a decision by SKI to transfer the pipe failure database including the lessons learned to an international cooperative effort under the auspices of the OECD Nuclear Energy Agency. Following on information exchange and planning meetings that were organized by the OECD Nuclear Energy Agency during 2000 – 2001, the “OECD Pipe Failure Data Exchange Project” (OPDE) was officially launched in May 2002. Today (January 2008) the OPDE is supported by organizations from twelve countries. The project’s third term (2008-2011) was approved in November 2007. General information about OPDE can be found at www.nea.fr.
Since the completion of the original piping reliability R&D in 1998, a very large number of practical pipe failure database applications have been completed, some of which are referenced in this report. The insights and lessons learned from these practical applications, including the experience gained from the OPDE project, form the basis for developing the “R-Book.” An important observation from prior applications is the need to ensure that reports on pipe degradation and failure as recorded in a database are fully validated and that the event populations that result from database queries are sufficiently complete.

Table of contents
1 Introduction............................................................................................................. 1 1.1 Planning Steps.................................................................................................. 1 1.2 Results of the Planning Phase .......................................................................... 1 1.3 Technical Scope of R-Book............................................................................. 2 1.4 Report Outline.................................................................................................. 2
2 Existing Pipe Failure Databases ............................................................................ 3 2.1 Abstract ............................................................................................................ 3 2.2 Introduction...................................................................................................... 4
2.2.1 Database Categorization....................................................................... 4 2.2.2 Pipe Failure Database Features & Requirements ................................. 4 2.2.3 Reading guide....................................................................................... 6
2.3 Piping Reliability Models & Data Requirements ............................................ 6 2.3.1 Reliability Parameters .......................................................................... 7 2.3.2 Assessment of Inspection Effectiveness............................................. 14 2.3.3 Data Specializations ........................................................................... 15 2.3.4 Summary............................................................................................. 16
2.4 Results of Survey ........................................................................................... 16 2.4.1 Survey Format .................................................................................... 16 2.4.2 Insights ............................................................................................... 26
3 Pipe Failure Parameter Estimation & Requirements on Data Sources........... 27 3.1 Abstract .......................................................................................................... 27 3.2 Introduction.................................................................................................... 27
3.2.1 High Level Requirements for Data Analysis...................................... 27 3.2.2 Reading Guide .................................................................................... 28
3.3 Pipe Failure Parameter Types ........................................................................ 30 3.3.1 “Generic” Pipe Failure Parameters..................................................... 30 3.3.2 Application-Specific Pipe Failure Parameters.................................... 30 3.3.3 Advanced Database Applications....................................................... 33
3.4 Recommendations for R-Book Content......................................................... 36
4 Questionnaire – Database users........................................................................... 41 4.1 Questionnaire distribution.............................................................................. 41 4.2 Questionnaire ................................................................................................. 41
5 Questionnaire - Piping Population Databases .................................................... 42 5.1.1 Questionnaire distribution .................................................................. 42
5.2 Questionnaire outline ..................................................................................... 42
6 R-Book project – Scope of Phase 2...................................................................... 43 6.1 Strategy for Phase 2 ....................................................................................... 43

6.2 R-Book requirements ..................................................................................... 44 6.2.1 Applicability and level of detail ......................................................... 44 6.2.2 Site specific or generic data?.............................................................. 45 6.2.3 Piping components to be represented ................................................. 46 6.2.4 Piping population data requirements .................................................. 46 6.2.5 Traceability......................................................................................... 47 6.2.6 Parameters to be presented ................................................................. 47 6.2.7 Systems to be presented...................................................................... 48 6.2.8 Exposure term (pressure, temp, flow, chemistry etc.) ........................ 49 6.2.9 Language ............................................................................................ 49 6.2.10 Treatment of “other issues” in [6.4] ................................................. 49
6.3 Prior distribution ............................................................................................ 51 6.4 Quality Assurance.......................................................................................... 51 6.5 Software used for R-Book ............................................................................. 51
6.5.1 Uncertainty distribution...................................................................... 52 6.6 Overall time schedule for Phase 2 ................................................................. 52 6.7 Access to OPDE database.............................................................................. 52
7 List of References.................................................................................................. 53 Attachment 1: Existing Pipe Failure Databases - Appendix A
Attachment 2: Existing Pipe Failure Databases - Appendix B
Attachment 3: Existing Pipe Failure Databases - Appendix C
Attachment 4: Existing Pipe Failure Databases - Appendix D
Attachment 5: Database Users – Appendix A
Attachment 6: Database Users – Appendix B
Attachment 7: Piping Population Databases – Appendix A
Attachment 8: R-Book project – Scope of Phase 2 – Appendix A
Attachment 9: R-Book project – Scope of Phase 2 – Appendix B
Attachment 10: R-Book project – Scope of Phase 2 – Appendix C

1
1 Introduction This report constitutes a planning document for the development of a piping reliability parameter handbook (the “R-Book”), which will include tabulations of failure rates and conditional failure probabilities for the full range of piping system components found in the Nordic light water reactor plants. Specifically the document addresses the different types of reliability parameters to be derived and certain aspects of the methodology on which the parameter estimation will be based.
The scope of the handbook includes small-bore (DN2 � 25 mm), medium-bore (25 < DN � 250 mm), and large-bore piping (DN > 250 mm) within the containment/ drywell, auxiliary and reactor buildings, turbine buildings, and other service buildings within the controlled area of a nuclear power plant. Included in the scope are carbon steel, low alloy steel, nickel base steel, and stainless steel piping components. Any piping system, whose failure can have an impact on routine plant operations, is considered in the scope of the R-Book.
1.1 Planning Steps Based on technical discussions and seminars within the framework of the Nordic PSA Group (NPSAG) planned activities during 2002-2005, a formal decision to launch the R-Book project was made in 2005. Funding for a planning phase was made available in December 2005. The results of the planning effort are presented in this report. The planning effort consisted of five technical elements:
1. Review of pipe failure databases and identification of technical features that are considered important to the statistical estimation processes that are considered for use in the R-Book development (Chapter 2).
2. Review of methods for piping reliability parameter estimation (Chapter 3).
3. Development, distribution and evaluation of a questionnaire that addresses user requirements on the planned R-Book (content, including level of detail, and updating philosophy) (Chapter 4).
4. Development, distribution and evaluation of a questionnaire that addresses the availability and access to piping exposure term data (piping system design information including weld counts and pipe length information organized by system, size, material, process medium, safety classification) (Chapter 5).
5. Detailed work plan for R-Book development, including cost, schedule, quality assurance, and analysis tools and techniques (Chapter 6).
1.2 Results of the Planning Phase Following a review during 2006-2007 of working documents prepared for each of the five technical elements identified above and a comment resolution phase, a detailed work plan with associated budget and schedule was approved during the second half of 2007. Key elements of the work plan are documented in Chapter 6. High-level
2 DN is the German designator for nominal pipe diameter in [mm]. This designator is also used in the Nordic countries for nominal pipe diameter.

2
presentations of the R-Book project, including technical progress reports will be given at forthcoming international conferences, including:
� ICONE-16 – 16th International Conference on Nuclear Engineering, May 11-15, 2008.
� Ninth International Probabilistic Safety Assessment and Management Conference (PSAM-9), 18-23 May, 2008.
� JRC and CSNI Conference on Risk-Informed Structural Integrity Management, June 2-4, 2008.
� American Society of Mechanical Engineers 2008 Pressure Vessels and Piping (PVP) Conference, 27-31 July 2008.
� International Topical Meeting on Probabilistic Safety Assessment & Analysis (PSA 2008), September 7-11, 2008.
1.3 Technical Scope of R-Book The R-Book will contain tabulations of piping reliability parameters that are organized by plant system, material (e.g., carbon steel, stainless steel) and nominal pipe diameter. In addition to the derived statistical parameters (e.g., mean, median, 5th and 95th percentiles) of pipe leak rates and rupture frequencies, the Handbook will also include qualitative information with respect to piping failure histories and the various structural integrity management programs that have been developed to address certain degradation mechanisms. The piping reliability parameters will be specialized in such a way that appropriate and reasonable account is taken of the Nordic design and inspection practices and service experience.
The R-Book is intended to be used in connection with practical PSA applications. Users of the Handbook values are responsible for how the applications are performed, including any data specialization beyond what is addressed by the Handbook.
1.4 Report Outline
The report consists of seven sections and ten attachments. In the main body of the report, one section is devoted to each of the five technical elements that address certain aspects of the R-Book scope and content. Chapter 7 includes a list of references.
The ten attachments include all the supporting documentation including the two questionnaires developed and evaluated as part of the R-Book scope definition. Attachment 7 includes the questionnaire prepared for the three Swedish utility organizations that are participating in and supporting the R-Book project. This questionnaire deals with the availability of and access to piping design information specific to the ten Swedish operating plants. Attachment 7 has not been translated into English.

3
2 Existing Pipe Failure Databases 2.1 Abstract
This chapter includes the results of a survey of existing pipe failure databases. It divides surveyed databases into three categories according to their fitness for use in risk-informed PSA applications: Category 0, 1 and 2. These categories relate to the ASME PSA Standard (ASME RA-Sb-2005) and the Nuclear Energy Institute’s PSA Peer Review Guidelines NEI 00-02 as indicated below.
ASME RA-Sb-2005 (November 2005)
PSA Capability Category I II III
NEI 00-02 PSA Peer Review Guidelines Grade 1,2 Grade 3 Grade 4
R-Book Database Categorization Cat0, Cat 1 (Cat1) Cat2 Cat2
Figure 2.1 Pipe Failure Database Categorization
At the highest level, a Category 2 (Cat2) database is expected to support Grade 3 or 4 PSA applications as defined in NEI-00-02. Associated with this database category are certain requirements for data processing, maintenance, validation and Quality Assurance. These requirements are tied to statistical data analysis tasks to obtain quantitative reliability parameters.
By contrast, a Category 0 (Cat0) database reflects a transitional phase in database development to establish updated perspectives on piping reliability and loss-of-coolant-accident frequencies relative to those developed by WASH-1400. These types of databases in general have not been subjected to independent validation and do not have any clearly stated quality objective.
Finally, a Category 1 (Cat1) database is intended for high-level evaluations of failure trends. It supports a multitude of qualitative and semi-quantitative evaluation tasks, and it usually has direct links to source data (for example, plant owners provide the input data directly to the database administrator). This type of database usually has a single user (person or organization), whereas a Category 2 database has (is intended to have) multiple users.
The survey is concerned with definitions of purpose (objectives and requirements for a database), piping component boundary definitions, validation, database management routines including quality assurance (QA), and fitness-for-use, including extent of demonstrated practical application and peer review. The survey also contrasts-and-compares databases that have found practical use.
Included in the survey are three examples of compilations of piping reliability parameters that have resulted from database applications: 1) BWR-specific weld failure rates extracted from Appendix D of NUREG-1829 [2.27], 2) raw water pipe failure rates and rupture frequencies extracted from EPRI Report No. 1012302 [2.9], and 3) pipe failure rates applicable to High Energy Line Break analysis [2.5].

4
2.2 Introduction
The usefulness of any component failure data collection depends on the way by which a stated purpose is translated into database design specifications and requirements for data input and validation, access rules, support and maintenance, and QA. In this chapter a survey is made of existing pipe failure data collections and their abilities to support risk informed PSA applications. Using insights and results from database development and application during 1995-2007, this survey also identifies database quality requirements against which conclusions are reached about past and current database development efforts and their relevance with respect to practical use by multiple users.
2.2.1 Database Categorization
In this survey, existing pipe failure databases are grouped in three categories according to their capability to support a particular risk-informed or risk-based application. Three database categories are defined - Cat0, Cat1 and Cat2 – and Figure 2.1 shows how these categories compare with the NEI “PSA Peer Review Guidelines” [2.17] grading and the “Capability Categories” of the ASME PRA Standard [2.26].
ASME RA-Sb-2005 (November 2005)
PSA Capability Category I II III
NEI 00-02 PSA Peer Review Guidelines Grade 1,2 Grade 3 Grade 4
R-Book Database Categorization Cat0, Cat1 (Cat1) Cat2 Cat2
Figure 2.1 Pipe Failure Database Categorization
2.2.2 Pipe Failure Database Features & Requirements
Over the years many different types of pipe failure databases have been developed [2.18 and 2.19]. Relative to intended use, maintenance/updating routines and QA, a distinction is made between “failure event database” and “reliability database”. The former is a collection of raw data (or field data) on specified types of piping components or piping systems with or without database QA program in place but with direct access to source data. Usually this type has a single user (can be a person or organization) with sporadic or periodic database maintenance, if any, to support high-level (possibly one-time or occasional) evaluations of failure trends. It is referred to as a Category 1 (Cat1) database in this survey. The latter type of database includes processed raw data, is continuously updated and subjected to validation for technical accuracy and completeness. Invariably this type of database has multiple users engaged in risk-informed applications or advanced applications (for example expanded risk-informed application to investigate certain correlations between degradation mitigation and failure rate). Some form of independent peer review normally precedes a release of such a database for routine application by multiple users. A QA program is (should) always be in place for reliability databases. It is referred to as a Category 2 (Cat2) database in this survey and should be viewed as an extension of a Category 1 database.

5
Industry guides and recommendations exist for Category 2 database development, structure and quality [2.16, 2.22 and 2.24]. Chapters 2 and 3 of SKIFS 2005:2 [2.25] address the need for quality assured failure data in the context of risk-informed in-service inspection (RI-ISI).
In risk-informed applications data quality is particularly important and necessitates considerations for traceability and reproducibility of derived reliability parameters: including the source data producing database query results and data processing and statistical analysis of query results. From a user perspective, a Category 2 database should include detailed and correct information on failure events so that database queries generate relevant and complete results. That is, detailed information with respect to reliability attributes and influence factors. Furthermore, provisions should exist for pooling of different but relevant subsets of failure data to strengthen the statistical significance of obtained parameters. In summary, a minimum set of requirements on a Category 2 database include:
� User-friendly and flexible structure, data input forms should be designed in such a way as to encourage continuous updating by multiple operators. The structure should be flexible so that new database fields can be added if so desired.
� Clear database field definitions that reflect the attributes and influence factors that are unique to pipe degradation and failure.
� Input of raw data supported by an extensive, all-inclusive set of roll-down menus with standardized and complete set of key words.
� “All-inclusive” structure in which free-format memo fields for narrative descriptions support codification and justifications for assumptions if needed.
� Support full traceability from field data to processed data so that database users and independent reviewers have full confidence in the completeness and accuracy of database field contents.
� Configuration control with strict user access rules.
� Use of recognized and proven computer program(s) so that the database structure and its content remain impervious to future program revisions and “upgrades.”
� Ease of transfer of database query results to external computer program (e.g., Microsoft® Excel or other approved statistical analysis program).
� Data security routines must be established to ensure that all relevant but potentially sensitive or proprietary failure information is captured in the database. Also routines must exist for proper sharing of information among multiple users.
� Detailed database documentation including coding guideline to ensure proper technology transfer. Reference [2.20] is an example of such documentation.
� Approved QA program. To be effective a QA program should reflect a consensus perspective on data quality. The prospective database users must have a common understanding of intended usage and steps that are required to ensure configuration control and validation of database records.
� Completeness of database should be ensured through continuous or at least periodic updating. Completeness is concerned with event populations and assurances that “all” relevant events are captured. It is also concerned with completeness of the

6
classification of each database record. Ultimately “completeness” has direct bearing on the statistical significance of derived reliability parameters.
This “requirements list” for a Category 2 database is not an all inclusive list. Depending on the number of database users and type of application additional requirements could be defined. Fundamentally a database for risk-informed applications must be robust in the sense that it must support a broad range of applications, including repeat applications, and provide analysts with a solid knowledgebase for database query definition. Ideally a reliability database should be self contained so that it includes all facts about the cause-and-consequence of any degraded condition recorded in it. Why was it recorded in the first place, what were the material specifications and operating conditions, and exactly where in a piping system did the failure occur?
The previous paragraphs described the defining features of Cat1 and Cat2 databases. There is a third type of database, which in this survey is referred to as Category 0 (Cat0) database. It is a hybrid database, which includes some of the features found in Category 1 and 2 databases, but it is not intended to exist as a standalone, computerized database for practical use beyond an original relatively narrowly defined objective. This type of database is typically embedded as extensive tables in a technical report, sometimes as an appendix, and provides traceable or non-traceable background to derived piping reliability parameters included in the main body of a technical report. Historically these published Category 0 databases have found widespread use in risk-informed applications, however. A data user’s parameter selections and justifications are rationalized by simply referencing a table in published report.
2.2.3 Reading guide
A pipe failure database needs to include information of certain type and content to support practical applications. Concentrating on risk-informed applications, Chapter 2.3 is an exposé of the types of piping reliability parameters that may be needed. This exposé gives a background to the analytical demands and requirements that may be imposed on a Category 2 database. Chapter 2.4 summarizes results and insights from the database survey. A list of references is found in Chapter 7. Attachment 1 includes a sample of database excerpts and Attachment 2 includes a high-level summary of the PIPExp-2007 database (it is the OPDE “parent database”). Attachment 3 includes information on the web based OPDE user interface. Attachment 4 includes examples of compilations of piping reliability parameters that have resulted from database application.
2.3 Piping Reliability Models & Data Requirements
In this survey a “database” implies a collection of failure event information relating to a defined area of knowledge and application, organized so as to be available to analysts engaged in statistical analysis for the purpose of deriving equipment reliability parameters. To paraphrase the “Handbook on Quality of Reliability Data” [2.22], in applied risk and reliability analysis a database is a computerized “filing system” organized and constantly updated to contain data that describe degradation susceptibilities and failures of components as a function of time. As background to the survey of existing pipe failure databases, the types of piping reliability parameters needed for risk-informed applications are outlined below.

7
2.3.1 Reliability Parameters
A simple model of piping reliability components makes use of nuclear power plant reliability models originally developed to investigate alternative inspection strategies for different piping systems. Equation (1) is a representation of this model:
ik
M
kxikik
M
kikxix IFRP
ii
����
��11
}{��� (1)
Where:
�ix = Total “rupture” frequency for pipe component i for rupture mode x. A “rupture” corresponds to significant structural failure with through-wall flow rate well in excess of Technical Specification limits (see below for further details). The term “rupture” is nebulous: apart from implying a structural failure it does not convey information about its significance (for example, through-wall flow rate).
�ikx = Rupture frequency of pipe component i due to damage mechanism k for failure mode x.
�ik = Failure rate of pipe component i due to damage mechanism k.
Pik{Rx|F} = Conditional probability of “rupture” mode x given failure for pipe component I and damage mechanism k.
Mi = Number of different damage mechanisms for component i.
Iik = Integrity management factor for component i and damage or degradation mechanism k; this factor adjusts the rupture frequency to account for variable integrity management strategies such as leak detection, volumetric non-destructive examination (NDE), etc. that might be different than the components in a pipe failure database.
The term “failure” implies any degraded state requiring remedial action: from part through-wall crack, pinhole leak, leak, large leak to a significant, incapacitating structural failure. Types of remedial actions include repair (temporary or permanent), in-kind replacement or replacement using new, more resistant material. Depending on how this model of piping reliability is to be used, the precise definition of failure may be, and usually is, important. For example, it may be important to make distinction between different through-wall flaw sizes and their localized effects or global effects on plant operation. Localized effects include collateral damage (for example, damage to adjacent line or a jet stream causing damage to adjacent pipe insulation). Global effects include flooding of equipment areas or buildings. In recent risk-informed applications (as identified in Chapter 2.4, Table 2.4) the following definitions of pipe “rupture” modes defined in Table 2.1 have been used.

8
Table 2.1 Example of Pipe “Rupture” Definitions
“Rupture” Mode (x)
Equivalent Pipe Break Diameter (EBD) [mm]
Peak Through-wall Flow Rate (FR) [kg/s]
Large Leak 15 < EBD � 50 0.5 < FR � 5
Small Breach 50 < EBD � 100 5 < FR � 20
Breach 100 < EBD � 250 20 < FR � 100
Large Breach 250 < EBD � 500 100 < FR � 400
Major Breach EBD > 500 FR > 400
PSA applications often require assessments of well differentiated pipe failure modes. For example, in internal flooding PSA it could be necessary to evaluate impacts of specific spray events on adjacent, safety-related equipment. Hence, initiating event frequency of a “large leak” could be required or any through-wall flaw of sufficient size to generate a spray effect. Another example could be the plant-specific assessment of a high-energy line break (HELB) initiating event of sufficient magnitude to activate fire protection sprinklers in a specific area of a Turbine Building.
In general, a point estimate of the frequency of pipe failure, �ik, is given by the following expression:
iiik
ikik TNf
n�� (2)
Where
nik = The number of failures (all modes including cracks, leaks and ruptures are included) events for pipe component i due to damage mechanism k.
Ti = The total exposure time over which failure events were collected for pipe component i normally expressed in terms of reactor years (or calendar years).
Ni = The number of components per reactor year that provided the observed pipe failures for component i.
fik = The fraction of number of components of type i that are susceptible to failure from degradation/damage mechanism (DM) “k” for conditional failure rates given susceptibility to DM “k”, this parameter is set to 1 for unconditional failure rates.
When the parameter fik is applied the resulting failure rates and rupture frequencies are referred to as conditional failure rates as they are conditional on the susceptibility of the component to specific damage mechanisms. That is, for each component that these models are applied to, the damage mechanism susceptibility is known.
When the damage mechanism susceptibility is not known in advance the above equations are combined under the condition: fik = 1 to obtain the following expression for the point estimate of the rupture frequency:

9
� ik
M
kxik
ii
ikik
M
kxikik
M
kikxix IFRP
TNn
IFRPiii
������
���111
}{��� (3)
Depending on the type of piping system under consideration, the conditional failure probability may be obtained by direct statistical estimation, or through probabilistic fracture mechanics (PFM), or expert judgment. Ultimately an estimated conditional failure probability needs to reflect existing service experience as well as structural integrity characteristics.
A Bayesian approach can be used to develop uncertainty distributions for the parameters in Equations (1) through (3). Prior distributions are developed for the parameters �ik and Pik{RxF} and these prior distributions are updated using the evidence from the failure and exposure data as in standard Bayes’ updating. The resulting posterior distributions for each parameter on the right side of Equation (1) are then combined using Monte Carlo sampling to obtain uncertainty distributions for the pipe “rupture” frequency as illustrated in Figure 2.2, which is reproduced from Reference [2.7]
Figure 2.2 Bayes’ Estimates of Pipe Failure Rates and “Rupture” Frequencies
For the conditional pipe failure probability, four approaches are used, 1) direct statistical estimation, 2) PFM, 3) expert judgment, or 4) combined approach using insights from data analysis, PFM and expert judgment. A limitation of the first approach is the dearth of data associated with major failure of piping that exhibits leak-before-break (LBB) characteristics. Different PFM algorithms have been developed and it is an area that continues to evolve. In general there are issues of dispute with respect to reconciliation

10
of results obtained through direct statistical estimation versus PFM. A recent example of an application of expert judgment is documented in NUREG-1829 [2.27]
The chart in Figure 2.3 represents one perspective on conditional pipe failure probability. It includes plots of field experience data organized by observed through-wall peak leak or flow rate in kg/s. The given rates are threshold values. Given that a certain piping system is subject to degradation, what is the likelihood that a pipe flaw remains undetected and grows to produce a through-wall liquid or steam release of a certain magnitude? The ordinate of the chart shows the fraction of pipe failure of a certain class (ASME Code Class 1, 2, 3, or non-Code) and of certain magnitude (expressed as the peak leak/flow rate threshold value) to all failures in the class. It indicates how often a pipe failure of a certain magnitude has occurred according to existing historical data. The abscissa shows the observed through-wall liquid or steam peak flow rate threshold value.
1.0E-04
1.0E-03
1.0E-02
1.0E-01
1.0E+00
�� �� �� ����� �� ���� �� ���� �� ���� �� ���� �� ��� �� ��� �� ��� �� ����
Through-Wall Flow Rate [kg/s]
Con
ditio
nal F
ailu
re P
roba
bilit
y
Aggregate State-of-Knowledge (NUREG-1829) Observed - Code Class 1 Piping Observed - Code Class 2 PipingObserved - Code Class 3 Piping Observed - FAC Susceptible Piping - BBL Beliczey-Schulz (1987) - Code Class 1 and 2
Figure 2.3 Likelihood of Pipe Failure According to Service Data & Theoretical
Studies
According to the above figure, a Turbine Building (“FAC Susceptible”) piping system failure is considerably more likely to produce a significant through-wall flaw than a safety-related piping system. Superimposed on the empirical data plots are the recent aggregate state-of-knowledge correlation from NUREG-1829 [2.27] and the “Beliczey-Schulz correlation” [2.2].
The empirical data used to construct the chart in Figure 2.3 represents 9,547 commercial react-years of operation as of 31-December-2005, including a total of 6,547 pipe failures as recorded in the PIPExp database. More details about this data source are found below and in Chapter 2.4, Table 2.4.

11
� For Code Class 1 piping the most severe failures to date have involved small-diameter piping. Of all failures involving through-wall flaws about 14% involve socket weld failures in DN20 and DN25 stainless steel lines. So far the largest observed through-wall flow rate is about 8 kg/s.
� Failure of large-diameter, thick walled Class 1 piping is unlikely. A primary reason for this is presence of mid-wall compressive residual stresses that tend to retard deep cracks.
� To date, there have been six Code Class 1 pipe failures involving > DN50 piping and > 6.3 � 10-2 kg/s peak leak/flow rate.
� For breaches in small-diameter, Class 1 piping observed flow rates are in general smaller or considerably smaller than the maximum theoretical possible flow rates. In part this explained by the flow restricting devices that are installed to minimize a through-wall flow rate given a severed pipe.
� The plots in Figure 2.3 are based on observed peak flow rates. In Class 1 piping and connecting Class 2 piping, the cracks that develop in the through-wall direction tend to be very tight producing only minor visible leakages, if any, while at full operating pressure. As the reactor is depressurized and shut down a through-wall crack tends to decompress so that a detectable leak develops and increases over time. As an example a thermal fatigue induced weld flaw at the U.S. PWR plant Oconee Unit 1 in April 1997 was initially diagnosed to be on the order of 0.16 kg/s at full reactor power. According to the event chronology, a manual reactor shutdown commenced on 21 April, 1997 at 2245 hours with through-wall leakage of 0.17 kg/s. On 22 April, 1997 at 1250 hours the reactor was tripped and at 1600 hours on the same day the through-wall leakage peaked at 0.75 kg/s
� The failures involving Code Class 2 and 3 and non-Code piping cover a significantly broader range of pipe sizes than does the Code Class 1 group.
The five data points in Figure 2.3 that represent the “Beliczey-Schulz” correlation correspond to a failed DN15, DN20, DN25, DN50 and DN100 pipe in a PWR, respectively. According to Table 2.2, reproduced from NUREG-1829 [2.27], at full primary pressure (about 15 MPa), a break in a DN100 pipe would generate a liquid peak through-wall flow rate of about 545 kg/s (or about 8,600 gpm).
Table 2.2 Through-wall Flow Rate to Break Size Correlations for Code Class 1 Piping
Equivalent Break Size BWR Liquid Release PWR Liquid Release
Diameter [mm]
Area [in2]
Flow Rate [gpm]
Flow Rate Flux [gpm/in2]
Flow Rate [gpm]
Flow Rate Flux [gpm/in2]
15 0.19635 116.8 595 134.9 687 25 0.78539 467.3 595 539.5 687 50 3.14159 1869.2 595 2158.2 687 75 7.06858 4205.8 595 4856.1 687 100 12.56637 7476.9 595 8633.1 687 150 28.27433 16823.2 595 19424.5 687 200 50.26548 29907.9 595 32220.2 641 250 78.53982 29452.4 375 50344.0 641

12
Table 2.2 Through-wall Flow Rate to Break Size Correlations for Code Class 1 Piping
Equivalent Break Size BWR Liquid Release PWR Liquid Release
Diameter [mm]
Area [in2]
Flow Rate [gpm]
Flow Rate Flux [gpm/in2]
Flow Rate [gpm]
Flow Rate Flux [gpm/in2]
300 113.0973 42411.5 375 72495.4 641 400 201.0619 75398.2 375 128880.7 641 750 706.8583 265071.9 375 453096.2 641 Based on:
- Moody, F.J., “Maximum Flow Rate of a Single Component, Two Phase Mixture,” Trans. J. Heat Transfer, 86:134-142, February 1965. Applies to medium-and large-diameter piping.
- Zaloudek, F.R., The Low Pressure Critical Discharge of Steam-Water Mixtures from Pipes, HW-68934, Hanford Works, Richland (WA), 1961. Applies to small-and medium-diameter piping.
1 gpm = 6.3 � 10-2 kg/s
According to Equation (4) [2.2], the conditional failure probability of a through-wall flaw producing a peak flow rate of about 545 kg/s is approximately 1.8E-3. Equation (4) reflects a German perspective on the conditional pipe failure probability based on service experience as of the mid-1980s, PFM and experimental fracture mechanics studies.
Pik{Rx|F} = (9.6 � DN/2.5 + 0.4 � DN2/25)-1 (4) Where DN = nominal pipe diameter [mm]
The aggregate state-of-knowledge correlation from NUREG-1829 [2.27] represents the results of an expert elicitation process. It applies to BWR primary system piping and is derived from Figure 7.6 in NUREG-1829 using a total pipe failure rate (including all Class 1 systems, small-, medium- and large-diameter piping components) of 3.0 � 10-2 per reactor-year. Based on the information embedded in Figure 2.3 above it appears appropriate to use direct statistical estimation for non-Code piping when calculating conditional pipe failure probabilities of major structural failures. Unless PFM were to be used, some form of data extrapolation is required when using direct statistical estimation for safety-related piping, however. The question then becomes how to perform such extrapolations and how to characterize the state-of-knowledge uncertainty. In case PFM is used for estimating a conditional pipe failure probability it becomes important to reconcile the output against applicable service experience and known degradation and/or damage susceptibility.
Bayesian methodology is a practical way of defining a prior conditional failure probability uncertainty distribution that uses a bounding-type analysis where the uncertainty is expressed by a Beta Distribution. As an example, for Code Class 1 piping the prior A-parameter is fixed at 1 and the prior B-parameter is chosen so that the prior mean value corresponds to an appropriate mean value of the “aggregate state-of-knowledge” correlation in Figure 2.3.

13
The Beta Distribution takes on values between 0 and 1 and is defined by the two parameters “A” and “B” (some texts refer to these as “Alpha” and “Beta”). It is often used to express the uncertainty in the dimensionless probabilities such as MGL common cause failure parameters and failure rates per demand. The mean of the Beta Distribution is given by:
Mean = A/(A + B) (5)
If A = B + 1, the Beta Distribution takes on a flat distribution between 0 and 1. If A = B = ½, the distribution is referred to as Jeffrey’s non-informative prior and is a U-shaped distribution with peaks at 0 and 1. Expert opinion can be incorporated by selecting A and B to match up with an expert estimate of the mean probability. For example, to represent an expert estimate of 1�10-2, A = 1 and B = 99 can be selected. These abstract parameters A and B can be associated with the number of failures and the number of successes in examining service data to estimate the failure probability on demand. The sum “A+B” represents the total number of trials.
The Beta Distribution has some convenient and useful properties for use in Bayes’ updating. A prior distribution can be assigned by selecting the initial parameters for A and B, denoted as APrior and BPrior. Then when looking at the relevant service data, if there are “N” failures and “M” successes, the Bayes updated, or posterior distribution is also a Beta Distribution with the following parameters:
APost = APrior + N (6) BPost = BPrior + M (7)
The above explains how the Beta Distribution can be used to estimate conditional pipe “rupture” probabilities. For piping exhibiting leak-before-break (LBB) characteristics the priors are selected to represent engineering estimates of the probabilities “prior” to the collection of evidence. Equations (6) and (7) are used to calculate the parameters of the Bayes’ updated (posterior) distribution after applying the results of a database query to determine N and M. N corresponds to the number of “ruptures” in some specialized combination of pipe size and material and M corresponds to the total number of failures that do not result in “rupture” in the corresponding pipe size/material combination. This model assumes that all pipe failures are precursors to pipe rupture.
Selecting appropriate “A” and “B” parameters is not a trivial task. Many different parameter combinations will produce the same mean value. Insights from probabilistic fracture mechanism could be utilized in defining application- and location-specific “A’ and “B” parameters. Another approach would be to utilize the empirical correlations in Figure 2.2. According to this figure a peak through-wall flow rate threshold value of � > 380 kg/s corresponds to a “Major Breach” with a mean conditional failure probability of about 5.0 � 10-4, which would be our prior mean value given A = 1 and B = 1999. Assuming an analyst has access to a sufficiently complete and detailed pipe failure database, the shape of the posterior uncertainty distribution would be determined by the applicable service experience.
For piping that exhibits break-before-leak (BBL) characteristics, such as turbine building piping with susceptibility to FAC, it is proposed that the prior Beta Distribution parameters are derived directly from the empirical data. Consistent with the above, for a “Major Breach” the corresponding prior parameters would be A = 1 and B = 159, with a mean value of 6.3 � 10-3.

14
2.3.2 Assessment of Inspection Effectiveness
Markov modeling enables the analysis of interactions between degradation and damage mechanisms that cause pipe failure, and the inspection, detection and repair strategies that can reduce the probability that failure occurs, or that cracks or leaks will progress to major structural failure before being detected and repaired [2.10].
This Markov modeling technique starts with a representation of a “system” in a set of discrete and mutually exclusive states. The states refer to various degrees of piping system degradation; that is, the existence of flaws, leaks or major structural failure. The flaws can be pipe wall thinning or circumferential cracking of a weld heat affected zone. Figure 2.4 is a representation of a general four-state Markov model of piping reliability.
The state transition parameters of the Markov model can be estimated directly from service data. The model can be used to investigate the time dependence of pipe failure frequencies and the impact of alternative ISI and leak inspection strategies. Figure 2.5 shows an example of time-dependent piping reliability and how it is affected by ISI.
Piping Reliability States: S = Success (or undamaged state); C = Crack (non-through wall flaw); F = Leaking through-wall flaw (leak rate is within
Technical Specification limit); L = Large leak (leak rate in excess, or well in excess of
Technical Specification limit).
State Transitions:
� Occurrence of non-through wall flaw
�S Occurrence of small leak given an undamaged state (‘S’)
�C Occurrence of small leak given a flaw (‘C’)
�S Occurrence of large leak given no flaw
�C Occurrence of large leak given a non-through wall flaw
�F Occurrence of large leak given a small leak
� Detect and repair a through-wall flaw
� Inspect and repair a non-through wall flaw
Figure 2.4 Four-State Markov Model of Piping Reliability
�C
�
S
C
F
L
� F
�
�
� C � S
� S

15
1.0E-08
1.0E-07
1.0E-06
1.0E-05
1.0E-04
1.0E-03
0 10 20 30 40 50 60
Plant Age [Years]
Elbo
w "
Larg
e Le
ak"
Freq
uenc
y [1
/Elb
ow.C
alen
dar.Y
ear]
No ISI
ISI - POD = 0.9
Figure 2.5 Example of Time-Dependent Pressure Boundary Breach Frequency
2.3.3 Data Specializations
Pipe failure is a function of interrelationships between pipe size (diameter and wall thickness), material, flow conditions, pressure & temperature, method of fabrication, loading conditions, weld residual stresses, etc. These relationships should be embedded in a reliability database and accessible for parametric evaluations. For circumferential welds their location within a piping system and residual stresses represent strong reliability influence factors. It is sometimes necessary to develop specialized weld failure rates to account for these influences. For a weld of type “i” and size “j” (defined by the nominal pipe diameter) the failure rate can be expressed as follows:
�ij = Fij/(Wij � T) (8) and with Sij = Fij / Fj (9) Aij = Wj/Wij (10) the failure rate of weld of type “i” and size “j” is expressed as �ij = (Fj � Sij)/(Wij � T) (11) �ij = Sij � Aij� �j (12) Where:
�ij = Failure rate of a susceptible weld of type “i”, size “j”.
�j = Failure rate of a susceptible weld of size ‘j’.
Fj = Number of size “j” weld failures.
Fij = Number of type “i” and size “j” weld failures.
Wj = Size “j” weld count.

16
Wij = Type “i” and size “j” weld count.
Susceptibility (Sij)
= The service experience shows the failure susceptibility to be correlated with the location of a weld relative to pipe fittings and other in-line components (flanges, pump casings, valve bodies). For a given pipe size and system, the susceptibility is expressed as the fraction of welds of type “ij” that failed due to a certain degradation mechanism). This fraction is established by querying the database.
Attribute (Aij) = In the above expressions the attribute (A) is defined as the ratio of the total number of welds of size “j” to the number of welds of type “i”. Aij is a correction factor and accounts for the fact that piping system design & layout constraints impose limits on the number of welds of a certain type. For example, in a given system there tends to be more elbow-to-pipe welds than, say, pipe-to-tee welds.
Combining a global (or averaged) failure rate with the weld configuration dependency provides failure rates that account for known or assumed residual stresses. Typically, a final weldment attaching a spool piece to, say, a heat exchanger nozzle or vessel nozzle tends to be the most vulnerable weld assembly in a piping system.
2.3.4 Summary
Pipe failure rate estimation involves querying a database for event populations (number of failures) and corresponding exposure terms or component populations (number of components from which the failure data are collected). Beyond these basic sets of information and depending on the specific type of risk-informed application, additional supporting and specialized information on pipe failure is needed. Database development must go hand-in-hand with practical applications to ensure that structure and content is sufficiently complete and compatible with the needs of analysts.
The next chapter summarizes the results of a survey of pipe failure databases. It provides insights about database structures, database content and the importance of data validation. Can the results of applications of existing databases be trusted?
2.4 Results of Survey
Results of the survey of selected pipe failure databases are summarized in this chapter. Included in the survey are Category 0 and Category 2 databases. Most of the identified databases have supported some level of risk-informed PSA application. Category 1 databases are not included in this survey. Several such databases are known to exist (see for example References [2.1 and 2.11]) but they are not normally available for independent reviews, however.
2.4.1 Survey Format
The survey results are summarized in Table 2.3 (older Category 0 databases) and Table 2.4 (Category 2 databases and recent Category 0 databases). Each database is reviewed against 22 attributes:
1. Software used to develop database.

17
2. Database category (Category 0 or Category 2).
3. Availability for use by practitioners.
4. Access control and data security.
5. Nuclear power plant population covered in database.
6. Data collection period.
7. Reactor critical years covered in database.
8. Component boundary and component types addressed by database.
9. Number of pipe failure records.
10. Number of “major” structural failures included in database.
11. Information on through-wall leak/flow rates, duration of event, and total amount of process medium released.
12. Flaw size data (for example, crack depth and length and crack orientation, size and shape of through-wall flaw).
13. Pipe dimensional data (diameter and wall thickness).
14. Pipe stress intensity data; for example, stress intensity factors (kI) for flawed pipe and critical stress intensity factors (kIc). The ratio kI/kIc is a measure of margin to significant structural failure given a degraded state. This type of information is included in relief requests for temporary repair of degraded piping.
15. Number of database fields.
16. Database updating and maintenance policy.
17. Source data archive (for independent verification of processed data).
18. Extent of verification and validation.
19. Component population data included in database.
20. Plant population data included in database.
21. Information on location of degradation/failure in a piping system; includes identification of plant building/area (for example, drywell, reactor building, auxiliary building, turbine building, as well as location identified by reference to isometric drawing coordinate or component identity).
22. In-service inspection information/history; this information provides an indication of ISI reliability (for example, did a previous inspection fail to identify a degraded state, and if so, why did it happen?).

18
Tabl
e 2.
3 Ex
ampl
es o
f Cat
egor
y 0
Pipe
Fai
lure
Dat
abas
es
DA
TA
BA
SE
D
AT
AB
ASE
A
TT
RIB
UT
E
AE
CL
-Mis
c-20
4 (1
981)
[2.1
4]
NU
RE
G/C
R-4
407
(198
7) [2
.28]
E
GG
-SSR
E-9
639
(199
1) [2
.6]
EPR
I TR
-100
380
(199
2) [2
.13]
N
UR
EG
/CR
-575
0 (1
999)
[2.2
3]
Softw
are
N/A
(Not
App
licab
le)
N/A
N
/A
dBas
e II
I Plu
s
The
stru
ctur
e of
the
data
base
is
des
crib
ed in
Cha
pter
3 o
f TR
-100
380
N/A
Ava
ilabi
lity
Res
trict
ed
Publ
ic d
omai
n Pu
blic
dom
ain
For E
PRI m
embe
rs o
nly
Publ
ic d
omai
n
Acc
ess c
ontro
l & d
ata
secu
rity
N/A
N
/A
N/A
Te
chni
cal r
epor
t is a
vaila
ble
for d
ownl
oad
via
pass
wor
d pr
otec
ted
EPR
I web
site
N/A
Com
mer
cial
Nuc
lear
Po
wer
Pla
nt (N
PP)
Popu
latio
n
U.S
. BW
R &
PW
R
U.S
. BW
R &
PW
R
U.S
. BW
R &
PW
R
U.S
. BW
R &
PW
R
U.S
. BW
R &
PW
R
Dat
a C
olle
ctio
n Pe
riod
1960
-198
1 19
60-1
984
1960
-199
0 19
60-1
986
1969
-199
7
Rea
ctor
Crit
ical
Yea
rs
Expe
rienc
e co
vere
d 40
9 80
0 1,
270
1,03
0 2,
100
Com
pone
nt b
ound
ary
and
com
pone
nt ty
pes
Any
pas
sive
, met
allic
and
no
n-m
etal
lic (e
.g.,
rubb
er
expa
nsio
n jo
int,
PVC
pi
ping
) pip
ing
and
non-
pipi
ng c
ompo
nent
Any
met
allic
pip
ing
com
pone
nt
Any
met
allic
and
non
-m
etal
lic p
ipin
g (e
.g.,
rubb
er e
xpan
sion
join
t, PV
C p
ipe)
and
pas
sive
, no
n-pi
ping
com
pone
nt
(e.g
., va
lve
body
, H/X
sh
ell,
H/X
-tube
, ves
sel)
Any
met
allic
pip
ing
com
pone
nt
Any
met
allic
pip
ing
com
pone
nt

19
Tabl
e 2.
3 Ex
ampl
es o
f Cat
egor
y 0
Pipe
Fai
lure
Dat
abas
es
DA
TA
BA
SE
D
AT
AB
ASE
A
TT
RIB
UT
E
AE
CL
-Mis
c-20
4 (1
981)
[2.1
4]
NU
RE
G/C
R-4
407
(198
7) [2
.28]
E
GG
-SSR
E-9
639
(199
1) [2
.6]
EPR
I TR
-100
380
(199
2) [2
.13]
N
UR
EG
/CR
-575
0 (1
999)
[2.2
3]
Num
ber o
f Fai
lure
R
ecor
ds
840
87 fa
ilure
s wer
e in
terp
rete
d to
be
“sev
eran
ces”
No
med
ium
- or l
arge
-di
amet
er p
ipe
“sev
eran
ces”
19
Lim
ited
to “
sign
ifica
nt”
thro
ugh-
wal
l fla
ws (
leak
s an
d “r
uptu
res”
)
591
Lim
ited
to th
roug
h-w
all
flaw
s (le
aks a
nd
“rup
ture
s”)
Incl
udes
safe
ty-r
elat
ed a
nd
non
safe
ty-r
elat
ed p
ipin
g
694
Cla
ss 1
: 321
Cla
ss 2
: 180
Cla
ss 3
: 58
Non
-Cod
e: 1
35
54
Lim
ited
to “
sign
ifica
nt”
thro
ugh-
wal
l fla
ws i
n C
lass
1
pipi
ng
Num
ber o
f rec
ords
on
“maj
or”
stru
ctur
al
failu
re N
OTE
1
2 18-in
ch fe
edw
ater
pip
e br
eak
at In
dian
Poi
nt-2
8-in
ch e
xpan
sion
join
t at
Fort
Cal
houn
0 17
40
Thes
e ar
e lis
ted
in th
e m
ain
body
of t
he re
port
0
Info
rmat
ion
on th
roug
h-w
all l
eak/
flow
rate
N
o Y
es
Yes
Y
es
Yes
Flaw
size
dat
a N
o N
o N
o N
o N
o
Pipe
dim
ensi
onal
dat
a (Y
es) N
OTE
2
(Yes
) (Y
es)
(Yes
) (Y
es)
Stre
ss in
tens
ity d
ata
No
No
No
No
No
Num
ber o
f dat
abas
e fie
lds
13
4 11
51
8
Stat
ed u
pdat
ing
/ m
aint
enan
ce p
olic
y an
d pr
ogra
m
N/A
N
/A
N/A
Y
es
See
Ref
eren
ce [2
.6] f
or
deta
ils. A
n up
date
was
pe
rfor
med
in 1
993
to in
clud
e pi
pe fa
ilure
dat
a fo
r the
per
iod
1987
-199
1
Yes
NO
TE 3
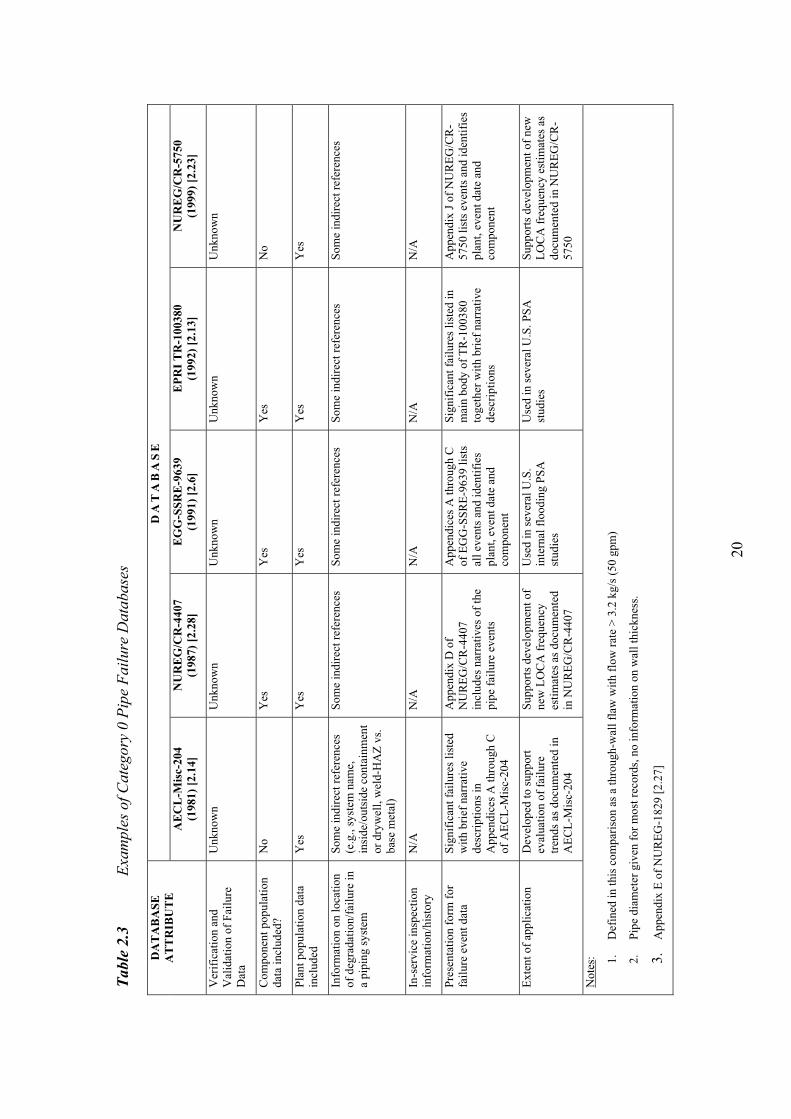
20
Tabl
e 2.
3 Ex
ampl
es o
f Cat
egor
y 0
Pipe
Fai
lure
Dat
abas
es
DA
TA
BA
SE
D
AT
AB
ASE
A
TT
RIB
UT
E
AE
CL
-Mis
c-20
4 (1
981)
[2.1
4]
NU
RE
G/C
R-4
407
(198
7) [2
.28]
E
GG
-SSR
E-9
639
(199
1) [2
.6]
EPR
I TR
-100
380
(199
2) [2
.13]
N
UR
EG
/CR
-575
0 (1
999)
[2.2
3]
Ver
ifica
tion
and
Val
idat
ion
of F
ailu
re
Dat
a
Unk
now
n U
nkno
wn
Unk
now
n U
nkno
wn
Unk
now
n
Com
pone
nt p
opul
atio
n da
ta in
clud
ed?
No
Yes
Y
es
Yes
N
o
Plan
t pop
ulat
ion
data
in
clud
ed
Yes
Y
es
Yes
Y
es
Yes
Info
rmat
ion
on lo
catio
n of
deg
rada
tion/
failu
re in
a
pipi
ng sy
stem
Som
e in
dire
ct re
fere
nces
(e
.g.,
syst
em n
ame,
in
side
/out
side
con
tain
men
t or
dry
wel
l, w
eld-
HA
Z vs
. ba
se m
etal
)
Som
e in
dire
ct re
fere
nces
So
me
indi
rect
refe
renc
es
Som
e in
dire
ct re
fere
nces
So
me
indi
rect
refe
renc
es
In-s
ervi
ce in
spec
tion
info
rmat
ion/
hist
ory
N/A
N
/A
N/A
N
/A
N/A
Pres
enta
tion
form
for
failu
re e
vent
dat
a Si
gnifi
cant
failu
res l
iste
d w
ith b
rief n
arra
tive
desc
riptio
ns in
A
ppen
dice
s A th
roug
h C
of
AEC
L-M
isc-
204
App
endi
x D
of
NU
REG
/CR
-440
7 in
clud
es n
arra
tives
of t
he
pipe
failu
re e
vent
s
App
endi
ces A
thro
ugh
C
of E
GG
-SSR
E-96
39 li
sts
all e
vent
s and
iden
tifie
s pl
ant,
even
t dat
e an
d co
mpo
nent
Sign
ifica
nt fa
ilure
s lis
ted
in
mai
n bo
dy o
f TR
-100
380
toge
ther
with
brie
f nar
rativ
e de
scrip
tions
App
endi
x J o
f NU
REG
/CR
-57
50 li
sts e
vent
s and
iden
tifie
s pl
ant,
even
t dat
e an
d co
mpo
nent
Exte
nt o
f app
licat
ion
Dev
elop
ed to
supp
ort
eval
uatio
n of
failu
re
trend
s as d
ocum
ente
d in
A
ECL-
Mis
c-20
4
Supp
orts
dev
elop
men
t of
new
LO
CA
freq
uenc
y es
timat
es a
s doc
umen
ted
in N
UR
EG/C
R-4
407
Use
d in
seve
ral U
.S.
inte
rnal
floo
ding
PSA
st
udie
s
Use
d in
seve
ral U
.S. P
SA
stud
ies
Supp
orts
dev
elop
men
t of n
ew
LOC
A fr
eque
ncy
estim
ates
as
docu
men
ted
in N
UR
EG/C
R-
5750
Not
es: 1.
Def
ined
in th
is c
ompa
rison
as a
thro
ugh-
wal
l fla
w w
ith fl
ow ra
te >
3.2
kg/
s (50
gpm
)
2.
Pipe
dia
met
er g
iven
for m
ost r
ecor
ds, n
o in
form
atio
n on
wal
l thi
ckne
ss.
3.
App
endi
x E
of N
UR
EG-1
829
[2.2
7]

21
Tabl
e 2.
4 Ex
ampl
es o
f Rec
ent C
ateg
ory
0 an
d C
ateg
ory
2 Pi
pe F
ailu
re D
atab
ases
DA
TA
BA
SE
D
AT
AB
ASE
A
TT
RIB
UT
E
SKI 9
6:20
(1
996)
[2.4
] E
PRI T
R-1
1010
2 (1
997)
[2.3
] E
PRI T
R-1
1188
0 (1
999)
[2.1
5] N
OT
E 1
PI
PExp
(2
007)
NO
TE
2
OPD
E 2
007:
2 (2
007)
[2.2
0]
Softw
are
Mic
roso
ft® A
cces
s M
icro
soft®
Acc
ess
Mic
roso
ft® A
cces
s M
icro
soft®
Acc
ess
Mic
roso
ft® A
cces
s with
W
eb b
ased
use
r int
erfa
ce
(App
endi
x C
incl
udes
furth
er
deta
ils)
Cat
egor
y C
ateg
ory
0 (A
ppen
dix
A in
clud
es
furth
er d
etai
ls)
Cat
egor
y 0
(App
endi
x A
incl
udes
fu
rther
det
ails
)
Cat
egor
y 0
Cat
egor
y 2
Cat
egor
y 2
Ava
ilabi
lity
EPR
I mem
bers
onl
y N
OTE
3
EPR
I mem
bers
onl
y N
OTE
3
N/A
– se
e N
ote
4 Pr
oprie
tary
- O
PDE
“par
ent
data
base
” R
estri
cted
to O
PDE
proj
ect
mem
bers
Acc
ess c
ontro
l & d
ata
secu
rity
Unc
lear
Te
chni
cal r
epor
t is
avai
labl
e fo
r dow
nloa
d vi
a pa
ssw
ord
prot
ecte
d EP
RI
web
site
N/A
– se
e N
ote
4 Pa
ssw
ord
prot
ecte
d, se
cure
lo
catio
n D
ata
resi
des o
n N
ucle
ar
Ener
gy A
genc
y’s s
ecur
e se
rver
, acc
ess i
s pas
swor
d pr
otec
ted
Com
mer
cial
Nuc
lear
Po
wer
Pla
nt (N
PP)
Popu
latio
n
U.S
. BW
R &
PW
R
U.S
. BW
R &
PW
R
U.S
. BW
R &
PW
R
NPP
s wor
ldw
ide:
BW
R,
PWR
, HW
R/C
AN
DU
, RB
MK
N
PPs w
orld
wid
e: B
WR
, PW
R, H
WR
/CA
ND
U, R
BM
K
Dat
a C
olle
ctio
n Pe
riod
1961
-199
5 19
61-1
997
1961
-199
5 19
70 to
dat
e 19
70 to
dat
e
Rea
ctor
Crit
ical
Yea
rs
Expe
rienc
e co
vere
d 2,
100
2,30
0 2,
100
Ca.
10,
300
Ca.
7,3
85
Com
pone
nt b
ound
ary
and
com
pone
nt ty
pes
Any
met
allic
and
non
-m
etal
lic p
ipin
g (e
.g.,
rubb
er e
xpan
sion
join
t, PV
C p
ipe)
and
pas
sive
, no
n-pi
ping
com
pone
nt
(e.g
., va
lve
body
, H/X
sh
ell,
H/X
-tube
, ves
sel)
Any
met
allic
and
non
-m
etal
lic p
ipin
g (e
.g.,
rubb
er e
xpan
sion
join
t, PV
C p
ipe)
and
pas
sive
, no
n-pi
ping
com
pone
nt
(e.g
., va
lve
body
, H/X
sh
ell,
H/X
-tube
, ves
sel)
Any
met
allic
and
non
-m
etal
lic p
ipin
g (e
.g.,
rubb
er e
xpan
sion
join
t, PV
C p
ipe)
and
pas
sive
, no
n-pi
ping
com
pone
nt
(e.g
., va
lve
body
, H/X
sh
ell,
H/X
-tube
, ves
sel)
Met
allic
pip
ing
com
pone
nts
Met
allic
pip
ing
com
pone
nts

22
Tabl
e 2.
4 Ex
ampl
es o
f Rec
ent C
ateg
ory
0 an
d C
ateg
ory
2 Pi
pe F
ailu
re D
atab
ases
DA
TA
BA
SE
D
AT
AB
ASE
A
TT
RIB
UT
E
SKI 9
6:20
(1
996)
[2.4
] E
PRI T
R-1
1010
2 (1
997)
[2.3
] E
PRI T
R-1
1188
0 (1
999)
[2.1
5] N
OT
E 1
PI
PExp
(2
007)
NO
TE
2
OPD
E 2
007:
2 (2
007)
[2.2
0]
Num
ber o
f Fai
lure
R
ecor
ds
1,51
1
Lim
ited
to le
aks a
nd
“rup
ture
s”
Cla
ss 1
: 137
Cla
ss 2
: 497
Cla
ss 3
: 548
(abo
ut 1
0%
H/X
tube
s/co
ils)
Non
-Cod
e: 3
29
4,06
4
Non
thro
ugh-
wal
l and
th
roug
h-w
all f
law
s
Dire
ct e
xten
sion
of S
KI
96:2
0
1,14
5
Even
ts c
lass
ified
by
pipe
si
ze <
DN
50 a
nd �
DN
50,
and
by sy
stem
gro
up
7,34
7 (1
2-31
-200
7)
Cla
ss 1
: 163
5
Cla
ss 2
: 185
4
Cla
ss 3
: 156
9
Non
-Cod
e: 2
289
Plus
an
addi
tiona
l 465
reco
rds
on w
ater
ham
mer
eve
nts t
hat
chal
leng
ed th
e in
tegr
ity o
f, bu
t di
d no
t fai
l, pi
ping
3,75
5 (1
2-31
-200
7)
Cla
ss 1
: 102
6
Cla
ss 2
: 949
Cla
ss 3
: 965
Non
-Cod
e: 8
65
Wat
er h
amm
er e
vent
s not
co
nsid
ered
unl
ess a
pre
ssur
e bo
unda
ry fa
iled
Num
ber o
f rec
ords
on
“maj
or”
stru
ctur
al
failu
re N
OTE
5
119
179
69
252
205
Stat
ed u
pdat
ing
/ m
aint
enan
ce p
olic
y an
d pr
ogra
m
No
No
No
Con
tinuo
us –
Mon
thly
Sta
tus
Rep
orts
issu
ed si
nce
Janu
ary
1999
– A
ppen
dix
B in
clud
es
an e
xam
ple
Perio
dic
upda
tes b
y re
spec
tive
Nat
iona
l Coo
rdin
ator
Info
rmat
ion
on th
roug
h-w
all l
eak/
flow
rate
N
o N
o N
o Y
es
Yes
Flaw
size
dat
a N
o N
o N
o Y
es
Yes
Pipe
dim
ensi
onal
dat
a (Y
es) N
OTE
6
Yes
Y
es
Yes
Y
es
Stre
ss in
tens
ity d
ata
No
No
No
Yes
NO
TE 7
N
o
Num
ber o
f dat
abas
e fie
lds
13
15
18
75
60

23
Tabl
e 2.
4 Ex
ampl
es o
f Rec
ent C
ateg
ory
0 an
d C
ateg
ory
2 Pi
pe F
ailu
re D
atab
ases
DA
TA
BA
SE
D
AT
AB
ASE
A
TT
RIB
UT
E
SKI 9
6:20
(1
996)
[2.4
] E
PRI T
R-1
1010
2 (1
997)
[2.3
] E
PRI T
R-1
1188
0 (1
999)
[2.1
5] N
OT
E 1
PI
PExp
(2
007)
NO
TE
2
OPD
E 2
007:
2 (2
007)
[2.2
0]
Sour
ce d
ata
arch
ive
No
No
No
Yes
Har
d co
pies
or e
lect
roni
c co
pies
of s
ourc
e in
form
atio
n (li
cens
ee e
vent
repo
rts,
repo
rtabl
e oc
curr
ence
repo
rts,
insp
ectio
n su
mm
ary
repo
rts,
root
cau
se a
naly
sis r
epor
ts,
mai
nten
ance
wor
k or
ders
, etc
.) ke
pt o
n fil
e fo
r all
reco
rds i
n da
taba
se.
Yes
Har
d co
pies
or e
lect
roni
c co
pies
of s
ourc
e in
form
atio
n (li
cens
ee e
vent
repo
rts,
repo
rtabl
e oc
curr
ence
repo
rts,
insp
ectio
n su
mm
ary
repo
rts,
root
cau
se a
naly
sis r
epor
ts,
mai
nten
ance
wor
k or
ders
, etc
) ke
pt o
n fil
e fo
r all
reco
rds i
n da
taba
se.
Ver
ifica
tion
and
Val
idat
ion
of D
ata
Rec
ords
?
Unk
now
n N
OTE
8
Unk
now
n N
OTE
9
(App
endi
x A
incl
udes
fu
rther
det
ails
)
Som
e no
n-pi
ping
eve
nts
dele
ted
from
SK
I 96:
20.
Mos
t rup
ture
eve
nts
verif
ied
(not
e di
ffer
ence
be
twee
n th
is d
atab
ase
and
SKI 9
6:20
) but
mos
t lea
ks
and
crac
ks n
ot v
erifi
ed
NO
TE 9
Exte
nsiv
e ve
rific
atio
n an
d va
lidat
ion
and
follo
w-u
p of
all
data
base
reco
rds.
The
sour
ce
data
of e
ach
reco
rd (w
ork
orde
rs, i
nspe
ctio
n re
ports
, roo
t ca
use
anal
ysis
repo
rts,
licen
see
even
t rep
orts
) kep
t in
an a
rchi
ve
Cod
ing
Gui
delin
e &
QA
Pr
ogra
m: E
xten
sive
ve
rific
atio
n an
d va
lidat
ion
of
all d
atab
ase
reco
rds b
y N
atio
nal C
oord
inat
ors a
nd
Cle
arin
ghou
se.
Com
pone
nt p
opul
atio
n da
ta in
clud
ed?
No
No
Gen
eric
est
imat
es a
nd
actu
al d
ata
from
2 p
lant
s (C
ode
Cla
ss 1
and
2)
incl
uded
in T
R-1
1188
0
Yes
, int
egra
l par
t of d
atab
ase,
ac
tual
dat
a fr
om 2
1 pl
ants
: sa
fety
-rel
ated
pip
ing
and
non-
Cod
e pi
ping
No
Dec
isio
n ab
out d
evel
opin
g po
pula
tion
data
take
n at
the
natio
nal l
evel
Plan
t pop
ulat
ion
data
in
clud
ed
Yes
Y
es
Yes
Y
es –
bui
lt in
as A
cces
s re
latio
nshi
ps
Yes
– b
uilt
in a
s Acc
ess
rela
tions
hips

24
Tabl
e 2.
4 Ex
ampl
es o
f Rec
ent C
ateg
ory
0 an
d C
ateg
ory
2 Pi
pe F
ailu
re D
atab
ases
DA
TA
BA
SE
D
AT
AB
ASE
A
TT
RIB
UT
E
SKI 9
6:20
(1
996)
[2.4
] E
PRI T
R-1
1010
2 (1
997)
[2.3
] E
PRI T
R-1
1188
0 (1
999)
[2.1
5] N
OT
E 1
PI
PExp
(2
007)
NO
TE
2
OPD
E 2
007:
2 (2
007)
[2.2
0]
Det
ails
on
loca
tion
of
degr
adat
ion/
failu
re in
pi
ping
syst
em
No
No
No
Yes
Free
-for
mat
mem
o fie
ld w
ith
desc
riptio
n of
flaw
with
re
fere
nce
to li
ne n
umbe
r or
wel
d nu
mbe
r, an
d P&
ID
and/
or is
omet
ric d
raw
ing
num
ber.
Hyp
erlin
ks p
rovi
des
acce
ss to
pho
togr
aphs
, lin
e dr
awin
gs, a
nd is
omet
ric
draw
ings
Yes
Loca
tion
in p
lant
and
syst
em
defin
ed u
sing
P&
ID a
nd
isom
etric
dra
win
g id
entif
iers
. El
ectro
nic
libra
ry o
f sou
rce
info
rmat
ion,
incl
udin
g ph
otog
raph
s, lin
e dr
awin
gs
and
isom
etric
dra
win
gs.
In-s
ervi
ce in
spec
tion
(ISI
) inf
orm
atio
n / I
SI
hist
ory
of fa
iled
pipi
ng
com
pone
nts
No
No
No
Yes
Y
es
Exte
nt o
f app
licat
ion
Dev
elop
ed to
supp
ort
eval
uatio
n of
failu
re
trend
s as d
ocum
ente
d in
SK
I Rep
ort 9
6:20
Dev
elop
ed to
supp
ort
eval
uatio
n of
failu
re
trend
s as d
ocum
ente
d in
TR
-110
102
Der
ived
failu
re p
aram
eter
s us
ed b
y se
vera
l RI-
ISI
prog
ram
dev
elop
men
t pr
ojec
ts (2
000-
2005
); e.
g.,
all E
xelo
n pl
ants
Mul
tiple
, inc
ludi
ng K
oebe
rg-
1/2
RI-
ISI p
roje
ct, E
PRI
inte
rnal
floo
ding
gui
de [2
.8
and
2.9]
. See
als
o R
efer
ence
[2
.20]
App
endi
x G
and
R
efer
ence
[2.2
1]
Ref
eren
ce [2
.21]

25
Tabl
e 2.
4 Ex
ampl
es o
f Rec
ent C
ateg
ory
0 an
d C
ateg
ory
2 Pi
pe F
ailu
re D
atab
ases
DA
TA
BA
SE
D
AT
AB
ASE
A
TT
RIB
UT
E
SKI 9
6:20
(1
996)
[2.4
] E
PRI T
R-1
1010
2 (1
997)
[2.3
] E
PRI T
R-1
1188
0 (1
999)
[2.1
5] N
OT
E 1
PI
PExp
(2
007)
NO
TE
2
OPD
E 2
007:
2 (2
007)
[2.2
0]
Not
es: 4.
An
appl
icat
ion
of S
KI 9
6:20
dat
abas
e
5.
App
endi
x B
incl
udes
furth
er d
etai
ls.
6.
This
wor
k w
as sp
onso
red
join
tly b
y EP
RI a
nd S
KI u
nder
a M
emor
andu
m o
f Und
erst
andi
ng
7.
Bec
ause
of d
ata
valid
ity c
once
rns r
aise
d by
mem
ber o
rgan
izat
ions
, thi
s rep
ort h
as b
een
with
draw
n fr
om th
e se
cure
EPR
I web
site
and
is n
o lo
nger
ava
ilabl
e fo
r dow
nloa
d. A
no
n-pr
oprie
tary
ver
sion
(no
data
tabl
es) o
f TR
-111
880
rem
ains
ava
ilabl
e fr
om th
e N
ucle
ar R
egul
ator
y C
omm
issi
on’s
Pub
lic D
ocum
ent R
oom
, how
ever
(NR
C-A
DA
MS
Acc
essi
on N
umbe
r ML0
0377
6638
).
8.
Def
ined
in th
is c
ompa
rison
as a
thro
ugh-
wal
l fla
w w
ith fl
ow ra
te >
3.2
kg/
s (50
gpm
)
9.
In m
any
case
s eng
inee
ring
judg
men
t is u
sed
to a
ssig
n pi
pe d
iam
eter
as e
ither
< 1
-inch
or �
1-in
ch
10.
Info
rmat
ion
on S
tress
Inte
nsity
Allo
wan
ce (r
atio
of c
ritic
al to
ass
esse
d st
ress
inte
nsity
fact
or) g
iven
for s
elec
ted
Cod
e C
lass
2 a
nd 3
flaw
ed m
oder
ate-
ener
gy p
ipin
g.
11.
The
data
base
reco
rds m
ainl
y re
lies o
n in
form
atio
n ex
tract
ed fr
om L
icen
see
Even
t rep
ort t
itles
. An
inde
pend
ent r
evie
w p
erfo
rmed
in Ja
nuar
y 19
96 id
entif
ied
on th
e or
der o
f 60
0 m
iscl
assi
fied
reco
rds.
12.
An
inde
pend
ent r
evie
w p
erfo
rmed
in Ju
ly 2
005
iden
tifie
d on
the
orde
r of 1
,000
err
oneo
us re
cord
s (e.
g., d
uplic
ate
reco
rds,
mis
clas
sifie
d re
cord
s, or
non
-pip
ing
failu
res)
. See
A
ppen
dix
A fo
r fur
ther
det
ails
.

26
2.4.2 Insights
Numerous pipe failure databases have been developed to support risk-informed applications. Beyond fulfilling a one-time objective, most databases have not been subjected to continuous or periodic updates, however. A lack of validation of data records influences the validity of derived reliability parameters; this topic is addressed further in Appendix A.
The survey includes examples of ongoing, ambitious programs to develop “autonomous” databases. Autonomous in the sense that embedded in these databases is all the original source information.

27
3 Pipe Failure Parameter Estimation & Requirements on Data Sources
3.1 Abstract
The ability of a pipe failure database to support different PSA applications requirements is a function of database depth, completeness and knowledge-base embedded within a data collection. This document identifies the different types of pipe failure parameters that are used – or can be derived for use – in risk-informed and risk-based PSA applications. It also includes recommendations for the types of parameters to be included in a proposed “R-Book.” These recommendations are based on the requirements of ASME RA-Sb-2005 (The American Society of Mechanical Engineers “Standard for Probabilistic Risk Assessment for Nuclear Power Plant Applications”) [3.8] as well as insights from past pipe failure database applications.
3.2 Introduction
According to the ASME PRA Standard [3.8], the objectives of the data analysis elements are to provide estimates of the parameters used to determine the probabilities of the basic events representing equipment failures and unavailabilities modeled in PSA in such a way that:
1. Parameters, whether estimated on the basis of plant-specific or generic data, appropriately reflect design and operation of the plant. Relative to piping systems and components, derived parameters should adequately reflect design practices, material selections, and water chemistries.
2. Component or system unavailabilities due to maintenance or repair are accounted for. Relative to piping systems and components, derived parameters should account for inspection practices, including leak detection/inspection, non-destructive examination, pressure tests, and repair/replacement practices.
3. Uncertainties in the data are understood and appropriately accounted for.
3.2.1 High Level Requirements for Data Analysis
The ASME PRA Standard [3.8] “High Level Requirements” (HLRs) for data analysis (DA) are reproduced in Table 3.1. According to these requirements, for a proposed R-Book to support PSA applications it needs to include generic parameter estimates as well as a relevant selection of “seed values” to support the derivation of plant-specific pipe failure parameters.
Table 3.1 High Level Requirements for Data Analysis Designator Requirements HLR-DA-A Each parameter shall be clearly defined in terms of the logic model,
basic event boundary, and the model used to evaluate event probability HLR-DA-B Grouping components into a homogeneous population for parameter
estimation shall consider both design, environmental, and service conditions of the components in the as-built and as-operated plant

28
Table 3.1 High Level Requirements for Data Analysis Designator Requirements HLR-DA-C Generic parameter estimates shall be chosen and plant-specific data
shall be collected consistent with the parameter definitions of HLR-DA-A and the grouping rationale of HLR-DA-B.
HLR-DA-D The parameter estimates shall be based on relevant generic industry or plant-specific evidence. Where feasible, generic and plant-specific evidence shall be integrated using acceptable methods to obtain plant-specific parameter estimates. Each parameter estimate shall be accompanied by a characterization of the uncertainty.
HLR-DA-E The data analysis shall be documented consistent with the applicable supporting requirements [of the standard].
3.2.2 Reading Guide
Building on previous Chapter 2.3, Chapter 3.3 of this report includes an overview of the different types of parameter estimates that are derived to support PSA applications of varying scope. Six different types of pipe failure parameters are identified, each type imposing certain minimum requirements on a pipe failure database design and use:
1 “Generic” pipe failure parameters that support PSA Capability Category I
2 Application-specific pipe failure parameters that support PSA Capability Category II or III, including
2.1 Internal flooding initiating event frequency calculation
2.2 High energy line break (HELB) frequency calculation
2.3 Loss-of-coolant accident (LOCA) frequency calculation
3 Risk-informed in-service inspection (RI-ISI) risk impact evaluation
4 Advanced database applications that support PSA Capability Category III. This type includes any extension to the parameter estimation approaches used to support applications listed above.
The bases for the PSA Capability Categories are found in Reference [3.8] and are reproduced in Table 3.2. These capability categories refer to the extent of reliance on PSA results in supporting decisions, and the degree of resolution required of the factors (e.g., pipe failure data) that determine the risk significance of the proposed changes.
Under an assumption of using a Cat2 database as basis, recommendations for the types of parameters to be included in a proposed R-Book are summarized in Chapter 3.4. The characteristics of a Cat2 database are presented in Reference [3.1]. A list of references is found in Chapter 7.

29
Tabl
e 3.
2 Ba
ses f
or P
SA C
apab
ility
Cat
egor
ies
Att
ribu
tes o
f PSA
I
II
III
1.
Scop
e an
d le
vel o
f det
ail:
The
degr
ee to
whi
ch th
e sc
ope
and
leve
l of
det
ail o
f the
pla
nt d
esig
n,
oper
atio
n, a
nd m
aint
enan
ce a
re
mod
eled
.
Res
olut
ion
and
spec
ifici
ty
suff
icie
nt to
iden
tify
the
rela
tive
impo
rtanc
e of
the
cont
ribut
ors a
t th
e sy
stem
or t
rain
leve
l inc
ludi
ng
asso
ciat
ed h
uman
act
ions
.
Res
olut
ion
and
spec
ifici
ty su
ffic
ient
to
iden
tify
the
rela
tive
impo
rtanc
e of
the
sign
ifica
nt c
ontri
buto
rs a
t the
co
mpo
nent
leve
l inc
ludi
ng
asso
ciat
ed h
uman
act
ions
, as
nece
ssar
y [N
ote
(1)]
.
Res
olut
ion
and
spec
ifici
ty su
ffic
ient
to
iden
tify
the
rela
tive
impo
rtanc
e of
the
cont
ribut
ors a
t the
co
mpo
nent
leve
l inc
ludi
ng
asso
ciat
ed h
uman
act
ions
, as
nece
ssar
y [N
ote
(1)]
. 2.
Pl
ant-
spec
ifici
ty: T
he d
egre
e to
w
hich
pla
nt-s
peci
fic in
form
atio
n is
in
corp
orat
ed su
ch th
at th
e as
-bui
lt an
d as
-ope
rate
d pl
ant i
s add
ress
ed.
Use
of g
ener
ic d
ata/
mod
els
acce
ptab
le e
xcep
t for
the
need
to
acco
unt f
or th
e un
ique
des
ign
and
oper
atio
nal f
eatu
res o
f the
pla
nt.
Use
of p
lant
-spe
cific
dat
a/m
odel
s fo
r the
sign
ifica
nt c
ontri
buto
rs.
Use
of p
lant
-spe
cific
dat
a/m
odel
s fo
r all
cont
ribut
ors,
whe
re
avai
labl
e.
3.
Rea
lism
: The
deg
ree
to w
hich
re
alis
m is
inco
rpor
ated
such
hat
the
expe
cted
resp
onse
of t
he p
lant
is
addr
esse
d.
Dep
artu
res f
rom
real
ism
will
hav
e m
oder
ate
impa
ct o
n th
e co
nclu
sion
s an
d ris
k in
sigh
ts a
s sup
porte
d by
go
od p
ract
ices
[Not
e (2
)].
Dep
artu
res f
rom
real
ism
will
hav
e sm
all i
mpa
ct o
n th
e co
nclu
sion
s an
d ris
k in
sigh
ts a
s sup
porte
d by
go
od p
ract
ices
[Not
e (2
)].
Dep
artu
res f
rom
real
ism
will
hav
e ne
glig
ible
impa
ct o
n th
e co
nclu
sion
s and
risk
insi
ghts
as
supp
orte
d by
goo
d pr
actic
es [N
ote
(2)]
. N
OTE
S:
(1)
The
defin
ition
for C
apab
ility
Cat
egor
ies I
I and
III i
s not
mea
nt to
impl
y th
at th
e sc
ope
and
leve
l of d
etai
l inc
lude
s ide
ntifi
catio
n of
eve
ry c
ompo
nent
and
hu
man
act
ion,
but
onl
y th
ose
need
ed fo
r the
func
tion
of th
e sy
stem
bei
ng m
odel
ed.
(2)
Diff
eren
tiatio
n be
twee
n m
oder
ate,
to sm
all,
to n
eglig
ible
is d
eter
min
ed b
y th
e ex
tent
to w
hich
the
impa
ct o
n th
e co
nclu
sion
s and
risk
insi
ghts
cou
ld
affe
ct a
dec
isio
n un
der c
onsi
dera
tion.
Thi
s diff
eren
tiatio
n re
cogn
izes
that
the
PSA
wou
ld g
ener
ally
not
be
the
sole
inpu
t to
a de
cisi
on. A
mod
erat
e im
pact
impl
ies t
hat t
he im
pact
(of t
he d
epar
ture
from
real
ism
) is o
f suf
ficie
nt si
ze th
at it
is li
kely
that
a d
ecis
ion
coul
d be
aff
ecte
d; a
smal
l im
pact
im
plie
s tha
t it i
s unl
ikel
y th
at a
dec
isio
n co
uld
be a
ffec
ted,
and
a n
eglig
ible
impa
ct im
plie
s tha
t a d
ecis
ion
wou
ld n
ot b
e af
fect
ed.

30
3.3 Pipe Failure Parameter Types
This chapter identifies six different types of pipe failure data parameters for use in PSA applications. The objectives of a specific PSA application determine the piping component boundary definition(s) and how a pipe failure database is queried to obtain the necessary input to a statistical estimation process. And certainly, the depth and completeness of a pipe failure database determine whether the PSA application requirements can be fulfilled. Methods for estimating failure parameters and for quantifying the uncertainties in the estimates are addressed in Chapter 2. A comprehensive review of failure parameter estimation is included in NUREG/CR-6823 [3.1].
3.3.1 “Generic” Pipe Failure Parameters
A generic set of pipe failure parameters are derived from relevant service experience but usually at a low level of analytical discrimination. This means that while a parameter estimation process accounts for different system groups, failure types and pipe size groups it may not differentiate the source data by operating conditions, materials, method of fabrication, inspection program, plant design, failure locations, or degradation susceptibilities. A generic failure parameter represents a global average, which may or may not apply to a specific application beyond a PSA “Capability Category I” [3.8]. For a pipe failure database to be able to support estimation of generic failure parameters it must include at least the following information:
� System Group. Safety class must be identified together with information on type of system, for example Reactor Coolant System (RCS), Safety Injection & Recirculation (SIR), Reactor Auxiliary System (RAS), Auxiliary Cooling System (ACS), Feedwater & Condensate (FWC), Containment Spray (CS), Main & Auxiliary Steam (ST), Fire Protection (FP).
� Pipe Size. Differentiation according to “small-diameter”, Medium-diameter”, and “large-diameter.”
� Plant Type. BWR, PHWR, PWR, RBMK.
Assuming that a data collection includes information as itemized above it must be processed and queried in such a way that a corresponding set of failure count and exposure term information is obtained. The analyst also must clearly define the failure type of interest (e.g., non-through wall, through-wall with a given leak/flow rate threshold value). It is quite straightforward to generate pipe failure parameters at a generic level.
3.3.2 Application-Specific Pipe Failure Parameters
There are at least four types of application-specific pipe failure parameters. Three of these types support the estimation of initiating event frequencies while a fourth type support risk-impact evaluation tasks in risk-informed in-service inspection (RI-ISI). In summary, the four types of application-specific pipe failure parameters are:
� Internal Flooding Initiating Event Frequencies. Internal flooding PSA includes consideration of flooding sources through pressure boundary failure. The way an initiating event is characterized and its frequency quantified is closely related to the definition of flooding “source terms.” A flood source term is determined as the total

31
amount or volume of passive components within a specified flood area that theoretically can generate a spray, flood or major flood event. Where a flood area includes a certain pipe run a corresponding flood source term can be characterized in terms of number of weld, linear meter of piping, or sections (or segments) of piping. The term “pipe run” means a length of piping between two reference points (can be wall penetration, valve, heat exchanger). Exactly how the piping boundary is defined is a function of material type and degradation susceptibility, but it is also a function of the analyst’s preference and type of pipe failure parameters that are available for direct use. As an example, if a pipe run through a particular flood zone consists of Fire Protection water system piping with stagnant fire water it would be appropriate to use the corresponding linear foot of piping as the component boundary definition. In this case the entire length of piping would be susceptible to localized corrosion. The length of piping would be obtained from an isometric drawing. Table 3.3 [3.4] is an example of failure rates for Code Class 3 Service Water piping. It includes failure rates for two different piping component boundary definitions.
Table 3.3 Frequency of Spray due to Service Water Pipe Failure (U.S. PWR Specific Service Experience – Salt Water)
Component Boundary & Size
SW Spray Frequency Uncertainty Distribution
Type Diameter [mm]
Mean 5th
Percentile Median 95th
Percentile � � 25 3.88E-05 2.07E-05 3.56E-05 7.12E-05
25 < � � 50 4.23E-06 2.09E-06 3.83E-06 7.88E-06 50 < � � 100 1.04E-05 5.33E-06 9.47E-06 1.94E-05 100 < � � 150 2.93E-06 1.28E-06 2.59E-06 5.78E-06 150 < � � 250 3.38E-06 1.68E-06 3.05E-06 6.30E-06
Base Metal [1/m.yr]
� > 250 7.52E-07 3.93E-07 6.85E-07 1.40E-06 � � 25 4.99E-06 2.37E-06 4.47E-06 9.41E-06
25 < � � 50 3.20E-07 1.04E-07 2.65E-07 7.12E-07 50 < � � 100 1.91E-06 7.71E-07 1.67E-06 3.88E-06 100 < � � 150 8.13E-07 2.17E-07 6.42E-07 1.98E-06 150 < � � 250 1.52E-07 9.53E-09 7.05E-08 5.32E-07
Weld [1/weld.yr]
� > 250 6.59E-08 1.39E-08 4.88E-08 1.75E-07 In this example, “spray” is defined as the consequence of a through-wall flaw which produces a flow rate � 6 kg/s
In the above data summary the failure rates for “base metal” apply to carbon steel piping and “weld” apply to stainless steel piping.
� High Energy Line Break (HELB) Frequency. The pipe failure parameter estimation requirements for HELB frequency calculation are the same as for internal flooding PSA. However, the scope of the analysis is limited to high-energy piping such as Main Steam, Auxiliary Steam, Main Feedwater and Condensate piping. The piping component boundary definitions should reflect the degradation susceptibilities of the piping in the analysis scope. Normally the flow-accelerated corrosion (FAC) inspection plans include the piping component boundary definitions; an example is given in Table 3.4 [3.2].

32
Table 3.4 Example of Exposure Data for HELB Frequency Calculation
Plant Type System Group
System Avg. Inspection
Locations According to FAC Program
Condensate 1184 Feedwater Heater Drain, Vents,
Relief 502
FWC
Feedwater 252 Main Steam (incl. Moisture Separator Reheater System)
275
BWR
STEAM
Steam Extraction 68 All: 2281
Condensate 522 Feedwater Heater Drain, Vents,
Relief 1550
FWC
Feedwater 321 Main Steam (incl. Moisture Separator Reheater System)
625
PWR
STEAM
Steam Extraction 189 All: 3207
Notes: � The column “Inspection Locations” shows the mean of component counts based on a review of
FAC Program Plans from 23 PWR plants and 29 BWR plants. � The information for PWR is exclusive of Steam Generator Blowdown piping. � The difference in population data between BWR and PWR is attributed to different water
chemistries. � “Inspection Location” is equal to piping component, which can be an elbow, straight pipe (typically
downstream of an elbow, flow control valve, or orifice/venturi), reducer, tee
� Loss-of-Coolant Accident (LOCA) Frequency. The pipe failure parameter estimation requirements for LOCA frequency calculation are found in documents such as NUREG/CR-6224 [3.10] and NUREG-1829 [3.9]. In this type of application the failure counts and exposure terms should relate to specific in-service inspection (ISI) sites or weld configurations as documented on isometric drawings.
� RI-ISI Risk Impact Evaluation. In addition to the failure count and exposure term information, this task requires industry-wide and plant-specific service experience data organized in such a way that database queries produce results on damage or degradation susceptibilities associated with specific sites for non-destructive examinations (see Equation (2) in Chapter 2. The derived pipe failure rates are conditional on these susceptibilities. An example of pipe element susceptibility fractions are displayed in Table 3.5, which is adapted from Reference [3.9]. These fractions are input to the RI-ISI conditional pipe failure rate calculations. Note that these susceptibility fractions differentiate pipe failures according to base metal failure and weld failure.

33
Table 3.5 Example of Pipe Element Susceptibility Fractions for Input to RI-ISI Calculations
Damage / Degradation Mechanism Fraction of Welds
Susceptible Fraction of Pipe Length
Susceptible System Group
Confidence Level
CF E-C SC TF D&C COR FAC low 0.01 0.01 0.01 0.05 1.00 N/A N/A med 0.05 0.05 0.05 0.19 1.00 N/A N/A RCS high 0.25 0.25 0.25 0.80 1.00 N/A N/A low 0.01 0.01 0.01 0.01 1.00 N/A N/A med 0.05 0.05 0.02 0.04 1.00 N/A N/A SIR high 0.25 0.25 0.08 0.20 1.00 N/A N/A low 0.01 0.01 0.01 0.01 1.00 0.01 N/A med 0.05 0.05 0.05 0.05 1.00 0.05 N/A CS high 0.25 0.25 0.25 0.25 1.00 0.25 N/A low 0.01 0.01 0.01 0.01 1.00 0.01 N/A med 0.05 0.05 0.05 0.05 1.00 0.05 N/A RAS high 0.25 0.25 0.25 0.25 1.00 0.25 N/A low 0.01 0.01 N/A 0.01 1.00 1.00 0.01 med 0.05 0.05 N/A 0.05 1.00 1.00 0.05 AUX high 0.25 0.25 N/A 0.25 1.00 1.00 0.25 low 0.01 0.01 N/A 0.01 1.00 0.01 0.01 med 0.05 0.05 N/A 0.05 1.00 0.03 0.05 FWC high 0.25 0.25 N/A 0.25 1.00 0.12 0.25 low 0.01 0.01 N/A 0.01 1.00 0.01 0.10 med 0.05 0.05 N/A 0.05 1.00 0.05 0.56 ST high 0.25 0.25 N/A 0.25 1.00 0.25 0.90 low 0.01 0.01 N/A N/A 1.00 1.00 0.01 med 0.05 0.05 N/A N/A 1.00 1.00 0.05 FP high 0.25 0.25 N/A N/A 1.00 1.00 0.25
Legends: CF Corrosion Fatigue E-C Erosion-Cavitation SC Stress Corrosion Cracking TF Thermal Fatigue D&C Design & Construction COR Corrosion FAC Flow Accelerated Corrosion N/A not applicable
3.3.3 Advanced Database Applications
Embedded in a data collection on pipe failures are effects of in-service inspection, leak detection (remote and local), routine walkdown inspections, and other integrity management strategies. Using an appropriate reliability model it is feasible to “isolate” the effect of such strategy on structural reliability.
Advanced database applications are directed at parameter estimation in support of PSA applications other than those addressed in Chapter 3.3.2. Furthermore, the advanced applications could include more detailed consideration of the effects of different material types, leak detection strategies, repair strategies and/or inspection strategies on piping reliability. One example of the types of parameters needed to evaluate such influences using the Markov model of piping reliability is given in Table 3.6. It lists the Markov model parameters and the strategy to derive these from a Cat2 database.

34
Table 3.6 Parameters of the Markov Model of Piping Reliability Symbol Description Data Source & Strategy for
Parameter Estimation
�ik Failure rate of pipe component “i” due to degradation or damage mechanism “k”
The failure rate is estimated directly by inputting TTF data to a hazard plotting routine (Weibull analysis) or indirectly via a database query to obtain a failure count over a certain observation period and for a certain piping component population
TTF Time to Failure Obtained directly via database query
Pik{Rx|F} Conditional pipe failure probability. Index “x” refers to mode of failure as defined by through-wall peak flow rate threshold value
Obtained directly via database query, Bayesian estimation strategy, PFM (SRM), or expert elicitation
Iik
Structural integrity management factor for component “i” and damage or degradation mechanism “k”. This is an adjustment factor to account for variable integrity management strategies such as leak detection, volumetric NDE, etc, that might be different that the components included in a pipe failure database
Obtained through application of the Markov model of piping reliability (iterative analysis)
nik Number of failures (all modes, including cracks, leaks and significant structural failures)
Obtained directly via database query
fik
The fraction of number of components or type “i” that are susceptible to failure from degradation or damage mechanism “k” for conditional failure rates given susceptibility to “k”; this parameter is set to 1 for unconditional failure rates
Obtained directly via database query, or from ‘Degradation Mechanism Analysis” tasks of RI-ISI program development projects, or via engineering judgment
Ni
The number of components per reactor year (or calendar year) that provided the observed pipe failures for component “i”
Input from piping system design reviews (size, weld counts, pipe lengths, and material data) specific to an application. Required for estimation of �ik
Ti
Total exposure time over which failures were collected for pipe component “i”; normally expressed in terms of reactor years (or calendar years)
Obtained directly via database query. Required for estimation of �ik
� Occurrence rate of a flaw (non through-wall) Obtained directly via database query, or can be estimated as a multiple of the rate of leaks based on ISI experience
�S Occurrence rate of leak from a no-flaw state
Service data for leaks and reasoning that leaks without a pre-existing flaw are only possible for selected damage mechanism from severe loading
�C Occurrence rate of a leak from a flaw state Service data for leaks conditioned for existing conditions for selected degradation mechanisms
�S Occurrence rate of a “structural failure” from a no-flaw state
Service data for “structural failure” and reasoning that “structural flaws” without a pre-existing degradation is only possible for selected damage mechanisms and system-material combinations
�C Occurrence rate of a through-wall leak from a flaw (non through-wall) state
Service data for leaks conditioned for existing conditions for selected degradation and damage mechanisms

35
Table 3.6 Parameters of the Markov Model of Piping Reliability
�F Occurrence rate of “structural failure” from a through-wall flaw state
Estimates of physical degradation rates and times to failure converted to equivalent failure rates, or estimates of water hammer challenges to the system in degraded state.
� Repair rate via leak detection
� ��
PT T
LD
LI R( )
Model of equation for �, and estimates of PLD, TLI , TR
PLD Probability that a through-wall flaw is detected given leak detection or leak inspection
Estimate based on presence of leak detection system, technical specification requirements and frequency of leak inspection. Database generates qualitative insights. Reliability of leak detection systems is high. Quantitative estimate based on expert judgment
TLI Mean time between inspections for through-wall flaw
Estimate based on method of leak detection; ranges from immediate to frequency of routine inspections for leaks or ASME Section XI required system leak tests
� Repair rate via NDE
� ��
P PT T
I FD
FI R( )
Model of equation for �, and estimates of PI, PFD, TFI, TR
PI Probability that a flaw will be inspected (index “I”) per inspection interval
Estimate based on specific inspection strategy; usually done separate for ASME Section XI (or equivalent) and RI-ISI programs
PFD
Probability that a flaw will be detected given that the weld or pipe section is subjected to NDE. Also referred to as POD.
Estimate based on NDE reliability performance data and difficulty of inspection. A Cat2 database provides qualitative insights about NDE reliability
TFI Mean time between inspections Based on applicable inspection program; can be “never” or 10 years for ASME XI piping
TR Mean time to repair once detected
Obtained directly via database query. The mean repair time includes time tag out, isolate, prepare, repair, leak test and tag-in
Another example of advanced database application involves parameter estimation to support benchmarking of probabilistic fracture mechanics (PFM) models. Reference [3.7] documents insights and results from a recent benchmarking exercise performed in support of a new computer code for the prediction of pipe break probabilities for LOCA frequency estimation [3.6]. Some results from the benchmarking are included in Table 3.7.

36
Table 3.7 Comparison of Results for Different ISI Sites [3.7]
Predicted Cumulative Probability of Through-Wall Flaw (Perceptible Leakage) Analysis Case
PFM Note 1 Service Data Note 2
Over-Prediction (PFM:Service Data)
PWR Hot leg Bi-Metallic Weld (RPV Nozzle-to- Safe-end) @ 20 years 1.0�10-1 2.9�10-3 ~ 100
PWR Pressurizer Surge Line Bi-Metallic Weld @ 6 years 5.0�10-1 4.9�10-5 ~ 10000
PWR Pressurizer Spray Line Bi-Metallic Weld @ 6 years 5.0�10-1 2.1�10-4 ~ 1000
BWR Reactor Recirculation Austenitic Stainless Steel Weld (12-inch) @ 15 years and no
IGSCC mitigation 2.0�10-1 3.4�10-3 ~ 60
Note 1: Average of PRAISE and PRO-LOCA results Note 2: Estimation based on methodology as documented in Task 1 report (2005153-M-003) Note 3: The term “perceptible leakage” implies a through-wall flaw but with very minor leakage or no active leakage during normal plant operation.
It is noted that these results reflect different assumptions about weld residual stresses as well as different assumptions about crack propagation. One insight from the benchmarking is that service data and associated parameter estimates can and should be used as one of several inputs to the calibration of the input to PFM models and validation of results.
3.4 Recommendations for R-Book Content
Ample experience exists with pipe failure database development and application. A plan for developing an “R-Book” for piping reliability analysis needs to account for an overall technical scope (systems, components, and operating environments to be accounted for) and end-user requirements. The end-user requirements should address intended applications as well as needs for data specializations. Three strategies for an “R-Book” are outlined below:
� Basic Approach. Tabulations of parameter values that are ready for use by PSA practitioners. It is expected of such an approach that piping component boundary conditions are clearly stated and that the techniques and tools for parameter estimation have been subjected to an accepted level of peer review. Any data tabulation needs to clearly acknowledge design and operating practices that are representative of the Nordic nuclear power plants. As an example, it would make no sense at all to develop failure parameters for, say, Service Water piping without first filtering out any service experience data for plants using fresh water or river water as the ultimate heat sink; all Nordic plants use brackish or sea water as the source of cooling water. Furthermore, any tabulation of failure parameters should reflect in-service inspection regulations and practices that apply to the Nordic plants. The overall scope of the data book could include all major plant systems, as identified in Table 3.8, or some subset thereof.
� Advanced Approach. This approach would be intended for an experienced data analyst requiring seed parameters for user-defined data applications or specializations. Rather than presenting parameter values ready for direct use in a

37
PSA model this version would include comprehensive tabulations of failure counts and the corresponding exposure data. For calibration purposes and for some pre-selected piping component types, parameter estimates could also be included based on a “pre-approved” method. Detailed user instructions would be included in an R-Book of this scope.
� Combined Approach. As implied, in this version some middle-ground would be established so that the data requirements at different user levels can be met. For example, in this approach the handbook could consist of proposed generic (or prior) failure rate distributions for selected systems. That is, for systems for which the available body of service experience is such that direct statistical estimation is feasible across the full range of failure modes (from degraded condition to major structural failure). These proposed generic failure rate distributions would include detailed user instructions, including guidelines for plant-specific data specializations. A second part of the handbook could consist of extensive database query results for all plant systems listed in Table 3.8. These queries would consist of pipe failure counts by pipe size, damage/degradation mechanism, material and failure location, and presented in such a way that input files exist for any chosen reliability parameter estimation approach. It is anticipated that the user guidance would include proposed, or recommended estimation tools.
Irrespective of the chosen approach it is expected that the experience with the T-Book 3 development and maintenance be applied to the R-Book development process. Methodology and presentation format must be transparent and reproducible.
3 T-Book – Reliability Data of Components in Nordic Nuclear Power Plants.

38
Tabl
e 3.
8 Pl
ant S
yste
ms i
n O
PDE
Dat
abas
e Sc
ope
[3.5
] G
erm
any
(7)
OPD
E
Gen
eric
(1)
Des
crip
tion
Cze
ch
Rep
ublic
Fr
ance
A
KZ
KK
S Sw
eden
A
DS
BW
R P
rimar
y D
epre
ssur
izat
ion
Syst
em (B
WR
) --
--
TK
, RA
314
AFW
A
uxili
ary
Feed
wat
er S
yste
m
A
SG
RQ
327
CC
C
ompo
nent
Coo
ling
Wat
er S
yste
m
TF
RR
I TF
LA
71
1/71
2 C
ON
D
Con
dens
ate
Syst
em
RM
, RN
LC
41
4/43
0 (4
) C
RD
C
ontro
l Rod
Driv
e (I
nser
t/Rem
oval
/Cru
d R
emov
al)
--
--
354
CS
Con
tain
men
t Spr
ay S
yste
m
TQ
EAS
322
CV
C
Che
mic
al &
Vol
ume
Con
trol S
yste
m (P
WR
)
RC
V
TA, T
C, T
D
KB
33
4 C
W
Circ
ulat
ing
Wat
er S
yste
m
443
EHC
El
ectro
Hyd
raul
ic C
ontro
l Sys
tem
44
2 EX
T St
eam
Ext
ract
ion
Syst
em
419/
423
FPS
Fire
Pro
tect
ion
Syst
em
C-5
2
762
FW
Mai
n Fe
edw
ater
Sys
tem
AR
E R
L LA
31
2/41
5 (5
) H
PCS
Hig
h Pr
essu
re C
ore
Spra
y (B
WR
) --
--
TJ
--
HPS
I H
igh
Pres
sure
Saf
ety
Inje
ctio
n (P
WR
) TJ
R
IS
TH
JN
--
IA
Inst
rum
ent A
ir Sy
stem
U
S
484
LPC
S Lo
w P
ress
ure
Cor
e Sp
ray
(BW
R)
--
--
TK, T
M
32
3 LP
SI
Low
Pre
ssur
e Sa
fety
Inje
ctio
n (P
WR
) TH
R
IS
TH
JN
--
MS
Mai
n St
eam
Sys
tem
VV
P R
A
LB
311/
411
(6)
MSR
M
oist
ure
Sepa
rato
r Reh
eate
r Sys
tem
R
B
LB
422
RC
S R
eact
or C
oola
nt S
yste
m (P
WR
)
RC
P Y
A, Y
B, Y
P JA
, JE
313
RH
R
Res
idua
l Hea
t Rem
oval
Sys
tem
(2
) R
RA
TH
JN
32
1 R
R
Rea
ctor
Rec
ircul
atio
n Sy
stem
(BW
R)
--
--
313
RPV
-HC
R
PV H
ead
Coo
ling
Syst
em (B
WR
) --
--
TC
326
RV
LIS
Rea
ctor
Ves
sel L
evel
Indi
catio
n Sy
stem
(BW
R)
--
--
536
RW
CU
R
eact
or W
ater
Cle
anup
Sys
tem
(BW
R)
--
--
TC
KB
33
1 SA
Se
rvic
e A
ir Sy
stem
TL
TL
KL
753
SFC
Sp
ent F
uel P
ool C
oolin
g Sy
stem
TG
PT
R
TG
FA
324
S/G
Blo
wdo
wn
Stea
m G
ener
ator
Blo
wdo
wn
Syst
em (P
WR
)
APG
R
S LA
33
7 SL
C
Stan
dby
Liqu
id C
ontro
l Sys
tem
(BW
R)
--
--
351

39
Tabl
e 3.
8 Pl
ant S
yste
ms i
n O
PDE
Dat
abas
e Sc
ope
[3.5
] G
erm
any
(7)
OPD
E
Gen
eric
(1)
Des
crip
tion
Cze
ch
Rep
ublic
Fr
ance
A
KZ
KK
S Sw
eden
SW
Se
rvic
e W
ater
Sys
tem
(3)
VF
SEC
V
E PE
71
2/71
5 N
otes
: 1.
Se
e IE
EE S
td 8
05-1
984
(IEE
E R
ecom
men
ded
Prac
tice
for S
yste
m Id
entif
icat
ion
in N
ucle
ar P
ower
Pla
nts a
nd R
elat
ed F
acili
ties)
for
info
rmat
ion
on sy
stem
bou
ndar
y de
finiti
ons a
nd sy
stem
des
crip
tions
. 2.
N
o de
dica
ted
RH
R sy
stem
in W
WER
-440
(dec
ay h
eat r
emov
al is
thro
ugh
natu
ral c
ircul
atio
n)
3.
It is
com
mon
pra
ctic
e in
the
U.S
. to
use
diff
eren
t sys
tem
ID fo
r saf
ety-
rela
ted
and
non-
safe
ty re
late
d SW
syst
ems;
e.g
., ES
W o
r SX
for C
ode
Cla
ss 3
pip
ing
and
WS
for n
on-C
ode
pipi
ng
4.
414
for F
1/F2
/R1/
R2/
R3/
R4
and
430
for O
1/O
2/O
3 5.
31
2 fo
r O1/
O2/
O3
and
415
for F
1/F2
/R1/
R2/
R3/
R4.
Als
o no
te th
at 3
12 is
the
desi
gnat
ion
for s
team
gen
erat
ors i
n R
ingh
als-
2/3/
4 6.
31
1 fo
r O1/
O2/
O3
411
for F
1/F2
/R1/
R2/
R3/
R4
7.
AK
Z =
Anl
agen
Ken
nzei
chnu
ngs S
yste
m, K
KS
= K
raftw
erk
Ken
nzei
chnu
ngs S
yste
m

40
The method of data specialization entails re-scaling or re-baselining of a published pipe failure arte and then to factoring in new influence factors not accounted for by the original analyses. It also entails the application of Bayesian methods to update a prior failure rate with new and relevant information. With this in mind, a proposed R-Book should present information necessary for defining a prior failure rate. This then could be used to estimate a plant-specific failure rate. As an example, there is ample service experience data on rubber-lined, carbon steel piping in salt water service. The bulk of this experience – as recorded in OPDE and PIPExp – is for U.S. plants. However, the available data (failure counts and exposure) could be used in estimating, say, a pipe failure rate specialized to the three PWR units at the Ringhals site by updating the prior failure rate with the service experience data unique to Ringhals.

41
4 Questionnaire – Database users As a part of the Phase 1 work with the R-book a questionnaire was developed that was sent to potential future R-Book users. The objective with the questionnaire was to establish user requirements of such a piping reliability data handbook.
4.1 Questionnaire distribution
This questionnaire was sent to the organizations listed below. Those that responded to the questionnaire are presented with bold characters. Pacific Northwest National Laboratory
Institute for Energy, Nuclear Safety Unit, JRC-Petten
Japan Nuclear Energy Safety Organization (JNES)
Korea Atomic Energy Research Institute
U.S. Nuclear Regulatory Commission (Office of Nuclear Regulatory Research)
Technology Insights, Inc. (K.N. Fleming)
Oskarshamns Kraftgrupp AB, OKG
Forsmarks Kraftgrupp AB, FKA
Ringhals AB, RAB
Swedish Nuclear Inspectorate (SKI)
4.2 Questionnaire The questionnaire, which is presented in Attachment 5, contains questions within the following areas:
A Handbook applicability
B Level of detail
C Layout and updating
D Data background (traceability)
The answers by the respondents and the conclusions reached from evaluating the answers are given in [4.1]. The answers to the questionnaire have been used to establish high-level requirements for the R-Book technical scope the details of which are documented in Chapter 6.2.

42
5 Questionnaire - Piping Population Databases As a part of the Phase 1 work with the R-book a questionnaire was developed that was sent to those Nuclear Power Plants that will be represented in the R-Book, at least in a first release.
The objective with this questionnaire was to determine availability of information regarding piping population (e.g., weld counts and pipe lengths).
5.1.1 Questionnaire distribution
This questionnaire was sent to the organizations listed below. Those that have answered that questionnaire are presented with bold characters. Oskarshamns Kraftgrupp AB, OKG
Forsmarks Kraftgrupp AB, FKA
Ringhals AB, RAB
5.2 Questionnaire outline The questionnaire, which is presented in Attachment 7 (given in Swedish only), contains questions within the following areas:
A Questions of general nature with respect to how information about piping components can be retrieved.
B Questions regarding information about piping component attribute i.e material data.
C Questions regarding piping component exposure term data, i.e. pressure, temperature etc.
D Questions regarding availability of information about piping components.
E Questions regarding operating experiences
Answers given on the questionnaire together with conclusions based upon the answers are given in [5.1]. The answers on the questionnaire have been used in order to establish requirements of the R-Book (Chapter 6.2).

43
6 R-Book project – Scope of Phase 2
This chapter documents the requirements for the first edition of the R-Book. These requirements reflect insights that have been gained from past practical piping reliability assessments that are based on service experience data, including the technical insights that are documented in Chapters 2 through 5 of this report, i.e.:
Chapter 2: Database Survey
Chapter 3: Data Needs
Chapter 4: Database Users
Chapter 5: Piping population databases
Important inputs are the conclusions that have been made based on the questionnaires presented in Chapter 4 and 5. The questionnaires together with all the answers and conclusions are given mainly in [6.4] but also in [6.5]. The conclusions from the questionnaires and their impact on the R-Book requirements are presented in Chapter 6.2.
6.1 Strategy for Phase 2
In [6.4] a compilation of the questionnaire on “User Requirements” sent to potential users of the R-Book is given together with answers and conclusions made based on the answers. Furthermore a set of “other issues” that was raised during the interviews is presented
Based on these user requirements as presented in [6.4] a strategy has been produced on what kind of information the R-Book will include in the first issue that will be produced during Phase 2 of the project.
The overall strategy for work with Phase 2 is listed below. The different subchapters in Chapter 6.2 gives more detailed information how the different user requirements in [6.4] will be met.
Overall work strategy for the continuous work with the R-Book project in Phase 2 will be:
A Identification of piping population data already existing for different NPPs that can be made available for the project.
B Based on the above a few systems will be selected and all quantitative and qualitative information that is to be found in the R-Book will be produced.
C A seminar with representatives from the utilities, the financiers NPSAG 4 and SKI will be held. At this seminar the results produced for these first systems according to B will be presented. Any remarks with respect to content or methods will be taken into account before the work continues with producing data for other systems as well.
D Continued work with producing data for the R-Book.
4 NPSAG – Nordic PSA Group

44
6.2 R-Book requirements
6.2.1 Applicability and level of detail
It is concluded that the main purpose of the R-Book will be to obtain data for PSA. The data presented will therefore be those necessary for PSA, any other possible application will be excluded, see also Chapter 6.2.6.
The R-Book will present a frequency of an initial defect, i.e. a defect of such magnitude that some kind of measure need to be taken (repair or replacement). However, this initial defect does not necessary mean that any kind of leakage occurred.
For each initial defect the conditional probability for a leakage will be calculated and by this a frequency for different levels of leakages can be presented. Conditional pipe failure probabilities will be developed for the uniquely defined consequences of structural failure using a technical approach as documented in PVP2007-26281 [6.1].
For different types of piping different levels of leakage will be presented. In Table 6.1, through-wall flow rates are presented at a pressure of approximately 15 MPa. This table is generated from NUREG-1829 [6.6] and it is also presented in Chapter 2.
Table 6.1 Through-wall Flow Rate to Break Size Correlations for Code Class 1 Piping
Equivalent Break Size BWR Liquid Release PWR Liquid Release
Diameter [mm]
Area [in2]
Flow Rate [gpm]
Flow Rate Flux [gpm/in2]
Flow Rate [gpm]
Flow Rate Flux [gpm/in2]
15 0.19635 116.8 595 134.9 687 25 0.78539 467.3 595 539.5 687 50 3.14159 1869.2 595 2158.2 687 75 7.06858 4205.8 595 4856.1 687 100 12.56637 7476.9 595 8633.1 687 150 28.27433 16823.2 595 19424.5 687 200 50.26548 29907.9 595 32220.2 641 250 78.53982 29452.4 375 50344.0 641 300 113.0973 42411.5 375 72495.4 641 400 201.0619 75398.2 375 128880.7 641 750 706.8583 265071.9 375 453096.2 641
Based on: - Moody, F.J., “Maximum Flow Rate of a Single Component, Two Phase Mixture,” Trans. J. Heat
Transfer, 86:134-142, February 1965. Applies to medium-and large-diameter piping. - Zaloudek, F.R., The Low Pressure Critical Discharge of Steam-Water Mixtures from Pipes, HW-68934,
Hanford Works, Richland (WA), 1961. Applies to small-and medium-diameter piping. 1 gpm = 6.3 � 10-2 kg/s
In order to make it possible to correlate a leak rate to a corresponding pipe break diameter the data tables in the R-Book will also contain a column with this information. Frequency of “structural failure” will be estimated on the basis of the resulting through-wall flow rate (kg/s). For Class 1 systems the correlations developed in NUREG-1829 [6.6] will be used. For other systems, leak rate calculations will be performed to establish realistic correlations between operating pressure and through-wall flaw size.

45
This work has already been completed, and, except for an independent review, no new development work is anticipated. Figure 6.1 shows through-wall flow rate as a function of flaw size for moderate-energy piping (e.g., SW piping).
0
100
200
300
400
500
600
700
8001 10 100 1000 10000
Peak Through-wall Flow Rate Given Structural Failure of Moderate-Energy Raw Water Piping [kg/s]
Nom
inal
Pip
e Si
ze [m
m]
The calculated through-wall flow ratesassume failure of SW supply side pipingwith operating pressure of 0.75 MPa (or110 psig)
Figure 6.1 Calculated Peak Through-wall Flow Rates for Failed SW Piping
With respect to leak rates, it is important to note that the database OPDE in itself do not contain any explicit information whether a certain leak did exceed limits given by the Technical Specification or not. This kind of information is however used in the leak rate definition as explained the Coding Guideline of OPDE [6.2].
6.2.2 Site specific or generic data?
In order to have a sufficient statistical data material, i.e. that does not give rise to “unrealistic” uncertainties, failure data in the R-Book will be valid for NPPs in Nordic countries, i.e. Sweden and Finland. Also, data will be presented for the world wide plant population. The reason for the world wide population is that for some systems failure defects may not be reported in one country to the same level as it is in another country. By presenting data for a world wide population as well the R-Book user will be able to choose between using a more site specific data (Nordic Countries) or a more generic data (World Wide).
Besides distinguishing between Nordic and world wide data the failure data will be presented for PWR and BWR, and also for different kinds of materials, i.e. stainless steel, carbon steel and nickel based alloys.
In order to represent world wide data, already existing piping component population data will be utilized (Scandpower RM). Already existing piping population data sets are summarized below with additional details presented in Attachment 10.
� B1/B2 (Class 1 systems; refer to SKI 98:30 [6.6])

46
� Class 1 & 2; 11 different BWR design generations (US)
� Class 1 & 2; 7 different PWR plants (2-/3- & 4-loop, US)
� Class 3 & 4 (non-safety-related; FPS, SW, IA, FWC & Steam/EXT-Steam); 4 different PWR plants (US)
� Literature data (no QA)
This information will be augmented with information as supplied by NPSAG members for Swedish NPPs. The Finish plants OL1 and OL2 will then be treated as similar as F1 and F2 with respect to piping component population.
To conclude, the R-Book will not present any plant-specific information. The presentation will be limited to Median, Lower Bound and Upper Bound estimates of component counts as derived from available information.
6.2.3 Piping components to be represented
Failure data in the R-Book will be presented for different types of piping components, according to the information available in the OPDE database. The level of detail with respect to this is expected to be as follows:
� Welds in different material
� Base metal
� T-joints
� Bends
If a more detailed differentiation is needed it will be up to each user to proceed with this.
6.2.4 Piping population data requirements
For each system in the work scope the following information will need to be provided:
� Number of components, differentiated according to
� Component type (e.g., weld, bend, elbow, reducer, tee, pipe, expansion joint)
� Diameter
� Material (carbon steel, stainless steel, nickel-based, low-alloy steel)
� For welds, information about the configuration (e.g., pipe-to-pipe, pipe-to-elbow, pipe-to-tee, pipe-to-valve)
� Code class (safety class)
� Isometric drawing ID (preferred but not absolutely necessary)
In Attachment 8 an example of piping population data is given. A question has been sent to the NPSAG representatives about already existing piping population information (databases). Based on the answers received it will be decided what systems in different plants that will be represented in the first draft of the R-Book in phase 2.

47
6.2.5 Traceability
Data will be extracted from the OPDE database using queries in MS Access. Each query used will be given a unique ID and be saved, probably in appendices to the R-Book. Information about the queries and version of the OPDE database used will be sufficient in order to reproduce the input data. If needed, the queries can be expanded in order to also list the individual failure reports in OPDE that was the result of each query.
Recorded in OPDE is any degraded condition that requires some kind of corrective measure to be taken (repair or replacement). The database includes “precursor events” (non-through-wall flaws) as well a through-wall flaws that generate active leakage. OPDE is continually growing with approximately 200 events per year. A new version of OPDE is released every six month.
Not all events have undergone full validation with respect to flaw size data and cause of degradation/damage. However, each event in OPDE are marked with a Completeness Index (CI) from 1 to 3; where 1 means that the event has been completely verified, 2 means that it have been verified but some kind of (non-critical) background information is missing, 3 means that the event has not been verified. When a query is executed on the OPDE database all events with CI=1 or CI=2 will be included in the event count. Some events with CI=3 may also show as a result for the query. In such cases it must be judged whether that event shall be included or excluded from the result. In case the flaw has been verified together with a damage mechanism causing the flaw, the event may be included. When events with CI=3 are included this must therefore also be documented in the R-Book.
In order to simplify the queries used a sub database of OPDE will be extracted for each system, e.g. OPDE_v#_BWR-313.
6.2.6 Parameters to be presented
Parameters that will be presented in the first issue of the R-Book are listed below:
�ik Frequency for an initial defect (calculated) Pik Conditional probability for a leak consequence given the initial defect (calculated) nik Number of events (result from query) fik Portion of the total piping component population in a system that is susceptible to certain degradation or damage mechanism (based on OPDE and RI-ISI Degradation Mechanism Assessments) Ni Number of piping components in population (results from query) Ti Exposure time, based on number of reactor years (from plant population database)
The methodology is described in detail in Chapter 2. This methodology has been subjected to independent reviews by the Los Alamos National Laboratory (LANL), the University of Maryland (UoM), and Korea Energy Research Institute (KAERI). The

48
reviews by LANL and UoM, respectively, are documented in TSA-1/99-164 (available fron the U.S. NRC Public Document Room, Accession Number 9909300045) and EPRI TR-110161 (Appendix A). The methodology has been implemented in Microsoft� Excel with Crystal Ball� for uncertainty propagation. An advantage of this implementation is that all calculations will be traceable.
6.2.7 Systems to be presented
The proposed scope of the R-Book is given below in a list of systems for which pipe failure data parameters will be derived. Table 6.2 presents the proposed work scope, which reflects intended risk-informed PSA applications. The systems that are listed in Table 6.1 cover the full range of risk-informed PSA applications (LOCA frequency estimation, HELB evaluations, internal flood PSA, RI-ISI).
Table 6.2 Scope of R-Book
OPDE Generic (1) Description Swedish
Designations
ADS BWR Primary Depressurization System (BWR) 314 AFW Auxiliary Feedwater System 327 CC Component Cooling Water System 711/712
COND Condensate System 414/430 (2) CRD Control Rod Drive (Insert/Removal/Crud Removal) 354 CS Containment Spray System 322
CVC Chemical & Volume Control System (PWR) 334 CW Circulating Water System 443 EXT Steam Extraction System 419/423 FPS Fire Protection System 762 FW Main Feedwater System 312/415 (3)
HPCS High Pressure Core Spray (BWR) -- HPSI High Pressure Safety Injection (PWR) -- LPCS Low Pressure Core Spray (BWR) 323 LPSI Low Pressure Safety Injection (PWR) 321 (LPSI) MS Main Steam System 311/411 (4)
MSR Moisture Separator Reheater System 422 RCS Reactor Coolant System (PWR) 313 RHR Residual Heat Removal System 321 RR Reactor Recirculation System (BWR) 313
RPV-HC RPV Head Cooling System (BWR) 326 RVLIS Reactor Vessel Level Indication System (BWR) 536 RWCU Reactor Water Cleanup System (BWR) 331
SFC Spent Fuel Pool Cooling System 324 S/G Blowdown Steam Generator Blowdown System (PWR) 337
SLC Standby Liquid Control System (BWR) 351 SW Service Water System 712/715
Notes: 1. See IEEE Std 805-1984 (IEEE Recommended Practice for System Identification in
Nuclear Power Plants and Related Facilities) for information on system boundary definitions and system descriptions.
2. 414 for F1/F2/R1/R2/R3/R4 and 430 for O1/O2/O3 3. 312 for O1/O2/O3 and 415 for F1/F2/R1/R2/R3/R4. Also note that 312 is the
designation for steam generators in Ringhals-2/3/4 4. 311 for O1/O2/O3 411 for F1/F2/R1/R2/R3/R4

49
Figure 6.2 shows the types of systems that are considered as potential flood sources in a typical internal flooding PSA study.
1.0E-08 1.0E-07 1.0E-06 1.0E-05 1.0E-04 1.0E-03
Service Water (SW)
Fire Protection (FP)
Circulating Water (CW)
Feedwater (FW)
Steam Extraction
High Pressure Steam
SI/CS RWST Suction
Component Cooling (CCW)
Failure Rate [1/m.Yr]
Figure 6.2 Calculated Pipe Failure Rates for Systems Included in the Scope of a Typical Internal Flooding PSA
6.2.8 Exposure term (pressure, temp, flow, chemistry etc.)
No special information regarding operating pressure and temperature, flow, water chemistry etc. will be included in the R-Book. Note, however, that in the qualitative and system-specific service history summaries there will be some general information given regarding the observed influence factors on damage and degradation mechanisms.
6.2.9 Language
The language of the R-Book will be English (US).
6.2.10 Treatment of “other issues” in [6.4]
This chapter deals with issues that were not initially listed in the questionnaire (Attachment 5) but was brought to the author’s attention during the interviews and are therefore documented in [6.4]. A summary of each “issue” is given in italic and after that information on how this will be handled in the R-Book is presented.

50
Impact of power uprate and modernization projects It is desired that the R-Book contains information on active damage mechanisms for different piping components/material during different operating condition. If such information can be provided it is possible to estimate effect of a future power increase or some other modernization, for instance change of material or water chemistry. For each plant system that is addressed by the R-Book relevant qualitative information on the service experience will be presented. The qualitative information will be organized according to a template as given by Table 6.3.
Table 6.3 Template for summarizing service experience history Plant System – e.g., BWR 313 Event History (Failure Count) Degradation Mechanism (DM#) 1970-1979 1980-1989 1990-1999 2000-2007
Worldwide DM1 Nordic Worldwide DM2 Nordic Worldwide DM3 Nordic Worldwide DM4 Nordic
Notes: a – Mitigation program b – Water chemistry c - Material (e.g., typical types, material compositions) d - Ageing effects (including effects of power uprate projects) e - Non-destructive examination (NDE)
A set of notes (“a” through “e” in Table 6.3) addresses key piping reliability influence factors. These notes provide additional information on conditions that are judged to be of importance with respect to the number of observed defects. With this information the user of the R-Book can form conclusions about different conditions and their observed effects on the number of defects that are recorded in OPDE. These conditions might for instance be ageing effects, effects of change of material, but also change in NDE methods. The influence factors on piping performance are interrelated. For example, a power uprate may cause increased wear effects on secondary system piping. But mitigation programs (e.g., replacement of original carbon steel piping with piping of low alloy steel) and improved NDE could offset a projected (or assumed) increase in observed failure rate.
Attachment 9 includes an example of service experience history for BWR Reactor Recirculation piping (System 313 according to the Nordic industry nomenclature).
Material designations According to different standards, the same material may have different designations. It is therefore important to have a cross reference of different material standards. OPDE has already produced such a cross reference matrix. This matrix will be included as an appendix to the R-Book.

51
Human Errors A question was raised about how human errors will be treated in the R-Book, perhaps they should be excluded, or at least listed separately? OPDE clearly identifies recordable/reportable flaw indications that are attributed to “Design & Construction Errors/Defects” (D&C). In the classification scheme that has been adopted by OPDE, “human error” is a subset of D&C and applies only to failures of small-bore piping (e.g., instrument sensing lines) that are attributed to maintenance personnel inadvertently making contact with the affected piping. In general, “D&C” can be contributing to the formation of a degraded condition (e.g., lack of weld fusion) but not a direct cause of failure. The format that will be adopted for presenting the event population data clearly documents the role, if any, of “human error.”
References to other data sources It would be good if some kind of reference can be made to other data sources that present similar data as the one presented in the R-Book. The “R-Book” is intended as an autonomous current reference subject to quality control and restricted access in the same way as the current “T-Book” for active components. The “R-Book” will not reproduce any historical failure parameters. It is not the objective of the project to validate and verify any historical parameter estimates. It is noted that ample information on other data sources and historical parameter estimates already exists in published SKI Research Reports.
6.3 Prior distribution
One important step in the statistical calculations is the choice of prior distribution. The prior distribution will differ from system to system and the justifications for selected priors will be documented in the R-Book. The prior distributions to be used include non-informative priors and empirical prior distributions.
6.4 Quality Assurance
The overall approach to the statistical estimation process selected for the R-Book will utilize key elements of an approach that already has been subjected to an independent peer review by the Los Alamos National Laboratory – see also the methodology overview in Chapter 6.2.6. The R-Book will contain an appendix where the calculation methods will be described together with a reference to the independent review.
6.5 Software used for R-Book
The software used for the deriving the data in the R-Book will be:
� Microsoft® Excel
� Crystal Ball® (Monte Carlo simulations)
� R-DAT (Bayesian statistics/updating).
Data from OPDE will be exported to Excel together with the prior distributions. The updating of frequencies is then performed with R-DAT. In the last step the calculation of conditional probabilities will be performed using Excel, together with Crystal Ball for the Monte Carlo simulations. It is an “open” analysis format with full transparency of each calculation step.

52
6.5.1 Uncertainty distribution
Crystal Ball® produces percentiles for the uncertainty distributions. These will be presented in the R-Book in the same manner as they are presented in the T-Book. Even though it may be possible to let Crystal Ball® suggest a parametric distribution this possibility will not be used. The reason for this is that it is not certain that the parametric distribution will satisfy requirements of conservatism in all cases and therefore only percentiles in a discrete distribution will be presented.
In the main tables in the R-Book the 5th, 50th and 95th percentiles will be presented. In additional files extended distributions will be given in the same way as in the T-Book.
6.6 Overall time schedule for Phase 2
The overall time schedule for the R-Book phase 2 project will be as follows:
Winter – spring 2008
� Guidance on how statistical calculation shall be performed will be produced. This will be included as an appendix in the R-Book.
� Based on the response from each project member NPP regarding piping population counts, decision will be made on what systems to be included first in the R-Book.
� Historical qualitative summary and information for systems in the work scope.
� Perform first “trial calculations” with already existing piping populations.
� Description of calculation methodology will be included as an appendix in the R-Book.
Spring – summer 2008
� During the May – June 2008 timeframe a seminar will be held where the results for the first set of systems are presented. At this seminar presentation of data and other information will be discussed together with a practical demonstration of the calculation methodology used. Upon completion of the seminar decisions will be made relative to any changes regarding scope, methodology or data presentation format. Changes, if any, will be implemented before end of June 2008.
Autumn – winter 2008/2009
� During the autumn of 2008 calculations will commence for remaining systems provided that sufficient exposure data sets have been assembled.
6.7 Access to OPDE database
All Swedish nuclear plant operators have access to the complete version of OPDE database. The Terms & Conditions of the OPDE Project provide specific provisions for access and use of the database by contractors performing work for OPDE member organizations. Respective OPDE National Coordinator is responsible for upholding the OPDE Terms & Conditions. A protocol has been established for how to grant database user permissions.

53
7 List of References 2 Chapter 2 Existing Pipe Failure Databases 2.1 Bamford, W. and Hall, J.F., A Review of Alloy 600 Cracking in Operating
Nuclear Plants Including Alloy 82 and 182 Weld Behavior, Paper ICONE12-49520, 12th International Conference on Nuclear Engineering, Arlington (VA), April 25-29, 2004.
2.2 Beliczey, S. and Schulz, H., The Probability of Leakage in Piping Systems of Pressurized Water Reactors on the Basis of Fracture Mechanics and Operating Experience, Nuclear Engineering and Design, 102:431-438, 1987.
2.3 Bush, S. et al, Nuclear Reactor Piping Failures at U.S. Commercial LWRs: 1961-1997, TR-110102 (EPRI Licensed Material), Electric Power Research Institute, Palo Alto (CA), 1998.
2.4 Bush, S. et al, Piping Failures in U.S. Nuclear Power Plants 1961-1995, SKI Report 96:20, Swedish Nuclear Power Inspectorate, 1996.
2.5 Dominion Energy Kewauneee, Inc., 2005. Kewaunee Power Station Flooding Significance Determination Process Risk Assessment Report, Serial No. 05-746, Kewaunee (WI), (NRC Public Document Room, Accession No. ML053180483).
2.6 Eide, S.A. et al, Component External Leakage and Rupture Frequency Estimates, EGG-SSRE-9639, Idaho National Engineering Laboratory, Idaho Falls (ID), 1991.
2.7 Fleming, K.N. and Lydell, B.O.Y., Database Development and Uncertainty Treatment for Estimating Pipe Failure Rates and Rupture Frequencies, Reliability Engineering and System Safety, 86:227-246, 2004.
2.8 Fleming, K.N. and Lydell, B.O.Y., Guidelines for Performance of Internal Flooding Probabilistic Risk Assessment (IFPRA), Draft Report (May 31), Electric Power Research Institute, Palo Alto (CA), 2006.
2.9 Fleming, K.N. and Lydell, B.O.Y., Pipe Rupture Frequencies for Internal Flooding Probabilistic Risk Assessment (PRAs), 1012302 (EPRI Licensed Material), Electric Power Research Institute, Palo Alto (CA), 2006.
2.10 Fleming, K.N., Markov Models for Evaluating Risk-informed In-service Inspection Strategies for Nuclear Power Plant Piping, Reliability Engineering and System Safety, 83:27-45, 2004.
2.11 Gott, K., Skador i svenska kärnkraftanläggningars mekaniska anordningar 1972-2000, SKI Rapport 02:50, Swedish Nuclear Power Inspectorate, Stockholm (Sweden), 2002.
2.12 Jamali, K. et al, Pipe Failure Study Update, TR-102266, Electric Power Research Institute, Palo Alto (CA), 1993.
2.13 Jamali, K., Pipe Failures in U.S. Commercial Nuclear Power Plants, TR-100380, Electric Power Research Institute, Palo Alto (CA), 1992.
2.14 Janzen, P., A Study of Piping Failures in U.S. Nuclear Power Reactors, AECL-Misc-204, Atomic Energy of Canada Limited, Chalk River (Canada), 1981.

54
2.15 Mikschl, T and Fleming, K.N. et al, Piping System Failure Rates and Rupture Frequencies for Use in Risk Informed In-service Inspection Applications, TR-111880 (EPRI Licensed Material), Electric Power Research Institute, Palo Alto (CA), 1999.
2.16 Moosemiller, M. and Weber, B., Guidelines for Improving Plant Reliability through Data Collection and Analysis, Center for Chemical Process Safety, American Institute of Chemical Engineers, New York (NY), 1998.
2.17 Nuclear Energy Institute, Probabilistic Risk Assessment Peer Review Process Guideline, NEI 00-02, Washington (DC), 2000.
2.18 Nyman, R. et al, Reliability of Piping System Components. Volume 1: A Resource Document for PSA Applications, SKI Report 95:58, Swedish Nuclear Power Inspectorate, Stockholm (Sweden), 1995.
2.19 Nyman, R. et al, Reliability of Piping System Components. Framework for Estimating Failure Parameters from Service Data, SKI Report 97:26 (3rd Edition), Swedish Nuclear Power Inspectorate, Stockholm (Sweden), 2005.
2.20 OECD Nuclear Energy Agency, OPDE 2007:2 Coding Guideline (OPDE-CG), OPDE PR01, Version 4.0, Issy-les-Moulineaux (France), 2007.
2.21 OECD Nuclear Energy Agency, OECD-NEA Piping Failure Data Exchange Project (OPDE). Workshop on Database Applications, OPDE/SEC(2004)4, Seoul (Republic of Korea), December 8, 2004.
2.22 Petterson, L. et al, Handbook on Quality of Reliability Data, An ESReDA Working Group Report, Statistical Series No. 4, Det Norske Veritas, Høvik (Norway), 1999.
2.23 Poloski, J.P et al, Rates of Initiating Events at U.S. Nuclear Power Plants:1987-1995, NUREG/CR-5750, U.S. Nuclear Regulatory Commission, Washington (DC), 1999.
2.24 Stevens, B. (Editor), Guide to Reliability Data Collection and Management, EuReDatA Project Report No. 3, Commission of the European Communities, Joint Research Centre, Ispra Establishment, Ispra (Italy), 1986.
2.25 Swedish Nuclear Power Inspectorate, Statens kärnkraftinspektions föreskrifter om mekaniska anordningar i vissa kärntekniska anläggningar, (Regulations Concerning Mechanical Equipment) SKIFS 2005:2, Stockholm (Sweden), 2005.
2.26 The American Society of Mechanical Engineers, ASME RA-S-2002 Standard for Probabilistic Risk Assessment for Nuclear Power Plant Applications, ASME RA-Sb-2005 (Addenda to ASME RA-S-2002), New York (NY), 2005.
2.27 Tregoning, R., Abramson, L. and Scott, P., Estimating Loss-of-Coolant-Accident (LOCA) Frequencies through the Elicitation Process, NUREG-1829 (Draft for Comments), U.S. Nuclear Regulatory Commission, Washington (DC), June 2005.5
2.28 Wright, R.E., Steverson, J.A. and Zuroff, W.F., Pipe Break Frequency Estimation for Nuclear Power Plants, NUREG/CR-4407, U.S. Nuclear Regulatory Commission, Washington (DC), 1987.
5 Final report to be published in December 2007.

55
3 Chapter 3 Pipe Failure Parameter Estimation & Requirements on Data Sources
3.1 Attwood, C.L. et al, Handbook of Parameter Estimation for Probabilistic Risk Assessment, NUREG/CR-6823, U.S. Nuclear Regulatory Commission, Washington (DC), 2003.
3.2 Fleming, K.N. and Lydell, B.O.Y., Pipe Rupture Frequencies for Internal Flooding Probabilistic Risk Assessment (PRAs), 1012302 (EPRI Licensed Material), Electric Power Research Institute, Palo Alto (CA), 2006.
3.3 Fleming, K.N., T. Mikschl, D. Bidwell, J. Read and B. Wiedemeier. Piping System Reliability and Failure Rate Estimation Models for Use in Risk-Informed In-Service Inspection Applications, TR-110161, Electric Power Research Institute, Palo Alto (CA), 1998.
3.4 Lydell, B.O.Y. Reliability of Raw Water Piping Systems in Commercial Nuclear Power Plants, technical paper prepared for publication in Nuclear Engineering and Design, 2006.
3.5 Nuclear Energy Agency. OPDE 2006:1 Coding Guideline, OPDE PR01, Version 02, Issy-les-Moulineaux (France), 2006.
3.6 Rudland, D., H. Xu, G. Wilkowski, P. Scott, N. Ghadiali and F. Brust, Development of a New Generation Computer Code (PRO-LOCA) for the Prediction of Break Probabilities for Commercial Nuclear Power Plants Loss-of-Coolant Accidents, PVP2006-ICPVT11-93802, Proc. ASME-PVP 2006: 2006 ASME Pressure Vessels and Piping Division Conference, July 23-27, 2006, Vancouver (BC), Canada.
3.7 Simonen, F.A., S.R. Doctor, S.R. Gosselin, D.L. Rudland, G.W. Wilkowski and B.O.Y. Lydell, Probabilistic Fracture Mechanics Evaluation of Selected Passive Components, draft NUREG/CR report prepared Office of Nuclear Regulatory Research, U.S. Nuclear Regulatory Commission, 2006.
3.8 The American Society of Mechanical Engineers, Standard for Probabilistic Risk Assessment for Nuclear Power Plant Applications, ASME RA-Sb-2005 (Addenda to ASME RA-S-2002), New York (NY), 2005.
3.9 Tregoning, R., Abramson, L. and Scott, P., Estimating Loss-of-Coolant-Accident (LOCA) Frequencies through the Elicitation Process, NUREG-1829 (Draft for Comments6), U.S. Nuclear Regulatory Commission, Washington (DC), June 2005.
3.10 Zigler, G., J. Brideau, D.V. Rao, C. Shaffer, F. Souto and W. Thomas. Parametric Study of the Potential for BWR ECCS Strainer Blockage Due to LOCA Generated Debris, NUREG/CR-6224, U.S. Nuclear Regulatory Commission, Washington (DC), 1995.
6 Final version to be published in September 2006.

56
4 Chapter 4 Questionnaire – Database users 4.1 Relcon Scandpower PM 2005153-M-010, Task 2 – Database Users –
Sammanställning och slutsatser, Anders Olsson, 2007-08-29
5 Chapter 5 Questionnaire – Piping Population Databases 5.1 Relcon Scandpower PM 2005153-M-011, R-book Task 4 – Piping Population
Databases, Questionnaire – Sammanställning & Slutsatser, Anders Olsson, 2007-08-30
6 Chapter 6 R-book project Scope of phase 2 6.1 ASME PVP2007-26281, THE PROBABILITY OF PIPE FAILURE ON THE
BASIS OF OPERATING EXPERIENCE, Bengt Lydell
6.2 OECD Nuclear Energy Agency, OPDE 2006:1 Coding Guideline (OPDE-CG), OPDE PR01, Version 1.0, Issy-les-Moulineaux (France), 2006.
6.3 Project specification RELCON Rapport 2003112-R-001, Reliability Data for Piping Components in Nordic Nuclear Power Plants (R-book) – Phase 1, Anders Olsson, 2004-11-04
6.4 Relcon Scandpower PM 2005153-M-010, Task 2 – Database Users – Sammanställning och slutsatser, Anders Olsson, 2007-08-29
6.5 Relcon Scandpower PM 2005153-M-011, R-book Task 4 – Piping Population Databases, Questionnaire – Sammanställning & Slutsatser, Anders Olsson, 2007-08-30
6.6 SKI Report 98:30, Failure Rates in Barsebäck-1Reactor Coolant Pressure Boundary Piping, An Application of a Piping Failure Database, Bengt Lydell, May 1999
6.7 US NRC NUREG-1829, Estimating Loss-of-Coolant Accident (LOCA) Frequencies Through the Elicitation Process

Attachment 1: Existing Pipe Failure Databases – Appendix A
57
Attachment 1: Existing Pipe Failure Databases – Appendix A
Excerpts from selected databases

Atta
chm
ent 1
: Exi
stin
g Pi
pe F
ailu
re D
atab
ases
– A
ppen
dix
A
58
DA
TE
TYPE
PL
AN
T D
ATA
SO
UR
CE
EVEN
T D
ESC
RIP
TIO
N
SYST
EM
AG
E[h
rs]
SIZE
C
OM
MEN
T
4/15
/197
3 BW
-PW
R
AN
O-1
D
L LT
R 5
/25/
73
Leak
S
tress
cor
rosi
on
Con
tain
men
t spr
ay
-113
5221
3mm
2/28
/199
0 BW
-PW
R
AN
O-1
90
-001
Le
ak
Coo
ling
coil
leak
s, c
orro
sion
pitt
ing
Ser
vice
wat
er
1365
60<2
5mm
Pip
e si
ze is
judg
ed to
be
less
than
1
inch
.
4/10
/198
5 BW
-PW
R
AN
O-1
P
NO
-IV-8
5-01
5 Le
ak
Ero
sion
/cor
rosi
on
Ser
vice
wat
er
9372
0 1,
5
9/6/
1983
BW
-PW
R
AN
O-1
83
-019
Le
ak
Fatig
ue-v
ibra
tion
Rea
ctor
coo
lant
79
752
19m
m
8/28
/197
6 BW
-PW
R
AN
O-1
R
O 7
6-24
Le
ak
Leak
ed w
elds
on
valv
e, fa
tigue
-vib
ratio
n R
HR
S 18
192
12,7
mm
12/2
2/19
90
BW-P
WR
A
NO
-1
90-0
21
Leak
S
tress
cor
rosi
on c
rack
ing
Con
tain
men
t hea
t rem
oval
14
3688
50m
m
4/15
/197
4 BW
-PW
R
AN
O-1
Lt
r DL
4/15
/74
Leak
Fa
tigue
-vib
ratio
n M
akeu
p sy
stem
-2
592
50m
m
2/16
/198
2 C
E-PW
R
AN
O-2
82
-007
Le
ak
Fatig
ue-v
ibra
tion
Ser
vice
wat
er
2815
2 25
mm
4/4/
1982
C
E-PW
R
AN
O-2
82
-007
Le
ak
Fatig
ue-v
ibra
tion
Acc
umul
ator
s 29
280
25m
m
5/5/
1982
C
E-PW
R
AN
O-2
82
-017
Le
ak
Cra
cked
wel
d R
eact
or w
ater
cle
anup
30
024
25m
m
8/13
/198
5 C
E-PW
R
AN
O-2
85
-015
, 016
R
uptu
re/L
eak
Wat
er h
amm
er
Con
dens
ate
5872
8 50
mm
6/23
/198
9 C
E-PW
R
AN
O-2
P
NO
-IV-8
9-04
2 Le
ak
Fatig
ue-v
ibra
tion
at p
ress
ure
sens
ing
line
seal
ant
Rea
ctor
coo
lant
92
568
<25m
mP
ipe
size
is ju
dged
to b
e le
ss th
an
1 in
ch.
5/4/
1994
W
E-P
WR
B
eave
r Val
ley-
194
-004
Le
ak
2 ft.
sec
tion
of p
ipe
repl
aced
, unk
now
n ca
use
PRZ
1578
48
1/19
/198
2 W
E-P
WR
B
eave
r Val
ley-
182
-002
C
rack
Fr
ozen
pip
e C
oola
nt re
circ
ulat
ion
5013
6 <2
5mm
Pip
e si
ze is
judg
ed to
be
less
than
1
inch
.
5/14
/198
0 W
E-P
WR
B
eave
r Val
ley-
180
-036
C
rack
/Lea
k Fa
tigue
-vib
ratio
n B
oric
aci
d 35
376
25m
m
9/25
/198
0 W
E-P
WR
B
eave
r Val
ley-
1R
O
Rup
ture
/Lea
k O
pera
tor e
rror
FP
S
3859
2 >2
5mm
Pip
e si
ze is
judg
ed to
be
grea
ter
than
1 in
ch.
10/2
9/19
81
WE
-PW
R
Bea
ver V
alle
y-1
81-0
91R
1 R
uptu
re/L
eak
Und
ergr
ound
ext
erna
l cor
rosi
on
FPS
48
168
304m
m
6/8/
1975
W
E-P
WR
B
eave
r Val
ley-
1P
robl
em re
port
6/20
/75
Leak
Fa
tigue
-vib
ratio
n S
IS
-787
2 19
mm
Tabl
e 1A
-1 E
xcer
pt fr
om S
KI 9
6:20
Dat
abas
e [2
.4]

Atta
chm
ent 1
: Exi
stin
g Pi
pe F
ailu
re D
atab
ases
– A
ppen
dix
A
59
PLA
NT
NAM
E D
ATE
SY
STEM
D
IAM
ETER
[inch
] FA
ILU
RE
TYPE
DA
TA S
OU
RC
EC
AU
SE-1
C
AU
SE-2
C
AU
SE-3
C
OM
MEN
T
Sal
em-2
1/
17/9
0 B
oron
Inje
ctio
n 1
Leak
LE
R 9
0-00
5 C
orro
sion
A
cid
Cor
rosi
on
--
Leak
ed w
eld,
cor
rosi
on, m
ode-
3
Qua
d C
ities
-2
1/28
/90
RH
R
12
Leak
N
PRD
S FA
C
Sin
gle-
Pha
se F
AC
--
S
ched
ule
40 (w
all t
hick
ness
)
AN
O-1
2/
28/9
0 S
ervi
ce W
ater
<
1 Le
ak
LER
90-
001
Cor
rosi
on
Pitt
ing
--
Coo
ling
coil
leak
s, c
orro
sion
pitt
ing
Bru
nsw
ick-
1 (N
OTE
1)
3/2/
90
Mai
n St
eam
6
Rup
ture
/ S
ever
ed
LER
90-
003
FAC
W
et S
team
Ero
sion
--
Ero
sion
/cor
rosi
on
Clin
ton
3/3/
90
Con
dens
ate
Dra
in8
Leak
N
PRD
S FA
C
Cav
itatio
n --
S
ched
ule
40, p
inho
le le
ak, s
hutd
own
Thre
e M
ile
Isla
nd-1
3/
4/90
Fe
edw
ater
8
x 6
Leak
N
PRD
S FA
C
Sin
gle-
Pha
se F
AC
--
S
ched
ule
80, 8
x 6
inch
redu
cer,
hole
in p
ipe
Bru
nsw
ick-
1 (N
OTE
2)
3/20
/90
Unk
now
n >
1 Fa
iled
LER
90-
004
Con
stru
ctio
n / F
abric
atio
n D
efec
tE
rror
E
rror
In
stal
latio
n E
rror
PV
C la
ck o
f bon
d, 8
prio
r eve
nts
LER
s 86
-6, 8
7-13
, 87-
22, 8
9-10
, 89-
22
As o
ne p
ersp
ectiv
e on
the
diff
eren
ce b
etw
een
a C
at0
and
Cat
2 da
taba
se, t
wo
exam
ples
of t
he ty
pe o
f val
idat
ion
expe
cted
of a
Cat
2 da
taba
se a
re in
clud
ed:
This
reco
rd is
bas
ed o
n in
form
atio
n in
LER
-title
(LER
90-
003-
00: “
On
9003
02, H
PCI s
ys d
ecla
red
inop
erab
le to
stop
leak
on
stea
m su
pply
dra
in li
ne. C
ause
d by
seve
re st
eam
ero
sion
at
90-d
egre
e el
bow.
Invo
lved
sect
ion
of p
ipin
g re
plac
ed o
n U
nits
1 &
2).”
In c
reat
ing
this
dat
abas
e re
cord
onl
y th
e LE
R ti
tle in
form
atio
n w
as u
tiliz
ed, h
owev
er. F
or re
fere
nce,
the
full-
text
LE
R is
incl
uded
on
next
pag
e. T
he a
ffec
ted
com
pone
nt w
as a
1-in
ch (D
N25
) 90-
degr
ee e
lbow
, par
t of t
he H
igh
Pres
sure
Coo
lant
Inje
ctio
n (H
PCI)
Sys
tem
. Thi
s sys
tem
util
izes
a tu
rbin
e-dr
iven
pum
p, w
hich
take
s suc
tion
from
a c
onde
nsat
e st
orag
e ta
nk.
This
reco
rd c
once
rns P
VC
pip
ing
in th
e ch
lorin
atio
n sy
stem
for t
he c
ircul
atin
g w
ater
syst
em. T
he su
bjec
t LER
doe
s not
incl
ude
deta
ils o
n th
e pl
astic
pip
ing
(e.g
., di
amet
er o
r wal
l th
ickn
ess)
.
Tabl
e 1A
-2 E
xcer
pt fr
om T
R-11
0102
Dat
abas
e [2
.3]7
7 Ann
otat
ions
(in
shad
ed c
ells
) add
ed b
y th
e au
thor
s of t
his r
epor
t

Attachment 1: Existing Pipe Failure Databases – Appendix A
60
Licensee Event Report (LER): 50-325/1990-003-00 (Brunswick-1, BWR) TITLE: On 900302, HPCI sys declared inoperable to stop leak on steam supply drain line. Caused by severe steam erosion at 90-degree elbow. Involved section of piping replaced on Units 1 & 2).
ABSTRACT: At 1505 on March 2, 1990, the Unit 1 HPCI system steam supply isolation valves were manually closed to stop a steam leak located on the steam supply drain line. Attempts to isolate the leak from the steam supply without closing the isolation valves had been unsuccessful. A visual examination of the drain line revealed that severe steam erosion had resulted in a through wall failure. The failure was at a ninety degree elbow in a section of the drain line which had been installed since construction. Investigation revealed that a similar section of drain line existed on the Unit 2 HPCI system. The section of piping was replaced on both units. A work request has been initiated to investigate and repair the cause of the inability to isolate the leak without closing the steam supply isolation valves. Future monitoring of the piping will be in accordance with the Erosion/corrosion inspection Program. At the time of this event, Unit 1 was at 100% power with ECCS and RCIC systems operable in standby line up. Unit 2 reactor was shutdown in a refuel/maintenance outage. The safety significance of this event was minimal. This is considered an isolated event.
EVENT: Manual closure of the Steam supply isolation Valves to HPCI to isolate a steam leak on the steam supply drain pot line.
INITIAL CONDITIONS: The Unit 1 reactor was at 100% power. The HPCI, RCIC, ADS, CS and RHR/LPCI systems were operable in standby lineup. The Unit 2 reactor was shutdown in a refuel and maintenance outage.
EVENT DESCRIPTION: At 1505, on March 2, 1990, the Unit 1 CO received a report of a six to ten foot steam plume at the HPCI mezzanine from the reactor building AO. At 1510, the CO was informed that the leak was on the HPCI Steam Supply Drain Pot drain line. The CO closed the Supply Drain Pot Inboard and Outboard Drain valves, 1-E41-F028 and F029, in an attempt to isolate the leak. The leak appeared to increase. The CO reopened the referenced valves and instructed the AO to isolate the leak by closing the Supply Drain Pot Normal operating orifice upstream and Downstream Isolation valves, 1-E41-F036 and 1-E41-F037 and by failing closed the supply drain pot drain bypass valve, 1-E41-F054; but the leak continued. A second attempt to isolate the leak by closing 1-E41-F028 and F029 was not successful and, at 1539, the HPCI Steam Supply Inboard and Outboard Isolation Valves, 1-E41-F002 and 1-E41-F003 were closed. AOP 5.0, Radioactive Spills, High Radiation and Airborne Activity, was referenced to determine additional actions, Health Physics personnel were informed of the need to survey the area, a steam blanket was placed over the line break, additional room cooling was established and HPCI LCO A1-90-0295 and WR/JO 90-AEUM1 were initiated. The eroded section of piping was replaced and HPCI was returned to service at 1550, on March 4, 1990.
EVENT INVESTIGATION/CAUSE: A visual examination of the involved piping (1-inch, carbon steel) revealed that the through wall failure was caused by severe steam erosion at a ninety degree elbow which experiences continual discharge of high temperature, high pressure condensate to the lower pressure of the condenser. A review of plant documentation revealed that the elbow and an associated run of piping (approximately twenty feet) had been installed since plant construction. The remainder of the Unit 1 equipment drain line had been replaced by a plant modification (PM 82-137) installed in 1985. As a result of this event, a review of the corresponding Unit 2 plant modification (PM 82-138), installed in 1984, revealed that it also had a section of piping that had not been replaced by plant modification. As part of the Erosion/corrosion inspection Program set forth in Engineering Procedure 51 (approved in January 1990 to address Generic Letter 89-08 concerns), an ultrasonic exam was performed, for the first time, during this Unit 2 outage

Attachment 1: Existing Pipe Failure Databases – Appendix A
61
Licensee Event Report (LER): 50-325/1990-003-00 (Brunswick-1, BWR) the first 45 degree elbow located downstream of the steam drain pot drain line and associated bypass line. The results were satisfactory. However, the elbow tested was upstream of the piping which had not been replaced. This elbow was chosen for inspection based on the belief that the entire run of line had been replaced by PM 82-138 and that it is expected to experience the greatest amount of turbulence and erosion. After reviewing the 1984 plant modification, it was decided to replace the same section of piping on Unit 2 which failed on Unit 1. The replacement was completed in accordance with WR/JO 90-AEXK1 prior to Unit 2 start-up. During replacement it was noted that this section of line had experienced erosion. The Erosion/Corrosion inspection Program has scheduled an initial inspection on the Unit 1, HPCI steam pot drain line during its upcoming 1990 Refuel Outage. The referenced plant modifications also involved replacement of the steam supply line drain pot line associated with the RCIC system. The modifications were reviewed to ensure that appropriate points were chosen for inspection under the Erosion/Corrosion Program. As a result, a 90 degree elbow was added as an additional inspection point on the RCIC steam pot drain line to assure the integrity of this piping. This 90-degree elbow on RCIC received an ultrasonic exam prior to Unit 2 start-up from the 1989/1990 outage and was found to be satisfactory. While attempting to isolate the leak, closure of the 1-E41-F028 and P029
served to isolate the HPCI steam supply drain line from the common HPCI/RCIC steam supply drain line to the condenser. The removal of the flow path to the lower pressure of the condenser resulted in the observed increased leakage. Closing the 1-E41-F036, F037 and F054, which are upstream of the through wall, along with closure of the F028 and F029 should have stopped the steam leak. However, the leak appeared to be unchanged and it was necessary to close the HPCI steam supply isolation valves to stop the steam leakage. This indicates that the HPCI Steam Supply Drain Pot Drain Bypass valve may be leaking by its seat and WR/JO 90- AEUR1 has been initiated to investigate and repair the valve as required.
CORRECTIVE ACTIONS: The involved section of piping has been replaced on Unit 1 and on Unit 2. Future monitoring will be in accordance with the Erosion/corrosion Inspection Program. WR/JO 90-AEUR1 has been initiated on the 1-E41-F054.8
EVENT ASSESSMENT: The safety significance of this event is minimal. The steam leak was discovered by plant personnel and was not of sufficient magnitude to initiate an automatic closure of the HPCI steam line valves. In addition, HPCI was available for its intended function until it was manually isolated. While HPCI was inoperable for repairs the other ECCS systems and RCIC were operable and no plant event occurred which required HPCI operation. This is considered an isolated event.
8 WR/JO = Work Request / Job Order

Attachment 2: Existing Pipe Failure Databases – Appendix B
62
Attachment 2: Existing Pipe Failure Databases – Appendix B
PIPExp Database Summary for Month of
February, 2006
Double click on icon to open file
To save file, double click on icon and “save copy as” in folder of choice
Embedded file: PIPExp-2006 Database Summary for Month of February 2006
PIPExp-2006-02.pdf

Attachment 3: Existing Pipe Failure Databases – Appendix C
63
Attachment 3: Existing Pipe Failure Databases – Appendix C
Opde Web-Based User Interface
OPDE database resides on a secure server (HTTPS protocol) at NEA Headquarters � Access to website requires user name and password
� Four security levels
� NEA administrator
� Clearinghouse (data input, upload/download, review, edit)
� National Coordinator (input/edit national data, download data when new database version is available)
� Plant operators (input national data); access restricted to owner’s data
� Automated e-mail alerts when new records are available for review/validation
� Web browser sufficient for data manipulations – no need to install new software
� Independent of Access program version.
Figure 3C-1 OPDE Database Web-access

Attachment 3: Existing Pipe Failure Databases – Appendix C
64
Figure 3C-2 OPDE Menu
Figure 3C-3 New Database Records

Attachment 3: Existing Pipe Failure Databases – Appendix C
65
Figure 3C-4 OPDE Data Input Form

Attachment 4: Existing Pipe Failure Databases – Appendix D
66
Attachment 4: Existing Pipe Failure Databases – Appendix D
Examples of Compilations of Piping Reliability Parameters
Examples of Compilations of Piping Reliability Parameters This appendix presents examples of how piping reliability parameters may be presented in a “Pipe Failure Data Handbook”: Example 1 is reproduced from NUREG-1829, Appendix D [2.27]. It represents the type of parameters used in LOCA frequency assessment or RI-ISI program development. The derived failure rates are conditional on location within a Reactor Recirculation System (313). These location-dependencies are implicitly representative of different weld residual stresses. Example 2 is adapted from EPRI 1012302 [2.9]. It represents the type of parameters used in internal flooding PSA. The derived failure rates are for carbon steel raw water piping and are conditional on water quality. Example 3 is reproduced from Appendix A, Attachment 3 of the October 2005 “Kewaunee Power Station Flooding Significance Determination Process Risk Assessment Report.” This document includes reliability parameters for use in High Energy Line Break (HELB) analysis.

Attachment 4: Existing Pipe Failure Databases – Appendix D
67
Example 1
Posterior BWR-Specific Weld Failure Rate Distributions [2.27] Failure Rate Uncertainty Distribution Parameters
[(�TS Leak)/Weld-yr] System Pipe Size Weld Configuration
Mean 5%-tile 50%-tile 95%-tile Elbow-to-pipe 4.32E-05 8.48E-06 3.17E-05 1.16E-04
Nozzle-to-safe-end 4.38E-05 5.52E-06 2.72E-05 1.36E-04
Pipe-to-safe-end 2.99E-05 2.98E-06 1.70E-05 9.64E-05
Pipe-to-sweepolet 3.14E-05 2.80E-06 1.71E-05 1.06E-04
RR (313) DN300
Pipe-to-reducer 7.82E-05 5.71E-06 3.97E-05 2.77E-04
Pipe-to-end-cap 1.54E-04 2.28E-05 1.01E-04 4.52E-04
Pipe-to-cross 4.24E-05 4.38E-06 2.47E-05 1.37E-04 RR
(313) DN550
Pipe-to-sweepolet 7.37E-05 7.02E-06 4.09E-05 2.40E-04
Pipe-to-elbow 8.52E-05 1.59E-05 6.07E-05 2.33E-04
Nozzle-to-safe-end 6.55E-05 5.95E-06 3.61E-05 2.15E-04
Pipe-to-safe-end 1.44E-04 2.11E-05 9.36E-05 4.28E-04
Pipe-to-valve 5.96E-05 7.68E-06 3.75E-05 1.84E-04
Pipe-to-pump 8.36E-05 8.68E-06 4.85E-05 2.71E-04
Pipe-to-tee 5.78E-05 5.06E-06 3.13E-05 1.96E-04
Pipe-to-pipe 1.29E-05 5.74E-07 5.25E-06 4.78E-05
Pipe-to-cross 3.86E-05 7.89E-07 1.08E-05 1.50E-04
RR (313) DN700
Reducer-to-cross 3.86E-05 7.89E-07 1.08E-05 1.50E-04
Example 2 PWR-Specific Service Water Pipe Failure Parameters
Lake Water Service Environment [2.3]
Component Boundary & Size Failure Rate Uncertainty Distribution
Type Diameter [inch] Mean 5th
Percentile Median 95th Percentile
� � 2” 1.15E-04 7.15E-05 1.07E-04 2.14E-04
2” < � � 4” 1.83E-04 1.12E-04 1.70E-04 3.38E-04
4” < � � 10” 3.20E-05 1.94E-05 2.96E-05 5.89E-05
Base Metal
[1/ft.yr]
� > 10” 5.56E-06 3.30E-06 5.14E-06 1.02E-05
Component Boundary & Size Spray Frequency Uncertainty Distribution
Type Diameter [inch] Mean 5th Percentile Median 95th Percentile
� � 2” 4.40E-06 2.51E-06 4.04E-06 8.21E-06
2” < � � 4” 7.01E-06 3.90E-06 6.46E-06 1.29E-05
4” < � � 10” 1.22E-06 6.65E-07 1.13E-06 2.23E-06
Base Metal
[1/ft.yr]
� > 10” 2.13E-07 1.13E-07 1.95E-07 3.94E-07

Attachment 4: Existing Pipe Failure Databases – Appendix D
68
Example 3
Reliability Parameters Applicable to Non-Code High Pressure Steam Line Piping
Uncertainty Distribution Analysis
Case Description Mean [1/ft.yr]
5th Percentile Median 95th
Percentile
EBS1: HP Steam Pipe Failure Rate given post 1988 data 3.25E-06 1.62E-06 2.94E-06 6.01E-06
KNPP19 EBS1: HP Steam Pipe Rupture Frequency given post 1988 data 3.03E-08 1.16E-08 2.64E-08 6.28E-08
EBS2: HP Steam Pipe Failure Rate given post 1988 data 1.16E-06 3.33E-07 9.37E-07 2.75E-06
KNPP20 EBS2: HP Steam Pipe Rupture Frequency given post 1988 data 8.90E-09 2.01E-09 6.78E-09 2.26E-08
EBS1: HP Steam Pipe Failure Rate given 1970-1988 data 1.60E-05 9.34E-06 1.47E-05 2.94E-05
KNPP21 EBS1: HP Steam Pipe Rupture Frequency given 1970-1988 data 1.49E-07 6.40E-08 1.34E-07 2.90E-07
EBS2: HP Steam Pipe Failure Rate given 1970-1988 data 2.50E-05 1.47E-05 2.30E-05 4.60E-05
KNPP22 EBS2: HP Steam Pipe Rupture Frequency given 1970-1988 data 1.91E-07 7.72E-08 1.70E-07 3.78E-07
EBS1: HP Steam Pipe Failure Rate with FAC events screened out 1.74E-07 1.23E-08 8.44E-08 5.93E-07
KNPP23 EBS1: HP Steam Pipe Rupture Frequency with FAC events screened out
1.64E-09 9.98E-11 7.52E-10 5.71E-09
EBS2: HP Steam Pipe Failure Rate with FAC events screened out 2.36E-07 1.53E-08 1.12E-07 8.29E-07
KNPP24 EBS2: HP Steam Pipe Rupture Frequency with FAC events screened out
1.80E-09 9.99E-11 8.01E-10 6.49E-09
Notes:
� EBS = Equivalent Break Size
� EBS1: 50 < DN � 150 mm
� EBS 2: DN > 150 mm
� KNPP19 & KNPP20 assumes augmented FAC inspections and implementation of EPRI-CHECWORKS program for predicting and monitoring pipe wall wear rates
� KNPP21 & 22 assumes no FAC inspections
� KNPP23 & 24 assumes all FAC-susceptible piping replaced with FAC-resistant material (e.g., stainless steel.
� Appendix A, Attachment 3 of the October 2005 “Kewaunee Power Station Flooding Significance Determination Process Risk Assessment Report” is available from NRC-ADAMS (Accession Number ML053180483) at www.nrc.gov

Attachment 5: Database Users – Appendix A
69
Attachment 5: Database Users – Appendix A
Instructions for the questionnaire A set of questions is given below regarding the piping reliability handbook (R-book). For each question it is expected that as detailed answer as possible is given and that the answer is motivated as much as possible.
If a question is considered to be of no or minor importance in your field of expertise, then please give that as an answer instead of leaving a question blank.
It is important to have in mind when the questionnaire is answered that the handbook is focused on giving reliability data for piping components, e.g. failure rate and failure probability.
When responding, please use the designated space below or provide a separate Word file with your response.
A. Questions regarding handbook applicability � In what area in your field of expertise do you see that handbook can be useful, i.e.
what are you expectations in a piping component reliability handbook? � Role of handbook in validation of PFM results. It is often proposed that service data
should be used as one form of validation. In what form should service data be presented to support validation and what particular evaluation steps are involved a validation?
� What specific sets of parameters are required to support your application(s)? Please
refer to Appendix 2 for a list of proposed parameters that may be included. In Appendix 2 a separate column is given for you where you can make remarks for each parameter.
B. Questions regarding level of detail � Is it necessary that the handbook contains failure data for different leak rates and if
so what leak rates? � Does the handbook need to contain failure data for initial defects, i.e. cracks, that
does not give any leakage and if so is it possible to define a crack size for different materials?

Attachment 5: Database Users – Appendix A
70
� Does the handbook need to include uncertainty distributions? � How much information about active failure mechanisms does the handbook need to
include (no information, summary information for each system or detailed information for each component)?
� How site specific should the data in the handbook be in order to fulfill your needs? � What kind of piping components is most important to be included in the handbook
(welds in piping, valves, pumps, T-joints, bends, straight piping without welds, tanks (high/low pressure), etc.)?
C. Questions regarding layout and updating � What format should the handbook be published in (printed on paper, database on
CD, software that is used on the OPDE database, other)? � If the handbook is delivered in paper format or as a database, how often is it
necessary to update the handbook with new data for it to be useful in your field of expertise?
� In your opinion, what structure should the handbook have with respect to its
contents? Should it be divided according to systems or according to material data and operating conditions. Perhaps a completely different “classification system” shall be used in order to fulfill your requirements (e.g. Safety Class).
D. Questions regarding data background � How much information about the data background is necessary to be included in the
handbook (having in mind that no more information than what exist in the OPDE database can be included and that is not meaningful or possible to repeat all information already in the OPDE database)?

Attachment 5: Database Users – Appendix A
71
Data background can be information about material type and grade, operating conditions, residual stresses etc.
� In defining component and system boundaries, should the handbook include line
drawings, or other type of graphical representations?

Attachment 6: Database Users – Appendix B
72
Attachment 6: Database Users – Appendix B
Scope of Data Handbook The table below summarizes the types of input parameters to piping reliability analysis. The listed parameters have been used extensively in PSA applications and RI-ISI program development efforts. The proposed Handbook may address all of the listed parameters or any subset of listed parameters.

Atta
chm
ent 6
: Dat
abas
e U
sers
– A
ppen
dix
B
73
TAB
LE 6
B-1
EX
AM
PLES
OF
PIPI
NG
REL
IAB
ILIT
Y P
AR
AM
ETER
S TO
BE
INC
LUD
ED IN
PR
OPO
SED
DA
TA H
AN
DB
OO
K
SYM
BO
L D
ESC
RIP
TIO
N
DA
TA S
OU
RC
E &
STR
ATE
GY
FOR
EST
IMA
TIO
N
INTE
ND
ED A
PPLI
CA
TIO
N &
EX
TEN
T O
F D
EMO
NST
RA
TED
D
B A
PPLI
CA
TIO
N
REM
AR
K W
HEN
A
NSW
ERIN
G
QU
ESTI
ON
NA
IRE
� ik
Failu
re ra
te o
f pip
e co
mpo
nent
“i
” du
e to
deg
rada
tion
or
dam
age
mec
hani
sm “
k”
The
failu
re ra
te is
est
imat
ed
dire
ctly
usi
ng T
TF d
ata
or
indi
rect
ly v
ia a
n O
PDE
data
base
qu
ery
to o
btai
n a
failu
re c
ount
ov
er a
cer
tain
obs
erva
tion
peri
od
and
for a
cer
tain
pip
ing
com
pone
nt
popu
latio
n
PSA
(LO
CA
freq
uenc
y, in
tern
al
flood
ing,
HEL
B fr
eque
ncy)
and
risk
-in
form
ed a
pplic
atio
ns (R
I-ISI
). Ex
tens
ive
insi
ghts
ava
ilabl
e fr
om p
ast
DB
appl
icat
ions
TTF
Tim
e to
Fai
lure
O
btai
ned
dire
ctly
via
OPD
E da
taba
se q
uery
C
an b
e us
ed in
pre
dict
ive
relia
bilit
y an
alys
is to
det
erm
ine
pipe
repl
acem
ent
inte
rval
s. H
azar
d pl
ottin
g te
chni
ques
(o
r Wei
bull
anal
ysis
) use
TTF
dat
a di
rect
ly to
est
imat
e re
liabi
lity
para
met
ers.
This
ana
lysi
s app
roac
h ha
s bee
n us
ed e
xten
sive
ly to
ana
lyze
IG
SCC
dat
a an
d ra
w w
ater
pip
e fa
ilure
dat
a
P ik{
Rx|F
} C
ondi
tiona
l pip
e fa
ilure
pr
obab
ility
. Ind
ex “
x” re
fers
to
mod
e (o
r mag
nitu
de) o
f fai
lure
as
def
ined
by
thro
ugh-
wal
l pea
k flo
w ra
te th
resh
old
valu
e
Obt
aine
d di
rect
ly v
ia O
PDE
data
base
que
ry, B
ayes
ian
estim
atio
n st
rate
gy, P
FM (S
RM),
or e
xper
t elic
itatio
n
PSA
(LO
CA
freq
uenc
y, in
tern
al
flood
ing,
HEL
B fr
eque
ncy)
and
risk
-in
form
ed a
pplic
atio
ns (R
I-ISI
). Ex
tens
ive
insi
ghts
ava
ilabl
e fr
om p
ast
DB
appl
icat
ions

Atta
chm
ent 6
: Dat
abas
e U
sers
– A
ppen
dix
B
74
TAB
LE 6
B-1
EX
AM
PLES
OF
PIPI
NG
REL
IAB
ILIT
Y P
AR
AM
ETER
S TO
BE
INC
LUD
ED IN
PR
OPO
SED
DA
TA H
AN
DB
OO
K
SYM
BO
L D
ESC
RIP
TIO
N
DA
TA S
OU
RC
E &
STR
ATE
GY
FOR
EST
IMA
TIO
N
INTE
ND
ED A
PPLI
CA
TIO
N &
EX
TEN
T O
F D
EMO
NST
RA
TED
D
B A
PPLI
CA
TIO
N
REM
AR
K W
HEN
A
NSW
ERIN
G
QU
ESTI
ON
NA
IRE
I ik
Stru
ctur
al in
tegr
ity m
anag
emen
t fa
ctor
for c
ompo
nent
“i”
and
da
mag
e or
deg
rada
tion
mec
hani
sm “
k”. T
his i
s an
adju
stm
ent f
acto
r to
acco
unt f
or
vari
able
inte
grity
man
agem
ent
stra
tegi
es su
ch a
s lea
k de
tect
ion,
vo
lum
etri
c N
DE,
etc
, tha
t mig
ht
be d
iffer
ent t
han
the
com
pone
nts
incl
uded
in a
pip
e fa
ilure
da
taba
se
Obt
aine
d th
roug
h ap
plic
atio
n of
th
e M
arko
v m
odel
of p
ipin
g re
liabi
lity
(iter
ativ
e an
alys
is)
Exte
nsiv
e in
sigh
ts fr
om p
ast
appl
icat
ion
of th
e M
arko
v m
odel
n ik
Num
ber o
f fai
lure
s (al
l mod
es,
incl
udin
g cr
acks
, lea
ks a
nd
sign
ifica
nt st
ruct
ural
failu
res)
Obt
aine
d di
rect
ly v
ia O
PDE
data
base
que
ry
PSA
(LO
CA
freq
uenc
y, in
tern
al
flood
ing,
HEL
B fr
eque
ncy)
and
risk
-in
form
ed a
pplic
atio
ns (R
I-ISI
). Ex
tens
ive
insi
ghts
ava
ilabl
e fr
om p
ast
DB
appl
icat
ions
f ik
The
frac
tion
of n
umbe
r of
com
pone
nts o
r typ
e “i
” th
at a
re
susc
eptib
le to
failu
re fr
om
degr
adat
ion
or d
amag
e m
echa
nism
“k”
for c
ondi
tiona
l fa
ilure
rate
s giv
en su
scep
tibili
ty
to “
k”; t
his p
aram
eter
is se
t to
1 fo
r unc
ondi
tiona
l fai
lure
rate
s
Obt
aine
d di
rect
ly v
ia O
PDE
data
base
que
ry, o
r fro
m
‘Deg
rada
tion
Mec
hani
sm
Anal
ysis
” ta
sks o
f RI-
ISI p
rogr
am
deve
lopm
ent p
roje
cts,
or v
ia
engi
neer
ing
judg
men
t
RI-I
SI p
rogr
am d
evel
opm
ent (
e.g.
, -
risk
eva
luat
ions
)

Atta
chm
ent 6
: Dat
abas
e U
sers
– A
ppen
dix
B
75
TAB
LE 6
B-1
EX
AM
PLES
OF
PIPI
NG
REL
IAB
ILIT
Y P
AR
AM
ETER
S TO
BE
INC
LUD
ED IN
PR
OPO
SED
DA
TA H
AN
DB
OO
K
SYM
BO
L D
ESC
RIP
TIO
N
DA
TA S
OU
RC
E &
STR
ATE
GY
FOR
EST
IMA
TIO
N
INTE
ND
ED A
PPLI
CA
TIO
N &
EX
TEN
T O
F D
EMO
NST
RA
TED
D
B A
PPLI
CA
TIO
N
REM
AR
K W
HEN
A
NSW
ERIN
G
QU
ESTI
ON
NA
IRE
Ni
The
num
ber o
f com
pone
nts p
er
reac
tor y
ear (
or c
alen
dar y
ear)
th
at p
rovi
ded
the
obse
rved
pip
e fa
ilure
s for
com
pone
nt “
i”
Inpu
t fro
m p
ipin
g sy
stem
des
ign
revi
ews (
size
, wel
d co
unts
, pip
e le
ngth
s, an
d m
ater
ial d
ata)
spec
ific
to a
n ap
plic
atio
n. R
equi
red
for
estim
atio
n of
�ik
Appl
icat
ion-
spec
ific
pipi
ng p
opul
atio
n da
taba
ses a
lrea
dy e
xist
but
mos
t of
thes
e ar
e no
t in
the
publ
ic d
omai
n,
how
ever
.
T i
Tota
l exp
osur
e tim
e ov
er w
hich
fa
ilure
s wer
e co
llect
ed fo
r pip
e co
mpo
nent
“i”
; nor
mal
ly
expr
esse
d in
term
s of r
eact
or
year
s (or
cal
enda
r yea
rs)
Obt
aine
d di
rect
ly v
ia O
PDE
data
base
que
ry. R
equi
red
for
estim
atio
n of
�ik
� O
ccur
renc
e ra
te o
f a fl
aw (n
on
thro
ugh-
wal
l) O
btai
ned
dire
ctly
via
OPD
E da
taba
se q
uery
, or c
an b
e es
timat
ed a
s a m
ultip
le o
f the
rate
of
leak
s bas
ed o
n IS
I exp
erie
nce
Inpu
t to
Mar
kov
mod
el o
f pip
ing
relia
bilit
y
� S
Occ
urre
nce
rate
of l
eak
from
a
no-fl
aw st
ate
Serv
ice
data
for l
eaks
and
re
ason
ing
that
leak
s with
out a
pre
-ex
istin
g fla
w a
re o
nly
poss
ible
for
sele
cted
dam
age
mec
hani
sm fr
om
seve
re lo
adin
g
Inpu
t to
Mar
kov
mod
el o
f pip
ing
relia
bilit
y
� C
Occ
urre
nce
rate
of a
leak
from
a
flaw
stat
e Se
rvic
e da
ta fo
r lea
ks c
ondi
tione
d fo
r exi
stin
g co
nditi
ons f
or se
lect
ed
degr
adat
ion
mec
hani
sms
Inpu
t to
Mar
kov
mod
el o
f pip
ing
relia
bilit
y

Atta
chm
ent 6
: Dat
abas
e U
sers
– A
ppen
dix
B
76
TAB
LE 6
B-1
EX
AM
PLES
OF
PIPI
NG
REL
IAB
ILIT
Y P
AR
AM
ETER
S TO
BE
INC
LUD
ED IN
PR
OPO
SED
DA
TA H
AN
DB
OO
K
SYM
BO
L D
ESC
RIP
TIO
N
DA
TA S
OU
RC
E &
STR
ATE
GY
FOR
EST
IMA
TIO
N
INTE
ND
ED A
PPLI
CA
TIO
N &
EX
TEN
T O
F D
EMO
NST
RA
TED
D
B A
PPLI
CA
TIO
N
REM
AR
K W
HEN
A
NSW
ERIN
G
QU
ESTI
ON
NA
IRE
� S
Occ
urre
nce
rate
of a
“st
ruct
ural
fa
ilure
” fr
om a
no-
flaw
stat
e Se
rvic
e da
ta fo
r “st
ruct
ural
fa
ilure
” an
d re
ason
ing
that
“s
truc
tura
l fla
ws”
with
out a
pre
-ex
istin
g de
grad
atio
n is
onl
y po
ssib
le fo
r sel
ecte
d da
mag
e m
echa
nism
s and
syst
em-m
ater
ial
com
bina
tions
Inpu
t to
Mar
kov
mod
el o
f pip
ing
relia
bilit
y
� C
Occ
urre
nce
rate
of a
thro
ugh-
wal
l lea
k fr
om a
flaw
(non
th
roug
h-w
all)
stat
e
Serv
ice
data
for l
eaks
con
ditio
ned
for e
xist
ing
cond
ition
s for
sele
cted
de
grad
atio
n an
d da
mag
e m
echa
nism
s
Inpu
t to
Mar
kov
mod
el o
f pip
ing
relia
bilit
y
� F
Occ
urre
nce
rate
of “
stru
ctur
al
failu
re”
from
a th
roug
h-wa
ll fla
w st
ate
Estim
ates
of p
hysi
cal d
egra
datio
n ra
tes a
nd ti
mes
to fa
ilure
co
nver
ted
to e
quiv
alen
t fai
lure
ra
tes,
or e
stim
ates
of w
ater
ha
mm
er c
halle
nges
to th
e sy
stem
in
deg
rade
d sta
te.
Inpu
t to
Mar
kov
mod
el o
f pip
ing
relia
bilit
y
� Re
pair
rate
via
leak
det
ectio
n
��
�PT
TLD
LIR
()
Mod
el o
f equ
atio
n fo
r �, a
nd
estim
ates
of P
LD, T
LI , T
R In
put t
o M
arko
v m
odel
of p
ipin
g re
liabi
lity

Atta
chm
ent 6
: Dat
abas
e U
sers
– A
ppen
dix
B
77
TAB
LE 6
B-1
EX
AM
PLES
OF
PIPI
NG
REL
IAB
ILIT
Y P
AR
AM
ETER
S TO
BE
INC
LUD
ED IN
PR
OPO
SED
DA
TA H
AN
DB
OO
K
SYM
BO
L D
ESC
RIP
TIO
N
DA
TA S
OU
RC
E &
STR
ATE
GY
FOR
EST
IMA
TIO
N
INTE
ND
ED A
PPLI
CA
TIO
N &
EX
TEN
T O
F D
EMO
NST
RA
TED
D
B A
PPLI
CA
TIO
N
REM
AR
K W
HEN
A
NSW
ERIN
G
QU
ESTI
ON
NA
IRE
P LD
Pr
obab
ility
that
a th
roug
h-w
all
flaw
is d
etec
ted
give
n le
ak
dete
ctio
n or
leak
insp
ectio
n
Estim
ate
base
d on
pre
senc
e of
leak
de
tect
ion
syst
em, t
echn
ical
sp
ecifi
catio
n re
quir
emen
ts a
nd
freq
uenc
y of
leak
insp
ectio
n. D
B ge
nera
tes q
ualit
ativ
e in
sigh
ts.
Relia
bilit
y of
leak
det
ectio
n sy
stem
s is h
igh.
Qua
ntita
tive
estim
ate
base
d on
exp
ert j
udgm
ent
Inpu
t to
Mar
kov
mod
el o
f pip
ing
relia
bilit
y; su
ppor
ts se
nsiti
vity
an
alys
es to
add
ress
impa
ct o
f diff
eren
t as
sum
ptio
ns o
n pi
ping
relia
bilit
y
T LI
Mea
n tim
e be
twee
n in
spec
tions
fo
r thr
ough
-wal
l fla
w
Estim
ate
base
d on
met
hod
of le
ak
dete
ctio
n; ra
nges
from
imm
edia
te
to fr
eque
ncy
of ro
utin
e in
spec
tions
fo
r lea
ks o
r ASM
E Se
ctio
n XI
re
quir
ed sy
stem
leak
test
s
Inpu
t to
Mar
kov
mod
el o
f pip
ing
relia
bilit
y
�
Repa
ir ra
te v
ia N
DE
��
�P
PT
TI
FD
FIR
()
Mod
el o
f equ
atio
n fo
r �, a
nd
estim
ates
of P
I, P F
D, T
FI, T
R In
put t
o M
arko
v m
odel
of p
ipin
g re
liabi
lity
P I
Prob
abili
ty th
at a
flaw
will
be
insp
ecte
d (in
dex
“I”)
per
in
spec
tion
inte
rval
Estim
ate
base
d on
spec
ific
insp
ectio
n st
rate
gy; u
sual
ly d
one
sepa
rate
for A
SME
Sect
ion
XI (o
r eq
uiva
lent
) and
RI-
ISI p
rogr
ams
Inpu
t to
Mar
kov
mod
el o
f pip
ing
relia
bilit
y
P FD
Pr
obab
ility
that
a fl
aw w
ill b
e de
tect
ed g
iven
that
the
wel
d or
pi
pe se
ctio
n is
subj
ecte
d to
ND
E.
Also
refe
rred
to a
s PO
D.
Estim
ate
base
d on
ND
E re
liabi
lity
perf
orm
ance
dat
a an
d di
fficu
lty o
f in
spec
tion
for p
artic
ular
insp
ectio
n si
te. O
PDE
prov
ides
qua
litat
ive
insi
ghts
abo
ut N
DE
relia
bilit
y
Inpu
t to
Mar
kov
mod
el o
f pip
ing
relia
bilit
y

Atta
chm
ent 6
: Dat
abas
e U
sers
– A
ppen
dix
B
78
TAB
LE 6
B-1
EX
AM
PLES
OF
PIPI
NG
REL
IAB
ILIT
Y P
AR
AM
ETER
S TO
BE
INC
LUD
ED IN
PR
OPO
SED
DA
TA H
AN
DB
OO
K
SYM
BO
L D
ESC
RIP
TIO
N
DA
TA S
OU
RC
E &
STR
ATE
GY
FOR
EST
IMA
TIO
N
INTE
ND
ED A
PPLI
CA
TIO
N &
EX
TEN
T O
F D
EMO
NST
RA
TED
D
B A
PPLI
CA
TIO
N
REM
AR
K W
HEN
A
NSW
ERIN
G
QU
ESTI
ON
NA
IRE
T FI
Mea
n tim
e be
twee
n in
spec
tions
Ba
sed
on a
pplic
able
insp
ectio
n pr
ogra
m; c
an b
e “n
ever
” or
10
year
s for
ASM
E XI
pip
ing
Inpu
t to
Mar
kov
mod
el o
f pip
ing
relia
bilit
y
T R
Mea
n tim
e to
repa
ir o
nce
dete
cted
O
btai
ned
dire
ctly
via
OPD
E qu
ery.
Th
e m
ean
repa
ir ti
me
incl
udes
tim
e ta
g ou
t, is
olat
e, p
repa
re, r
epai
r, le
ak te
st a
nd ta
g-in
Inpu
t to
Mar
kov
mod
el o
f pip
ing
relia
bilit
y

Attachment 7: Piping Population Database – Appendix A
79
Attachment 7: Piping Population Database – Appendix A
Instruktioner för frågeformuläret
En uppsättning frågor ges i formuläret vars syfte är att utreda på vilket sätt som information om rörkomponenter är lagrade hos respektive kraftbolag. För varje fråga förväntas att svar ges så detaljerat som möjligt.
När svar ges så vänligen använd det utrymme som ges i samband med respektive fråga eller bifoga svar i separat dokument. Observera att Ni inte är begränsade till att svara på endast två rader, skriv så utförligt som möjligt på så många rader som Ni anser Er behöva.
Flera av frågorna kan vara snarlika och om Ni anser att Ni redan besvarat en fråga så vänligen hänvisa till det svar där informationen ges.
Sist i frågelistan ges några frågor som mer rör vilka drifterfarenheter som Ni har och hur informationen sparas – i databaser eller på annat sätt.
A. Generella frågor Nedan ges frågor av generell natur angående lagring av data om rörkomponenter. � Vänligen ge en övergripande beskrivning av hur data om rörkomponenter är
hanterade/lagrade hos Ert kraftbolag (databas eller annat medium, t.ex. om man måste gå in i isometriritningar) och i vilken utsträckning som det är möjligt att få ut information om olika rörkomponenter, d.v.s. är det möjligt att extrahera data om olika svetsar, rörböjar, T-stycken etc. Antag t.ex. att man är intresserad av att få ut data om samtliga rörkomponenter som sitter i en viss del av ett system, är det i så fall möjligt att definiera en del av ett system och då få ut information om antal och typ av rörkomponenter?
� Är det skillnad på hur detaljerad informationen är baserat på vilken kvalitetsklass
(säkerhetsklass) som komponenten i sig tillhör? � Är det skillnad på hur detaljerad informationen är baserat på om komponenten sitter
innanför eller utanför inneslutningen? � Går det att få ut information om rörkomponenter och dess systemtillhörighet?

Attachment 7: Piping Population Database – Appendix A
80
� Vilka är de största begränsningarna som Ni har i era databaser (enligt Er uppfattning) som gör att Ni tror att det blir svårt att sammanställa information om rörkomponenter (svetsar, rörböjar, T-stycken etc.) vid en eventuell kartläggning av olika system?
B. Attribut Med ett attribut avses termer som beskriver en rörkomponents design/konstruktionsdata, t.ex. i form av kemisk sammansättning. Ett attribut kan inte ändras utan att rörkomponenten i fråga byts ut, t.ex. genom att byta ut kolstål mot rostfritt stål. � I vilken utsträckning är det möjligt att få ut information om rörkomponenters design
i form av kemisk sammansättning, dimension, godstjocklek, längd etc. Kan detta tas automatiskt ur någon databas eller måste det tas manuellt från ritningar.
� Vilka begränsningar finns det avseende tillgänglig information, d.v.s. är det någon i
Er mening viktig parameter som är av betydelse för tillförlitligheten hos en komponent som inte är möjlig att få ut? Hur får man i så fall gå tillväga?
� Hur detaljerad kunskap finns dokumenterad när det gäller genomförda svetsingrepp
och reparationer (när har ingrepp gjorts, av vilken orsak samt effekt av ingreppet)? � Finns information lagrad om olika komponenters livslängder (när är eventuella
rörbyten eller andra modifieringar genomförda)?
C. Exponeringsterm Med exponeringsterm avses den “miljö” som en rörkomponent utsätts för, t.ex. i form av tryck, temperatur, flöde, innehållande medium (t.ex. vatten eller ånga), om vätgasdosering (HWC) nyttjas eller inte, etc. � Vilken information avseende driftbetingelser enligt ovan går det att få ut om olika
rörkomponenter? � Vilka begränsningar finns det avseende tillgänglig information, d.v.s. är det någon i
Er mening viktig parameter som är av betydelse för tillförlitligheten hos en komponent som inte är möjlig att få ut? Hur får man i så fall gå tillväga?

Attachment 7: Piping Population Database – Appendix A
81
� Finns information lagrad avseende drifttid på olika system, såväl driftsatta system
som system i standby avses?
D. Tillgänglighet på information � I vilken utsträckning kan den information som eftersöks göras tillgänglig till tredje
part för att eventuellt gå vidare med att ta fram tillförlitlighetsdata om rörkomponenter?
E. Drifterfarenheter � Vad är Er erfarenhet avseende inverkan av och kunskaper om vibrationer och
samverkan mellan olika degraderingsmekanismer? � Finns information lagrad om tidigare genomförd provning och eventuell kunskap
om provningseffektivitet. På vilket sätt lagras denna information i så fall?

Attachment 8: R-Book project – Scope of Phase 2 – Appendix A
82
Attachment 8: R-Book project – Scope of Phase 2 – Appendix A
Example of Piping Population Data

Atta
chm
ent 8
: R-B
ook
proj
ect –
Sco
pe o
f Pha
se 2
– A
ppen
dix
A
83
ID
Com
pone
nt
ID
Line
N
umbe
r W
eld
Num
ber
Plan
t Sy
stem
C
ompo
nent
N
PS
Iso
Num
ber
P&ID
N
umbe
r B
uild
ing
Loca
tion
Cod
e C
lass
C
ateg
ory
Mat
_spe
c1
Mat
_spe
c2
Des
crip
tion
Pipe
Sc
hedu
le
Wal
l Th
ickn
ess
1 1C
S-0
1-01
1C
S02
AA
-8"
01
A
CS
- C
onta
inm
ent S
pray
(P
WR
) W
ELD
8
1CS
-01
M-0
46 S
01A
A
UX
B
LD
CS
PU
MP
R
OO
M 1
A
2 C
-F-1
S
A18
2
GR
.F30
4 S
A40
3
GR
.WP
304
PU
MP
1C
S01
PA
- E
LBO
W
40S
0.
322"
2 1C
S-0
1-02
1C
S02
AA
-8"
02
A
CS
- C
onta
inm
ent S
pray
(P
WR
) W
ELD
8
1CS
-01
M-0
46 S
01A
A
UX
B
LD
CS
PU
MP
R
OO
M 1
A
2 C
-F-1
S
A40
3
GR
.WP
304
SA
403
G
R.W
P30
4 E
LBO
W -
10"X
8"
RE
DU
CE
R
40S
0.
322"
3 1C
S-0
1-03
1C
S02
AA
-10
" 03
A
C
S -
Con
tain
men
t Spr
ay
(PW
R)
WE
LD
10
1CS
-01
M-0
46 S
01A
A
UX
B
LD
CS
PU
MP
R
OO
M 1
A
2 C
-F-1
S
A40
3
GR
.WP
304
SA
403
G
R.W
P30
4 10
"X8"
RE
DU
CE
R
- ELB
OW
40
S
0.36
5"
4 1C
S-0
1-04
1C
S02
AA
-10
" 04
A
C
S -
Con
tain
men
t Spr
ay
(PW
R)
WE
LD
10
1CS
-01
M-0
46 S
01A
A
UX
B
LD
CS
PU
MP
R
OO
M 1
A
2 C
-F-1
S
A40
3
GR
.WP
304
SA
403
G
R.W
P30
4 E
LBO
W L
ON
G
SE
AM
40
S
0.36
5"
5 1C
S-0
1-05
1C
S02
AA
-10
" 05
A
C
S -
Con
tain
men
t Spr
ay
(PW
R)
WE
LD
10
1CS
-01
M-0
46 S
01A
A
UX
B
LD
CS
PU
MP
R
OO
M 1
A
2 C
-F-1
S
A40
3
GR
.WP
304
SA
403
G
R.W
P30
4 E
LBO
W L
ON
G
SE
AM
40
S
0.36
5"
6 1C
S-0
1-06
1C
S02
AA
-10
" 06
A
C
S -
Con
tain
men
t Spr
ay
(PW
R)
WE
LD
10
1CS
-01
M-0
46 S
01A
A
UX
B
LD
CS
PU
MP
R
OO
M 1
A
2 C
-F-1
S
A40
3
GR
.WP
304
SA
312
G
R.T
P30
4 E
LBO
W -
PIP
E
40S
0.
365"
7 1C
S-0
1-06
A
1CS
02A
A-
10"
06A
A
C
S -
Con
tain
men
t Spr
ay
(PW
R)
WE
LD
10
1CS
-01
M-0
46 S
01A
A
UX
B
LD
CS
PU
MP
R
OO
M 1
A
2 C
-F-1
S
A31
2
GR
.TP
304
SA
312
G
R.T
P30
4 P
IPE
LO
NG
S
EA
M
40S
0.
365"
8 1C
S-0
1-06
B
1CS
02A
A-
10"
06B
A
C
S -
Con
tain
men
t Spr
ay
(PW
R)
WE
LD
10
1CS
-01
M-0
46 S
01A
A
UX
B
LD
CS
PU
MP
R
OO
M 1
A
2 C
-F-1
S
A31
2
GR
.TP
304
SA
312
G
R.T
P30
4 P
IPE
LO
NG
S
EA
M
40S
0.
365"
9 1C
S-0
1-07
1C
S02
AA
-10
" 07
A
C
S -
Con
tain
men
t Spr
ay
(PW
R)
WE
LD
10
1CS
-01
M-0
46 S
01A
A
UX
B
LD
CS
PU
MP
R
OO
M 1
A
2 C
-F-1
S
A31
2
GR
.TP
304
SA
182
G
R.F
304
PIP
E -
VA
LVE
1C
S00
3A
FLA
NG
E
40S
0.
365"
10
1CS
-01-
08
1CS
02A
A-
10"
08
A
CS
- C
onta
inm
ent S
pray
(P
WR
) W
ELD
10
1C
S-0
1 M
-046
S01
A
AU
X
BLD
C
S P
UM
P
RO
OM
1A
2
C-F
-1
SA
182
G
R.F
304
SA
351
GR
.CF8
VLV
1C
S00
3A
FLN
G -
VLV
1C
S00
4A
40S
0.
365"
11
1CS
-01-
09
1CS
02A
A-
10"
09
A
CS
- C
onta
inm
ent S
pray
(P
WR
) W
ELD
10
1C
S-0
1 M
-046
S01
A
AU
X
BLD
C
S P
UM
P
RO
OM
1A
2
C-F
-1
SA
351
GR
.CF8
S
A40
3
GR
.WP
304
VA
LVE
1C
S00
4A
- ELB
OW
40
S
0.36
5"
12
1CS
-01-
10
1CS
02A
A-
10"
10
A
CS
- C
onta
inm
ent S
pray
(P
WR
) W
ELD
10
1C
S-0
1 M
-046
S01
A
AU
X
BLD
C
S P
UM
P
RO
OM
1A
2
C-F
-1
SA
403
G
R.W
P30
4 S
A40
3
GR
.WP
304
ELB
OW
LO
NG
S
EA
M
40S
0.
365"
13
1CS
-01-
11
1CS
02A
A-
10"
11
A
CS
- C
onta
inm
ent S
pray
(P
WR
) W
ELD
10
1C
S-0
1 M
-046
S01
A
AU
X
BLD
C
S P
UM
P
RO
OM
1A
2
C-F
-1
SA
403
G
R.W
P30
4 S
A40
3
GR
.WP
304
ELB
OW
LO
NG
S
EA
M
40S
0.
365"
14
1CS
-01-
12
1CS
02A
A-
10"
12
A
CS
- C
onta
inm
ent S
pray
(P
WR
) W
ELD
10
1C
S-0
1 M
-046
S01
A
AU
X
BLD
C
S P
UM
P
RO
OM
1A
2
C-F
-1
SA
403
G
R.W
P30
4 S
A31
2
GR
.TP
304
ELB
OW
- P
IPE
40
S
0.36
5"
15
1CS
-01-
13
1CS
02A
A-
10"
13
A
CS
- C
onta
inm
ent S
pray
(P
WR
) W
ELD
10
1C
S-0
1 M
-046
S01
A
AU
X
BLD
C
S P
UM
P
RO
OM
1A
2
C-F
-1
SA
312
G
R.T
P30
4 S
A31
2
GR
.TP
304
PIP
E L
ON
G
SE
AM
40
S
0.36
5"
16
1CS
-01-
14
1CS
02A
A-
10"
14
A
CS
- C
onta
inm
ent S
pray
(P
WR
) W
ELD
10
1C
S-0
1 M
-046
S01
A
AU
X
BLD
C
S P
UM
P
RO
OM
1A
2
C-F
-1
SA
312
G
R.T
P30
4 S
A31
2
GR
.TP
304
PIP
E L
ON
G
SE
AM
40
S
0.36
5"
17
1CS
-01-
15
1CS
02A
A-
10"
15
A
CS
- C
onta
inm
ent S
pray
(P
WR
) W
ELD
10
1C
S-0
1 M
-046
S01
A
AU
X
BLD
C
S P
UM
P
RO
OM
1A
2
C-F
-1
SA
312
G
R.T
P30
4 S
A31
2
GR
.TP
304
PIP
E -
PIP
E
40S
0.
365"
18
1CS
-01-
16
1CS
02A
A-
10"
16
A
CS
- C
onta
inm
ent S
pray
(P
WR
) W
ELD
10
1C
S-0
1 M
-046
S01
A
AU
X
BLD
C
S P
UM
P
RO
OM
1A
2
C-F
-1
SA
312
G
R.T
P30
4 S
A31
2
GR
.TP
304
PIP
E L
ON
G
SE
AM
40
S
0.36
5"
19
1CS
-01-
17
1CS
02A
A-
10"
17
A
CS
- C
onta
inm
ent S
pray
(P
WR
) W
ELD
10
1C
S-0
1 M
-046
S01
A
AU
X
BLD
C
S P
UM
P
RO
OM
1A
2
C-F
-1
SA
312
G
R.T
P30
4 S
A31
2
GR
.TP
304
PIP
E L
ON
G
SE
AM
40
S
0.36
5"
20
1CS
-01-
18
1CS
02A
A-
10"
18
A
CS
- C
onta
inm
ent S
pray
(P
WR
) W
ELD
10
1C
S-0
1 M
-046
S01
A
AU
X
BLD
C
S P
UM
P
RO
OM
1A
2
C-F
-1
SA
312
G
R.T
P30
4 S
A40
3
GR
.WP
304
PIP
E -
ELB
OW
40
S
0.36
5"
21
1CS
-01-
19
1CS
02A
A-
10"
19
A
CS
- C
onta
inm
ent S
pray
(P
WR
) W
ELD
10
1C
S-0
1 M
-046
S01
A
AU
X
BLD
C
S P
UM
P
RO
OM
1A
2
C-F
-1
SA
403
G
R.W
P30
4 S
A40
3
GR
.WP
304
ELB
OW
LO
NG
S
EA
M
40S
0.
365"
22
1CS
-01-
20
1CS
02A
A-
10"
20
A
CS
- C
onta
inm
ent S
pray
(P
WR
) W
ELD
10
1C
S-0
1 M
-046
S01
A
AU
X
BLD
C
S P
UM
P
RO
OM
1A
2
C-F
-1
SA
403
G
R.W
P30
4 S
A40
3
GR
.WP
304
ELB
OW
LO
NG
S
EA
M
40S
0.
365"
23
1CS
-01-
21
1CS
02A
A-
10"
21
A
CS
- C
onta
inm
ent S
pray
(P
WR
) W
ELD
10
1C
S-0
1 M
-046
S01
A
AU
X
BLD
C
S P
UM
P
RO
OM
1A
2
C-F
-1
SA
403
G
R.W
P30
4 S
A31
2
GR
.TP
304
ELB
OW
- P
IPE
40
S
0.36
5"
24
1CS
-01-
22
1CS
02A
A-
10"
22
A
CS
- C
onta
inm
ent S
pray
(P
WR
) W
ELD
10
1C
S-0
1 M
-046
S01
A
AU
X
BLD
C
S P
UM
P
RO
OM
1A
2
C-F
-1
SA
312
G
R.T
P30
4 S
A31
2
GR
.TP
304
PIP
E L
ON
G
SE
AM
40
S
0.36
5"
25
1CS
-01-
23
1CS
02A
A-
10"
23
A
CS
- C
onta
inm
ent S
pray
(P
WR
) W
ELD
10
1C
S-0
1 M
-046
S01
A
AU
X
BLD
C
S P
UM
P
RO
OM
1A
2
C-F
-1
SA
312
G
R.T
P30
4 S
A31
2
GR
.TP
304
PIP
E L
ON
G
SE
AM
40
S
0.36
5"
Tabl
e 8A
-1 E
xam
ple
of p
ipin
g po
pula
tion
data

Attachment 9: R-Book project – Scope of Phase 2 – Appendix B
84
Attachment 9: R-Book project – Scope of Phase 2 – Appendix B
R-Book form

Attachment 9: R-Book project – Scope of Phase 2 – Appendix B
85
Event Population
System Peak Through-
wall Leak/Flow Rate
[kg/s]
Event Count
0 < � � 6.3�10-2 130 6.3�10-2 < � �
3.2�10-1 11
3.2�10-1 < � � 6.3�10-1 0
6.3�10-1 < � � 3.2 0
313 – Reactor Recirculation System
� > 3.2 1 (a) 0 < � � 6.3�10-2 81 6.3�10-2 < � �
3.2�10-1 0
3.2�10-1 < � � 6.3�10-1 0
6.3�10-1 < � � 3.2 0
331 – Reactor Water Clean-up
� > 3.2 4 (b) Notes:
a. EID #5172; severed, temporary instrument line (DN15). The event occurred during the commissioning of the plant in question.
b. Three of these events involved small-diameter piping (� DN25), one event (EID #1855) occurred in DN150 piping
Table 9B-1 BWR-1 Observed Peak Through-wall Leak/Flow Rates
Abbreviations & Acronyms DM Dissimilar metal NPS Nominal Pipe Size [inch] NTWC Non-through-wall crack RPV Reactor Pressure vessel TWC Through-wall crack Damage / Degradation Mechanisms COR Corrosion D&C Design & Construction Error E-C Erosion-cavitation E/C Erosion-corrosion FAC Flow-accelerated corrosion SCC Stress corrosion cracking TF Thermal fatigue

Atta
chm
ent 9
: R-B
ook
proj
ect –
Sco
pe o
f Pha
se 2
– A
ppen
dix
B
86
Even
t Pop
ulat
ion
1970
-79
1980
-89
1990
-99
2000
-07
1970
-200
7 A
ttrib
ute
/ Deg
rada
tion
Mec
hani
sm
NTW
C
TWC
N
TWC
TW
C
NTW
C
TWC
N
TWC
TW
C
NTW
C
TWC
A
ll C
OR
--
--
--
--
--
--
--
--
--
--
--
D
&C
0
0 0
5 0
7 0
2 0
14
14
E-C
--
--
--
--
--
--
--
--
--
--
--
E
/C
N/A
N
/A
N/A
N
/A
N/A
N
/A
N/A
N
/A
N/A
N
/A
N/A
FA
C
N/A
N
/A
N/A
N
/A
N/A
N
/A
N/A
N
/A
N/A
N
/A
N/A
S
CC
0
0 38
2 44
67
1
21
2 47
0 47
51
7 TF
0
0 0
0 0
0 0
0 0
0 0
� >
250
VF
0 0
0 0
0 0
0 0
0 0
0 C
OR
--
--
--
--
--
--
--
--
--
--
--
D
&C
1
0 0
3 0
1 0
0 1
4 5
E-C
--
--
--
--
--
--
--
--
--
--
--
E
/C
N/A
N
/A
N/A
N
/A
N/A
N
/A
N/A
N
/A
N/A
N
/A
N/A
FA
C
N/A
N
/A
N/A
N
/A
N/A
N
/A
N/A
N
/A
N/A
N
/A
N/A
S
CC
16
11
35
6
59
2 0
0 11
0 19
12
9 TF
--
--
--
--
--
--
--
--
--
--
--
50 <
� �
250
VF
0 0
0 1
0 1
0 1
0 3
3 C
OR
--
--
--
--
--
--
--
--
--
--
--
D
&C
0
1 0
5 0
1 0
0 0
7 7
E-C
--
--
--
--
--
--
--
--
--
--
--
E
/C
N/A
N
/A
N/A
N
/A
N/A
N
/A
N/A
N
/A
N/A
N
/A
N/A
FA
C
N/A
N
/A
N/A
N
/A
N/A
N
/A
N/A
N
/A
N/A
N
/A
N/A
S
CC
0
3 2
3 1
3 1
1 4
10
14
TF
0 0
0 1
0 1
0 0
0 2
2
� �
50
VF
0 11
0
17
0 10
1
7 1
45
46
All
size
s A
ll M
echa
nism
s 17
26
42
4 80
13
4 20
23
13
59
8 13
9 73
7
Wor
ldw
ide
Dat
a
Rea
ctor
-yea
rs
379
629
854
696
2558
(thr
ough
9/3
0/07
) P
ipe
mat
eria
l (ty
pica
l) : A
uste
nitic
sta
inle
ss s
teel
or s
tabi
lized
aus
teni
tic s
tain
less
ste
el (G
erm
an B
WR
pla
nts)
, DM
RP
V-n
ozzl
e-to
-saf
e-en
d w
elds
. B
WR
wat
er c
hem
istry
: All
plan
ts o
pera
te w
ith a
car
eful
ly m
onito
red
and
cont
rolle
d pr
imar
y w
ater
che
mis
try p
rogr
am, t
he o
bjec
tive
of w
hich
is to
min
imiz
e pr
esen
ce o
f ch
emic
al im
purit
ies
and
to a
void
che
mic
al e
xcur
sion
s. T
he d
etai
ls o
f the
wat
er c
hem
istry
pro
gram
var
y fro
m p
lant
-to-p
lant
; som
e pl
ants
ope
rate
with
hyd
roge
n w
ater
ch
emis
try (H
WC
) and
oth
ers
oper
ate
with
HW
C a
nd n
oble
met
al c
hem
ical
app
licat
ion
(NM
CA
) to
furth
er th
e re
sist
ance
to IG
SC
C. S
ee B
WR
VIP
-79
(EP
RI T
R-
1035
15R
2, o
r lat
er e
ditio
ns) f
or fu
rther
det
ails
. In
tegr
ity m
anag
emen
t pro
gram
: The
Rea
ctor
Rec
ircul
atio
n pi
ping
sys
tem
is s
ubje
ct to
per
iodi
c N
DE
as
defin
ed in
the
in-s
ervi
ce in
spec
tion
prog
ram
(e.g
., A
SM
E S
ectio
n X
I or R
I-IS
I pro
gram
). V
ario
us in
tegr
ity m
anag
emen
t ini
tiativ
es o
r pro
gram
s w
ere
also
impl
emen
ted
in th
e m
id-1
980s
in re
spon
se to
IGS
CC
insp
ectio
n fin
ding
s. F
or
furth
er d
etai
ls, s
ee th
e fo
llow
ing
docu
men
ts: N
UR
EG
-031
3 R
ev. 2
, U.S
. NR
C G
ener
ic L
ette
r 88-
01, a
nd N
UR
EG
-171
9.
Tabl
e 9B
-2 B
WR-
2a P
ipe
Failu
re D
ata
for S
yste
m 3
13 (R
eact
or R
ecir
cula
tion
Syst
em)

Atta
chm
ent 9
: R-B
ook
proj
ect –
Sco
pe o
f Pha
se 2
– A
ppen
dix
B
87
Even
t Pop
ulat
ion
1970
-79
1980
-89
1990
-99
2000
-07
1970
-200
7 A
ttrib
ute
/ Deg
rada
tion
Mec
hani
sm
NTW
C
TWC
N
TWC
TW
C
NTW
C
TWC
N
TWC
TW
C
NTW
C
TWC
A
ll C
OR
--
--
--
--
--
--
--
--
--
--
--
D
&C
0
0 0
0 0
0 0
0 0
0 0
E-C
--
--
--
--
--
--
--
--
--
--
--
E
/C
N/A
N
/A
N/A
N
/A
N/A
N
/A
N/A
N
/A
N/A
N
/A
N/A
FA
C
N/A
N
/A
N/A
N
/A
N/A
N
/A
N/A
N
/A
N/A
N
/A
N/A
S
CC
0
0 0
0 11
0
0 0
11
0 11
TF
0
0 0
0 0
0 0
0 0
0 0
� >
250
VF
0 0
0 0
0 0
0 0
0 0
0 C
OR
--
--
--
--
--
--
--
--
--
--
--
D
&C
0
0 0
0 0
0 0
0 0
0 0
E-C
--
--
--
--
--
--
--
--
--
--
--
E
/C
N/A
N
/A
N/A
N
/A
N/A
N
/A
N/A
N
/A
N/A
N
/A
N/A
FA
C
N/A
N
/A
N/A
N
/A
N/A
N
/A
N/A
N
/A
N/A
N
/A
N/A
S
CC
0
0 0
1 8
0 0
0 8
1 9
TF
--
--
--
--
--
--
--
--
--
--
--
50 <
� �
250
VF
0 0
0 0
0 0
0 0
0 0
0 C
OR
--
--
--
--
--
--
--
--
--
--
--
D
&C
0
0 0
0 0
0 0
0 0
0 0
E-C
--
--
--
--
--
--
--
--
--
--
--
E
/C
N/A
N
/A
N/A
N
/A
N/A
N
/A
N/A
N
/A
N/A
N
/A
N/A
FA
C
N/A
N
/A
N/A
N
/A
N/A
N
/A
N/A
N
/A
N/A
N
/A
N/A
S
CC
0
0 0
0 0
2 0
0 0
2 2
TF
0 0
0 0
0 0
0 0
0 0
0
� �
50
VF
0 0
0 0
0 0
0 0
0 0
0
All
size
s A
ll M
echa
nism
s 0
0 0
1 19
2
0 0
19
3 22
Nor
dic
Dat
a
Rea
ctor
-yea
rs
29
50
50
29
158
(thro
ugh
9/30
/07)
N
otes
: � Th
is ta
ble
appl
ies
to B
1/B
2, O
1/O
2, R
1 (e
xter
nal R
eact
or R
ecirc
ulat
ion
plan
ts).
The
B1/
B2
reac
tors
hav
e be
en p
erm
anen
tly s
hutd
own
(30-
Nov
-99
and
05-M
ay-
05, r
espe
ctiv
ely)
. Exc
lude
d fro
m th
is ta
ble
are
F1/F
2/F3
and
Olk
-1/O
lk-2
(int
erna
l rec
ircul
atio
n re
acto
rs)
Tabl
e 9B
-2 B
WR-
2a P
ipe
Failu
re D
ata
for S
yste
m 3
13 (R
eact
or R
ecir
cula
tion
Syst
em)

Attachment 10: R-Book project – Scope of Phase 2 – Appendix C
88
Attachment 10: R-Book project – Scope of Phase 2 – Appendix C
Existing piping population data
Figure 10C-1 Piping Component Population Data

www.ski.se
STATENS KÄRNKRAFT INSPEKT ION
Swedish Nuclear Power Inspectorate
POST/POSTAL ADDRESS SE-106 58 StockholmBESÖK/OFFICE Klarabergsviadukten 90TELEFON/TELEPHONE +46 (0)8 698 84 00TELEFAX +46 (0)8 661 90 86E-POST/E-MAIL [email protected]/WEB SITE www.ski.se
Top Related