


Languages
Pages
Legal


Single fiber properties – a key
to the characteristic
defibration patterns from
wood to paper fibers
Annikki Vehniäinen
Dissertation for the degree of Doctor of Science in Technology to be presented
with due permission of the Department of Forest Products Technology, Helsinki
University of Technology for public examination and debate in Auditorium Puu 2
at Helsinki University of Technology (Espoo, Finland) on October 17, 2008, at
12 noon.
Keywords: mechanical pulping, fibre properties, fibre structure, fibre dimension,
cell wall, characterization
ISSN 1457-6252

KCL Communications 12
2
ABSTRACT
This study approaches the phenomena of thermomechanical defibration of wood by
examining single fiber properties. A hypothesis was formed based on literature:
The defibration patterns due to impacts during fiber separation and high-consistency
refining are related to the morphological properties of fibers.
This is because:
1. The effects caused by the action of defibration vary in morphologically different
fibers, and
2. The defibration action in the plate gap is influenced by the properties of the fiber
material in the plate gap and changes as the properties of the fiber material in the
plate gap change.
In other words: the character of the fiber material affects the defibration result through
two routes: firstly the defibration patterns of fibers are related to their properties, and
secondly the character of the fiber bed in the plate gap influences the defibration action.
The defibration patterns of fiber shortening, fiber wall thickness reduction and changing
of fiber wall internal structure are discussed.
The experimental part focuses on the defibration effects which are the measurable
deformations in the fibers as a result of defibration actions. Defibration patterns are a set
of defibration effects that develop the stiff wood fibers into papermaking fibers and fines
particles. These concepts can be applied to all mechanical pulping processes, but this
thesis focuses on their application to the TMP process and spruce as raw material.
Fiber shortening was the result of cutting of fibers during the fiber separation stage.
Fast-grown and thinner-walled fibers were more resistant than thick walled slow growth
fibers towards the harsh conditions prevailing during fiber separation. Faster warming up
of the fiber wall as a result of compression and relaxation of the material as well as
encountering fewer shear forces than thick-walled incompressible fiber material were
suggested as explanations for the different response of these fibers.
The gradual peeling off of layers from the fiber surface resulted in reduction of fiber wall
thickness. Different types of fibers produced different types of fines. The fibrillar fines
were formed mainly from thick-walled fibers, and 50-100% of the fibrillated fibers
originated from latewood. The flake-like fines originated both from outer layers of
latewood and earlywood fibers during fiber separation stage but also from pieces of the

KCL Communications 12
3
thinwalled earlywood fibers during the later stages of the whole defibration process. Only
half of the fines fraction was formed as a result of peeling off of fiber wall. The rest
consisted of ray cells, pieces of fibers and fiber wall formed as a result of fiber cutting or
splitting.
The differences in the fiber wall thickness did not explain the flexibility differences
between initially refined and highly refined samples. From this was concluded that the
fiber wall flexibility increased and fiber wall structure loosened during the defibration.
Local swelling of the fiber wall was revealed using optical sectioning by confocal laser
scanning microscopy. As a result of this inhomogeneity both fiber wall swelling and fiber
conformability varied along the fiber length. Removal of the outer fiber layers increased
fiber flexibility by decreasing fiber elastic properties and lowering the moment of inertia.

KCL Communications 12
4
TIIVISTELMÄ
Mekaanisen kuidutuksen ilmiöitä selvitetään tässä työssä tutkimalla yksittäisten kuitujen
ominaisuuksia. Kirjallisuuden perusteella päädyttiin hypoteesiin:
Kuitujen irrottamisen ja muokkaamisen aikana niihin kohdistuneiden iskujen aiheuttamat
kuituuntumistavat riippuvat kuitujen morfologisista ominaisuuksista.
Tähän vaikuttaa kaksi eri syytä:
1. Morfologisesti erilaisten kuitujen kuituuntumisvaikutukset poikkeavat toisistaan.
2. Terävälissä olevan kuitumateriaalin ominaisuudet vaikuttavat kuidutus-
tapahtumaan, joka muuttuu, kun kuitumateriaalin ominaisuudet muuttuvat.
Toisin sanoen: Kuitumateriaalin ominaisuudet vaikuttavat kuituuntumistulokseen kahta
eri reittiä: ensiksi kuitujen tapa kuituuntua riippuu niiden ominaisuuksista ja toiseksi
terävälissä olevan kuitupatjan ominaisuudet vaikuttavat kuidutustapahtumaan.
Tarkasteltavia kuituuntumistapoja ovat kuidun lyheneminen, kuituseinän oheneminen ja
kuidun mukautuvuuden kasvu.
Kokeellisessa osassa keskitytään kuidutustapahtuman (action) eri tyyppisissä kuiduissa
aiheuttamiin mitattaviin muodonmuutoksiin eli kuituuntumisvaikutuksiin (effects).
Kuituuntumistavat (patterns) muodostuvat sarjasta erilaisia kuituuntumisvaikutuksia.
Kuituuntumisen edetessä jäykät puukuidut muokkautuvat paperikuiduiksi ja
hienoaineeksi. Näitä käsitteitä voidaan soveltaa kaikkiin mekaanisen kuidutuksen
prosessihin, mutta tässä työssä keskitytään TMP-prosessiin ja kuusi-raaka-aineeseen.
Kuitujen lyheneminen aiheutui niiden katkeamisesta kuitujen irrotusvaiheessa. Nopeasti
kasvaneet ja ohutseinäiset kuidut kestivät paremmin irrotusvaiheen rajuja oloja kuin
paksuseinäiset kuidut. Tätä eroa selitettiin ohutseinäisten kuitujen
kokoonpuristuvuudesta aiheutuvalla nopeammalla lämpenemisellä jaksottaisten
puristumis- ja palautumisjaksojen seurauksena sekä sillä, että ne puristumalla kokoon
kohtasivat vähemmän leikkausvoimia kuin kokoonpuristumattomat kesäpuukuidut.
Kuituseinän oheneminen aiheutui kuidun kerrosten vähittäisestä kuoriutumisesta.
Erityyppisistä kuiduista syntyi erilaista hienoainesta. Fibrillimäistä hienoainesta
muodostui pääasiassa paksuseinäisistä kuiduista ja 50 -100 % fibrilloituneista kuiduista
oli kesäpuukuituja. Hiutalemainen hienoaine syntyi kuitujen irrotusvaiheessa auenneesta
ulkokerroksesta kesä- ja kevätpuista, mutta myös kuidutuksen myöhemmissä vaiheissa
ohutseinäisestä kevätpuusta. Vain puolet hienoaineesta syntyi kuitujen vähittäisen

KCL Communications 12
5
kuoriutumisen seurauksena. Loppu koostui ydinsädesoluista, kuidun ja kuituseinän
kappaleista kuitujen katkeilemisen ja rikkoutumisen seurauksena.
Kuituseinän paksuuserot eivät selittäneet kuidutuksen alkuvaiheessa terävälistä otetun ja
pitkälle jauhetun näytteen taipuisuuseroja. Tämän perusteella pääteltiin kuituseinän
taipuisuuden myös lisääntyvän ja kuidun rakenteen löyhentyvän kuidutuksessa.
Mikroskooppisia tekniikoita käyttäen osoitettiin kuituseinän turpoamisen olevan
epähomogeenista kuidun eri kohdissa. Tämän epähomogeenisuuden seurauksena sekä
kuidun turpoaminen että kuidun mukautuminen vaihtelivat kuidunpituuden eri kohdissa.
Kuidun ulkokerroksen poistaminen lisäsi kuidun taipuisuutta pienentämällä sen
elastisuutta ja alentamalla jäyhyysmomenttia.

KCL Communications 12
6
PREFACE
Forests, products made of timber and wood as a source of energy have a positive image.
In my mind the idea of turning pure fresh wood into soft and good smelling recyclable
papermaking fibers without any chemicals or complicated processes has also a positive
image. However, the high amount of energy required for that and the increasing energy
costs weaken both the image and the sustainability of that process.
A lot of research has been done with the aim to decrease the energy consumption of
mechanical defibration of wood. By compiling this thesis my aim has been to understand
better what has been done and relate my own research with that of others.
I wish to thank my current and former good colleagues and coauthors at KCL and
remember with gratitude the colleagues who have passed away: Jan Sundholm and Bo
Mannström from KCL and Alkis Karnis from Paprican, they all have contributed this
thesis. The person who first opened this area of research for me as a young professional
was Ahti Syrjänen the technical director of engineering works Jylhävaara now part of
Metso Paper. The motto he gave me as a plate segment developer was :“The sum of the
angles that I miss is more than 360 degrees”. To me it has meant the importance of
imagination in the research- keeping in mind the struggle for scientific discipline.
Dr Esko Härkönen and Professor Hannu Paulapuro have been inspiring instructors.
I also wish to thank KCL staff who have helped to compile this thesis into this final form
and management who have given me the needed time to finalize this work.
Financial support from “Tekniikan edistämissäätiö” is gratefully acknowledged.

KCL Communications 12
7
CONTENTS
ABSTRACT .........................................................................................................2 TIIVISTELMÄ .......................................................................................................4 PREFACE .........................................................................................................6 1. INTRODUCTION..............................................................................................10
1.1 Background to the study ...........................................................................10 1.2 Hypothesis and objective of the study .........................................................11 1.3 Outline of the thesis .................................................................................12 1.4 Terminology used ....................................................................................13
2. LITERATURE REVIEW ......................................................................................14 2.1 Wood raw material ...................................................................................14
2.1.1 Origin of fiber variability .................................................................14 2.1.2 Fiber wall structure ........................................................................15 2.1.3 Summary of wood fiber properties....................................................18
2.2 Mechanical pulping processes ....................................................................19 2.2.1 What happens in the plate gap of a TMP refiner..................................19 2.2.2 Energy consumption and the intensity concept ...................................20 2.2.3 Energy consumption for different softwood species .............................22
2.3 Changes in fiber dimensions during mechanical pulping .................................24 2.3.1 Fiber length ..................................................................................24 2.3.2 Fiber wall thickness ........................................................................26 2.3.3 Formation of fines..........................................................................27
2.4 Development of fiber wall structure in mechanical pulping .............................27 2.4.1 Fiber flexibility...............................................................................27 2.4.2 Fiber wall pore volume....................................................................29 2.4.3 Local damage to the fiber wall .........................................................31 2.4.4 Chemistry of the fiber wall ..............................................................32
2.5 Critical summary of the literature ...............................................................32 2.5.1 Relating the defibration patterns to the literature ...............................32 2.5.2 Fiber shortening ............................................................................33 2.5.3 Fiber wall thickness reduction ..........................................................34 2.5.4 Development of fiber wall structure ..................................................34 2.5.5 Concepts of defibration actions, effects and patterns...........................35
3. EXPERIMENTAL ..............................................................................................37 4. RESULTS .......................................................................................................39
4.1 How fiber length is determined during thermomechanical pulping ...................39 4.1.1 Effect of initial defibration on fiber length ..........................................39 4.1.2 Fiber length reduction for morphologically different fibers ....................43

KCL Communications 12
8
4.2. How fiber cross-sectional dimensions are affected ....................................... 46 4.2.1 Formation of fines.......................................................................... 46 4.2.2 Formation of fines from morphologically different fibers....................... 49
4.3 How fiber wall structure is affected............................................................. 53 4.3.1 Fiber flexibility/stiffness.................................................................. 53 4.3.2 Changes of the fiber wall in separately refined early- and
latewood fibers .............................................................................. 56 4.3.3 Pore volume of the fiber wall ........................................................... 58 4.3.4 Fiber wall swelling ......................................................................... 60
5. SUMMARIZING DISCUSSION............................................................................ 64 5.1 Relating defibration action with fiber properties............................................ 64 5.2 Important effects of defibration ................................................................. 64 5.3 Discussion of defibration patterns............................................................... 67
5.3.1 Fiber shortening as a defibration pattern........................................... 68 5.3.2 Fiber wall thickness reduction as a defibration pattern......................... 69 5.3.3 Development of fiber wall structure as a defibration pattern................. 70
6. CONCLUDING REMARKS.................................................................................. 72 List of papers ...................................................................................... 73 Authors contribution ........................................................................... 74
REFERENCES..................................................................................................... 75 APPENDICES ..................................................................................................... 81
App. 1. Preparation of pulp samples................................................................. 81 App.1.1a. Importance of initial defibration for fiber length reduction
experiments with 24 inch refiner .............................................................. 81 App.1.1b. Importance of initial defibration for fiber length reduction
experiments with industrial refiner ........................................................... 83 App.1.2. Effect of wood fiber properties on fiber length reduction during
mechanical pulping experiments with 42 inch refiner................................... 84 App.1.3. Fiber cross-sectional dimensions are affected through gradual
peeling off of material, a study with laboratory refiner................................. 88 App.1.4. Fiber cross-sectional dimensions are affected through gradual
peeling off of material, pilot study with RGP 42 .......................................... 89 App.1.5. Effect of wood fiber properties on fiber wall thickness..................... 91 App.1.6. Internal structure of fiber wall is affected by mechanical
pulping ....................................................................................... 92 App.1.7. Develoment of early- and latewood fibers in mechanical
pulping ....................................................................................... 92 App.1.8. Changes in fiber wall pore volume and swelling ............................. 93
App.2. Methods used ..................................................................................... 94

KCL Communications 12
9
2.1 Sampling and maceration of chips.......................................................94 2.2 Wall thickness using direct light microscopy technique ...........................94 2.3 Fiber stiffness ..................................................................................94 2.4 Fiber wall damages ...........................................................................95 2.5 Simons staining................................................................................95 2.6 Cross-sectional fibre dimensions using CLSM ........................................96 2.7 Measurement of fiber swelling ............................................................97 2.8 Thermoporosimetry...........................................................................97

KCL Communications 12
10
1. INTRODUCTION
1.1 Background to the study
The aim of mechanical defibration of wood is mainly to produce fiber material with ideal
properties for the manufacture of printing papers. Increasing the proportion of
mechanical pulps in printing papers reduces wood consumption and environmental load,
but it increases energy consumption. This is especially true for the thermomechanical
pulping processes. Although the processes and paper products made of mechanical pulp
have advanced considerably in the past few years, energy consumption has continued to
increase, and now stands at around 3-3.5 MWh/t for magazine paper pulp. A typical
feature of mechanical printing paper pulp is that its properties improve with increasing
energy consumption. The energy-saving potential achieved in recent years has been
exploited by replacing more chemical pulp with mechanical pulps, which have better
reinforcing properties and cause less surface problems than 10 years ago. However, as
energy prices continue to rise it is important that research remain focused on energy
saving and that this be approached from different directions.
Both empirical and analytical approaches have been used to gain an understanding of
the phenomena involved in wood defibration and to solve the problem of high energy
consumption.
The process optimization approach focuses on experiments with defibration process
variables, which are then related to the properties of the resulting pulp. Conducting
experiments with a single raw material and changing one process variable at a time
yields a lot of information about how the properties of pulp and its fractions develop as a
function of energy consumption. However, the effects and relationships found are not
universally applicable, as different raw materials react in different ways to changes in
defibration conditions /1,2,3,4,5/.
The material science approach examines the viscoelastic nature of wood and its reaction
to loading forces that vary in frequency and amplitude. The assumption is that changes
in the wood reflect the changes induced in the cell wall /6,7,8/. This approach gives
valuable information about the behavior of the wood raw material while the fibers are
still attached to the wood matrix; however, the effect of fiber separation on the
subsequent structural changes is omitted. The rheological properties of single fibers have
also been studied by measuring their load elongation, bending or torsion resistance /9/.
The drawbacks of this approach are the difficulty of achieving the conditions prevailing

KCL Communications 12
11
during mechanical defibration and the great heterogeneity of fiber material, which makes
it difficult to draw conclusions based on these measurements alone.
The analytical approach aims at building theoretical models based on physical quantities.
Modeling of the plate gap phenomena involves calculating steam and fiber velocities,
temperature and pressure distributions, and power dissipation distribution /10,11,12/.
The equations contain several variables the magnitudes of which need to be measured in
the plate gap. Much progress in plate gap measurements has been made in recent years
/13,14,15,16/. Valuable information could be added to make the models more realistic if
the characteristic patterns of fiber development were better known. The heterogeneity of
the fiber material complicates the matter. In low-consistency refining, fiber properties
have only a minor effect on the behavior of the pulp slurry, /17,18 /, but at high
consistency the properties of the wood or fiber bed depend directly on the morphological
properties of the fibers. The term morphology here refers to both the dimensions and
structure of fibers. The characteristic defibration patterns of different types of fibers are
also influenced by material properties, composition and chemical structure.
The approach taken in this thesis is to focus on fiber morphology and to use the results
of measurements of single fiber properties to deduce the characteristic defibration
patterns of fibers. Clarifying and illustrating the terms and concepts that describe the
defibration will also help to bring more closely together the three different approaches
described above. This study deals with thermomechanical pulping with spruce as raw
material. Wood assortments with varying growth rate and pulps fractionated to early-
and latewood rich fractions are used to form different classes of fiber morphology. The
main reason for this is that this classification can be utilized in the real life. Other
softwood species like pine are briefly summarized and compared to spruce.
1.2 Hypothesis and objective of the study
Hypothesis
The defibration patterns due to impacts during fiber separation and high-consistency
refining are related to the morphological properties of fibers.
This is because:
1. The effects caused by the action of defibration vary in morphologically different
fibers, and

KCL Communications 12
12
2. The defibration action in the plate gap is influenced by the properties of the fiber
material in the plate gap and changes as the properties of the fiber material in the
plate gap change.
In other words: the character of the fiber material affects the defibration result through
two routes: firstly the defibration patterns of fibers are related to their properties, and
secondly the character of the fiber bed in the plate gap influences the defibration action.
Objective:
The objective is to determine the fundamental defibration effects in thermomechanical
pulping and combine them into characteristic defibration patterns of morphologically
different Norway spruce, (Picea abies) fibers.
1.3 Outline of the thesis
This thesis comprises the results from papers published or presented at conferences
during 1993-2003. These results are reviewed and critically discussed in relation to other
published papers, keeping in mind the above hypothesis and objective.
Chapter 2 presents a review of the relevant wood raw material properties, plate gap
phenomena and the effects of defibration on fibers. The discussion illustrates some gaps
in the published data.
Chapters 3 and 4 seek to fill in the information gaps found in the previous chapter.
Research results obtained by the author and co-authors are used and discussed.
Chapter 3 consists of an overview of the raw materials and methods used.
Detailed experimental information is given in the appendices.
Chapter 4.1 describes how fibers are shortened during defibration.
Chapter 4.2 describes changes in fiber cross-sectional dimensions.
Chapter 4.3 shows evidence of internal restructuring of the fiber wall.
Chapter 5 summarizes discussions concerning verification of defibration effects
and suggested defibration patterns.
Chapter 6 provides concluding remarks relating to the exploitation and
importance of the results.

KCL Communications 12
13
1.4 Terminology used
Fiber = wood cell used in papermaking, in this case softwood tracheid
Morphology = dimensions, shape and structure of fibers
Defibration = (defiberization) = fiber separation + fiber development
Fiber separation = initial defibration step in which wood matrix is broken down into fibers
Fiber development = deforming of fibers, which can occur before, during and after fiber
separation; fiber development occurs largely in the TMP process during high-consistency
refining
Development of fiber wall structure= changing the internal structure of fiber wall, term
“internal fibrillation” is also used
Defibration action = set of impacts acting on the fibers during defibration
Defibration effect = measurable deformation of fiber dimensions or fiber structure as a
result of mechanical defibration action
Defibration pattern = set of defibration effects i.e. a “ characteristic route” by which
wood fibers are turned to papermaking fibers, these routes are characteristic of fibers
with a particular morphology and of the defibration conditions
SEC = specific energy consumption in MWh/t of 100% dry pulp
Harsh defibration = at the same energy level the fibers are more damaged and fiber
length is rapidly reduced
Gentle defibration = at the same energy level fibers are less damaged and fiber length is
retained.
KCL Communications 12
14
2. LITERATURE REVIEW
2.1 Wood raw material
Softwood tracheids, one type of wood cells are the main raw material for mechanical
pulping. In pulping and papermaking they are simply called fibers. In a tree the principal
tasks of the tracheids are to transport water from roots to needles and to support the
crown. The flow of water is driven by the reduced pressure resulting from evaporation of
water from the needles. The fiber walls are rigid to be able to resist this pressure without
collapsing /19/. Water is located in the lumen of sapwood fibers in the outer part of the
xylem, and in the fiber wall /20,21/.
Rays provide direct radial contacts for radial water conduction. The products of
photosynthesis in the form of starch and fats are stored in the parenchyma cells of rays
in readiness for the next growth season. “Ray cells” consist of ray tracheids and ray
parenchyma cells /22/. In the papermaking they form a poorly bonding material that is
likely to cause linting.
2.1.1 Origin of fiber variability
The variability of wood fibers arises from the growth and maturity of fibers. The growth
in tree thickness is based on the division of cambium cells. The number of cells formed is
determined by the need for water transport capacity, which again is related to needle
mass. This means that the number of cells in the growth ring are affected by growth
conditions. The dimensions and structure of the cells formed are greatly dependent on
growth rate /23, 24, 25/. In northerly areas like Finland and Sweden active growth stops
at the end of July, although the thickening and lignifying of cells continues /19/. The
development of a cell to maturity takes about 20 days /21/.
The juvenile wood fibers formed at the early stage of growth are formed during the first
10- 20 years /26/. In juvenile wood fibers the fibril angle is larger and the fiber wall
thinner than in mature wood fibers. Fiber length, diameter and wall thickness increase
with the age of a tree and, within a stem, from pith to bark. Examples given by Boutelje
/26/ are: Fiber length of spruce juvenile wood 1-1.4 mm, mature wood 2,6-2,9 mm.
Width of mature wood fiber is in average 34% wider than that of juvenile wood fiber.
Except the age the juvenile wood content depends on the growth rate. Wider growth
rings form a larger proportion of the diameter of a tree thus increasing the proportion of
juvenile wood /27/.

KCL Communications 12
15
When growth starts in the spring the earlywood fibers formed are thin walled and have a
large lumen for effective water transport from the roots to the needles. Latewood fibers,
which are formed later in the growth season, have thicker walls and a smaller fibril
angle, and are marginally longer than earlywood fibers /25, 28/. Fibril angle is high in
the fibers formed first in the spring and decreases towards the latewood. Bergander has
given fibril angle values from 30◦ in the first earlywood fibers to 5◦ near the transition to
latewood /28/. The transition from earlywood to latewood is gradual for spruce (Picea
abies)/19/. The difference in wall thickness between early, transition and latewood fibers
is due mainly to differences in the thickness of the S2 layer. As an example of these
differences are 1.7 µm for S2 of earlywood and 3,7 µm for latewood of spruce (Picea
abies). Respective relative contributions of S2 were 79% and 85% /29/. Latewood fibers
contain larger amounts of cellulose and less lignin due to their thicker S2 layer. The
amount of latewood increases when going north. Hakkila has given examples between
the latitudes of 62 and 66 the latewood content doubles for spruce /30/.
The loss of water from conducting cells starts the formation of heartwood. In southern
and central Finland it starts at the age of 30-40 years, in northern Finland later. Slowly
grown trees have higher amount of heartwood than faster grown trees. The living ray
parenchyma cells die in the heartwood formation, and the contents of the cells are
transported into the tracheids. Bordered pits are closed and the tori of the pits are
lignified. Typical for spruce is the high dry solids content of heartwood /19/.
Trees react to external stresses like wind or snow load by forming reaction wood. For
softwood the wood formed is called compression wood. These fibers have higher lignin
contents, thicker walls and a rounder circumference. A lignin-rich layer is formed on the
outside of the S2 layer. The fibril angle of compression wood fibers is higher than that in
normal wood fibers /31/.
In general a tree of a faster growth rate contains more earlywood and more lignin than a
slow growth tree. The growth rate influences the cross-sectional dimensions of fibers: on
average, faster growing trees develop thinner walled fibers than slowly growing trees
/23,24/. Microfibril angle decreases rapidly with the age of the tree, being greater for
earlywood than latewood and greater for fast-grown than slowly grown trees /24, 25/. A
fast grown tree of the same diameter contains less heartwood than a slowly grown tree.
2.1.2 Fiber wall structure
The cell wall consists of layers with different structures and chemical compositions.
Zimmerman has identified four stages of cell development /21/:

KCL Communications 12
16
1. Origin - the formation of new cells through division.
2. Enlargement - an increase in diameter and length. At this stage the cell wall
consists of primary wall only. Stretching of the primary wall affects the
microfibrillar network. Reorientation is greatest in the outer microfibrils of the
primary wall as those in the inner part maintain their orientation.
3. Cell wall thickening starts with the deposition of secondary wall.
4. Lignification. This occurs first in the corners and then in the middle lamella and
secondary wall.
Figure 2.1 shows the cell wall layers. The average thickness of the amorphous middle
lamella is 0.1 μm and that of the primary wall 0.1-0.2 μm; microfibrils show little or no
orientation. The S1 layer is 0.1-0.2 μm thick and microfibrils are oriented at almost 90°.
The S2 layer is 1-2 μm thick for earlywood and 3-8 μm thick for latewood. The
microfibrils of latewood are almost parallel to the fiber axis, but, greater fibril angles are
found in earlywood fibers. The S3 layer is 0.1-0.2 μm thick and the microfibril angle is
similar to that in the S1 layer /20/.
The fiber wall is hygroscopic and is thus able to swell and shrink as the amount of water
bound to the fiber wall changes. It is also anisotropic, which means that its ability to
swell is different in different directions. Swelling is least in the longitudinal direction. In
cross-sections, tangential swelling is greater than radial /21/.
Various models of fiber wall structure have been presented. Stone and Scallan /32/
investigated chemically pulped fibers and suggested that the microfibrils are arranged in
concentric lamellae.
Sell and Zimmerman studied fracture surfaces of wood using field emission SEM and
obtained micrographs showing radial orientation of fibril agglomerations /33/. Fahlén and
Salmén investigated fracture surfaces that were tension loaded axially /34/. Their ESEM
(environmental scanning electron microscope) studies also showed a radial arrangement,
but in the deeper, undamaged part of the cell wall AFM revealed a transition from radial
to concentric structure. The authors suggest that the radial structure is caused by the
fracture of wood and that the true lamella structure is concentric.

KCL Communications 12
17
Figure 2.1. Schematic representation of the cell wall layers /21/.
M= middle lamella, P= primary wall, S1= outer layer of secondary wall S2= secondary wall, S3= inner layer of secondary wall, W= warty layer

KCL Communications 12
18
2.1.3 Summary of wood fiber properties Table 2.1. Wood fiber properties (Picea abies), that may influence the results of
mechanical pulping and the origin of their variation in wood material. Wood fiber property Origin of wood raw material
variation Dimensional
Length Age /26, 30, 31/
Position in the stem /23/
Wall thickness Early/ latewood /29, 31/ Growth rate /23, 24/ Proportion of compression wood /31/
Width Age /23, 26/ Position in the stem /23, 26/
Structural
Fibril angle Juvenile wood content /28/ Age /24,28/ Growth rate /24, 25, 28/ Proportion of compression wood /31, 28/
Thickness of fiber wall layers
Growth rate /23/
Chemical composition
Lignin, carbohydrate and extractive contents and their distribution
Growth rate /24/ Proportion of compression wood /31/
Water content Heartwood content /21, 31/
Extractive content Growth rate /30/ Age /30/

KCL Communications 12
19
2.2 Mechanical pulping processes
Fibers can be separated from the wood matrix using only mechanical energy. Two main
processes are used commercially: grinding of wood by pressing wood blocks against a
revolving pulpstone, and refining of wood chips between two rotating disks. Small
amounts of chemicals may be used to enhance fiber separation. Ground pulps are called
groundwood (GW), sometimes stone groundwood (SGW) or pressurized groundwood
(PGW), while ground pulps produced under a pressure higher than 3 bar are referred to
as super-pressure groundwood (PGWS, SPGW) /35/.
The refining processes used today are pressurized and called thermomechanical pulping
(TMP). Before refining the chips are preheated with steam. If small amounts of chemicals
are added the process is called chemithermomechanical pulping (CTMP). If no preheating
is used the process may be called pressurized refiner mechanical pulping (PRMP). The
early atmospheric refiner mechanical pulping process is called RMP or sometimes even
the refiner groundwood pulping process, but it is today very rare. Refiner mechanical
pulping can also be used to mean mechanical pulping carried out with refiners in general
to distinguish it from the grinding process. The term defibration is used here as a
synonym for mechanical pulping in general and fiber separation is used as a synonym for
the removal of fibers from the wood matrix. The term fiber development is used as a
general term for deforming of fibers.
2.2.1 What happens in the plate gap of a TMP refiner
In the TMP refining process chips are preheated with atmospheric steam before being fed
into the refiner. As soon as they enter the refiner the chips are broken down into thinner
particles and fiber bundles. Centrifugal effect drives the particles formed toward the
narrowing plate gap. On the rotor side the fiber material moves forward, on the stator
side flowback steam mixes and transports some of the material backwards. After the
steam turning point both the centrifugal effect and the outflowing steam drive particles
and fibers forward. During their way through the plate gap the particles and fibers are hit
more randomly than in grinding, where the fibers get periodic cyclic compression
treatment when still attached to the wood matrix /35,36/. Once the fibers have been
separated in the first refining stage they must be developed to improve their properties
for papermaking. This is done in the outer parts of 1st stage refiner plate gap,
subsequent mainline refining stages and 1-2 reject refining stages.
The phenomena occurring in the plate gap have been investigated using theoretical
models and plate gap measurements. The theoretical models presented are dynamic
KCL Communications 12
20
simulation models, which estimate the flow profile /10-12/. Measurements of acting
forces, temperature distributions and pulp residence time in the plate gap have been
reported /13-16, 36, 38-41/. Residence time measurements using a radioactive tracer
have shown that radial fiber velocity increased towards the periphery and it was
influenced by the segment type /38,39/. Examples of pulp residence times for a single-
disk refiner were around 3 s in the inner part and 1 s in the outer part. The average
residence times in an industrial single disk refiner were between 2.1 and 7.5 s depending
on the refiner position and the segment type /38/. The so called turbine segments gave
residence times of around 1 s for a CD-type refiner in primary position /39/.
There have been several attempts to measure the forces and pressure acting between
refiner bars along the radius /14-16/. The effect of a bar on fiber flocs was studied both
using a model in which the shear force consists of both friction component and corner
component acting over the leading edge of the bar and experimentally using a laboratory
scale single bar refiner. The authors suggested that the parameter that represents
“equivalent tangential coefficient of friction” determines the relative magnitude of the
shear and compressive forces and has an effect on the energy quality relationship /40/.
A new approach to calculate power consumption distribution in the plate gap based on
mass and energy balances and measured temperature and consistency profiles was
demonstrated by Illikainen /41/.
2.2.2 Energy consumption and the intensity concept
Experimental results in pilot scale showed how harshness of refining could be increased
by increasing the refiner speed, and at the same time save 10-20% of refining energy
/42/. Same amount of energy saving was obtained using the same 24 inch pilot refiner
in double disk instead of single disk mode /42/. A new process using high speed and
elevated temperature in the first refining stage was introduced in pilot scale by
Sundholm /43/. The same principle was exploited in industrial scale at Perlen papier AG
/44/.
Miles and May have presented the intensity concept to describe and quantify the nature
of refining in the TMP process, and they could also give theoretical explanation to the
phenomena of high speed refining. According to them pulp retention time in the plate
gap is the main factor affecting refining intensity /11/. The model includes the effect of
the wet weight and the density of pulp in the plate gap assuming direct relationship
between mechanical pressure and the density of pulp pad /12/. The average refining
intensity is the total amount of energy applied to the pulp divided by the number of
impacts. However, the local refining intensity can be quite different from the average.

KCL Communications 12
21
This is especially true near the outer part of the refining zone, where the residence time
of the pulp is short /12/.
Härkönen has analyzed energy consumption in TMP pulping, and modified the Miles and
May equations /45/.
ρεstr
ρεVtAr
mAr
mM
SECτω
=τω
=τω
=ω
=&&
(1)
SEC, specific energy consumption, kWh/t M, torque, Nm ε, volume fraction of fiber ρ, basic density of fiber, kg/m3
τ, shear stress in plate gap, N/m2
ω, angular velocity, 1/s A, surface area of segments, m2 s, average distance between segment surfaces, m r, radius of segment, m t, residence time of fiber in the plate gap, s m& , fiber flow rate through refiner, t/h V, plate gap volume m3 The refining intensity concept is presented using formulas 2 and 3.
Νωt
SECI = (2)
I, refining intensity N, number of bars in a segment
Combining equations 1 and 2 gives refining intensity as
sNr
VNAr
VNM
mNtM
Iρετ
=ρε
τ=
ρε== (3)
Härkönen stated that refiner speed has not been shown to influence retention time and
that refining intensity may not increase with increasing speed. However, numerous
measurements of pulp quality have shown that a higher rotational speed tends to
shorten the fibers, which is a sign of a harsher defibration action. Another possible
explanation is that the volume is reduced and the proportion of shearing (bar- fiber)
contacts is increased, which also results in harsher refining.
In all these equations the terms ρ (basic density of the fiber) and ε (volume fraction of
fiber in the plate gap) suggest that fiber properties interact with the defibration and
affect the intensity as well as the specific energy consumption. In original equations

KCL Communications 12
22
fibers were assumed to be uncompressed, but applying the equations for compressed
fibers emphasizes the interaction of fiber material and refining action.
2.2.3 Energy consumption for different softwood species
In the TMP process, pine (Pinus sylvestris) needs around 30% more refining energy than
spruce (Picea abies) to reach the same tensile level /46/, whereas in the PGW process
the energy consumed by pine is the same as, or only slightly higher than, that of spruce
/47/. The higher extractives content of pine was suggested as the reason for its higher
energy consumption by Reme /2/. The same author also showed pine TMP long fibers to
have a larger variation in cell wall thickness around the fiber perimeter than spruce TMP
long fibers, based on microscopic cross-sections, figure 2.2. An explanation for this
would be different ways of fiber separation between spruce and pine.
Figure 2.2. Mean fiber wall thickness of pine and spruce TMP pulps (early- and latewood
fibers) plotted against wall thickness standard deviation. The deviation is larger for pine than for spruce, (redrawn) /2 /.
Miles and Karnis have shown that the specific energy required to reach a given freeness
is higher for wood consisting of short and coarse fibers than for wood consisting of long
and slender fibers. They suggested a model based on the assumptions that fiber length is
preserved and fiber coarseness is reduced. The amount of fines produced is a function of
specific energy consumption and almost independent of wood species. They based this
*
*
* + +
+
+ ++
* ++
+++
*
* + *
Spruce
Pine
1.0
0.9
0.8
0.7
0.6
0.5
0.4 1.0 1.5 2.0 2.5 3.0 3.5 4.0 4.5
Fibre wall thickness (micron)
Fiber wall thickness standard deviation (micron)

KCL Communications 12
23
model on the data reported by several authors and on some of their own results /48/. In
an earlier investigation they studied the effect of fiber morphology on the development
of loblolly pine and cedar fibers using two different angular velocities (1800 and 1200
rpm) /4/. They stated that when specific energy per impact e, number of impacts n and
specific energy E are constant, fibers of different morphology will not respond in the
same manner to the energy applied. Pine developed in strength more slowly than cedar
although freeness and L factor were the same; they therefore concluded that the
difference lay in fiber conformability. Pine is a stiffer fiber than cedar and thus requires a
longer residence time to develop. This can be done either by increasing the consistency
or lowering the speed, as shown in Table 2.2.
Table 2.2. Comparison of cedar and pine TMP /4/. Operating conditions and pulp properties
Cedar Pine
Specific energy consumption, GJ/ton 7.8 11.3 Rotational speed, rpm 1800 1200 Discharge consistency, % 20 20 Residence time, s 1.2 4.3 Total number of impacts 19,000 76,000 Specific energy per impact, GJ/ton 0.0004 0.00015Specific power per impact, GJ/ton/s 6.5 3.2 Freeness, ml CSF 73 46 Shives, % 0.08 0.12 L-factor, % 34 43 Density, kg/m3 435 365 Burst index, kPam2/g 1.6 1.4 Breaking length, Nm/g 37 32 Tear index, mNm2/g 5.7 6.1
Dickson analysed the influence of refining on the water induced roughening of Radiata
pine fibers. The mature earlywood fibers were most harmful even after extensive refining
/49/.
Stationwala compared different wood species and the fines generated from them. In the
case of grinding the amount of fines produced depended on the species. The amount of
fines at a given specific energy consumption was lowest for red cedar and highest for
jack pine. In the case of refiner pulps the amount of fines did not depend on the wood
species, whereas the nature of fines at a given specific energy consumption did. Fines
with the greatest turbidity were produced from Douglas fir, followed by balsam fir, white
cedar and black spruce /50/. Miles and Omholt have shown that the effect of reducing
rotational speed in the post-primary refining stages depends on the wood species. They
compared black spruce, jack pine and loblolly pine. Changing from high to low speed
increased the long-fiber content, i.e. loblolly pine gained more than jack pine from low-
speed refining /51/.

KCL Communications 12
24
Rudie et. al. /52/ tried to show correspondance between the parameter of fiber
circumference divided by the cross sectional area of fiber wall with the pulp breaking
length at a fixed specific energy consumption. Within one species they had found this
relationship but they failed to show it when different wood species were compared. They
continued to study the mechanics of early and latewood fibers of loblolly pine by
repeated cyclic compression and measured the temperature rise of early and latewood
sections. The higher temperature rise of the earlywood than latewood section
corresponded to the higher amount of energy absorption. The final conclusion they made
was that due to this higher absorption of energy early wood fibers break down faster
than latewood. This conclusion deserves further discussion later. Salmén found that at
the same stress level of cyclic compression, earlywood fibers encounter 50% volume
deformation and latewood fibers only 5% /7/.
2.3 Changes in fiber dimensions during mechanical pulping
2.3.1 Fiber length
Fiber length distribution changes dramatically during mechanical pulping. One-third of
the fiber mass loses its form and turns into fines, which consist of pieces of fiber wall,
parenchyma cells and fibrils. The shape of the fiber length distribution is different for
different mechanical pulp types, as demonstrated in Figure 2.3. /35/.
GW 73 PGW 67 PGWS 61 TMP 57
100
80
60
40
20
0
%
Fines, %Middle fraction, %Long fiber, %
Figure 2.3. The conditions of fiber separation influence the fiber length distribution
of mechanical pulps at roughly same freeness levels, figures 73,67,61 and 57 ml refer to freenesses. Increasing temperature increases the long-fiber fraction and reduces the middle fraction correspondingly GW= 70, PGW 95, PGWS 135, TMP 143ºC /35, redrawn p. 395/.

KCL Communications 12
25
The long fiber fraction of groundwood pulps increases with increasing temperature. For
TMP made from the same raw material, the increase in fiber length is even greater,
defibration occurred in higher temperature (143ºC) than defibration of groundwood pulps
(135ºC). The fines content diminishes as the long fiber fraction increases, but the
biggest change is seen in the size of the middle fraction. This suggests that at lower
temperatures fiber length is reduced when a larger proportion of the fibers are cut during
fiber separation and end up in the middle fraction. Koran has shown that above 100ºC
each 10ºC increase in temperature reduces the energy of fiber separation by 6% and
thus increases the number of fibers that are separated unbroken on new surfaces /53/.
Stationwala compared the grinding of various refiner pulps with the refining of grinder
pulps /54/. He used L-factor to represent the fiber length. The results support the earlier
hypothesis that the fiber length is determined during fiber separation, Figure 2.4. The
faster decrease of the L-factor during the subsequent refining of PGW suggests that the
amount of damage induced during fiber separation affects the development of fiber
length during subsequent mechanical treatment. Part of the gradual decrease in the long
fiber fraction after the fiber separation stage reflects the decrease in long-fiber
coarseness /55/.
TMP andground TMP
PGW andrefined PGW
SGW
70
60
50
40
30
200 2 4 6 8 10 12
L-Factor, %
Total specific energy, GJ/metric ton
Figure 2.4. Long-fiber contents ( L-factor) of mechanical pulps. TMP (open circles) and ground TMP (closed circles) have the highest contents, PGW (open squares) and refined PGW (closed squares) and SGW the lowest /54/.

KCL Communications 12
26
The reduction in fiber length varies for different types of fibers. Tyrväinen made TMP in
industrial-scale refiners using wood from regeneration forest, first thinnings and sawmill
chips. Based on the findings, it was shown that the fiber length of sawmill chips
diminished most after the first refining stage /56 p. 108/.
Table 2.3. Reduction in fiber length for different types of wood fibers during mill-scale
TMP refining, original data from Tyrväinen /56 p.108/. Fiber length reduced in pulping Sawmill Regeneration First thinning mm % Mm % Mm % Wood 3.0 0 2.4 0 1.9 0 1st refining stage 2.0 33 1.9 21 1.6 16 2nd refining stage 1.8 40 1.7 29 1.5 21 Reject refining 1.7 43 1.6 33 1.3 31
Similarly, Mörseburg /5 p.134/ has shown that the reduction in fiber length during
grinding is greater for mature than juvenile wood. The juvenile wood samples were
around 20 years and the mature wood around 58-74 years old.
2.3.2 Fiber wall thickness
Fiber wall thickness also diminishes during defibration. Höglund has reported a
substantial fiber wall thickness reduction during production of news and LWC grade TMP
/57/. He also compared different wood growth rates and found that the shapes of the
distributions resemble those of the original wood. Mörseburg showed that the fiber wall
thickness of mature wood decreased but that with juvenile did not clearly decrease./5, p.
121, 134/. Reme measured dried fibers using SEM and reported fiber wall thickness
reductions of 4-16% from 1st to 3rd refining stage /58, p. 86/. Reme found that the wall
thickness reduction, was larger for the latewood fibers than earlywood fibers /58 p. 90/.
Murton examined early and latewood rich Radiata pine and showed that the wall
thickness of earlywood fraction reduced more readlily than that of late wood fraction. He
proposed that in addition to fiber wall reduction more thin walled fibers could be released
from shives fraction and thus increase the number of thin walled fibers /60/. One remark
has to be done to that study. Early and latewood chips were separated by color before
refining. It could mean that latewood fraction also contained all the reaction wood. An
indication of that is the higher lignin content of latewood fraction, which is not an
expected result. The high compression wood content could explain the untypical behavior
of the late wood fraction. According to Kure earlywood fibers are more likely to split and
latewood fibers more likely to be peeled off /61/. The wall thickness measurements of
intact early- and latewood fibers as well as that of split fibers showed that the split fibers
had the same wall thickness distribution as the earlywood fibers /58p. 84 /.

KCL Communications 12
27
2.3.3 Formation of fines
Fines particles make up about one-third of mechanical pulp. Back in the 1930s Brecht
reported how to create poorly bonding flake-like fines in grinding by using dried raw
material and sharp grits /62/. Giertz emphasized the importance of fines as a bonding
material between the fibers and used the concepts of primary and secondary fines /63/.
Primary fines were formed at the beginning of the process and secondary fines later
during refining. Corson has shown that the fines formed in reject refining have greater
bonding ability than those formed earlier in the process /64/. Luukko et al. worked to
develop an image analysis method to measure the proportions of flake-like and fibrillar
fines /65/. Nature of the fines fraction formed is shown to control the refining energy
demand in a summary of wood quality studies carried out in New Zealand /66/. With
fibrillar fines a required drainage was more easily achieved than with particulate, flake-
like fines. The fibrillar fines were more easily formed from slabwood and the fines formed
from the thinnings were particulate, flakelike fines that had a lower drainage. The
number of latewood fibers was shown to decline during reject refining /59/. The results
of Tyrväinen show that fibers from old trees cut for forest regeneration produced fines
that were superior to those from first thinning and sawmill chips /56/.
2.4 Development of fiber wall structure in mechanical pulping
2.4.1 Fiber flexibility
The flexibility of fibers after their removal from the wood matrix is one measure of the
structural changes in the fiber wall. Flexibility is influenced by decreasing fiber wall
thickness and changing cross-sectional shape. Flexibility is related to both the modulus
of elasticity and the moment of inertia of the fiber wall /55/.
I
1yFlexibilit
∗Ε=
E, modulus of elasticity I, moment of inertia
Karnis has shown that TMP fibers have a greater flexibility than RMP fibers at the same
coarseness. He suggests three reasons for this:

KCL Communications 12
28
TMP
RMP
30
25
20
15
10
5
00 0.2 0.4 0.6 0.8
*Kraft
Fraction P14/R28
Fiber flexibility, N m x 10-1 -2 11
Fiber coarseness, mg/m
Figure 2.5. At the same coarseness, TMP fibers are more flexible than RMP fibers /55/.
1. Temperature affects fiber structure at the molecular level: raising the temperature induces a permanent decrease in the elastic modulus.
2. More flexible fibers are retained in the long-fiber fraction when defibration is carried out at higher temperature.
3. Long fibers become more fibrillated when defibration occurs at higher temperature. (Karnis reports that at the same coarseness TMP fibers are more fibrillated than RMP fibers.)
Hattula has shown the crystallinity of cellulose increase at the area of 130-170○C but
start to decrease after that /67 p.61 /. The effect of temperature could be due to
changes in cellulose crystallinity, but on the other hand the greater number of flexible
fibers could result just from the increase in the number of long fibers. The increase in
fibrillation could be attributable to the method used to measure flexibility. In this method
fibers are pressed against a wired glass plate. A greater degree of fibrillation means the
fibers adhere more strongly to the plate and the flexibility values obtained are therefore
higher. The alternative method used for single fiber flexibility measurement has been
introduced by Tam Doo and Kerekes /68/ and it can give more correct information of the
flexibility changes as such.
Tchepel determined the elastic modulus of single fibers using a single fiber fatigue cell
and the moment of inertia using a confocal laser scanning microscope. In the single fiber
fatigue cell the fibers were attached to two forks by epoxy droplets and loaded axially for
60–100 cycles using a frequency of 0.049-0.083 Hz at 100ºC and 100% humidity. The
KCL Communications 12
29
axial force and the fiber elongation were measured during the test /69, 70/. Tchepel
suggests that the higher flexibility is primarily a result of changes in the cross-sectional
dimensions of the fiber rather than its elastic modulus. She has shown that fibers refined
at high intensity were more flexible than those refined at low intensity. The moment of
inertia and flexibility curves for early- and latewood were similar. The modulus of
elasticity decreased with increasing fibril angle. Fibers refined at high intensity had a
higher modulus of elasticity, but the moment of inertia was lower, which resulted in
greater flexibility.
2.4.2 Fiber wall pore volume
Using nitrogen absorption technique, Stone /32/ reported already 1968 that pores and
internal surface are formed in the fiber wall during mechanical pulping. The pores in the
moist fiber wall are filled with water and later, Stone and Scallan reported that the
nitrogen absorption technique is not applicable to water-saturated wood fibers /71/.
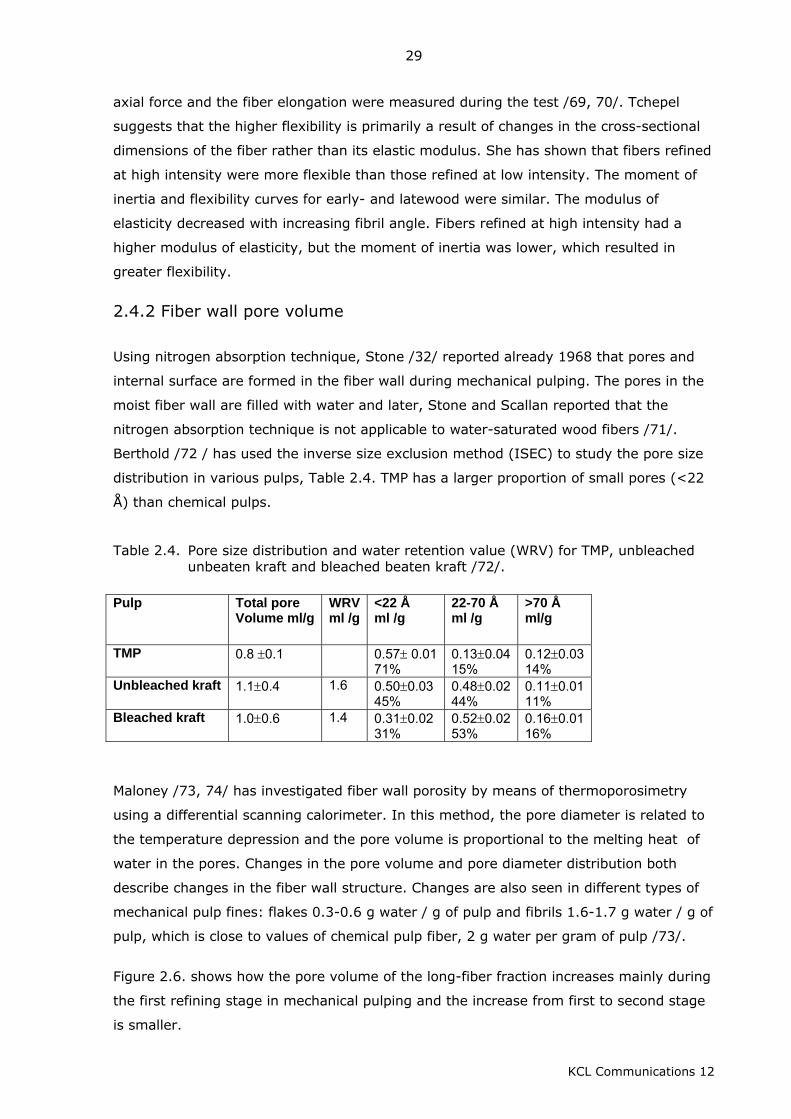
Berthold /72 / has used the inverse size exclusion method (ISEC) to study the pore size
distribution in various pulps, Table 2.4. TMP has a larger proportion of small pores (<22
Å) than chemical pulps.
Table 2.4. Pore size distribution and water retention value (WRV) for TMP, unbleached
unbeaten kraft and bleached beaten kraft /72/. Pulp Total pore
Volume ml/g WRVml /g
<22 Å ml /g
22-70 Å ml /g
>70 Å ml/g
TMP 0.8 ±0.1 0.57± 0.0171%
0.13±0.0415%
0.12±0.03 14%
Unbleached kraft 1.1±0.4 1.6 0.50±0.03 45%
0.48±0.0244%
0.11±0.01 11%
Bleached kraft 1.0±0.6 1.4 0.31±0.02 31%
0.52±0.0253%
0.16±0.01 16%
Maloney /73, 74/ has investigated fiber wall porosity by means of thermoporosimetry
using a differential scanning calorimeter. In this method, the pore diameter is related to
the temperature depression and the pore volume is proportional to the melting heat of
water in the pores. Changes in the pore volume and pore diameter distribution both
describe changes in the fiber wall structure. Changes are also seen in different types of
mechanical pulp fines: flakes 0.3-0.6 g water / g of pulp and fibrils 1.6-1.7 g water / g of
pulp, which is close to values of chemical pulp fiber, 2 g water per gram of pulp /73/.
Figure 2.6. shows how the pore volume of the long-fiber fraction increases mainly during
the first refining stage in mechanical pulping and the increase from first to second stage
is smaller.

KCL Communications 12
30
* ******
* **
***
0.25
0.20
0.15
0.10
0.05
0.001 10 100 1000
Pore Diameter (nm)
Pore Volume (ml/g)
Wood
1st stage R50 (1-1)2nd stage R50 (2-1)
Figure 2.6. Pore volume of wood shives and pulp long fiber fraction ( R 50) from 1st stage
and pulp from 2nd stage of TMP, redrawn /73 p.25 /.
The increases in specific surface area and delamination were studied from wood to highly
refined reject fibers /74/. The total bound water (TBW) present in a long-fiber fraction
increased with increasing specific energy consumption. That of the whole pulp (WP)
increased even more, which indicated that the fines and middle fractions formed had a
higher pore volume than the long-fiber fraction. The content of non-freezing water did
not increase, i.e. the number of small pores did not increase during refining, Figure 2.7.
Maloney suggests three different mechanisms to explain the increase in fiber wall pore
volume.
1. The cell wall is under compression when held in the wood matrix, and the stresses are released when the fiber is liberated; as a result the fiber wall expands.
2. The outer surface area increases as the fibers are separated and the polymer network on the outer layer is broken. External fibrillation increases and the fibrils have been shown to have a higher cellulose content and thus to swell more easily.
3. Delamination of the fiber wall.

KCL Communications 12
31
0.8
0.7
0.6
0.5
0.4
0.3
0.2
0.1
0.00 1 2 3 4 5 6
SEC (MWh/ton)
Amount of Water Fraction (ml/g)
TBW, wp
TBW, R50
NFW, wp
Figure 2.7. The amount of water held by the fiber wall increases as a function of
increasing refining energy, NFW = non-freezing water TBW= total bound water WP= whole pulp, redrawn/74/.
Maloney considered delamination the least probable of these. However, more information
should be obtained by using complementary methods to characterize pore volume, and
the mechanisms by which pore volume increases during mechanical pulping should also
be discussed.
2.4.3 Local damage to the fiber wall
Hamad /75/ has studied local damage to mechanical pulp fibers using a single fiber
tensiometer, shear testing and radial compression to subject the fibers to cyclic loading.
A CLSM (confocal laser scanning microscope) was used to image the changes in the fiber
wall. He suggests that pits are natural defects and that these form a stress
concentration. Microcracks initiate at such weak points. Microcracks were more apparent
in pulp fibers refined using higher energy consumption. The formation of microcracks
followed initiation of cracks on the surface and later longitudinal macrocracks. He also
reported local volumetric expansion of fibers as a result of the macrocracks formed.
When a crack cleaves the fiber wall it is called a split. Reme et. al. used two different
types of methods to characterize fiber splitting. Either long-fiber fraction (McNett + 28)
was spread on a slide and the split length of the fiber population as a percentage of the

KCL Communications 12
32
total length determined manually (150 fibers measured) /58, p. 64/, or cross-sections of
the freeze-dried +48 fraction were prepared and imaged with the help of a scanning
electron microscope and the images analyzed /58 p. 46/. Fernando /76/ explored the
fiber wall damage and fibrillation of a one stage refined spruce TMP using SEM and
ESEM. The pulp freenes was 100 ml, which means fairly harsh refining in one stage.
Fibrillation was initiated by the development of splits at sites of weakness in the native
fiber wall. Examples of those are the abrupt changes of microfibril angle and the pits.
Fibrillation followed the orientation of fibrils in the fiber wall.
2.4.4 Chemistry of the fiber wall
The chemistry of fiber surfaces changes during defibration as the outer surfaces are
stripped off and new layers with different chemistry revealed, but already dissolved
material may reprecipitate on the surfaces /77/.
During mechanical defibration wood is subject to high temperatures up to 180ºC, well
above the lignin softening temperature, and diluted to low consistencies (2-4%) with hot
water (60-80ºC). Volatile compounds evaporate off and water-soluble sugars and lignans
dissolve. Extractives are dispersed or even dissolved but may also be redeposited. Part
of the middle lamella lignin may also be removed and dispersed. Cellulose crystallinity
increases due to the high temperature /67/.
Some differences arise from variations in the fiber raw material. Mörseburg showed a
higher lignin content in juvenile wood and a decrease in lignin content as a function of
increasing energy application for both juvenile and mature woods /3 p. 135/.
2.5 Critical summary of the literature
2.5.1 Relating the defibration patterns to the literature
Many examples in the literature give support to the hypothesis that the morphological
properties of fibers influence the defibration action and that morphologically different
fibers have characteristic defibration effects /1-8, 49-52, 56-61, 64, 66, 76/. Salmén’s
results show that at the same level of cyclic compression the earlywood fibers encounter
50% volume deformation and latewood fibers only 5% /7,8/ and Rudie measured faster
temperature rise in earlywood than latewood section /52/. More heat could thus be
generated in earlywood fibers, and locally the cell wall material could be at a higher
temperature and better able to resist the forces that tend to cut the fibers. Rudie’s
conclusion was that high energy absorption means that early wood fibers would break
more easily /52/, but this might not be the right interpretation. Miles and Karnis /4, 48/
have also stated that fibers differing in morphology will not respond in the same manner

KCL Communications 12
33
to the energy applied. Pine developed strength more slowly than did cedar although the
freeness and the L factor were the same, and the authors therefore concluded that the
difference lay in fiber conformability. Pine is a stiffer fiber than cedar and a longer
residence time was required to develop its fibers. Miles and Omholt /51/ have shown that
reducing the rotational speed increases the long-fiber content in such a way that loblolly
pine gains more than jack pine from low-speed refining. The thick-walled stiff loblolly
pine fibers are probably compressed less than jack pine fibers. Referring back to
equation 3, and assuming fibers are compressed, the term ε (volume fraction of the
fibers in the plate gap) can be smaller when stiffer fibers are used. Consequently, under
the same refining conditions refining intensity is greater if the volume fraction of fibers in
the plate gap is reduced.
The two parts of the hypothesis, i.e. the characteristic reactions of morphologically
different fibers and how they influence the defibration action through the fiber bed, will
be discussed using the results obtained in this study.
Figure 2.8. Schematic presentation of the main hypothesis, how fiber properties
influence the defibration pattern.
2.5.2 Fiber shortening
Fiber length reduction during defibration is easily discovered and measured. The
importance of the fiber separation stage to fiber length is obvious and is clearly shown
when the same wood raw material is pulped using grinding and refiner mechanical
pulping methods. The increase in the middle fraction instead of the fines fraction
indicates the real cutting of fibers, figure 2.4 /35/. The grinding of refiner pulps and
refining of grinder pulps confirms the importance of the fiber separation stage /54/. The
amount of damage induced during fiber separation affects the development of fiber
length during subsequent mechanical treatment.
Defibration action Defibration
patterns
Fiber properties
Defibration effect 1
Defibration effect 2
Defibration effect 3

KCL Communications 12
34
The age of a tree and juvenile wood content influence the wood fiber length. Data of
Tyrväinen and Mörseburg /56,5/ suggest that the ability of fibers to resist shortening is
different. The reaction of juvenile wood fibers is also influenced by the effects of
heartwood formation. With trees older than 40 years the juvenile wood fibers present in
the stem are turned to heartwood. This makes it more complex to distuinguish the
effects of high dry solids content and morphological properties. Further investigations are
needed to clarify the defibration pattern of fiber shortening during the fiber separation
and fiber development stages of the TMP process.
2.5.3 Fiber wall thickness reduction
The reduction in fiber wall thickness during defibration has been shown by means of
coarseness and fiber wall thickness measurements. Typically the fiber wall becomes
thinner as material is peeled off from the surface. The amount and nature of fines
reflects the phenomena of fiber wall peeling. In grinding, the amount of fines depended
on the wood species, but for refiner pulps it was related only to energy consumption. The
nature of the fines formed at a given specific energy consumption depended on the wood
species /50, 64, 66/.
The role of initial defibration and fiber development during further refining needs to be
clarified. Studying the properties of fines gives valuable information of the phenomena.
2.5.4 Development of fiber wall structure
Increasing energy consumption leads not only to fiber shortening and wall thickness
reduction but also to greater fiber flexibility and cross sectional conformability. Flexibility
depends on the moment of inertia and elastic modulus of the fibers. From the changes in
flexibility alone it is difficult to distinguish between the effects of moment of inertia and
elastic modulus. In the area of LC refining, there have been attempts /78,79/ to
distinguish between the effects of fibrillating refining and compressive refining. Tchepel
tried to influence the modulus of elasticity using cyclic axial loading, but concluded that
the increase in flexibility during mechanical defibration is due to a decrease in the
moment of inertia /69,70/. How well changes in the fiber wall can be investigated by
studying its axial deformations is open to discussion, however. Karnis has shown that
thermomechanical and refiner mechanical pulp fibers have different flexibilities at the
same coarseness and speculated that an increase in temperature could induce a
permanent decrease in the elastic modulus /55/. The method used to measure fiber
flexibility is also important. In the method used by Karnis, a fiber mat is pressed against
a wired glass plate. Fibers that are more fibrillated are likely to bond more strongly to
the glass plate and this could result in a higher flexibility /80/.

KCL Communications 12
35
During the fiber separation and fiber development stages compressive, shearing and
elongating forces act on the fibers causing strain in the fiber wall. Permanent structural
changes may occur from molecular to macrolevels, but demonstrating and determining
these changes poses a challenge.
The development of the internal structure, conformability of fiber wall appears to be a
combination of different phenomena, but it can be quantitatively described by the
increase in pore volume. It should be complemented with qualitative measures, which
give more information about the nature of the pore volume increase. No information was
found of the fiber wall development of morphologically different fibers in literature.
2.5.5 Concepts of defibration actions, effects and patterns
The concepts used in this thesis are:
• defibration actions • defibration effects • defibration patterns
Defibration action consists of forces acting on the fibers during defibration. Defibration
effects are the measurable deformations in the fibers as a result of defibration actions.
Defibration patterns are a set of defibration effects that develop the stiff wood fibers into
papermaking fibers and fines particles. These patterns are characteristic of the fiber
morphology and defibration conditions. This means that the same amount of energy will
lead to a different set of effects when wood fiber properties vary.
These concepts can be applied to all mechanical pulping processes, but this thesis
focuses on their application to the TMP process and Norway spruce, Picea abies.
Defibration actions during mechanical pulping (TMP)
Cyclic compression of fiber material (chips or fiber bed) in the plate gap Generation of heat due to viscoelastic nature of the wood Shearing of fiber material as a result of defibrating impacts of rotating plate
bars Forces acting on fibers caused by the input feed and flowing steam Evaporation of water from the fiber wall due to pressure release

KCL Communications 12
36
Defibration effects on fibers during mechanical pulping
Effects on chemical structure
• Softening of polymers due to heat generated either from friction work during defibration or from cyclic compression and relaxation of the fiber mat
• Increase or decrease in cellulose crystallinity due to temperature rise • Evaporation of volatile terpenes • Dissolution of water-soluble hemicelluloses
Effects on fiber morphology
• Fiber cutting • Splitting of fiber wall • Peeling off of outer wall layers • Formation of fines through fibrillation • Increase in fiber wall pore volume
Defibration patterns from wood to paper fibers
• Shortening of fibers • Reduction in fiber wall thickness • Development of fiber wall structure
The defibration patterns will be further examined using the experimental data gathered
from several experiments. The data consists of measured properties of raw material,
undefibrated wood particles after the refiner i.e. shives, defibrated fibers and fines. This
data is used to describe and quantify the defibration effects which are then combined to
characteristic defibration patterns. Defibration actions are estimated from the recorded
standard data. In mechanical pulping for publication grades it is most important to
reduce the fiber wall thickness and loosen the fiber wall structure, without too large fiber
length reductions.

KCL Communications 12
37
3. EXPERIMENTAL
Experimental data to examine the defibration patterns is presented in references 81-88
and Appendices 1.1- 1.8 and 2.1-2.8. The effect of fiber properties on the defibration
patterns was studied either monitoring separately the early- and latewood fibers or using
raw material of different growth rates.
The questions set were: How fiber length is determined during mechanical pulping How fiber cross-sectional dimensions are affected during mechnical pulping How fiber wall structure is affected during mechanical pulping
The raw materials, size and type of the refiner, and energy inputs are summarized in
Table 3.1.a-c, Table 3.2 summarizes the characteristics of the raw materials with
different growth rates.
Table 3.1 a. How fiber length is affected during mechanical pulping, experimental data. Aim of the study Raw material Defibration Variables MWh/t 1.1a.* Importance of initial defibration for fiber length reduction
Spruce chips from a TMP mill in central Finland
24-inch pilot refiner, DD
Rate of rotation, Temperature
0.45-1.5 /81/
1.1b.* Importance of initial defibration for fiber length reduction
Spruce chips from a TMP mill in central Finland
SD 65 1st stage mill refiner
Radius of refiner plate
1st stage millref. /82/
1.2.* Effect of wood fiber properties on fiber length reduction during mechanical pulping
Four wood lots with different growth rates
RGP 42 SD PGW
Rate of rotation Wood growth rate
0.27-2.79 /83/
*Number of study refers to appendices Table 3.1.b. How fiber cross-sectional dimensions are affected, experimental data. Aim of the study Raw material Defibration Variables MWh/t 1.3.* Fiber cross-sectional dimensions are affected through gradual peeling off of material
Mill spruce chips from central Finland
Bauer 40 pilot refiner DD, 1st stage Laboratory refiner Sprout-Waldron 5 passes
Specific energy consumption
0.57-5.27 /84/
1.4.* Fiber cross-sectional dimensions are affected through gradual peeling off of material
Slow growth raw material (Fast growth raw material)
RGP 42 SD 1st, 2nd stage Screening, reject refining
Specific energy consumption
1.5- 4.9 /85/
1.5.* Effect of wood fiber properties on fiber wall thickness
Two raw material lots with different growth rates
RGP 42 SD Fine plate pattern
Wood growth rate
1.23-3.08 /86/
*Number of study refers to appendices.
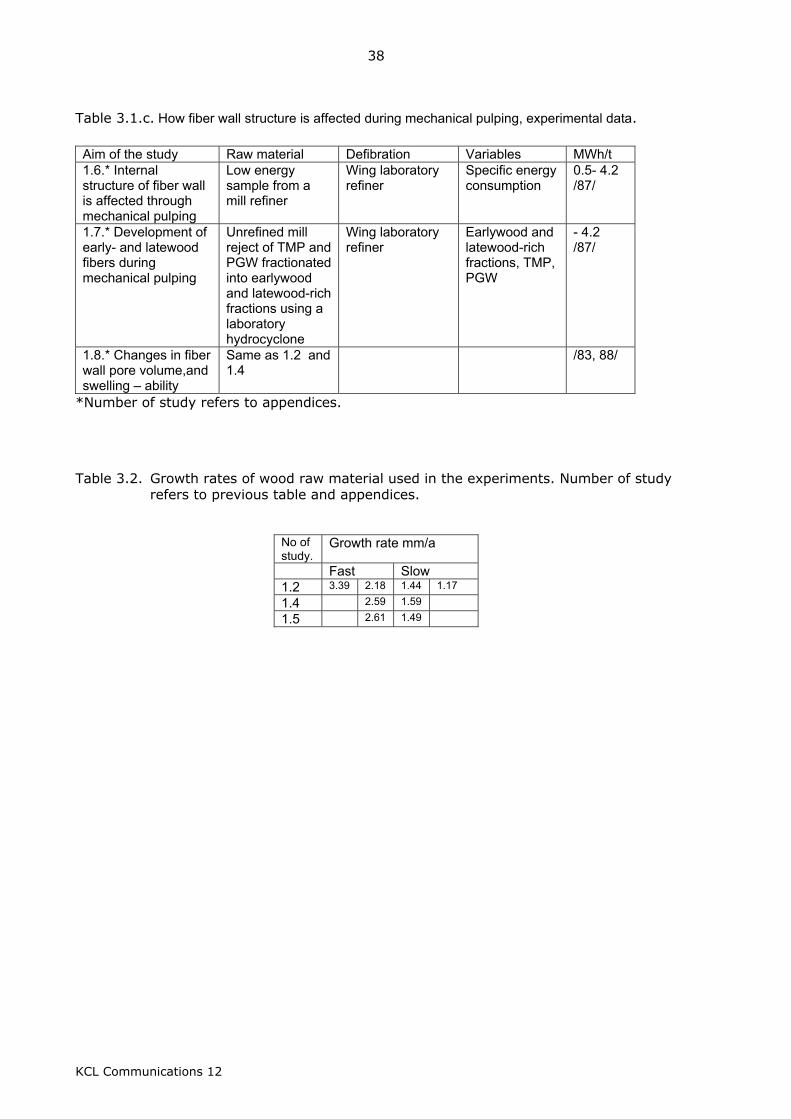
KCL Communications 12
38
Table 3.1.c. How fiber wall structure is affected during mechanical pulping, experimental data. Aim of the study Raw material Defibration Variables MWh/t 1.6.* Internal structure of fiber wall is affected through mechanical pulping
Low energy sample from a mill refiner
Wing laboratory refiner
Specific energy consumption
0.5- 4.2 /87/
1.7.* Development of early- and latewood fibers during mechanical pulping
Unrefined mill reject of TMP and PGW fractionated into earlywood and latewood-rich fractions using a laboratory hydrocyclone
Wing laboratory refiner
Earlywood and latewood-rich fractions, TMP, PGW
- 4.2 /87/
1.8.* Changes in fiber wall pore volume,and swelling – ability
Same as 1.2 and 1.4
/83, 88/
*Number of study refers to appendices. Table 3.2. Growth rates of wood raw material used in the experiments. Number of study
refers to previous table and appendices.
No of study.
Growth rate mm/a
Fast Slow 1.2 3.39 2.18 1.44 1.17
1.4 2.59 1.59
1.5 2.61 1.49

KCL Communications 12
39
4. RESULTS
4.1 How fiber length is determined during thermomechanical pulping
The defibration pattern i.e set of defibration effects that accompanies fiber length
reduction is discussed in this chapter. The importance of the conditions during fiber
separation and the shortening of morphologically different fibers are the main topics of
interest. In order to see the effects of fiber separation, the size of undefibrated particles
and the fibers in these particles at low energy levels were analyzed. Morphologically
different fibers were compared.
4.1.1 Effect of initial defibration on fiber length
The importance of the initial defibration conditions, defibration temperature and refiner
speed was studied by examining the undefibrated fraction of low-energy pulps /appendix
1a, 81/. At the same level of energy consumption, defibration under atmospheric
conditions and temperatures below 100ºC (RMP pulps) produced more undefibrated
particles and less long fibers than defibration under pressurized conditions (PRMP pulps),
Figure 4.1.
Figure 4.1 Particle length distributions of low energy (0.5 MWh/t) RMP- on the left and
PRMP- pulps in the right figure. Dashed areas represent undefibrated and open areas defibrated material. Area of a bar represents weight-% of the fraction.

KCL Communications 12
40
Figure 4.2 Undefibrated particles of RMP contained thick particles with broomed ends.
The particles in the fraction were characteristic of the process: RMP contained short,
thick particles with broomed ends while no such particles were observed in PRMP, where
the typical particles were thin and flexible. In Figure 4.2. is shown a shive from a coarse
RMP sample.
The length of the particles later called shives increased slightly with decreasing refiner
speed, but there was no difference in shive length between PRMP and RMP, Figure 4.3.
However, the coarseness of the shives was clearly influenced by the temperature of the
initial defibration. Coarseness of shives was higher at low temperature.To determine
whether the fibers were already damaged before being separated from each other, the
lengths of fibers present in shives prepared at low specific energy consumption (0.41-
0.59 MWh/t) were determined from macerated fibers. The results are shown in Figure
4.4. At the same coarseness the fibers present in RMP shives were shorter than those in
PRMP shives.

KCL Communications 12
41
PRMP1
900
PRMP1
500
PRMP1
200
RMP1
900
RMP1
500
RMP1
200
30
25
20
15
10
5
0
Length of shives, mmCoarseness of shives, mg/m
Figure 4.3. Lengths and coarsenesses of shives at a specific energy consumption of appr.
0.5 MWh/t. 1200, 1500, 1900 refer to the refiner speed.
Figure 4.4. Weight weigthed length of fibers chemically separated from shives at a specific energy consumption of around 0.5 MWh/t. PRMP shives are more slender and the fibers in them longer. Data for the measurements are given in the appendix 1.1a.
The longest fibers were found in the shives produced at pressurized conditions and 1200
1/ min. Differences in fiber length can be detected before the fibers are separated from
each other. This indicates that the initial defibration and the conditions under which the
fibers are separated determine the final pulp fiber length. This assumption is further
examined in other cases.

KCL Communications 12
42
Shives in the coarse pulp of an industrial single-disk refiner were also analyzed. Samples
were taken direct from the plate gap as a function of plate radius during 1st stage normal
production run conditions /App. 1b, 82/. In Table 4.1 the results are given as a function
of the plate radius. Reduction of shives content and fiber length of macerated shives as
well as late wood fibers in the shives fraction are clear. When these results were first
published it was concluded that the reduction of fiber length occurs at the periphery.
Table 4.1 Properties of shives, fibers in the shives and defibrated fibers. Plate radius, mm 400 536 607 669 736 797 825 Somerville, % - 46.5 52.3 39.2 22.9 6.4 2.4 Macerated fiber length FS 200, mm
2.5 2.4 2.4 2.3 2.0 1.7
Latewood fibers in shives, %
20 17 - 11 5 -
Fiber length*, mm - 1.77 1.74 1.78 1.78 1.68 1.69 * Fiber length was calculated as weight weighted average from the size of 14 and 28 fractions /90/.
Figure 4.5 Fiber lengths of macerated shives (rejects) and defibrated fibers. The samples were taken from the different radial position of a first stage refiner plate gap. Fiber length of defibrated fibers was calculated as weight weighted average from the size of the +14 and +28 fractions.
This conclusion is in conflict with the assumption of the previous chapter: “Initial
defibration and conditions under which the fibers are separated determine the fiber
length”. Further analysis of these results was done by calculating the fiber length of
defibrated fibers as weight weighted average and plotting them against the amount of
reject (shives content), Figure 4.5. Now it shows that fiber length of macerated shives

KCL Communications 12
43
reduces gradually and drops to the level of defibrated fibers at low shives content.
However, the fiber length of defibrated fibers reduces only slightly. The fiber length
reduction in these mill experiments could thus be explained by the similar fiber
separation effect as in pilot experiments.
4.1.2 Fiber length reduction for morphologically different fibers
TMP and PGW were prepared from spruce stands differing in growth rate (1.17- 3.39
mm/a) and age (28-90 years). TMP was prepared using two refiner speeds (1500 and
2400 rpm), PGW was included into the plan in order to have one even harsher fiber
separation mode. More detailed information on the preparation of the samples is given in
App.1.2 /83/. The original wood fiber lengths are compared with pulp fiber lengths in
Figure 4.6. The higher-speed (2400 rpm) refining resulted in a smaller fiber length than
at normal speed (1500 rpm) while the fiber length of PGW was even smaller. The
differences in original wood fiber length influenced pulp fiber length more at 1500 rpm
than at 2400 rpm, while PGW processing reduced both the shortest and the longest wood
fibers to the same pulp fiber length. The thick-walled and long, slow-growth fibers were
most sensitive to PGW processing, and the PGW pulp fiber lengths obtained from both
fast and slow growth raw materials were the same.
Figure 4.6. Fiber length of TMP made from different spruce stands interpolated to 100 ml
CSF Original wood fiber lengths reduced to different levels when processed in different ways. 1500 = refiner speed 1500 1/min , 2400= 2400 1/min in first refining stage. Mill reference means chips taken from a mill.
In order to monitor the behavior of different raw materials during the fiber separation
stage, the low-energy samples representing these four different growth rates were
examined more thoroughly. The undefibrated shives were separated as rejects from the

KCL Communications 12
44
low-energy TMP pulps using TAP screening, App. 1.2. The rejects were macerated and
the fiber length of the macerated shives was examined for the different spruce lots. Fiber
length of accept fibers was determined. In Figure 4.7 are given fiber lengths of shives
and accept fibers interpolated to SEC 0.75 MWh/t. Data is from figure 4.9.
The wood fiber length reduced during defibration, but different raw materials responded
differently. Fiber length of the shives was even higher than that of wood for the fast-
growth lot (3.39 mm/a). For other lots, shive fiber length was similar to wood fiber
length. The thick-walled and long, slow-growth fibers had reduced most already at low
SEC and the thin-walled fast growth fibers least.
Figure 4.7. Differences of wood fiber lengths are evened during TMP pulping. Fiber length
of macerated wood, TMP shives and defibrated accept fibers produced at a SEC of 0.75 MWh/t. Legend refers to wood growth rates mm/a.
A possible explanation for high fiber length of shives of young, fast-grown raw material is
that the stems from the youngest forest stand (28 years) contained hardly any
heartwood, and shives were formed more evenly from the whole stem whereas in the
older heartwood-containing stems shives were more readily formed from the dry
heartwood, which consists of short-fibered juvenile wood.
Fiber length distributions, Figure 4.8 and App. 1.2 show that there are more fines in the
macerated shives material at low than high SEC. This is also seen as increasing average
fiber length, Figure 4.9. During fiber separation the outer fiber surfaces break and pieces
of fiber wall are detached from other fibers, as shown in the micrographs in Figure 4.10.

KCL Communications 12
45
Figure 4.8. Fiber length distribution of macerated shives, amount of fines decreases as a
function of specific energy consumption (SEC).
3500
3250
3000
2750
2500
2250
20000.0 0.5 1.0 1.5 2.0 2.5
Sec total, MWh/t
Fiber
length
(FS
200),
µm
C1500 C2400 D1500 D2400
0.0 0.5 1.0 1.5 2.0 2.5
3500
3250
3000
2750
2500
2250
2000
Sec total, MWh/t
A1500 A2400 B1500 B2400
Slow growth wood C (1.17 mm/a)Fast growth wood D (3.39 mm/a)
Medium growth wood A (1.14 mm/a)Medium growth wood B (2.18 mm/a)
Figure 4.9. Fiber length of macerated shives increases as a function of specific energy
consumption (SEC). Dashed point due to unstability.
The weakened fibers may be damaged further while they are being separated from each
other and refined, suggesting that the origin of fiber wall splitting is in the fiber
separation stage. Figure 4.11 shows examples of fiber wall splitting, which may occur
along the fibrillar structure, Figure 4.11, left, while large areas of the fiber wall may also
be fractured, Figure 4.11, right.

KCL Communications 12
46
Figure 4.10. Shives contain fibers that are broken as a result of separation. Pieces of fiber wall from broken fiber walls are attached to the fibers, on the left. On the right a split fiber on a shive /86/.
Figure 4.11. Examples of split fibers. On the left splitting is along the fibrillar
structure, while on the right the fiber wall has split into two halves /86/.
4.2. How fiber cross-sectional dimensions are affected
The defibration pattern that accompanies fiber wall reduction in thermomechanical
pulping is discussed in this chapter. The gradual peeling off of the fiber’s outer layers and
the formation of fines are the main refining effects.
4.2.1 Formation of fines
During mechanical pulping 30-40% of fiber mass is rendered into fines material. As
shown in the initial defibration studies, around 10% of the fiber material is already in
form of fines after the fiber separation stage. The properties of fines were studied in
order to determine from which parts of the fiber wall the fines particles are formed

KCL Communications 12
47
during pulp refining. Samples were collected as a function of specific energy consumption
from a multistage laboratory refining and screening process, App. 1.3, /84/. The fines
formed during each refining stage were removed, and the remaining long-fiber fraction
was refined further. The fines were numbered 0-5 according to the refining stage, as
shown in Figure 4.12.
0.57MWh/t
1.71MWh/t
3.04MWh/t
4.28MWh/t
4.66MWh/t
5.27MWh/t
Chips
Fines0
Fines1
Fines2
Fines3
Fines4
Fines5
Figure 4.12. Preparation of fines samples as a function of specific energy consumption /84/.
The results of the fines characterization are shown in Table 4.2. The average length of
the particles measured according to Pelton /91/ increased and the lignin content of the
fines particles decreased as a function of specific energy consumption.
Table 4.2 Properties of fines formed as a function of specific energy consumption.
Sample SEC
Average Length
95% Confidence level
Lignin content
MWh/t µm µm % 0 0.57 17.0 0.97 39.0 1 1.71 19.1 1.24 36.9 2 3.04 34.4 1.45 33.5 3 4.28 35.5 1.57 30.2 4 4.66 42.2 1.66 29.2 5 5.27 48.7 1.46 28.8
The increasing particle length and continuous decrease in the lignin content of fines as a
function of specific energy consumption indicated that fines are formed as a result of a
gradual fibrillation of fibers. The fines formed during the first stages are mainly the result
of fiber separation. The lignin content showed a continuous decrease, and that of fines
no. 5 was about the same as an average wood fiber. Based on this the fines formed after
five refining stages are derived mainly from the S2 layer of the fiber, which is the
thickest fiber layer. The structure of the S2 layer, which has well oriented fibrils, enables
longer and wider particles to be formed /92/. These results are in line with the results of

KCL Communications 12
48
Luukko who has characterized the fines by dividing them into fibrillar and flakelike fines
/65/.
In a pilot study, App. 1.4, two-stage mainline refining was followed by two-stage reject
refining of the long-fiber fraction. The reject rate was 50%. The simultaneous decrease
in fiber wall thickness and changes in fines and middle fraction properties can be clearly
seen in Table 4.3.
Table 4.3. Properties of fibers and fines of a slow growth sample ( 1.15 mm/a) as a
function of specific energy consumption. Stage Mainline
1st stage, A1 Mainline 2nd stage, A2
Reject 1st stage, B1
Reject 2nd stage, B3
SEC , MWh/t
1.6
2.2
3.9
4.7
Coarseness mg/m (14/28)
0.417 0.259 0.232 0.218
Fiber wall thickness (+14, average), μm
5.9 5.8 5.0 4.8
Fibrils, % 40 41 50 53 Flakes+ ray cells, %
60 59 49 47
Sedimentation vol. (-200), dm3/kg
420 520 580 620
Spec. filtration resistance (48/200), 10-8 m/kg
184 397 612 1592
Kangas /85 / has further analysed the chemical composition of the above fines particles
and based on her analysis the formation mechanisms of fines are discussed in this thesis.
The chemical composition of fibers ( +200) and fines (-200) classified into fibrils and
flakes through sedimentation shows higher lignin, hemicellulose and pectin contents for
flakes than fibrils but only small changes as a function of energy consumption, figure
4.13. How can the increasing sedimentation volume and specific filtration resistance of
fines and middle fractions in table 4.3 be explained? The proportion of fibrils in the fines
increases throughout and lowers the lignin content of the whole fines fraction, as was
also shown in Table 4.2. However, it does not bring the lignin content of the whole fines
fraction to the same level as in laboratory experiments, because at an energy
consumption of around 4.7 MWh/t the lignin content was 29.2%.
The lignin content of the whole fines fraction of reject refined sample 4.7 MWh/t
consisting of
53% of fibrils with lignin content 31.8 mg/100 mg
47% of flakes+ ray cells with lignin content 40.8 mg/100 mg

KCL Communications 12
49
gives a lignin content of around 35% for the whole fines fraction.
A surprisingly large proportion of the flake-like material is based on measurements made
with a semiautomatic fines image analyzer. The amount of flakes is calculated by means
of a closed algorithm, which is based on the grayscale of the particles. Consequently, as
the flake particles are larger in size than the fibrils, the effect of their mass rate on the
specific surface area of fines is not as great as that of fibrils. This explains the marked
change in the behavior of the fines slurry, specific sedimentation volume and specific
filtration resistance even though the lignin content does not change greatly.
Figure 4.13. Chemical composition of fibers, flakes and fibrils /85 /. A1, mainline 1st stage, B1, reject refining 1st stage, B3, reject refining 2nd stage.
4.2.2 Formation of fines from morphologically different fibers
The character of fines formed from morphologically different fibers was examined using
raw material of two different growth rates: fast-growth wood (2.61 mm/a) and slow-
growth wood (1.49 mm/a), App.1.5, /86/. The slow-growth raw material produced a
more fibrillar type of fines, as shown by the specific sedimentation volume, Figure 4.14.
In the first refining stage different rotational speeds were used, which explains the
deviation for the first-stage pulps. High rotational speed (2400) produced fines with
lower sedimentation volume than normal speed (1500 rpm). As the fibrils are formed
through fibrillation, the fiber fraction was also examined. When the fibrillated long fibers

KCL Communications 12
50
of the same pulps were classified into early- and latewood fibers the fibrillated fibers
were mainly (53-100%) latewood fibers, Table 4.3.
Figure 4.14. Wood raw material affected the nature of the fines (DDJ-200 mesh)
fraction. High specific sedimentation volume means more fibrillar material in the fines fraction. S = slow-growth wood (1.49 mm/a) F = fast-growth wood (2.61 mm/a) 15= 1500 rpm, 24= 2400 rpm in the first refining stage. The second and third refining stages were performed at 1500 rpm for all pulps /86/.
Table 4.4. Externally fibrillated fibers were more often latewood fibers . Latewood content of fibrillated fibers, %
Slowly grown 1500 rpm
Slowly grown 2400 rpm
Fast grown 1500 rpm
Fast grown 2400 rpm
First stage 75 77 100 58 Second stage 71 82 71 60 Third stage 76 67 67 53
This result suggests that fibrillar material is mainly formed from latewood fibers, while
the flake-like material could have been formed from earlywood fibers.
Result in Figure 4.14 indicated that more flake-like material is formed from fast-grown
wood. The explanation could be that fibers with a greater S2 fibril angle favor the
formation of flake-like particles. Following the same logic flake-like material is
preferentially formed from juvenile wood, earlywood and reaction wood fibers, all of
which have a greater fibril angle. The fines could first be formed from pieces of the outer
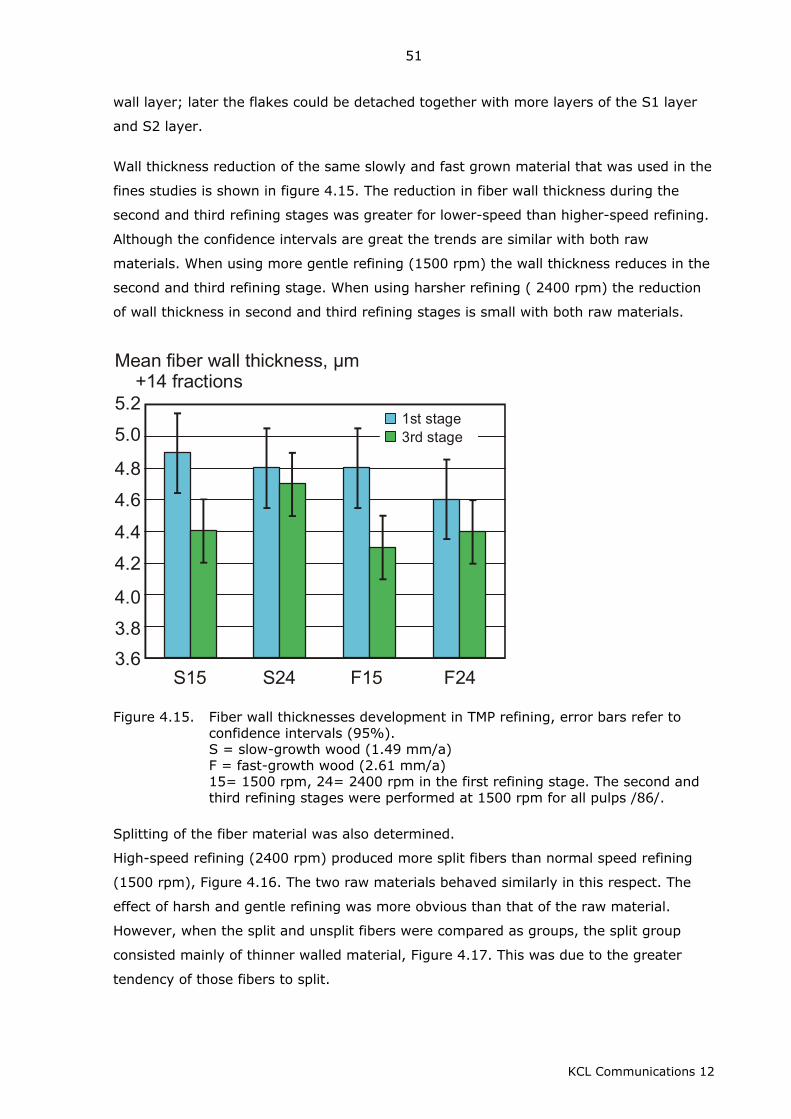
KCL Communications 12
51
wall layer; later the flakes could be detached together with more layers of the S1 layer
and S2 layer.
Wall thickness reduction of the same slowly and fast grown material that was used in the
fines studies is shown in figure 4.15. The reduction in fiber wall thickness during the
second and third refining stages was greater for lower-speed than higher-speed refining.
Although the confidence intervals are great the trends are similar with both raw
materials. When using more gentle refining (1500 rpm) the wall thickness reduces in the
second and third refining stage. When using harsher refining ( 2400 rpm) the reduction
of wall thickness in second and third refining stages is small with both raw materials.
5.0
5.2
4.6
4.8
4.2
4.4
3.8
4.0
3.6S15 S24 F15 F24
Mean fiber wall thickness, µm +14 fractions
3rd stage1st stage
Figure 4.15. Fiber wall thicknesses development in TMP refining, error bars refer to confidence intervals (95%). S = slow-growth wood (1.49 mm/a) F = fast-growth wood (2.61 mm/a) 15= 1500 rpm, 24= 2400 rpm in the first refining stage. The second and third refining stages were performed at 1500 rpm for all pulps /86/.
Splitting of the fiber material was also determined.
High-speed refining (2400 rpm) produced more split fibers than normal speed refining
(1500 rpm), Figure 4.16. The two raw materials behaved similarly in this respect. The
effect of harsh and gentle refining was more obvious than that of the raw material.
However, when the split and unsplit fibers were compared as groups, the split group
consisted mainly of thinner walled material, Figure 4.17. This was due to the greater
tendency of those fibers to split.

KCL Communications 12
52
30
25
20
15
10
5
01.0 1.5 2.0 2.5 3.0 3.5
SEC tot, MWh/t
+14 fractionsSplit fibers, %
S15S24F15F24
Figure 4.16.Proportions of split fibers during a three-stage refining process. S = slow-growth wood (1.49 mm/a) F = fast-growth wood (2.61 mm/a) 15= 1500 rpm, 24= 2400 rpm in the first refining stage. The second and third refining stages were performed at 1500 rpm for all pulps /86/.
S= 1.49 mm/a F= 2.61 mm/a
Figure 4.17. Fiber wall thickness of split and intact fibers. Lighter shades are split fibers. Error bars refer to the confidence intervals ( 95%). Measurement carried out by STFI. /86/.
Based on these measurement results, what are the defibration effects for these two
rawmaterials. Formation of fines was different for slowly and fast grown raw materials,

KCL Communications 12
53
and from slowly grown raw material was generated fines with higher sedimentation
volume. It is natural to think that fibrillar fines are formed from fibrillated fibers and they
were shown to be mainly late wood fibers. Similar amounts of split fibers were formed
from both raw materials and the harshness of refining effected more than the character
of raw materials. However when long fibers of both raw material groups were divided
into split and intact fibers, split fibers consisted of thinner walled fibers. This result is in
accordance with the results of Reme and Kure /58, 61/.
4.3 How fiber wall structure is affected
The defibration pattern that accompanies more conformable fiber wall is discussed in this
chapter. The concept internal fibrillation has been widely used in mechanical pulp
characterization but it has been difficult to show or measure. Changes in fiber wall
structure are shown as increased fiber flexibility and increased pore volume.
4.3.1 Fiber flexibility/stiffness
Fiber stiffness distributions were used to examine the role of fiber wall internal structure
in mechanical pulping. Hydrodynamic stiffness distributions were determined for a low
energy, coarse mill TMP and a gently refined TMP. A coarse sample was obtained from
the plate gap experiments described in appendix 1b /82/, and the refined sample was a
mill TMP reject sample gently refined using a Wing refiner. Raw material and pulp
preparation are described in appendix 1.6 /87/. In the hydrodynamic measurements
fibers were deflected using a water flow. The stiffness distributions are given in Figure
4.18. Coarse TMP fibers had a wide distribution containing both coarse and flexible
fibers. In the case of refined TMP fibers the majority of fibers were flexible, although
there were also some stiff fibers. Table 4.4 shows average values, together with
confidence intervals, assuming the properties to be normally distributed. The average
stiffness of the refined fibers is approximately one-third of that of the coarse fibers.

KCL Communications 12
54
a) b)
Figure 4.18. Fiber stiffness distributions of coarse a) and refined b) TMP fibers measured for the McNett +14 fraction using the hydrodynamic stiffness method /87/.
Table 4.4. The hydrodynamic stiffness measurements, averages of 100 fibers from coarse and refined TMP, McNett +14 fraction.
Stiffness Measurement TMP Coarse TMP Refined
Flow rate, ml/s 0.89 ± 0.06 0.53 ± 0.05 Fiber width, µm 54 ± 2 47 ± 2 Stiffness, 10-12 Nm2 105 ± 20 37 ± 6
In order to distinguish the effect of cross-sectional dimensions and loosening of the fiber
wall, i.e. moment of inertia and elastic modulus, the cross-sectional dimensions of the
same fibers as used for flexibility measurements were measured using a CLSM
microscope. The tedious and time-consuming measurement procedure limited the
number of fibers measured, App. 2.3 and 2.6. The flow rate required to deflect the fibers
was used to distinguish between the dimensions and the deflecting force. The results are
given in Table 4.5 and Figure 4.19. The average flow rate for the coarse TMP sample was
0.91 ml/s (0.89 for 100 fibers) and that for the refined sample 0.50 ml/s, (0.53 for 100
fibers). The deflection results of this smaller group of fibers are well in line with the ones
measured for 100 fibers, Table 4.4.
CLSM measurements of cross-sectional dimensions show only minor differences between
coarse and refined TMP fibers. The wall thickness, the fiber width and the fiber wall
thickness of coarse and refined fibers were about the same. The average moment of
inertia of coarse TMP fibers was 18200 ± 2900 µm4 and that of refined TMP fibers 16941
± 4200 µm4, which means that they were statistically the same. Thus the differences in
the moment of inertia did not explain the flexibility differences between the samples.

KCL Communications 12
55
Table 4.5. Fiber properties and flow rate (deflection ability) of single fibers measured using CLSM: McNett +14 fractions of coarse and refined TMP pulps.
Fiber property TMP Coarse TMP Refined
Flow rate, ml/s 0.91 ± 0.06 0.50 ± 0.09 Wall thickness, µm 3.9 ± 0.3 4.1 ± 0.3 Cross-sectional area, µm2 351 ± 21 355 ± 31 Moment of inertia, µm4 18200 ± 2900 16900 ± 4200 Fiber width, µm 39 ± 2 39 ± 3 Fiber thickness, µm 21 ± 1 19 ± 2 Outer perimeter of fiber, µm 111 ± 5 106 ± 7 Number of measurements 73 28
a) b)
Figure 4.19. Fiber wall thickness (a), moment of inertia (b) as a function of flow rate measured for single fibers. square = coarse TMP fibers and asterisk = refined TMP fibers. Wall thickness and moment of inertia were determined from optical cross-sections with a CLSM and flow rate using the hydrodynamic stiffness measurement /87/.
The greater flexibility of refined fibers compared to coarse fibers seems to be due to the
delamination of the fiber wall structure rather than to the lower moment of inertia.
In this case the selected refining mode was very gentle, the aim being not to peel off the
fibers but to achieve loosening of the fiber wall. In normal industrial refining fiber wall
thickness is reduced and it is difficult to distinguish the fiber wall loosening effect from
the effects that cause reduction of fiber wall thickness. This increased fiber wall flexibility
means that the structural changes induced in the fiber wall should be detectable using
the proper techniques.
The role of moment of inertia was examined by analyzing earlywood and latewood fibers
of the population. Table 4.6 presents cross-sectional dimensions and stiffness values
calculated for these two different groups of fibers assuming a lumen perimeter to fiber

KCL Communications 12
56
perimeter ratio of less than 0.6. The moment of inertia of latewood fibers varied more
than that of earlywood fibers when coarse and refined samples were compared.
Table 4.6. Average properties of cross-sectional dimensions and deflection ability of earlywood and latewood fibers, McNett +14 fraction. Fibers were labeled as latewood if the ratio of lumen perimeter to fiber perimeter was less than 0.6.
TMP Coarse TMP Refined
Fiber property “Early” “Late” “Early” “Late”
Flow rate, ml/s 0.91± 0.07 0.88 ± 0.10 0.52 ± 0.09 0.44 ± 0.29 Wall thickness, µm 3.2 ± 0.9 5.9 ± 0.4 4.0 ± 0.3 4.4 ± 0.8 Cross-sectional area, µm2 336 ± 24 399 ± 39 371±36 301 ± 34 Moment of inertia, µm4 19600 ± 3500 14000 ± 3900 19800 ± 4600 6500 ± 3300 Fiber width, µm 32 ± 2 29 ± 1 40 ± 3 34 ± 10 Fiber thickness, µm 21 ± 1 19 ± 2 20 ± 2 14 ± 4 Outer perimeter of fiber, µm 117 ± 5 91 ± 4 110 ± 7 94 ± 20 Number of measurements 55 18 22 6
The flow rates indicate similar flexibilities for early- and latewood fibers, but between
refined and coarse fibers there is a clear difference, with refined fibers more flexible than
coarse fibers, as expected.
4.3.2 Changes of the fiber wall in separately refined early- and latewood fibers
The development of earlywood and latewood spruce fibers was examined during separate
refining of these fractions. The fibers were subjected to gentle refining by treating them
in a Wing laboratory refiner at 750 rpm, as described in App. 1.6. Earlywood and
latewood-rich TMP and GW fractions were obtained from mill rejects that had been
fractionated using a hydrocyclone. The fiber wall thicknesses of moist fibers were
measured using light microscopy as described in App. 2.2.
In all cases the gentle refining caused only a marginal reduction in fiber wall thickness.
The average fiber wall thicknesses of earlywood fibers were lower than those of latewood
fibers. TMP fibers had thinner walls than GW fibers, Figure 4.20.
Fiber stiffness was measured using the hydrodynamic method /68/, App. 2.3 Refining
resulted in a clear reduction in fiber stiffness for each pulp, Figure 4.21. Based on the
previous chapter, this was considered to be due to changes in the fiber wall structure.
Normal disk refining causes a reduction in fiber wall thickness, but in the Wing laboratory
refiner the refining action is gentler than that in a disk refiner because there are more
fiber-to-fiber contacts.

KCL Communications 12
57
10
8
6
4
2
0 TMP, early
TMP, early refined
TMP, late
TMP, late refined
GW
, earlyG
W, early refined
GW
, late G
W, late refined
Wal
l th
ickn
ess,
µm
Figure 4.20. Fiber wall thickness of TMP and GW earlywood and latewood fibers
experimentally refined using a Wing laboratory refiner /87/.
4
5
2
3
0
1
TMP, early
TMP, early refined
TMP, late
TMP, late refined
GW
, earlyG
W, early refined
GW
, late G
W, late refined
Ln (
Stiff
nes
s)
Figure 4.21. Stiffness of TMP and GW earlywood and latewood fibers experimentally
refined using a Wing laboratory refiner /87/.
Fiber development was also rated by classifying the fibers according to external
fibrillation as: non-fibrillated, fibrillated and split fibers, and by means of Simons’
staining, which provides an indication of the degree of internal fibrillation. Simons’ stain

KCL Communications 12
58
consists of direct blue and direct orange dyes. Direct blue has a known chemical
structure and molecular size and direct orange is a condensation product that is a
mixture of three components of different molecular sizes. If the micropores of the fiber
wall are small, the small molecular size blue dye can penetrate into the fibers but the
large molecular orange cannot /93/. Simons’ stain can be used to provide information
similar to that provided by the WRV or solute exclusion techniques but in a more
localized and qualitative manner. The methods are described in the App.2.4 and 2.5.
Table 4.7 shows how during refining the number of yellow fibers increased and the
number of blue fibers decreased for both early- and latewood fibers of TMP and GW.
Simons staining indicated that earlywood structure was affected more than latewood
structure.
Table 4.7. Development of internal and external fiber structure of earlywood and
latewood fibers during refining. Sample
TMP Earlywood
TMP Latewood
GW Earlywood
GW Latewood
SEC, MWh/t Unref. 4.1 Unref. 4.3 Unref. 3.0 Unref. 3.4Simons’ stain, % Blue 28 18 48 45 28 17 61 48 Greenish 29 25 24 20 28 37 20 28 Yellow 30 38 20 25 23 31 11 18 Colorless 13 19 9 10 21 15 8 6 Fibrillation, % Not-fibrillated 52 49 51 41 32 30 51 37 Fibrillated 29 32 38 53 32 32 34 57 Split 19 19 11 6 36 39 15 6
External fibrillation increased with both TMP and GW latewood pulps but was unchanged
in the case of the earlywood pulps. The number of split fibers was larger for the GW
pulps than TMP pulps, as found by Reme /58 p. 64/.
All these changes indicate that the structure of the fiber wall is deformed during Wing
refining; however, fiber dimensions are less affected during this gentle refining.
4.3.3 Pore volume of the fiber wall
Changes in the fiber wall structure were examined using several methods. Water
retention value (WRV) and fiber saturation point (FSP) were determined at Helsinki
University of Technology for the whole pulps of two raw material groups of different
growth rates (2.59 and 1.55 mm/a), App. 1.4. The slowly grown pulp samples (1.55
mm/a) were the same as those used by Maloney for thermoporosimetry measurements

KCL Communications 12
59
/72/, as referred to in Chapter 2, Figure 2.8. Both samples were two-stage refined, and
after screening with a 50% reject rate the long fibers were further refined up to nearly 5
MWh/t. The raw material and preparation of the pulps are described in the App. 1.4.
The results show clearly that water retention increased with refining, but very little
difference was seen between fast- and slow-growth trees in this case.
1.8
1.6
1.4
1.2
1.00 1 2 3 4 5 6
Main linerefining
Rejectrefining
Fast grown
Slow grown
WR
V (
bef
ore
dry
ing)
g/g
SEC, MWh/t
Figure 4.22 Water retention value (WRV) versus refining energy for samples of two growth rates (2.59 and 1.55 mm/a).
SEC Fast grown
SEC Slow grown
0 2 4SEC, MWh/t
6
1.0
0.9
0.8
0.7
0.6
0.5
FSP g
/g
Figure 4.23. Fiber saturation point (FSP) versus refining energy for samples of two
growth rates (2.59 and 1.55 mm/a).
WRV, Figure 4.22, showed the gap between mainline and reject refining, while in the FSP
measurement, Figure 4.23, the gap was not as distinct. In Maloney’s Figure 2.8 for
thermoporosimetry pore volume measurement the gap is not detectable for the long-
fiber fraction. This indicates that WRV measures the outer surface and FSP and

KCL Communications 12
60
thermoporosimetry the internal surface. Maloney has concluded that WRV gives higher
values for mechanical pulps than FSP.
Figure 4.24. Cumulative pore size distribution of four long-fiber pulp samples (14+
28 fraction) measured by thermoporosimetry. Slow = growth rate 1.17 mm/a, fast = growth rate 3.39 mm/a. Numbers in the legend refer to specific energy consumption (MWh/t).
The differences in pore volume between different raw materials were also tested using
thermoporosimetry and larger difference between the raw materials. Fast-growth (3.39
mm/a) and slow-growth (1.17 mm/a) raw materials were used, App. 1.2. The
thermoporosimetry results are given in Figure 4.24. The samples compared had energy
consumptions of 0.61-0.66 and 1.45-1.83 MWh/t. The pore volume value increased
slightly with increasing energy consumption, but no difference was detected between the
two raw materials.
4.3.4 Fiber wall swelling The methods used to measure fiber wall water content and pore volume give
quantitative figures for the fiber population as a whole but not for individual fibers.
However, in order to understand the behavior of different types of fibers it is necessary
to know which fibers swell and how they do it. Microscopic examination of fibers could
give additional information. The microscopic examinations are described in reference 88
and appendices 1.8.and 2.7. Fiber samples used are described in appendices 1.2 and
1.4.

KCL Communications 12
61
Highly refined fibers, App. 1.4, were used to examine areas where the outer wall layers
had been removed and areas where bands of these layers still remained. The techniques
used were Confocal laser scanning microscopy (CLSM) and light microscopy. Normal light
microscopy revealed swelling of fibers at points where the outer wall layers had been
peeled off, Figure 4.25.
Figure 4.25. Light micrographs of wet TMP fibers showing fiber wall swelling where the outer wall layers have been removed (->).
Figure 4.26. CLSM fluorescence image of a thick walled fiber showing the restrictive effect of outer wall layers on fiber wall conformability.
CLSM allows fibers to be examined in a fully hydrated state, and cross-sectional images
can be obtained without any embedding or mechanical sectioning techniques. The

KCL Communications 12
62
restrictive effect of outer wall layers is shown in Figure 4.2.6. Where ML/P/S1 layers has
started to peel off the fiber has become somewhat compressed, whereas where the outer
layer is is still intact the fiber cross-sections differ little in appearance from their original
shape in the wood. Cross-sections of the same fiber in wet and dry form /88/ are shown
in Figure 4.2.7. Swelling inwards is obvious where outer layers (M/P/S1) are present.
Figure 4.27. CLSM fluorescence images of fully hydrated and dried fibers illustrate
the effect of outer wall layers on fiber wall swelling,TMP 4,65 MWh/t. In order to get quantitative data of the phenomena of fiber swelling fibers from two
growth rate groups (1.17 and 3.39 mm/a) and energy consumptions of around 0.61-0.66
MWh/t and 1.45- 1.83 MWh/t were examined /App. 1.2/. Cross-sections of fibers were
examined at the points where outer wall layers had been removed first in a fully
hydrated state and then, after drying. Radial shrinkage of fibers on drying leads to the
collapse of pores, and it was anticipated that the differences between wet and dry cross-
sectional measurements could be correlated with loss of pore area on drying. Fiber wall
shrinkage is largely radial, so the lumen area will also decrease. However, in some thick-
walled fibers the lumen area actually increases on drying. This must be due to the fiber
wall swelling inwards and reducing the lumen area; on drying the opposite occurs and

KCL Communications 12
63
the wall shrinks back towards the outer wall, thus increasing the lumen area. In such
cases, if swelling does occur into the lumen, a large amount of shrinkage in cell wall
thickness should be accompanied by an increase in lumen area.
The results in Table 4.8 show little difference between the pulps in shrinkage of cell wall
area, which was approximately 55% for all pulps (or approximately 120% swelling,
assuming reversibility). Somewhat larger differences between pulps were seen in cell
wall thickness: the slow-growth pulp fibers refined at higher energy (1.17 mm/a, 1.83
MWh/t) show much more shrinkage in cell wall thickness, but in the fast-growth pulps
fibers it is the lower energy pulp (3.39 mm/a, 0.66 MWh/t) which show more shrinkage,
i.e. the opposite of what would be expected, Table 4.8. The greatest reduction in lumen
area occurs in the fast-growth, less refined pulp fibers. Although the number of
measurements is clearly not enough to show differences between the fibers, the results
give interesting qualitative information about the nature of swelling.
Table 4.8. Amount of shrinkage in cross-sectional dimensions of TMP fibers measured
from wet and dried fibers using CLSM /88/. Sample 1.17 mm/a
0.61 MWh/t 3.39 mm/a 0.66 MWh/t
1.17 mm/a 1.83 MWh/t
3.39 mm/a 1.45 MWh/t
No. of cross sections
16 43 50 29
CW area, % wet fiber
55.3±8.8 57.6±18.6 54.9±9.9 57.9±11.3
CW thickness, % wet fiber
80.0±11.4 73.6±21.0 72.5±11.6 80.2±13.8
Lumen area, % wet fiber
76.8±18.7 69.6±21.8 85.4±48.2 80.0±36.0
The measurements were made at those points where the S2 layer had been exposed.
The actual heterogeneity along the fiber length is much greater if the banded areas are
counted. The current information from the method illustrates the extent of swelling.
CLSM images confirm that swelling is local and occurs mainly when the outer wall layers
have been removed, where outer layers are retained fiber wall swells inwards.

KCL Communications 12
64
5. SUMMARIZING DISCUSSION
5.1 Relating defibration action with fiber properties
Different development of fiber properties was shown in previous chapters. Although
direct measurements of the defibration action are lacking the relation between
defibration action and fiber properties can be examined by combining the literature
results and fiber development results of this thesis. In the literature part it was
suggested that the volume fraction of fibers in the plate gap is a factor that connects the
fiber properties with the defibration action. This was included in the equation for intensity
(3), which suggested that under same refining conditions the refining intensity is greater
if the volume fraction of the fibers in the plate gap is reduced. The reaction of different
wood species to refining energy supported the idea /49, 51/, as did the compressibility
results of Salmén and Rudie /7,8,52/. When these pieces of information are combined,
the interpretation is that the cross-sectional dimensions of fibers influence their
compressibility and further on their interaction with the plate bars. The more
compressible the fibers are the larger the volume fraction of fibers is in the plate gap.
This means that thin walled fibers with large lumens end up to larger volume fractions in
the plate gap. Possible defibration actions are discussed together with defibration
patterns in chapters 5.3.1-5.3.3.
5.2 Important effects of defibration
Wood fibers are deformed during defibration and the defibration effects can be measured
as changes in fiber dimensions and fiber wall structure. The chemical properties of the
fiber surface and fines change as new fiber layers are exposed. Defibration actions, cyclic
loading and temperature have also effects on the state of wood polymers, but they are
masked by the morphological deformations. One example is polymer softening, which
makes the fibers tougher and leads to their separation with less fiber cutting. Methods
used in this study that are referred here are described in App. 2.
Fiber cutting is revealed by changes in fiber length distribution. Fiber cutting produces
short fibers and fiber fragments, which increase the size of the middle fraction rather
than the fines. Fiber cutting occurs mainly during the fiber separation stage. Significant
fiber cutting in the later refining stages indicates either disturbances in the process
equipment or instability in the refining conditions. In this study both an optical method,
Kajaani FS-200 (T271 om:98) and McNett classification (SCAN-M 6:69) were used to
measure fiber length distribution. The fiber cutting during the initial defibration was
shown by separating the undefibrated shives, classifying them using modified McNett

KCL Communications 12
65
classification and macerating them (preparing holocellulose) for fiber length distribution
measurements.
Splitting of the fiber wall A split in the fiber wall may be local or it may cleave the whole
fiber. Splitting mainly occurs in the fiber separation stage. However, there were also
indications that gently refined fibers started to split as fiber wall thickness diminished.
Splitting is measured either from cross-sections using SEM or direct through the fiber
preparation in transmitted light using light microscope. In this study is used a method in
which fibers are classified under a light microscope to a certain category according to
their appearance.
Peeling off of outer wall layers starts during the initial defibration. Peeled outer wall
layers end up in the fines fraction and can be recognized from the morphology of the
middle lamella or S1 layer and also from their chemical composition. Wall thickness can
be measured direct from the fibers in transmitted light using a light microscope, from
resin embedded cross-sections, or using CLSM. Light microscope and CLSM were used in
this study.
Remaining of outer wall layers on fibers as bands Micrographs of fiber fractions show
areas with the bands of outer wall layers still intact on the fibers and areas where outer
wall layers have been removed. Bands were distinguished even under a light microscope,
but the use of a CLSM showed the three-dimensional behavior of the fiber. The bands
prevent the fiber from collapsing. CLSM was used in this study.
External fibrillation of S2 layer follows peeling off of the outer layers. Measurement of
external fibrillation in this thesis is based on classification of fibers according to their
outer fibrillation under a light microscope.
Formation of fines The pieces of outer fiber layers and detached fibrils end up in the fines
fraction, which forms 30-40 w% of the whole fiber material. Fines are defined as fiber
particles passing through the 200 mesh wire in McNett fractionation. The size of the fines
fraction is measured using either a McNett fractionator or a Dynamic Drainage Jar (DDJ)
equipped with 200 mesh wire. The properties of fines are measured using a
semiautomatic image analysis method that classifies the particles into flakes, fibrils and
ray cells, or by measuring the sedimentation volume of fines. The chemical composition
indicates the origin of fines. In this study a semiautomatic measurement of fibril lengths
was also used.
Fiber wall delamination This defibration effect has long been a controversial subject. The
methods used to show delamination in this thesis include
• Combined use of flexibility and single fiber wall thickness

KCL Communications 12
66
• Simons’ staining • Local shrinkage and swelling using a CLSM • Pore volume using thermoporosimetry / 73/ • Fiber saturation point (TKK) • WRV (TKK)
All the above methods were used or at least tested in this thesis. The three last methods
were the ones just tested to be able to compare the samples with the literature. The
rates of swelling and shrinkage can be revealed even with light microscopy, but in the
two-dimensional image of a light microscope fiber collapse could resemble a swollen
fiber. Examination of fibers by confocal laser scanning microscopy revealed the three-
dimensional swelling.

KCL Communications 12
67
5.3 Discussion of defibration patterns Table 5.1. Defibration patterns, effects and methods to characterize the effects.
Defibration pattern
Defibration effects
Methods used in this study
Fiber shortening
Cutting of fibers during separation Splitting of fiber wall Formation of fines
Fiber length distribution ( FS-200) of macerated fibers made of shives Fiber length distribution using McNett classification Classification under light microscope McNett, DDJ
Fiber wall thickness reduction
Peeling off of outer wall layers Splitting of fiber wall Retention of outer layers as bands External fibrillation Formation of fines
Fiber wall thickness measurement from cross-sections, using CLSM Fiber wall thickness measurement in transmitted light using light microscope As described above Imaging under CLSM Classification under light microscope McNett, DDJ
Fiber wall structure delopment
Fiber wall delamination Peeling off of outer wall layers Splitting of fiber wall
Single fiber hydrodynamic flexibility and wall thickness under CLSM Simons’ staining Local shrinkage and swelling using a CLSM As described above As described above

KCL Communications 12
68
5.3.1 Fiber shortening as a defibration pattern
The importance of fiber separation conditions in terms of fiber shortening was shown by
experiments using undefiberized particles. Fiber shortening was the result of cutting of
fibers during the fiber separation stage. The coarse particles make reliable measurement
of fiber length difficult with normal measurement procedures and methods. The
procedure used consisted of separation and maceration of undefibrated particles and
length measurement of macerated fibers. The effect of initial defibration was studied
using refiners of three different sizes: a 24 inch pilot refiner, 42 inch pilot refiner and an
industrial 65 inch refiner. Fiber separation under pressurized conditions produced longer
fibers than fiber separation in atmospheric conditions. Higher temperature during fiber
separation softens the wood polymers and lets fibers to be separated with less force. Use
of lower refiner speed 1200 rpm resulted in more gentle fiber separation action than
1500 or 1900 rpm. Behind that phenomena is suggested to be the increased toughness
of the polymeric material due to the slower rate of deformation. In the industrial 65 inch
refiner the length of the fibers in the shives reduced gradually along the radius of the
plate segment, however the fiber length of the defibrated fibers remained at the same
level. This confirmed the earlier findings with pilot refiners; fiber cutting occurs during
fiber separation.
Morphologically different fibers seemed to have different tendencies to shorten. Fast-
grown and thinner-walled fibers were more resistant towards the harsh conditions
prevailing during fiber separation than thick-walled fibers. It was shown that fast-growth
wood with thin-walled fibers retained its fiber length better than slow-growth wood,
Figures 4.6 and 4.7. This could be explained by the higher compressibility of fibers with
large lumens and thinner walls. Earlywood fibers underwent more cyclic compression and
relaxation, assuming the conditions during refining were similar to those in the dynamic
loading of wood blocks /7, 52/. Faster warming up of the fiber wall as a result of
compression and relaxation softens the thin-walled fibers and they can be thus separated
without being cut. It can be also considered that compressible fiber material reacts to
impacts by becoming compressed and thus encounters fewer shear forces than thick-
walled incompressible fiber material. The equation 3 for intensity also supports this.
Literature sources give more support to this behavior: thick-walled pine fibers are more
sensitive towards the harshness of defibration /51/, and juvenile wood fibers have lower
tendency to shorten than mature wood fibers /5, 56/.
Between slow-growth and fast-growth wood on the one hand, and juvenile and mature
wood on the other, the amount of dry heartwood can also play a role. Shive particles
formed from fast-growth wood contained fibers that had an average length greater than

KCL Communications 12
69
the average fiber length in the wood. With slow-growth wood the opposite was the case.
This could be because the fast-growth young trees contain less heartwood and more
shives are formed from the outer parts of wood, which has longer fibers, Figure 4.7. The
low moisture content of heartwood could also be important reason for fiber length
reduction during fiber separation stage. When average fiber length is used to
characterize pulp, it also needs to be considered whether average fiber length has been
reduced by the cutting of long fibers or by an increase in the fines fraction.
5.3.2 Fiber wall thickness reduction as a defibration pattern
Fiber wall thickness was reduced during defibration. The gradual peeling off of layers
from the fiber surface was reflected in the diminishing lignin content of the fines fraction
as more fibrils were detached from the inner fiber layers, which had lower lignin content.
Different types of fibers seemed to produce different types of fines, too. The faster the
wood growth rate, the lower the sedimentation volume of fines, indicating a lower
content of fibrillar fines. The fibrils were formed mainly from thick-walled fibers, and 50-
100% of the fibrillated fibers originated from latewood. Refining with a Wing mill also
showed that thick-walled fibers became fibrillated during refining, whereas thin-walled
fibers were unaffected in this respect.
A fiber wall thickness reduction of 10-20% with a fiber wall density of 1.5 mg/mm3
corresponds to the formation of 10-20 w% of fines, but a typical fines content in
magazine paper TMP is around 35-40%. This means that only half of the fines fraction is
formed as a result of fiber wall peeling. The rest consisted of ray cells, pieces of fibers
and fiber wall formed as a result of fiber cutting or splitting.
The fines formed early during defibration typically have a flake-like shape; later, during
high-consistency refining, more fibril-like fines are formed. However, the fractionation of
fines into flake-like and fibril-like particles showed that flake-like fines were formed even
in the reject refining stage. By examining corresponding fiber fractions it was discovered
that external fibrillation was a typical defibration effect for thick-walled fibers and fiber
wall splitting a typical defibration effect for thin-walled fibers. This might be explained by
differences in fibril angle and in the thickness of the S2 layer. It is logical that flake-like
fines formed during later refining stages were formed from earlywood or juvenile wood
fibers. It was later discovered that bands of outer wall layers remained even on highly
refined fibers. The flake-like fines formed during later refining stages could partly be a
result of the detachment of these bands.
Long-fiber measurements showed that outer fibrillation of latewood fibers increased
during high-consistency refining, whereas that of earlywood fibers did not change. The

KCL Communications 12
70
earlywood fibers contained more split fibers, the number of which did not increase during
gentle refining in a Wing laboratory refiner. The pilot refining experiments showed an
increase in the number of split fibers during high-speed (2400 rpm) refining, but the
number of split fibers also increased during normal-speed refining (1500 rpm) as a
function of increasing energy consumption as fiber wall thickness diminished. Most of the
split fibers seem to be formed during fiber separation, but the increase in the number of
split fibers as fiber wall thickness diminished needs further discussion. It was
hypothesized in the previous chapter that the less compressible long fibers encounter
shear forces more frequently than the thinner-walled compressible fibers. On the other
hand, increasing exposure of the S2 wall with its parallel fibril structure means the fiber
wall is split more readily in the later refining stages, even as a result of compression. The
effect of fiber wall structure, in this case mainly fibril angle, remains to be determined.
5.3.3 Development of fiber wall structure as a defibration pattern
The defibration effects that develop fiber wall structure towards more open conformable
structure include:
peeling off of outer wall layers fiber wall delamination fiber wall splitting
As a result of these effects fiber wall elasticity decreases, fiber wall thickness reduces
and fiber flexibility and conformability increase.
Using gentle refining stiffness of fibers reduced and the differences in the fiber wall
thickness did not explain the differences between samples. It was concluded that during
gentle refining the fiber wall delamination had increased, Figure 4.19.
Fiber wall pore volume increased and local swelling of the fiber wall occurred during
refining. At those points where outer wall layers had been removed the S2 layer had
swollen outwards and the fibers were able to collapse. Where the outer wall layers were
present, uncollapsed state and swelling inwards was revealed using optical sectioning by
confocal laser scanning microscopy, Figures 4.2.6, 4.2.7, Table 4.8.
As a result of this inhomogeneity both fiber wall swelling and ability to collapse varied
along the fiber length. Removal of the restricting outer layers both decreased the fiber
elasticity and lowered the moment of inertia.
It remains to be determined how much this swelling is due to removal of the restrictive
forces imposed by the outer layers and how much to internal delamination of the fiber
wall. The pore volume measurements did show a slight increase with increasing refining

KCL Communications 12
71
energy, but the differences between different raw materials were negligible. However,
when the fibers were fractionated into thick-walled and thin-walled batches, Simons
staining indicated more fiber wall development for thin-walled than thick-walled fibers.

KCL Communications 12
72
6. CONCLUDING REMARKS
The objective was to determine the fundamental defibration effects and combine them
into defibration patterns characteristic of different fibers during mechanical defibration.
This was done by examining the changes in fiber dimensions and fiber structure.
Although the defibration patterns, effects and actions are interrelated, analyzing and
specifying them has improved our knowledge of this field.
1. The definitions presented offer concepts for communication between process
developers, model builders and material scientists. Such definitions are needed to
show the energy efficiency of the defibration actions and to compare different raw
materials or processes. The new information gained can be used to predict the
behavior of specific raw materials and can also be exploited in modeling work.
Controlling the compressibility of fibers by chemical modification was not included
in this thesis, but it could be an interesting topic for further study.
2. This thesis suggested a list of defibration actions. More investigations are needed
to be able to determine how the defibration effects presented here are related to
defibration actions.
3. A better and more detailed understanding of defibration will also help in
developing characterization methods more clearly for either research or process
control purposes. Among the methods to be developed for research purposes is
that for measuring the extent to which outer wall layers are peeled off. A better
measurement for characterizing fiber wall structure development is also needed.
A reliable method with which to compare the compressibility of fibers in the plate
gap is important for further development work. For better process control it could
be important to measure the number of fines particles or the coarseness of fines
direct from the pulp suspension. These measurements are related to the bonding
ability of the pulp, but at the same time constitute a sensitive feedback factor
reflecting changes in raw material or refining conditions.
4. The need to make best use of raw material is growing. Future products and
competition of raw material with e.g. bioenergy leads to a need to develop forest
stands with different properties. The raw material base will be broader and more
precise classification of raw material will become a common practice when more is
known about how each class should be refined to achieve property distributions
that meet the requirements of each product. Utilizing the whole potential of the
raw material also necessitates better criteria for raw material selection.

KCL Communications 12
73
List of papers This thesis is based on the following papers, which have been published as preprint proceedings papers or journal articles. The numbers follow the reference list numbers.
81. Heikkurinen, A., Vaarasalo, J., Karnis, A. Effect of initial defiberization on the properties of refiner mechanical pulp. J. Pulp and Pap. Sci. 19(1993):3, pp J119-J124.
82. Tienvieri, T., Härkönen, E., Heikkurinen, A., Särkilahti, A., Nuutila, O., Saharinen, E. Perusselvitys puumateriaalin kuidutusmekanismeista hierrejauhimessa. Kestävä paperi raportti no 9, 1995, 31p.
83. Heikkurinen, A., Lucander, M., Sirviö, J., Varhimo, A. Effect of spruce wood and fiber properties on pulp quality under varying defibration conditions. International mechanical pulping conference, Houston, 1999, pp 11-34.
84. Heikkurinen, A., Hattula, T. Mechanical pulp fines – characterization and implications for defibration mechanisms. International mechanical pulping conference, Oslo, 1993, pp 294-308.
86. Pöhler, T., Heikkurinen, A. Amount and character of splits in the fiber cell wall caused by disc refining. International mechanical pulping conference, Quebec, 2003, pp 417-423.
87. Lammi, T., Heikkurinen, A. Changes in fibre wall structure during the defibration. Eleventh fundamental research symposium, Cambridge, vol. 1, pp 641-662.
88. Moss, P., Heikkurinen, A. Swelling of Mechanical Pulp Fibre Walls Studied by CLSM, A poster presented in the International mechanical pulping conference, Quebec, 2003, pp 293-297.

KCL Communications 12
74
Authors contribution
81. Formulating the problem, planning the experiments, carrying out most of the measurements, concluding the results, 90%.
82. Planning the pulp and fiber testing and interpreting the results, 10%.
83. Setting the research problem, planning the experiments, concluding the results, 70%.
84. Formulating the problem, planning the experiments, developing methods, concluding the results, 95%.
86. Setting the research problem, supervising the work, 40%.
87. Formulating the research problem and hypothesis of the internal fibrillation. Supervising the research work, 50%.
88. Setting the research problem supervising the research work, concluding results, 50%.

KCL Communications 12
75
REFERENCES
1. Corson, S. R. Wood characteristics influence pine TMP quality. Tappi J. 74 (1991):11, pp 135-146.
2. Reme, P. A., Helle, T. On the difference in response to refining between Norway spruce and Scots pine. Pap. Puu 83(2001):1, 58 –6.1.
3. De Montmorency, W. The relationship of wood characteristics to mechanical pulping. Pulp Pap. Mag. Can. 66(1965):6,T325-348.
4. Miles, K., Karnis, A. The response of mechanical and chemical pulps to refining. Tappi Journal (1991):1, 157-164.
5. Mörseburg, K. Development and characterization of Norway spruce pressure groundwood pulp fiber. Dissertation, Laboratory of Pulping Technology, Faculty of Chemical Engineering, Åbo Akademi Unversity, Åbo 1999, 150 p.
6. Salmén, L., Fellers, C. The fundamentals of energy consumption during viscoelatic and plastic deformation of wood. Pulp Pap. Can. 83(1982):12, TR93-99.
7. Salmén, L. Dumail, J. F. Uhmeier, A. Compression behaviour of wood in relation to mechanical pulping. International mechanical pulping conference, Stockholm, 1997, pp 207-211.
8. Dumail, J. F., Salmén, L. Shear and compression behaviour of wood in relation to mechanical pulping. International mechanical pulping conference, Houston, 1999, pp 213-219.
9. Höglund, H., Sohlin, U. Tistad G. Physical properties of wood in relation to chip refining. Tappi 59(1976):6,144-147.
10. Härkönen, E., Routtu, S., Routtu, A., Johansson O. A theoretical model for a TMP refiner. International mechanical pulping conference. Stockholm. 1997, pp 95- 99.
11. Miles, K. B., May, W.D. The flow of pulp in in chip refiners. J. Pulp Pap. Sci 16(1990):2, J63-71.
12. Miles, K. B., May, W. Predicting the performance of a chip refiner - A constitutive approach. International mechanical pulping conference. Minneapolis, 1991, pp 295-301.
13. Senger, J., Oullet, D., Wild, P., Byrnes, P., Sabourin, M. A techniques to measure residence time in TMP refiners based on inherent process fluctuations. International mechanical pulping conference, Oslo, 2005, pp 19-25.
14. Berg, D., Karström, A. Dynamic pressure measurements in full scale thermomechancial pulp refiners. International mechanical pulping conference, Oslo, 2005, pp 42-49.
15. Backlund, H.–O., Höglund, H., Gradin, P. Study of tangential forces and temperature profiles in commercial refiners. International mechanical pulping conference, Quebec, 2003, pp 379-388.

KCL Communications 12
76
16. Eriksen, O. High frequency pressure measurements in the refining zone of a high consistency refiner. Dissertation, Norwegian University of Science and Technology, Department of Energy and Process Technology, 2003, 293p.
17. Page, D. The beating of chemical pulps – the action and the effects., Ninth Fundamental research symposium, Cambridge, 1989, vol. 1, pp 1-38.
18. Kerekes, R. Characterization of pulp refiners by a C-factor. Nord. Pulp Pap. Res. J. 5(1990):1, 3-8.
19. Lahti, T., Smolander H.( Ed.). Johdatus metsien perustuotantobiologiaan. Silva Carelica 16, University of Joensuu, 1990, 271 p.
20. Zimmermann, M., Brown C. Trees, Structure and function. Springer –Verlag, Berlin, Heidelberg, New York, 1971, 336 p.
21. Zimmermann, M. Xylem Structure and the ascent of sap. Springer Series in Wood Science. Berlin, Heidelberg, New York, Tokyo, 1983, 143 p.
22. llvessalo-Pfäffli, M.-S. Fiber Atlas, Identification of papermaking fibers. Springer- Verlag, Berlin Heidelberg New York 1995, 400 p.
23. Sirviö, J. Variation in Tracheid Properties of Norway Spruce. Dissertation, University of Helsinki Department of Forest Resource Management publications 25, Yliopistopaino, Helsinki. 2000, 35 p.
24. Sarén, M.-P., Serimaa, R., Andersson, S., Paakkari T., Saranpää, P., Pesonen, E. Structural variations of tracheids in Norway spruce ( Picea abies [L] Karst.). J. Struct. Biol. 136(2001):2, 101-109.
25. Lichtenegger H., Reiterer A., Tschegg S., Fratzl P. Variation of cellulose microfibril angles in softwoods and hardwoods - A possible strategy of mechanical optimization. J. Struct. Biol. 128(1999):3, 257-269.
26. Boutelje, J. Juvenile wood with particular reference to Norway spruce. Svensk Papperstid. 71(1968):17, 581-585.
27. Hägg, A. System för sortering och blandning av ved för att uppnå TMP-massa med bestämda egenskaper. The Swedish University of Agricultural sciences, department of Forest Products, Report no. 253, 1997,29 p.
28. Bergander, A. Local variability in chemical and physical properties of spruce wood fibers. Doctoral Thesis, Royal Institute of Technology, Department of Paper Chemistry and Technology, Division of Paper Technology, 2001, 70 p.
29. Fengel, D., Stoll, M. Uber die Veränedrungen des zell Querschnitts, der Dicke der Zellwand und der Wandschichten von Fictenholz Tracheiden innerhalb eines Jahrringes Holzforschung 27(1973):1, 1-7
30. Hakkila, P., Geographical variation of some properties of pine and spruce pulpwood in Finland. Communicationes instituti forestalis fenniae 66(1969):8, 59 p.
31. Timell, T. Compression wood in Gymnosperms, Vol 1.Springer –Verlag Berlin, Heidelberg, 1986, 706 p.
32. Stone, J.E., Scallan, A. M. A structural model for the cell wall of water swollen wood pulp fibres based on their accessibility to macromolecules. Cellulose Chem. Technol., 2(1968): 3, 358-343.

KCL Communications 12
77
33. Sell, J., Zimmermann, T. Radial fibril agglomerations of the S2 on transverse- fracture surfaces of tracheids of tension- loaded spruce and white fir. Holz als Roh und Werkstoff 51(1993):6, 384.
34. Fahlén, J., Salmén, L. The lamella structure of the wood fiber wall – Radial or concentric. Proceedings of the COST ACTION E20 Workshop, Interaction between cell wall components. Uppsala, Sweden 2001.25p.
35. Sundholm, J. (Ed.) Mechanical pulping. Fapet Oy, Helsinki, Finland (1999), 427 p.
36. Atack, D., Stationwala, M. I., Huusari, E., Ahlqvist, P., Fontebasso, J., Perkola, M. High speed photography of pulp flow patterns in a 5 MW pressurized refiner. Pap. Puu 71(1989):6, 689-695.
37. Ala-Hautala, T., Vattulainen J., Hernberg, R. Quantitative visualisation of pulp refining in a production line refiner, TAPPI International mechanical pulping conference, Houston, pp 1999, 87-95.
38. Härkönen, E., Huusari, E., Ravila, P. Residence time of fiber in a single disc refiner. International mechanical pulping conference, Houston, 1999, pp 77-86.
39. Vikman, K., Vuorio, P., Huhtanen, J.-P., Hahtokari, J. Residence time measurements for a mill scale high consistency CD refiner line. International mechanical pulping conference, Oslo, 2005, pp 26-37.
40. Senger, J., Ouellet, D. Factors affecting the shear forces in high consistency refining, International mechanical pulping conference, Helsinki, 2001, pp 531-545.
41. Illikainen, M., Härkönen, E., Ullmar, M., Niinimäki, J. Distribution of power dissipation in a TMP refiner plate gap. Pap. Puu 88(2006):5, 293-297.
42. Sundholm, J., Heikkurinen, A., Mannström, B. Role of rate of rotation and frequency in refiner mechanical pulping, Pap. Puu 70 (1988):5, 446-451.
43. Sundholm, J. Can we reduce energy consumption in mechanical pulping? International mechanical pulping conference, Oslo, 1993, pp 133-142.
44. Münster, H., Dahlqvist, G. Operating experience with the first commercial high peed single disc refiner TMP system at Perlen papier AG. International mechanical pulping conference, Ottawa, 1995, pp 197-202.
45. Härkönen, E., Tienvieri, T. Energy savings in TMP pulping. International mechanical pulping conference, Helsinki, 2001, pp. 547-556.
46. Härkönen, E., Heikkurinen, A., Nederström, R. Comparison between different species of softwood as TMP raw material. International mechanical pulping conference, Helsinki, 1989, pp 390-397.
47. Kärnä, A. Studies of pressurized grinding. Dissertation, Helsinki University of Technology, 1984, 88 p.
48. Miles, K., Karnis, A. Wood characteristics and energy consumption in refiner pulps. J. Pulp Pap. Sci. 21(1995):11, J383-J389.
49. Dickson, A.R., Corson S. R., Dooley, N. J.,Fiber collapse and decollapse determined by cross-sectional grometry. International mechanical pulping conference, Oslo, 2005, pp 198-201.

KCL Communications 12
78
50. Stationwala, M. I., Miles K. B., Karnis, A. The effect of first stage refining conditions on pulp properties and energy consumption. International mechanical pulping conference, Minneapolis, 1991, pp 321-327.
51. Miles, K., Omholt, I. Improving the strength properties of TMP. International mechanical pulping conference, Quebec, 2003, pp 179-186.
52. Rudie, A., Morra, J., Laurent, J., Hickey, K. The influence of wood and fiber properties on mechanical pulping. Tappi J. 77(1994):6, 86-90.
53. Koran Z. Energy consumption in mechanical fiber separation as a function of temperature. Pulp and Paper Canada transactions 7(1981):2, TR40-44.
54. Stationwala, M., Karnis, A. Pulp grinding a new method for producing mechanical pulp. Tappi J. 73(1990):12, 187-195.
55. Karnis, A. The mechanisms of fibre development in mechanical pulping. J. Pulp Pap. Sci. 20(1994):10, J280-J288.
56. Tyrväinen, J. The influence of wood properties on the quality of TMP made from Norway spruce (Picea Abies) - Wood from old growth forests, first thinnings and sawmill chips. International mechanical pulping conference, Ottawa, 1995, pp 23-34.
57. Höglund, H., Wilhelmsson, K. The product must determine the choice of wood type in mechanical pulping. International mechanical pulping conference, Oslo, 1993, pp 1-22.
58. Reme, P. A. Some effects of wood characteristics and the pulping process on mechanical pulp fibres. Doktor ingenioravhandling, Norwegian University of Science and Technology, 2000, 172 p.
59. Corson, S. R., Ekstam, E. Intensive refining of Radiata pine fibre. Pap. Puu 76(1994):5, 334-339.
60. Murton, K., Richardson, J., Corson, S., Duffy, G. TMP refining of Radiata pine earlywood and latewood fibres. International mechanical pulping conference, Helsinki, 2001, pp 361-371.
61. Kure, K. A. The alteration of the wood fibres in refining. International mechanical pulping conference, 1997, Stockholm, pp 137-150.
62. Brecht, W., Klemm, K. The mixture of structures in a mechanical pulp as a key to the knowledge of its technological properties, Pulp Pap. Mag. Can. 54(1953): 1, 72-80.
63. Giertz, H. Basic wood material properties and their significance in mechanical pulping. International mechanical pulping conference, Helsinki, 1977, vol I session 1, pp 1-15.
64. Corson, S., R., Aspects of mechanical pulp fiber separation and development in a disc refiner. International mechanical pulping conference. Helsinki, 1989, Book 2, pp 303-319.
65. Luukko, K., Kemppainen-Kajola, P., Paulapuro, H. Characterization of mechanical pulp fines by image analysis. Appita Journal 50(1997):5,387-392.

KCL Communications 12
79
66. Corson, S. R., Tree and fibre selection for optimal TMP quality. International Mechanical pulping conference, 1997, Stockholm, pp 231-240.
67. Hattula, T. Effect of heat and water on the ultrastructure of wood cellulose. Dissertation, University of Helsinki, Faculty of Science, 1985, 103 p.
68. Tam Doo, P., Kerekes, R. A method to measure wet fibre flexibility. Tappi J. 64(1981): 3, 107-112.
69. Tchepel, M., Provan, J., Nishida, A., Biggs, C. Procedure for measuring the flexibility of single wood-pulp fibers, International mechanical pulping conference 2001, Helsinki, pp 295-304.
70. Tchepel, M., Ouellet, D., McDonald, D., Provan, J., Skognes, G. The response of the long fiber fraction to different refining intensities. International mechanical pulping conference, Quebec, 2003, pp 425-436.
71. Stone, J. E., Scallan, A.M. The effect of component removal upon the porous structure of the cell wall of wood II. Swelling in water and the fiber saturation point. Tappi 50(1967):10, 496-501.
72. Berthold, J. Water adsorption and uptake in the fibre cell wall as affected by polar groups and structure. Doctoral Thesis, Royal Institute of Technology, Departmernt of Pulp and Paper Chemistry and Technology, 1996, 41 p.
73. Maloney, T. On the pore structure and dewatering properties of the pulp fiber cell wall. Dissertation, Helsinki University of Technology, Acta Polytechnica Scandinavia, Chemical Technology Series Ch 275, Espoo, 2000, 106 p.
74. Maloney, T., Paulapuro, H. Measurement of internal fibrillation in mechanical pulping. International mechanical pulping conference, Helsinki, 2001, vol. 2, pp 285-294.
75. Hamad, W., Provan, J. Microstructural cumulative material degradation and fatigue – failure micromechanisms in wood – pulp fibers. Cellulose (1995): 2, 159-177.
76. Fernando, D., Daniel, G. Micro-morphological observations on spruce TMP fibre fractions with emphasis on fibre cell wall fibrillation and splitting. Nord. Pulp Pap. Res. J. 19(2004):3, 278- 285.
77. Koljonen, K. Effect of surface properties of fibres on some paper properties of mechancial and chemcial pulp. Dissertation, Helsinki University of Technology, Laboratory of Forest Products Chemistry, Reports, Series A 19, 2004,79 p.
78. Hartman, R. Mechanical treatment of pulp fibers for paper property development. Transactions of the eigth Fundamental research symposium, Oxford, 1985, vol I, pp 413-442.
79. Kerekes, R. Characterizing refining action in PFI mills.,Tappi J., 4(2005):3, 9-13.
80. Steadman, R., Luner, P. The effect of wet fiber flexibility and its relationship to sheet properties, Ninth Fundamental research symposium, Cambridge, 1989, vol. 1, pp 67-104.

KCL Communications 12
80
81. Heikkurinen, A., Vaarasalo, J., Karnis, A. Effect of initial defiberization on the properties of refiner mechanical pulp. J. Pulp and Pap. Sci. 19(1993):3, pp J119-J124.
82. Tienvieri, T., Härkönen, E., Heikkurinen, A., Särkilahti, A., Nuutila, O., Saharinen, E. Perusselvitys puumateriaalin kuidutusmekanismeista hierrejauhimessa. Kestävä paperi raportti no 9, 1995, 31p.
83. Heikkurinen, A., Lucander, M., Sirviö, J., Varhimo, A. Effect of spruce wood and fiber properties on pulp quality under varying defibration conditions. International mechanical pulping conference, Houston, 1999, pp 11-34.
84. Heikkurinen, A., Hattula, T. Mechanical pulp fines – characterization and implications for defibration mechanisms. International mechanical pulping conference, Oslo, 1993, pp 294-308.
85. Kangas, H., Pöhler, T., Heikkurinen, A., Kleen, M. Development of mechanical pulp fibre surface as a function of refining energy. J. Pulp Pap. Sci 30 (2004):11, 298-305.
86. Pöhler, T., Heikkurinen, A. Amount and character of splits in the fiber cell wall caused by disc refining International mechanical pulping conference, Quebec, 2003, pp 417-423.
87. Lammi, T., Heikkurinen, A. Changes in fibre wall structure during the defibration. Eleventh Fundamental research symposium, Cambridge, vol. 1, pp 641-662.
88. Moss, P., Heikkurinen, A. Swelling of Mechanical Pulp Fibre Walls Studied by CLSM, A poster presented in the International mechanical pulping conference, Quebec, 2003, pp 293-297.
89. Lovel, E. Fibrous holocellulose from softwood. Industrial and engineering chemistry 37(1945):11, 1034-1037.
90. Tasman, J. The fiber length of Bauer-McNett screen fractions. Tappi 55(1972):1, 136-138.
91. Pelton, R., Jordan, B., Allen, L. Particle size distributions of fines in mechancial pulps and some aspects of their retention in papermaking. Tappi J. 68(1985):2, 91-94.
92. Lidbrandt, O., Mohlin, U.-B. Changes in fiber structure due to refining as revealed by SEM. International symposium on fundamental concepts of refining , The Institute of Paper Chemistry, Appleton, WI, 1980, pp 61- 74.
93. Yu, X., Minor, J., Atalla, R. Mechanism of action of Simon’s stain. Tappi J. 78(1995): 6, 175- 180.

KCL Communications 12
81
APPENDICES
App. 1. Preparation of pulp samples
App.1.1a. Importance of initial defibration for fiber length reduction experiments with 24 inch refiner
Importance of the initial defibration was examined by analyzing the size of undefibrated
particles and the fibers in those particles at low energy levels. Atmospheric and
pressurized refining and three rotational speeds 1200, 1500 and 1900 1/min were
compared. The raw material was Norway spruce (Picea abies) mill chips from central
Finland. A 24 inch (600mm) DDC- pilot refiner was used. Samples were collected at
energy levels of around 0.5, 1 and 1.5 MWh/t. The undefibrated particles present in the
pulp were separated after hot disintegration by screening with a 6 cut flat screen (slit
width 0.15 mm). The rejects were classified using McNett screen mesh sizes 8, 14, 28
and 48 and accepts using sizes 14, 28, 48, 200.
Table: 1a.1 PRMP –refining, combined reject and accept classification results. Speed 1/min 1900 1500 1200 SEC, MWh/t 1.58 1.06 0.54 1.58 1.14 0.59 1.54 - 0.47Rej. +8, % 0.06 0.5 9.6 0.2 0.6 16.1 4.2 37.5Rej. +14, % 0.20 1.0 10.4 0.6 1.2 10.0 3.4 11.7Acc. +14, % 10.0 18.9 23.2 16.1 22.5 23.4 22.6 15.0Rej. +28, % 0.07 0.2 1.4 0.3 0.3 0.9 0.4 0.8 Acc. +28, % 27.0 30.9 24.0 30.9 30.6 20.6 28.3 14.8Rej. +48, % 0.02 0.04 0.04 0.04 0.03 0.05 0.03 0.08Acc. +48-200, % 36.5 29.9 20.2 29.4 26.6 17.1 22.0 12.3Acc. -200, % 25.1 18.5 11.0 22.6 18.2 11.8 18.3 7.8 Table 1a.2 RMP –refining, combined reject and accept classification results. Speed 1/min 1900 1500 1200 SEC, MWh/t - 1.06 0.48 1.50 0.95 0.48 1.58 0.97 0.41Rej. +8, % 2.4 23.4 1.4 3.7 31.7 8.8 12.9 44.2Rej. +14, % 7.1 26.2 3.4 8.0 23.6 9.9 13.5 20.0Acc. +14, % 12.3 9.1 9.2 12.4 7.0 11.5 14.2 6.9 Rej. +28, % 1.4 3.8 0.8 1.3 2.3 1.0 1.3 1.3 Acc. +28, % 26.0 13.4 28.4 26.3 11.8 22.8 21.9 10.3Rej. +48, % 0.07 0.2 0.05 0.07 0.1 0.06 0.1 0.1 Acc. +48-200, % 32.1 16.0 36.3 30.3 15.0 23.6 22.2 11.8Acc. -200, % 18.6 7.8 20.5 17.8 8.4 22.3 13.8 5.3
The undefibrated particles were characterized by measuring and weighing 20 particles of
each fraction under standard humidity and temperature. Later on the results were
verified for the length and area of the particles using image analysis technique. The
lengths of fibers in the particles were determined by chemically pulping the fractions

KCL Communications 12
82
retained on 8 and 14 mesh screens to holocellulose, and measuring the fiber length
using optical fiber length analyzer ( Kajaani FS- 200). Two parallel measurements were
made. The method suggested by Lovel /89/ was used for holocellulose preparation. The
validity of the method was verified with a TMP sample. The fiber length distributions of
TMP sample before and after holocellulose peparation were the same. The weight
weighted average length of particles and fibers were calculated using the equation (1)
suggested by Tasman /90 / Coarsenesses were calculated similarly.
14R8R
14R14R8R8R
WWW*LW*L
L++
= (1)
Table 1a.3 Weight weighted lengths of shives and holocellulose fibers.
Refiner speed rpm
1900 PRMP
1500 PRMP
1200 PRMP
1900 RMP
1500 RMP
1200 RMP
SEC, MWh/t 0.54 0.59 0.47 0.48 0.48 0.41
Holocellulose of shives
Fiber length +8, mm
1.32 1.31 1.38 1.15 1.20 1.24
Fiber length +14
1.09 1.10 1.25 1.06 1.08 1.13
Weightw.av. L, mm
1.20 1.22 1.34 1.10 1.14 1.20
Shives
Length +8, mm
7.6 8.3 9.7 8.5 9.0 9.6
Length +14, mm
4.4 4.5 5.2 3.8 4.0 4.2
Weightw. av. L, mm
5.9 6.5 8.6 6.0 6.4 7.9
Table 1a.4 Weight weighted coarsenesses of shives.
Refiner speed rpm
1900 PRMP
1500 PRMP
1200 PRMP
1900 RMP
1500 RMP
1200 RMP
SEC, MWh/t 0.54 0.59 0.47 0.48 0.48 0.41
Coarseness, mg/m
8.6 7.2 10.3 16.2 14.1 24.0

KCL Communications 12
83
App.1.1b. Importance of initial defibration for fiber length reduction experiments with industrial refiner
A mill refiner SD 65 samples were analysed as a function of plate radius. Sampling was
done through the stator plate using sampling openings of 30 mm.
The undefibrated and defibrated fiber particles were separated using a vibrating flat
screen Serla equipped with a 0.25 mm slot screenplate.
Somerville shive content was used as a measure of undedibrated material
Table 1b.1 Analysis of undefibrated particles taken from the plate gap of an industrial
refiner. Plate radius, mm 400 536 607 669 736 797 825 Somerville, % - 46.5 52.3 39.2 22.9 6.4 2.4 McNett classification of shives, %
8 76.2 83.3 80.0 67.2 64.4 35.0 - 10 18.9 10.6 15.4 23.4 28.2 41.2 - 14 3.6 4.0 3.4 6.1 5.3 14.3 - 28 1.3 2.2 1.3 3.3 2.1 9.5 - Macerated fiber length FS 200, mm
2.5 2.4 2.4 2.3 2.0 1.7
Latewood fibers in shives, %
20 17 - 11 5 -
Table 1b.2 Analysis of fibers taken from the plate gap of an industrial refiner. Plate radius, mm 400 536 607 669 736 797 825 Fiber length*, mm - 1.77 1.74 1.78 1.78 1.68 1.69 McNett classification of fibers, %
+14 - 38 32.1 39.3 39.9 22.4 21.5 +28 31.2 34.6 32. 31.3 36.6 33.9 +48 13.3 13.7 14.4 11.2 18.5 17.8 +200 12.2 12.2 11.3 10.8 17.1 19.0 -200 5.3 7.4 2.9 6.8 5.4 7.8 Latewood fibers, % 27 26 27 23 21 18 Simons’ stain.,Yellow fibers, %
12 6 14 10 16 26
* Fiber length calculated as weight weighted average using formula 1 and assuming fiber lengths +14 2mm and 14/28 1.5 mm
1,774566474 1,74063 1,775596 1,780197 1,689831 1,694043

KCL Communications 12
84
App.1.2. Effect of wood fiber properties on fiber length reduction during mechanical pulping experiments with 42 inch refiner
Three Norway spruce (Picea abies) stands were selected according to their average age
and mean breast-height diameter in order to obtain differences to their growth rate and
thus also in average fiber properties. The principle of selection is shown in Fig. 1.2.1.
3 1 2 4
Proportion of trees
Growth rate Figure 1. 2.1 Three wood stands of different growth rates were used to form four raw
material groups of different cross-sectional properties.
One of the stands was further divided into two sample groups: the slowest growth trees
(no. 1) and the fastest growth trees (no. 2). From the stand having the lowest average
growth rate the slowest growth trees were selected as a sample group (no. 3), and from
the fastest growth stand the fastest growth trees (no. 4). Each of these four sample
groups consisted of at least 100 trees. The trees to be cut for this study were randomly
selected to yield at least a ton (dry weight) of wood per group. For details of the trees
see Table 1.2.1. Several sample discs from randomly selected sample trees from each
group were taken at regular intervals along the stem for wood and fiber analysis. All the
sample trees were cut into 3 m logs, debarked and chipped, except those few logs used
for groundwood studies. Mill chips were used as reference (no. 5).
Table 1.2.1. Basic properties of the sampled trees in raw material series 1. Diameters are with bark (DBH = at breast height, D = at midpoint).
Trees Logs Group DBH, cm Height, m Age1.3, a Count D, cm Count 1 15 16 52 26 13 91 2 24 21 55 11 19 61 3 21 20 90 12 17 59 4 19 16 28 18 16 67

KCL Communications 12
85
Table 1.2.1. Wood fiber characteristics of the different growth rate raw material. Group 4 1 2 3 Growth rate mm/a
3.39 2.18 1.44 1.17
Basic density, kg/m3
345 380 398 399
Fiber coarseness, mg/m
0.18 0.22 0.19 0.24
Fiber length, mm
2.3 2.8 2.5 3.2
Fiber wall thickness, µm
5.6 5.6 5.3 5.3
Age, years 28 55 52 90
TMP was prepared using a RGP 42 refiner with coarse plate pattern, bar/groove width
4/3.8 mm and height 3 mm. The pressure was 300 kPa in the first stage and 150 kPa in
the subsequent stages. The intensity of defibration was changed using two rotational
speeds in the first refining stage as follows:
Low-speed treatment 1500 rpm in the first refining stage, followed by 1500 rpm in
the subsequent stages
High-speed treatment 2400 rpm in the first refining stage, followed by 1500 rpm in
the subsequent stages
PGW was prepared from raw material lots 3, (1.17 mm/a) and 4 (3.39 mm/a) at KCL
pilot PGW station. PGW 105C conditions and pulp stone Norton 38A601, which is typically
used for newsprint grinding were used. Grinding pressure was 250 kPa and peripheral
speed 20 m/s.
Pulp separation by TAP03 screen was carried out in oder to analyze fiber length of the
undefibrated fraction.
A two stage TAP 03 screening with slot width 0.15 mm and 200 1/min was used to
separate undefibrated rejects from defibrated fibers. The reject of the first step was
rescreened and accepts were combined. The reject was the reject of the second
screening step.
Length distributions of particles were determined by McNett –fractionation.
Reject fractionation 10, 14, 28, 48 mesh

KCL Communications 12
86
Accept fractionation 14, 28, 48, 200 mesh
The longest fractions of rejects +10 and + 14 were combined and fiber length was
determined after maceration.
Table 1.2.2. Fractionation result of combined rejects and accepts after initial defibration.
Fractionation was carried out using TAP screening and McNett fractionation using mesh sizes +10, 10 /14, 14/28 and 28/48.
Growth rate, mm/a
1.17 3.39 1.44 2.18
Refiner speed, 1/min
1500 2400 1500 2400 1500 2400 1500 2400
SEC, MWh/t
0.608 0.372 0.663 0.495 0.534 0.266 0.763 0.313
+14 % 42.6 43.1 31.5 18.4 - 44.0 39.6 43.8 14/28,% 24.9 24.8 32.2 28.1 - 26.2 30.1 30.2 28/48,% 11.6 13.5 13.8 19.9 - 12.7 12.0 13.7

KCL Communications 12
87
Figure 1.2. 2 Fiber length distributions of macerated reject fractions ( shives) show decreasing fines content with increasing energy.

KCL Communications 12
88
App.1.3. Fiber cross-sectional dimensions are affected through gradual peeling off of material, a study with laboratory refiner
Prepration of refiner samples for the fines study.
The first refining stage was carried out in a 42 inch pressurized pilot refiner and the next
stages using a 12 inch atmospheric laboratory refiner. After first refining stage pulp was
diluted and drained in a 200 mesh wire- bottom bin and after next refining stages diluted
pulp was run through a rotating 200 mesh screen drum (Attis- filter). The fines
suspensions were allowed to settle for two days, after which the sediment was
sentrifuged to a smaller volume and frozen. Klason lignin contents and particle lengths
were measured.
Table 1.3.1 Refining conditions. Refining stage 0 1 2 3 4 5 SEC / stage, MWh/t 0.57 1.14 1.33 1.24 0.38 0.61SEC total, MWh/t 1.71 3.04 4.28 4.66 5.27Infeed cons. % 34.3 30.5 26.5 21.0 23.3 20.2CSF, ml 725 197 81 19 27 36 Fines formed / stage, % 13 10.4 6.2 14.0 - 11.0Fines total, % 13 23.4 29.6 43.6 - 54.6 Table 1.3.2 Fines separation. Ref. Stage 0 1 2 3 4 5 Sample, g 1893 1612 1299 853 583 363 McNett % +14 31.8 - 0.9 0.1 - 0.2 +28 31.2 - 28.0 5.3 - 6.6 +48 12.1 - 24.4 19.4 - 23.2 +200 10.2 - 27.4 44.1 - 40.0 -200 14.7 - 19.3 31.1 - 30.0 Fines after separation,%
10.5 12.8 16.2 26.4 23.0 21.1
Fines separated, g
74 131 59 44 27 12

KCL Communications 12
89
App.1.4. Fiber cross-sectional dimensions are affected through gradual peeling off of material, pilot study with RGP 42
Slow growth sample of growth rate 1.59 mm/a, and basic density of409 kg/m3 was used.
Other characteristics were: wood fiber length 2.9 mm, Coarseness 0.25 mg/m and wall thickness 5.9 µm. In fiber wall structure studies chapters 4.3.3 and 4.3.4 also a slow growth sample of similar fiber length but faster growth rate of 2.59 was used / 83/.
Refining was carried out at two stages using the 1500 rpm rotational speed in the refiner. The pulp was screened and the reject of about 50% was further refined at two refining stages. In the second reject refining stage two different rotational speeds, 1500 and 2400 rpm were used. The intensity increase was in these series first in the very final stage of fibre development. Plate pattern B1 was used, the bar width at outer rim was 1.5 and groove width 2.0 mm, groove depth was 3 mm.
SD 1500 SD 1500
1.55 MWh/t 2.44 MWh/t
SD 1500 SD 1500
3.94 MWh/t 4.44, 4.65, 4.88 MWh/t
530 535 534 533
Reject
Figure 1.4.2. Scheme of the mainline refining, screening and reject refining.

KCL Communications 12
90
Table 1.4.2. Refining conditions in mainline refining. Growth rate, mm/a
1.15 1.15
Refining stage 1 2 Preheating Pressure kPa
120 423
Refiner Pressure, kPa
300 300
Production rate kg/h
629 726
Spec. energy cons. MWh/t
1.55 2.19
CSF, ml 340 122 Dry solids cont. %
31.1 33.3
Table 1.4.3. Refining conditions in reject refining. Sample
530
533/534/535
536/538/539
Refining stage 1 2 2 Rotational speed, Rpm
1500 1500 2400
Refiner pressure 150 150 150 Production rate 468 680 676 Spec. energy Cons., MWh/t
1,50 - -
CSF, ml 100 37/50/60 53/60/72 Dsc, % 34.5 38.8/36.3/34.4 39.9/32.0/30.7

KCL Communications 12
91
App.1.5. Effect of wood fiber properties on fiber wall thickness Table 1.5.1 Properties of wood and macerated wood fibers. Age of stands, a Slowly grown wood, S
55-60 Fast grown wood, F 35-40
Mean diameter of cut stems, mm 12 15 Basic density kg/m3 398 360 Mean growth ring width, mm 1.49 2.61 Dry solids content, % 46.7 47.5 Macerated wood fibers Latewood content, % 32 28 Fiber length, mm 2.88 2.52 Mean fiber wall thickness, µm 6.4± 0.3 6.2±0.2
Coarseness, mg/ m 0.24 0.20
Figure 1.5.1. Fiber wall thickness distributions for the two wood raw materials (S, slow growth rate 1.49 and F, fast growth rate 2.61 mm/a) were quite different even if the mean fiber wall thickness was similar .
Table 1.5.2. Refining conditions.
S 15 Slowly grown wood, 1500 rpm at each of the three refining stages (referred as “normal” intensity)
S 24 Slowly grown wood, 2400 rpm at the first refining stage, 1500 rpm in the following two stages (referred as “high” intensity)
F 15 Fast grown wood, 1500 rpm at each of the three refining stages (referred as “normal” intensity)
F 24 Fast grown wood, 2400 rpm at the first refining stage, 1500 rpm in the following two stages (referred as “high” intensity)

KCL Communications 12
92
Figure 1.5.2. Higher refining intensity (rotation speed) at first stage decreased the specific energy consumption (SEC) at constant freeness level. The fast grown wood F needed more energy to reach certain freeness levels compared to the slowly grown wood S.
App.1.6. Internal structure of fiber wall is affected by mechanical pulping
In order to examine the internal structural changes of fibers the stiffness distributions of
a coarse and a gently refined TMP long fiber fraction were determined. Coarse TMP
sample was taken before the refining zone straight from the plate gap of a mill refiner.
Refined TMP sample was a mill reject sample that was refined using a Wing defibrator,
which is a low intensity experimental refiner. Before refining pulp was pre-steamed at
140°C. After steaming, the consistency of the pulp was 40%. The refining itself was
unpressurized; the speed of the wing was 750 rpm and the specific energy consumption
4.2 MWh/t.
App.1.7. Develoment of early- and latewood fibers in mechanical pulping
Earlywood and latewood rich TMP and GW samples were obtained from mill rejects by
fractionating using a laboratory size hydrocyclone. The earlywood and latewood rich
samples were refined in a Wing laboratory refiner using the same conditions as for
0 100 200 300 400 500 600
3.5
3.0
2.5
2.0
1.5
1.0
S15S24F15 F24
CSF, ml
SEC,MWh/t

KCL Communications 12
93
refined TMP pulp, Appendix 1.6. The raw material of all mechanical pulps were spruce
Picea abies.
App.1.8. Changes in fiber wall pore volume and swelling Fiber wall swelling was investigated by measuring wet and dried cross-sectional dimensions using the Leica CLSM in the Laboratory of Paper Technology at Helsinki University of Technology. The microscopic procedure is described in the appendix 2.7. Samples described in the Appendix 1.2 were used.

KCL Communications 12
94
App.2. Methods used
2.1 Sampling and maceration of chips
The sampling of chips was done carefully by collecting chip samples from refiner feed
during the whole TMP run. A sub sample from the chip sample was taken by spreading
the whole sample on a table and dividing it into smaller squares, combing two of the
squares and repeating the same several times. Selected pieces of chips were chopped to
match stick size pieces which were macerated. Maceration of wood fibers was carried out
using a mixture of glacial acetic acid and hydrogen peroxide (1:1 (vol.), 60°C, 24 h).
2.2 Wall thickness using direct light microscopy technique
Fibre wall thickness of wet fibres was measured using light microscopy and image
analysis. Images were taken in transmitted light from the kind of fibre network usually
employed in fibre analysis. The fibres were stained with Graff’s stain (1% water
solution). The wall thickness was calculated as a difference of the fibre width and lumen
width. Fiber and lumen width were manually pointed on the representative area of the
fibre. Both edges of the fibre and lumen were focused separately. The objective used
was 20x and the pixel size 0.4 µm. Totally 200 fibres were measured in this manner
excluding splitted fibres, ribbons and shives. The technique requires that the local
measurement is representative i.e. the method is most suitable for TMP fibres which
have rather intact fibre walls. In this work to this kind of measurement conditions is
referred as direct light microscopy technique.
2.3 Fiber stiffness
Stiffness of single fibers was measured using the Tam Doo Kerekes method /68 /. In this
method single fibers are bent using water flow. A fiber is placed under water on the
notch of a capillary and water flow through the capillary is increased to bend the fiber to
a given mark.
Stiffness was determined from 100 McNett +14 fraction fibers of each pulp. In order to
examine the relationship between fiber stiffness and cross-sectional fiber shape, also the
cross- sectional properties were determined using CLSM from a number of same single
fibers as the stiffness. First the flow rate was measured using the stiffness measurement,

KCL Communications 12
95
and then optical cross-sections were taken from the same fiber. A smaller number of
fibers were used for these cross-sectional measurements with CLSM.
2.4 Fiber wall damages
A simple light microscopic classification method was used to characterize the fiber wall
damages. The long fiber fraction (+14 and/or 14/28) is stained with Sirius Red stain.
Wet, stained fibers were examined on a microscopy glass slide using bright field
transmitted light illumination. Each fiber is classified once to a certain category according
to its appearance. Character of fiber ends was excluded but otherwise the whole fiber
length was examined. Minimum of 600 fibers were processed and classified. The
categories were:
1) Intact
2) Slightly fibrillated
3) Fibrillated
4) Split fiber wall
With mechanical pulps the first category is normally quite small (< 5 %) and thus it may
be combined with the second category if wanted.
In this method can also be determined whether the fiber under examination belongs to
the earlywood or latewood. Altogether, with this method the extent of external
fibrillation, proportion of split fibers and the earlywood/latewood ratio can be
determined. The results of this method are well in line with the cross-sectional method
/86/. A negative feature of this measurement is the subjectivity. The samples in a test
series should be analysed in a row and by the same person. The positive feature of this
measurement is that it is fairly simple and fast (=cheap) compared to other methods.
2.5 Simons staining
Loosening of fibre structure was examined using Simons stain. Simons stain has two
component (Pontamine Fast Orange 6RN and Pontamine Sky Blue) of which only large
molecules (over 5 nm) of orange dye is shown to be active /93/. Simons stain was used
as 1% water solution containing Pontamine Fast Orange 6RN and Pontamine Sky Blue in
ratio of 1:1. The fibres and the stain was put in the beaker placed in the water bath,
75°C and 15 minutes. After that the beaker was taken out from the bath and cooled

KCL Communications 12
96
other 15 minutes in room temperature. The excess stain was washed a way using a
laboratory screen and the stained fibres were placed onto the glass slide the embedding
medium being water. The stained fibres were examined immediately under the light
microscope in transmitted light using an objective of 10x with blue filter. Totally 600
fibres were classified according to their colour. The staining is not permanent and
therefore the fibres need to be stained again if not examined during the same day.
2.6 Cross-sectional fibre dimensions using CLSM Optical cross-sectional images were taken with CLSM (Leica CLSM-Diaplan) using
fluorescence mode and the wave length 488 nm. From dried fibres optical cross-sections
were taken using oil objectives 100x and 40x and from wet fibres using dry objective
40x. The pixel size with 40x objective was 0.24 µm/pixel and with 100x 0.1 µm/pixel.
The image format was 512 • 512 pixels/image. Fibres were stained using fluorescence
dye (acridine orange, 0.0001% water solution) for the confocal laser scanning
microscopy. Excess stain was washed a way using a laboratory screen. Water was
removed from the fibres using freeze-drying and dried fibres were embedded in resin
(Permount). When optical cross-sections of wet fibres were taken fibre was just
embedded in water and paper stripes were used to prevent the cover slip to press the
fibre.
In the measurement, the fibre was first focused in transmitted light and aligned manually
into the vertical position. Next the fibre was scanned in fluorescence mode first in xy-
plane and then the optical cross-sections were taken in xz-plane. Every line of the final
image was taken as an average of 32 lines (oil-objective in use) or 8 lines (dry-objective
in use). Ten cross-sections were taken from the middle of each fibre, the distance of
each cross-sections being about 100 µm and the total length viewed 1 mm. Cross-
sections where taken from the places where the cross-section formed a ring.
The calculation of the moment of inertia was based on the two assumption: 1) in the
hydrodynamic measurement the fibre deflected seeks its way to the position where its
moment of inertia is in minimum and 2) the fibre shape under the deflection is the same
as in the measurement of cross-sectional dimensions using CLSM. From each cross-
section minimum moment of inertia was calculated assuming the shape of the fibre to be
between circle and ellipse according to the formula:
( ) ( )[ ]33
161
I LTLWFTFW −−−⋅= (2)
where I, moment of inertia of individual cross-sections, µm4
FW, fibre width, µm
KCL Communications 12
97
FT, fibre thickness, µm
LW, lumen width, µm
LT, lumen thickness, µm
As seen from formula (2) the moment of inertia is highly dependent on the fibre
thickness. The moment of individual fibre was given as an average of individual
moments. Thus the fibre width and fibre thickness of individual cross-sections
perpendicular to each other was measured manually in those positions where the
moment of inertia was the lowest. The other fibre dimensions as wall thickness, cross-
sectional area, lumen area, wall thickness and fibre perimeter were determined using
image analysis.
2.7 Measurement of fiber swelling
Never dried fibers were stained using acridine orange and mounted in distilled water.
Samples were first examined in the wet state using a x40/0.8 water immersion
objective. A series of images were collected in the normal xy-plane, for surface images,
and then a series of images were was collected in the xz- plane at intervals of 5 or 10
µm along the length of the fiber. The microscope slide was then left to dry for a few
days. After drying the fibers were immersed in oil by pipetting oil along the edge of the
glass cover slip and allowing it to soak into the fibers. The same fibers that had been
examined while wet were located and images were collected using a x40/1.25 oil
immersion objective.
Image analysis of the same fibers wet and dry were measured using analySIS®
software. Measurements were made of wall area, lumen area, fiber and lumen
perimeters, maximum and minimum diameters and fiber wall thickness. Differences
between wet and dry fiber measurements were then calculated. The difference is
presented as a percentage of the of the original wet size, 100(d/w) where d is a dry
dimension and w is a wet dimension. The loss of water is assumed to represent the
amount of swelling that had occurred in the wet fibers.
2.8 Thermoporosimetry Pore size distribution measurements were made by the Labvoratory of Paper Technology
in the Helsinki University of Technology by using differential scanning calorimetry ( DSC)
following the method described by Maloney / 73, 74/. Two measurements were made for
each of the four pulp samples and the mean values were plotted.
Top Related