


Languages
Pages
Legal


"Sine Sweep Vibration Testing for Modal Response Primer” Eric Sauther
Department of Optical Sciences, University of Arizona Opto-Mechanical Engineering; OPTI 521 Opto-
mechanical Enginering Fall 2013; Meinel Optical Science building 1630 E University Blvd
Tucson, AZ 85721AZ USA
ABSTRACT
It is important to have an introductory understanding of vibration testing, and applied techniques in order to
verify (and provide empirical proof) that the design will respond as specified under the customer
requirements. While FEA analysis may show an assembly's modeled performance, it is necessary and
required (by the customer) that test evidence be provided to verify the modeled assembly will perform as
expected under real world conditions. The Sine Sweep vibration test is one portion of assembly
performance verification under controlled conditions, and is used for structural dynamics characterization,
durability, and fatigue testing. Basic theory as a lead in, test setup, and representative results shall be
discussed.
Keywords: Sine Sweep, Vibration, Model Analysis
1 INTRODUCTION
1.1 Sine Sweep Test
In the Environmental Stress Screen (ESS) vibration domain there are different types of tests that
products can be exposed to contingent on what requirement is needed to characterize product performance.
Major ESS vibe categories include Random, Shock, and Sine testing with various subcategories with in
each test. Vibration testing is for fulfilling customer imposed requirements under the Validation Phase of
the product’s operations, or under Product Transportation conditions.
One sub-category is Sinusoidal Sweep method. This test allows for higher RMS input loads and
oftentimes leads to much cleaner modal responses Sinusoidal sweep process is also used to provide
symmetric excitations to emphasize symmetric modes.[1]
Instead of evaluating the dynamic properties of a structure from free vibration test data, a forced
vibration test is performed using sinusoidal (harmonic) loading over a range of frequencies.
The concept is to excite the structure with harmonic loading such that at certain frequencies the structure
experiences resonance. Under normal circumstances the customer will provide Sine Sweep requirements
criteria relative to the environment the product will see.
1.2 Modal Analysis
Modal Analysis can be defined as analytical determination modes of vibration for a linear multiple
degree-of-freedom system. These modal properties include mode shapes, resonant frequencies, modal
damping, modal mass, and participation factors (a measure of the sensitivity of a mode to excitation from
any particular direction). These parameters can be measured experimentally on a shake table or by field
vibration tests. They can also be computed using finite element analysis software.[3]
1.3 Sinusoidal Sweep description
Sinusoidal Sweep testing can accomplish certain specific tasks. One of example of this is the
model response of a Part or Product Assembly. Determining amplitude relationships at the natural
frequencies on a structure permits modal modeling. The modal models provides valuable information
regarding system integrity in mode responses. For Sinusoidal Sweep, the product under test is isolated to
test one axis (normally X Axis) which has a single degree of freedom (SDOF) for its test. However, the
response from the input could show in all axis.

Ideally the frequency range and time duration of a Sine Sweep input has been pre-determined to
predicted the lifetime of a products usage. The parameters needed for a Sine Sweep input are, Start/Stop
Frequencies (f1, and f2), Time duration of the input sweep (t), and level (or Gs) of the input which can be
approximated. While stated generically in this paper, this sweep needs to be done for all three axis of the
product tested.
Sine Sweep rates can be modified for all or a portion of the frequency range. This is of particular
interest if a designer is concerned about the duration about a resonance frequency.
The Modal Response of a Sine Sweep input is derived from a Single Degree of Freedom (SDOF)
system subjected to a Harmonic Excitation.
Below consider a SDOF system with damping. The relationship is as follows:
A Damped harmonic isolator is described as:
Where , z is a relative displacement functional relationship of change in position for the
spring and damping components, and is the damping ratio.
From here the designer can take the Laplace transform and find the Displacement, Velocity, and
Acceleration components for a Harmonic Sine input into a system.
For Sine Sweep, ramping through a range of frequencies is required in order to define resonance.
The sweep rate can vary, but the simplest input is linear. So in a basic relationship above a designer may
build the customers input parameters insert into the vibration system for a Sine Sweep input. This can be
performed by structural analyst at critical interfaces to monitor, but are only controller inputs for the tester
to input into the Vibration table software.
Table 1 Sine Sweep Rate Parameters
Linear Sine Sweep input Y(t)=Sin{2
}}
Sweep Rate in terms of Octaves
Number of Octaves (cycles) in the Frequency Range
to be swept

1-1 Three Sine Sweep general input types exist Linear Sweep (Top) is most common
The Base ASD is expressed as the squared of the Acceleration (Grms) over a Bandwidth where the
frequencies are the range determined by the input Sine Sweep.
1-2 Typical ASD input Plot for Sine Sweep
The ASD plot above can be an expressed requirement with a related input table. This is either directly an
input from the customer, Industry Standard, or stated through a Military, NAVMAT Standard (USA only).

Base Motion acting as input to Product and fixture
Transmissibility
The Peak Transmissibility is approx equal to Q for an input frequency equal to
Figure 1-3 Excitation due to a Sine Sweep input
A Sine test definition consists of entering a set of input variables, consisting of acceleration,
velocity and displacement amplitudes and their associated frequencies, plus slope segments. The software
automatically calculates crossover frequencies or ASD amplitudes when slopes used.
The maximum peak values for acceleration and velocity and the maximum peak-peak displacement for the
test are automatically displayed. If the tests dynamic demands exceed the shaker system’s limits, the
software automatically warns the operator and aborts test depending on the response amplitude.
At a reference point, the Sine input the product will see a maximum G level at resonance. As the
test approaches the Resonance frequency, the tester can set the G level (normally with a margin of safety)
and “dwell” around that Frequency band of interest. At resonance, vibration levels applied are amplified
by the Amplification Factor (aka Quality Factor) Q. Where Q can be described in relation to the Damping
Coefficient as Q=1/2CR Where CR=
can be defined as the critical Damping, is the System Damping,

and is the System Critical Damping. This is also known from first order relationships that the
natural frequency can be identified as
in Radians/sec.
Some important things to note in Figure 1-4. The response is about the input range of the sine
sweep. The spectral width can be calculated to first order to help in setting up your “Dwell” area (normally
done for Sine on Random) testing to investigate the response around resonance (see Ch4 in figure). The
Spectral width will be approximately
. Another thing to take note of is the delta in response to
Sine input. It is important to understand the resonance response apriori in order to set the appropriate input
level so as to not cause damage to the Product. Normal Margin of Safety for the response is 4 times.
However, in a Modal investigation the margin does get adjusted anywhere from 2 to 10 balancing safety
and response of Product under test.
Assuming the table is well characterized where PSD is known for the Isolated System, this can be
calculated for the Base PSD (base input level) for the Product with the first order calculation for
Transmissibility. From there a designer may use the Miles Equation to calculate the maximum response
acceleration at the natural frequency. The Miles Equation is as follows:
has an RMS response of 1 value with a zero mean. Since the peak response is not precisely known, the
rule of thumb is to look at 3 standard deviation. With this, if the maximum response was predicted to be
10 Gs then the 3 peak response is 30 Gs at roughly a 99% probability distribution.
1-4 Plot Representation of a Sine Input and Response of two posts of
different lengths (Responses in ch4 and ch6)
NOTE: The Control signal followed the prescribed input signal closely. This is
relevant later.

2 EXPERIMENTAL VERIFICATION
While other Vibration Test Equipment exist, this paper wil confine the discussion to the use of a Sine
Sweep input to a Vibration Slip Table.
2.1 Test Flow Method
The following Test Flow can be employed for a Sine Sweep test with expected Model Response:
Characterize Vibe Table, with Product Mounting Fixture, and Product Mass Simulator if not
already done.
Mount Product Accelerometers. Control Accelerometer should already be in place from
Table Characterization. Input variables, consisting of acceleration, velocity and displacement
amplitudes their associated frequencies, Warning and Abort levels
Mount Fixture and Product onto Vibe Table
Mount Fixture and Unit
Apply Chosen Accelerometers to prescribed Product and fixture locations
Input Accel Spectral Density profile, for Input levels (Gs) frequencies, durations, Warning
and Abort levels, for the Sine Sweep Test Run. Input the Vibe Table Characterization File.
Observe Control Accelerometer response during test while running through the profile
Upon Test Completion Review Test Accelerometer Data For Pass/Fail Criteria
A designer should be aware of the hardware components that drive, monitor and controller the vibration
table, will most likely be using software entries to set the parameters for the product sine sweep test. A
representation of a software interface will be shown later in this document.

2.2 Machine Vibration Characterization
The Vibration output of the Slip table must be characterized prior to mounting the production item.
This helps to verify the machine is still working in its nominal condition. Also, there are a variety of
characteristics of the Vibe table (that should be provided by the Manufacturer) that should be checked out.
A variety of handling will happen, especially if the Vibe table is handled by various product groups, so it is
good practice to take note of any changes when first coming into the area. Some the characteristics are, but
are not limited to:
Start up and Shutdown transients
Force changes due to temperature changes (temperature sensors may be used to monitor this)
Closed loop control system is functioning as expected
All accelerometers being used are in good physical condition
First time Physical characterization of the System can be accomplished through a test known as
Tuning.
2.2.1 Tuning
Tuning is the process of separating out the machine’s own operational frequency from any structural
frequency so it can be isolated from the test output of the product. The floor and foundation also have a
natural frequency component that could couple in through the Vibe Table. Ideally, the tuning of the table
has already been performed, and a site survey has been performed (for environmental components) so
tuning is not necessary for normal testing. If any the conditions have changed, it should show in the
Machine Characterization that is done before testing commences.
2.3 Vibration Test Fixture
2.3.1 Test Fixture Design
2.3.1.1 Basic Concepts for testing [4]
For all products to be vibration tested, and interface fixture needs to be created to securely mount the
Product to the Vibration Table. In vibration test fixture design, the following inputs of test article and test
equipment are to be considered prior to designing a fixture.
Details of the shaker table such as pattern of the attachment
Holes, bolt size and thread sizes are to be known to which
the fixture attaches.
Size and configuration of the test article
Weight and center of gravity of test article
Details of the test specimen such as the mounting interface
Its dynamic characteristics
Details of the dynamic test specifications
Test axis for which fixture is designed
Mass that can be attached to the shaker table without
possibly causing damage.
Available shaker rating.
Necessary pre load between the table and fixture.
Awareness of the possibilities of the shaker resonances
Anticipated/repeated usage of the fixture
Usually, the natural frequency of the fixture design lies within the
test specification range. Thus, the most important factor in fixture design is a high
natural frequency above the frequency of interest…cost permitting.
Note that with
the weight and material of the fixture will also impact the response to a
Sine Input.

2.4 Vibration Table Testing Orientation
This paper focuses on a Slip Table (Electro-dynamic Shaker type) for vibration testing, there are two major
configurations for Vibration testing with benefits and limitations.
Orientation Benefits Limitations
Vertical Easier to control
Center of Gravity aligned
to thrust axis of shaker
3-axis capability
Smaller foot print
Lower cost
Limited Size
Can handle products
up to 2,500lbs
Horizontal Support Large Weight
3-axis test capability
More difficult to
control
Exposed Oil Film
Higher off axis
bearing load
Higher cost
2-1 Representative Vibration Test Station
Figure 2-2 Horizontal Slip Table (AKA Shaker) with Product/Fixture on Table

2.5 Control and Measurement Accelerometers for vibration testing-Parameters
As mentioned in the Introduction, it is important to be able to accurately as possible measure the
modal response of a system due to a sine wave swept input. For this reason calibrated Piezoelectric
Accelerometers are used to translate vibration input into a voltage response. However, in order to get the
best characteristic response from the Accelerometers, proper mounting becomes a critical part of the setup.
Also, there should be a proper number of accelerometers for all of the needed measurement points. The
tester cannot have a roving Accelerometer for all areas of inspection. Roving Accelerometers lead to
variable test loading. This adds static accelerometers mass to the overall system and will change the
response.
2-3 Test data variation from Roaming Accelerometer
Both software recalculated limits, and the Control Accelerometer will monitor the shaker vibration
output (input into the Product/fixture). If Dynamic demands exceed the shaker system’s limits, the software
automatically warns the operator, or if the Control Accelerometer (part of the closed loop control system)
senses an out of limit condition for the test, the System will automatically shut down. For a Sine Sweep the
Control Accelerometer will closely follow the Sine Sweep parameter inputs with the Set software limits put
in place. Typical Sine Sweep Limits are stated below:
Warning Limits Abort Limits
+/- 30% of Expected Response +/- 40% of Expected Response
2-4 Default Controller Accelerometer Limits

2-5 Control Accel Plot
If there is a specific area of concern about the product, the test can also be set for specific Accelerometers
used.
2.6 Control Accelerometer Placement and Parameters
2.7 Measurement Accelerometer Placement and Parameters
For Fixtures and units under test, acceleration levels will vary at different points on the fixture. With
a fixed input level many points will not have the same vibration response. It is beneficial to have several
attachment points to ensure good Transmissibility of vibration from the shaker through the fixture and to
the unit under test.
2-6 Accelerometers with Axis Labels
2-7 Axis Naming Representation to Location
The most common accelerometer types are single axis and must be orientated with the axial direction of
test. However, it is best pr
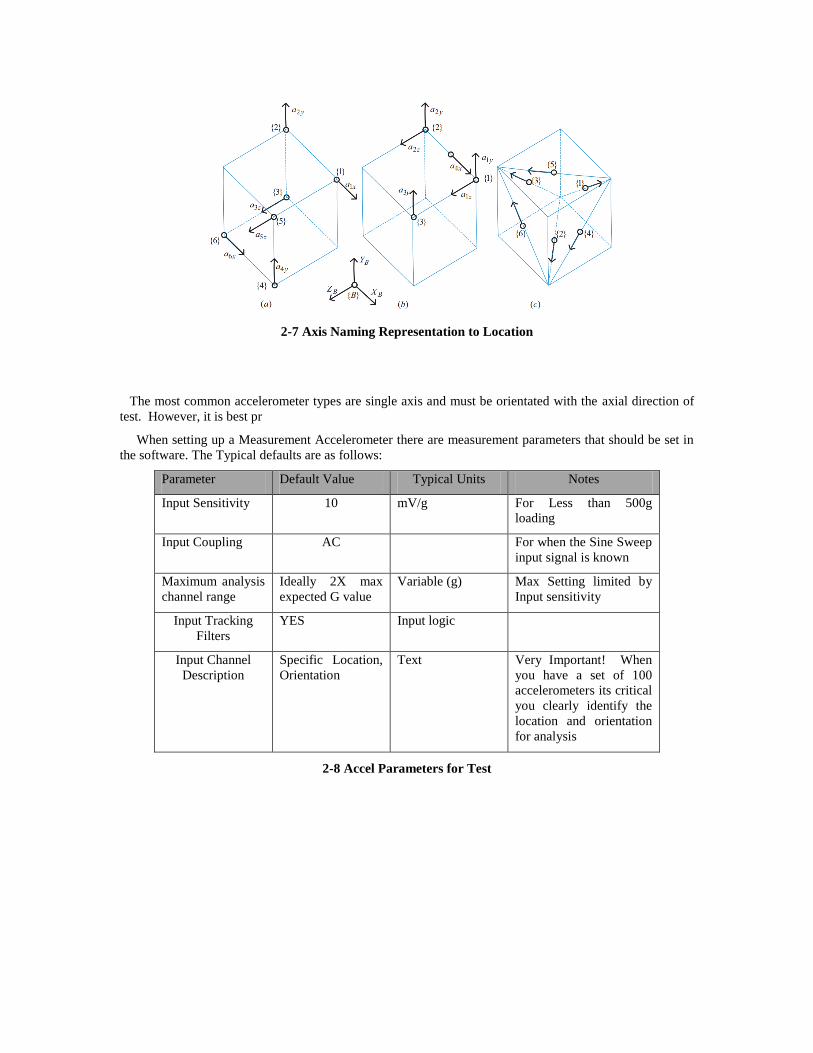
When setting up a Measurement Accelerometer there are measurement parameters that should be set in
the software. The Typical defaults are as follows:
Parameter Default Value Typical Units Notes
Input Sensitivity 10 mV/g For Less than 500g
loading
Input Coupling AC For when the Sine Sweep
input signal is known
Maximum analysis
channel range
Ideally 2X max
expected G value
Variable (g) Max Setting limited by
Input sensitivity
Input Tracking
Filters
YES Input logic
Input Channel
Description
Specific Location,
Orientation
Text Very Important! When
you have a set of 100
accelerometers its critical
you clearly identify the
location and orientation
for analysis
2-8 Accel Parameters for Test

2-9 Accelerometer Physical Test Parameters
2.8 Measurement Accelerometer Physical Mounting and Setup
There are six typical accelerometer types for Accelerometer setup. Each have their advantages in
application and variation in performance. The type, and technique chosen will affect the fidelity, and
repeatability of the data that can be collected specified in Hz or Cycles Per Minute (CPM). Some of the
common types are:
Mounting Technique Name Freq Response
(+/- 3dB)
Application Notes
Permanent Mount Stud Mount Sensor Max
response
When properly installed provide the best
transmission of the broadest range, and are
the most reliable and resilient
Permanent Mount Stud Mount; Tri-
axial
Typically
accurate up to
7or 8kHZ
When properly installed provide the best
transmission of the broadest range, and are
the most reliable and resilient. All three
axes can be monitored at that one location
Permanent Mount Epoxy Pad 10kHz to
15kHz
(600000-
900000 CPM)
High Repeatability at locations where
drilling and tapping are not permitted.
Good transmission for High Frequency (5
to 10 KHz)
Adhesive Mount Flat Magnet with
Target (Target is
10kHz
(600000CPM)
High Repeatability at locations where
drilling and tapping are not permitted.
permanent) Performance Installation Dependant
Portable Mount Quick Disconnect
(Threaded)
Up to 6.5 KHz
(390000CPM)
Increases Data Collection Speed, Maintains
consistent data collection locations
Portable Mount Curved Surface
Magnet
Up to 2kHz
(120,000CPM)
Increases Data Collection Speed, Maintains
consistent data collection locations
Portable Mount Probe Tip 500 Hz
(30,000) CPM
Difficulty in repeatability not meant above
500 Hz
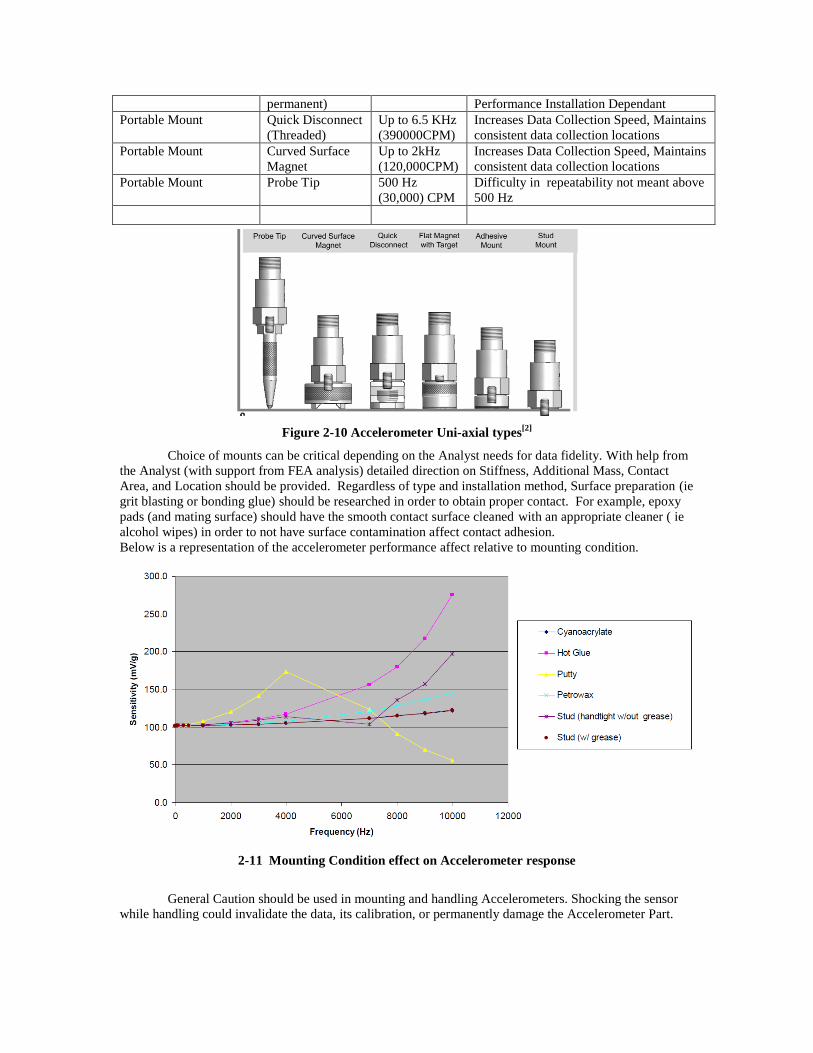
Figure 2-10 Accelerometer Uni-axial types[2]
Choice of mounts can be critical depending on the Analyst needs for data fidelity. With help from
the Analyst (with support from FEA analysis) detailed direction on Stiffness, Additional Mass, Contact
Area, and Location should be provided. Regardless of type and installation method, Surface preparation (ie
grit blasting or bonding glue) should be researched in order to obtain proper contact. For example, epoxy
pads (and mating surface) should have the smooth contact surface cleaned with an appropriate cleaner ( ie
alcohol wipes) in order to not have surface contamination affect contact adhesion.
Below is a representation of the accelerometer performance affect relative to mounting condition.
2-11 Mounting Condition effect on Accelerometer response
General Caution should be used in mounting and handling Accelerometers. Shocking the sensor
while handling could invalidate the data, its calibration, or permanently damage the Accelerometer Part.

2.9 Measurement Accelerometer Transmission note
Generic for all Accelerometers there exists a finite regime with which they are useful for data
collection. This is called the transmission region and is defined in the product specification sheets. This
characteristic is set for life of the Accelerometer (if left undamaged). Even within the transmission region
the Accelerometer performs non-linearly. Therefore, for best measurement results the part should be
calibrated. Most companies have either an internal calibration group that can perform this task, or they can
accept the calibration done by the vendor.
Figure 2-12 Transmission, Amplification (about the Accel’s own resonance) and Isolation regimes [2]
2.10 Measurement Accelerometer Channel inputs
2-13 Measurement Accelerometer Entries
NOTE: The low abort limit check can be especially useful to detect broken cables, faulty accelerometers,
intermittent system conditions or other potentially dangerous situations which cause a low level input.
Situations like a bad accelerometer wire leading to low signal, 60 Hertz frequency noise, or Improper
mounting conditions may occur leading to low signal or causing the System to trip and stop test.
Parameter Default Value Typical Units
Channel # Assigned channel
to Accelerometer
#
LOW FREQ,
HIGH FREQ
Variable selection
based on need.
Usually the
Hz

Frequency test
range input in the
Sine Sweep
TYPE% Variable for
Acceleration (A),
Velocity (V),
Displacement (D),
Level (G)
Variable (g)
Abort % about nominal
value (0 db
reference), usually
40%
Input logic
2-14 Measurement Accelerometer Parameters
2.11 Sine Sweep Input Parameters
As was stated prior Frequency range of interest, Displacement, Acceleration, Velocity, and Rate
(Duration) must be known parameters. This particular piece of software is representative of the suggested
input options, as well as the ability to adjust the sweep rate around areas of interest (mostly focused on
resonance).
2-15 Representation of Sine Sweep reference input table[6]
2-16 Sine Sweep When Test is Scheduled for Time[6]

2-17 Sweep Rate control about a particular Frequency of interest[6]
2.12 Response Data Analysis Post Processing
2-18 Displacement, Velocity, and Acceleration relative to the Control Accel[6]

Software Controller Packages allow a variety of Post processing and Accelerometer reporting to show if the
tests met response requirements.
Readouts of Accelerometer Responses to input can also be displayed in a variety of ways. One way is
similar to the above figure or in a more tabular format for post processing.
REFERENCES
[1] Kevin Napolitano, and Daniel Linehan [Multiple Sine Sweep Excitation for Ground Vibration Tests], Proceedings of the
IMAC-XXVII Society for Experimental Mechanics Inc, February 9-12, (2009).
[2] Connection Technology Center “Learn Basic Vibration Monitoring with CTCs Vibration Univeristy,”
<https://www.ctconline.com/__ctc_university.aspx?one=1 > (2012). [3] Dr. Paul Ibanez ANCO Engineers, Inc., "An Introduction to Shake Tables for Seismic Testing of Equipment And Glossary
of Vibration Terminology," ancoengineers.com, October 1st,(2008).
[4] http://shodhganga.inflibnet.ac.in/bitstream/10603/2274/11/11_chapter%203.pdf, ch.3 Page 54
[5] Unholtz-Dickie Corporation, Fixture Design Notes
[6] Unholtz-Dickie Corporation, VWIN II / VWIN XL / VWIN VIBRATION CONTROLLER OPERATING MANUAL
[7] “Ask the expert tacking the mystery out of the power spectral density function”
https://www.endevco.com/news/archivednews/2010/2010_08/f1.html
DEFINITIONS
Slip Table A term mainly used in the aerospace and automotive
industry, “slip table” is essentially synonymous to
“shake table top”. When using electro-dynamic
actuators a horizontal table is often implemented by
having a flat metal plate supported by an oiled granite
or cast iron flat surfaced base. Hence the term “slip
table”. The term is sometimes used to mean any
shake table top, even those guided on bearings or
flex plates.
Sine Sweep A sine sweep is a signal that changes from one
frequency to another in a uniform way. The transition
can be fast (some times called a “Chirp”) or slow
(possibly taking hours). It can be increasing or
decreasing in frequency, and it may be repeated
many times. The rate of change can be linear (the
same number of Hz per unit time) or “logarithmic” (the
same percentage change per unit time. Note that a
“logarithmic” sweep is a misnomer, as the sweep is
actually exponentially increasing or decreasing. Sine
sweeps are extensively used in shake table testing to
provide vibratory
Sampling Theorem The Shannon sampling theorem says that the
sampling rate must be at least twice the highest
frequency in the sampled signal. Otherwise the high
frequency content in the signal will “alias” and look
like low frequency energy, thereby corrupting the
information in the digital signal. In practice, the
sampling rate should be 3-10 times the highest

frequency, to obtain optimal results.
Power Spectral Density and
Acceleration Spectral
Density
PSD, also called acceleration spectral density (ASD), is widely used in
random vibration testing applications and is intended primarily as a tool for
cancelling out the effect bandwidth of a frequency spectrum. PSD is a unit
of measure, described in terms of energy per "filter", used to identify and
denote energy strength deviations. It is possible to obtain the total energy
within a specific frequency range by taking the root sum squared of the
PSD points within the specified range. Proper computation of PSD is
achieved directly via FFT spectrum analysis and then transforming it,
taking into account actual analyzer filter bandwidth. [7]
Top Related