


Languages
Pages
Legal

Presentation Outline
• Passing Ship Effects and Model Validations• Broken Bore Formation and Propagation• Harbor Sloshing/Bathtub Effects• Ultra Large Container Vessels• Conclusions

ebb current
Passing Ship Effects

Passing Ship Effects

Validation ‐ Laboratory Passing Vessel Forces REMERY (1974)
-300
-150
0
150
300
0 100 200 300 400 500 600Time (seconds)
Long
itudi
nal L
oad
(met
ric to
ns) Remery Average
VH-LU ModelMeasured Data
-1000
-500
0
500
1000
0 100 200 300 400 500 600Time (seconds)
Late
ral L
oad
(met
ric to
ns)
Remery AverageVH-LU ModelMeasured Data
-40,000
-20,000
0
20,000
40,000
0 100 200 300 400 500 600Time (seconds)
Mom
ent (
met
ric to
n-m
eter
s)
Remery AverageVH-LU ModelMeasured Data

Validation ‐ Laboratory Passing Vessel Forces MARIN (2008)
-600
-400
-200
0
200
400
600
850 900 950 1000 1050 1100 1150 1200 1250 1300
Time (sec)
Sur
ge F
orce
(kN
)
Measured SurgeVH-LU SurgeMeasured SwayVH-LU Sway
-15,000
-10,000
-5,000
0
5,000
10,000
15,000
850 950 1050 1150 1250Time (sec)
Yaw
Mom
ent (
kN-m
)
Measured Yaw
VH-LU Yaw
-300
-200
-100
0
100
200
300
850 900 950 1000 1050 1100 1150 1200 1250 1300
Time (sec)
Sur
ge F
orce
(kN
)
Measured SurgeVH-LU SurgeMeasured SwayVH-LU Sway
-6,000
-4,000
-2,000
0
2,000
4,000
6,000
850 950 1050 1150 1250
Time (sec)
Yaw
Mom
ent (
kN-m
)
Measured Yaw
VH-LU Yaw
Data from van Wijhe et al. 2008
Passing Ship Speed: 5.5 knotsPassing Ship Distance: 75 m, 150 m

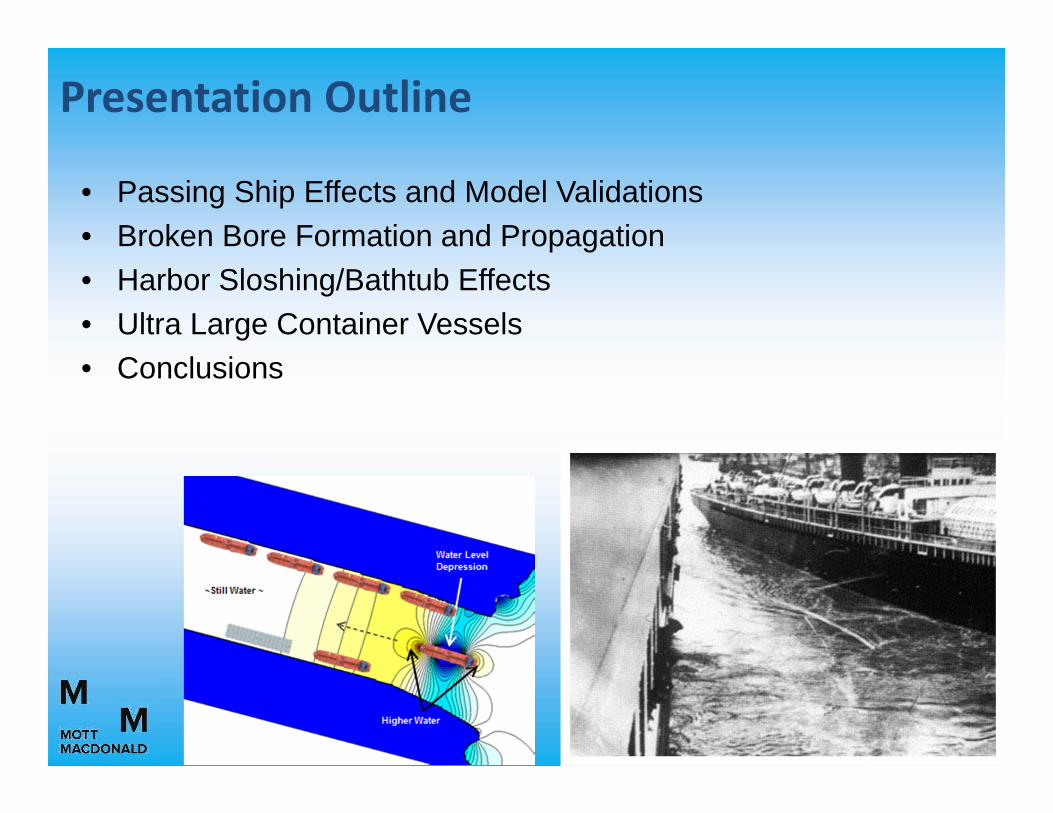
Harbor Sloshing/Bathtub Effects
Disney Dream5/1/2014 05:30 Arrival
West Gage East Gage
Harbor Sloshing/Bathtub Effects

-1.0
-0.8
-0.6
-0.4
-0.2
0.0
0.2
0.4
0.6
0.8
5/12/14 21:36 5/12/14 21:38 5/12/14 21:41 5/12/14 21:44 5/12/14 21:47 5/12/14 21:50 5/12/14 21:53 5/12/14 21:56 5/12/14 21:59
Norweigan Gem
Harbor Sloshing/Bathtub Effects
WSE[ft]
Summer 2014 Field Campaign
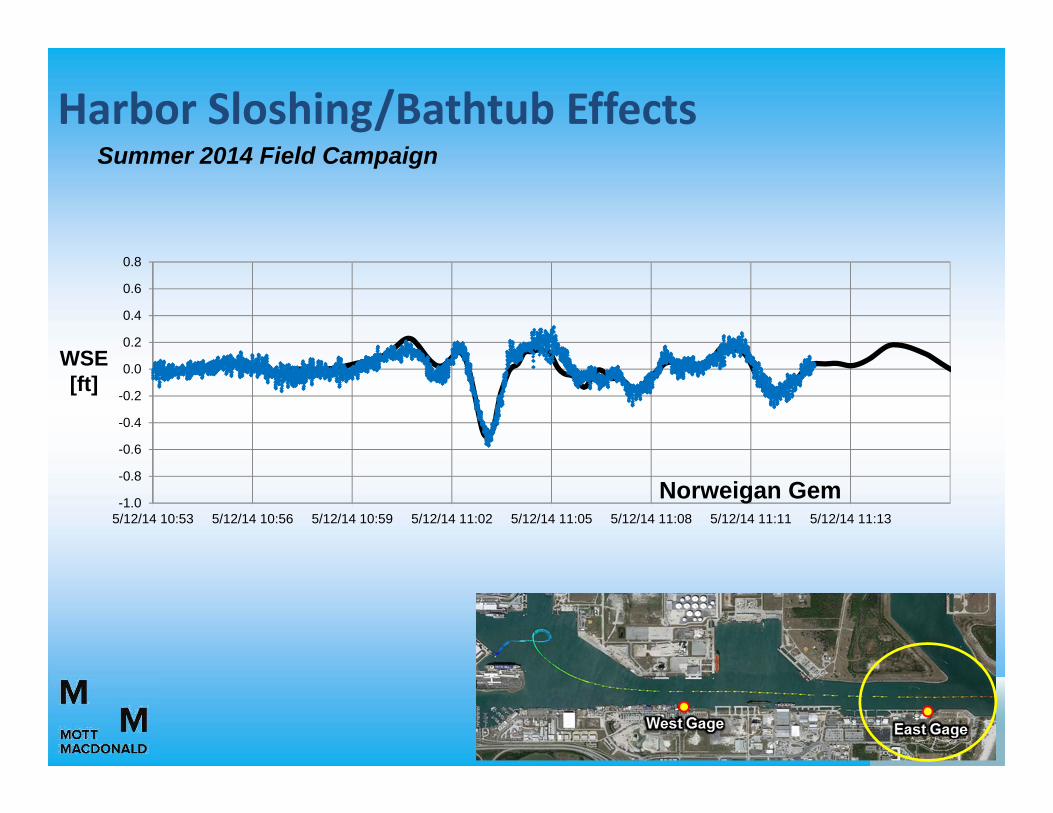
-1.0
-0.8
-0.6
-0.4
-0.2
0.0
0.2
0.4
0.6
0.8
5/12/14 10:53 5/12/14 10:56 5/12/14 10:59 5/12/14 11:02 5/12/14 11:05 5/12/14 11:08 5/12/14 11:11 5/12/14 11:13
Norweigan Gem
Harbor Sloshing/Bathtub Effects
WSE[ft]
Summer 2014 Field Campaign
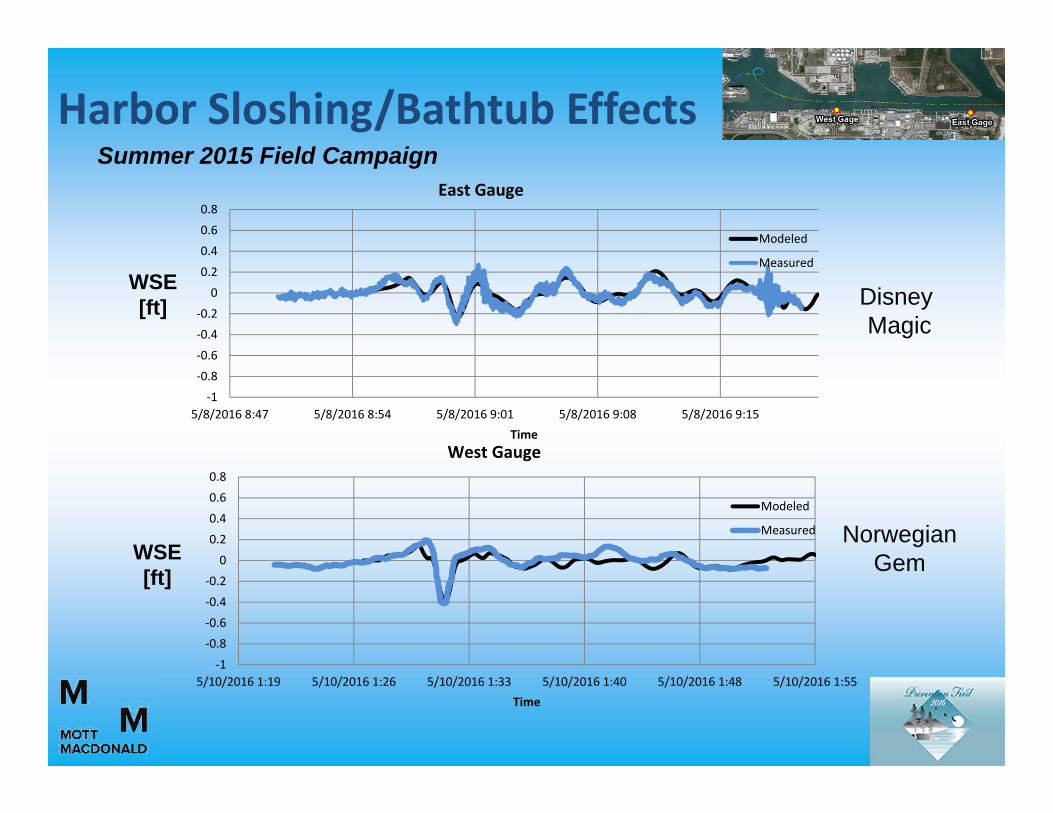
Harbor Sloshing/Bathtub EffectsSummer 2015 Field Campaign
Disney Magic
Norwegian Gem
‐1
‐0.8
‐0.6
‐0.4
‐0.2
0
0.2
0.4
0.6
0.8
5/8/2016 8:47 5/8/2016 8:54 5/8/2016 9:01 5/8/2016 9:08 5/8/2016 9:15Time
Modeled
Measured
East Gauge
‐1
‐0.8
‐0.6
‐0.4
‐0.2
0
0.2
0.4
0.6
0.8
5/10/2016 1:19 5/10/2016 1:26 5/10/2016 1:33 5/10/2016 1:40 5/10/2016 1:48 5/10/2016 1:55Time
Modeled
Measured
West Gauge
WSE[ft]
WSE[ft]
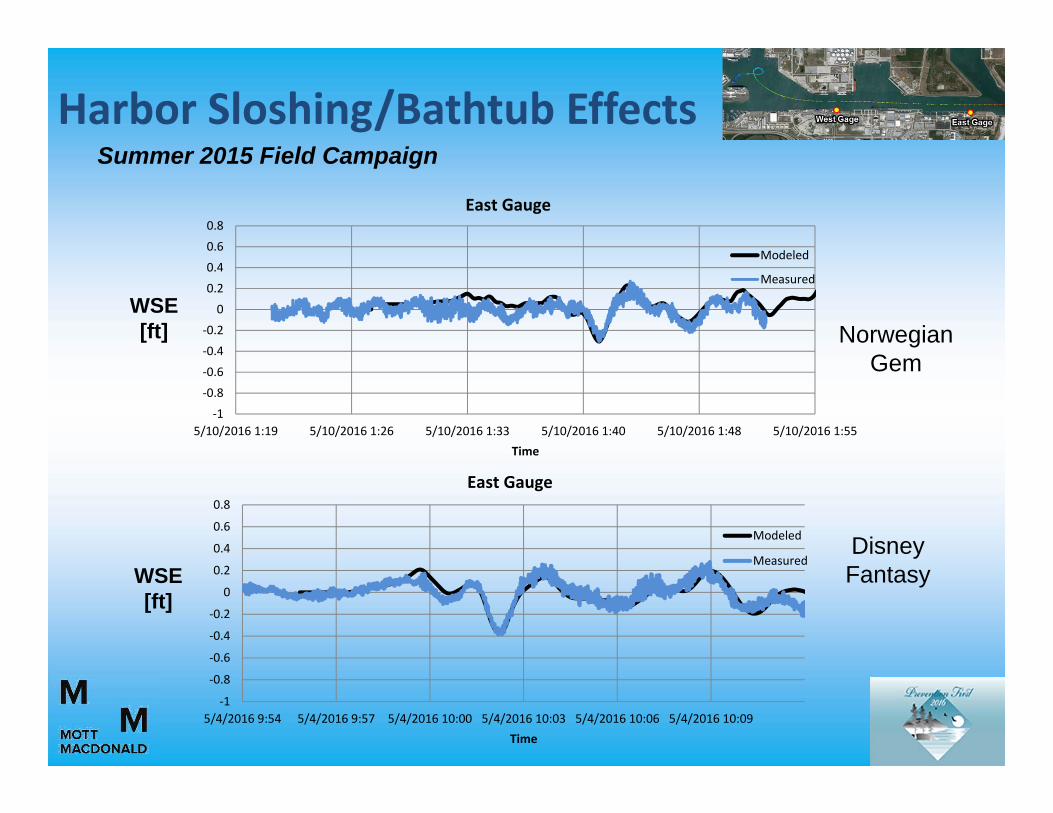
Harbor Sloshing/Bathtub EffectsSummer 2015 Field Campaign
Norwegian Gem
Disney Fantasy
‐1
‐0.8
‐0.6
‐0.4
‐0.2
0
0.2
0.4
0.6
0.8
5/10/2016 1:19 5/10/2016 1:26 5/10/2016 1:33 5/10/2016 1:40 5/10/2016 1:48 5/10/2016 1:55Time
Modeled
Measured
East Gauge
‐1
‐0.8
‐0.6
‐0.4
‐0.2
0
0.2
0.4
0.6
0.8
5/4/2016 9:54 5/4/2016 9:57 5/4/2016 10:00 5/4/2016 10:03 5/4/2016 10:06 5/4/2016 10:09Time
Modeled
Measured
East Gauge
WSE[ft]
WSE[ft]

Broken Bore Formation and Propagation

Broken Bore Formation and Propagation
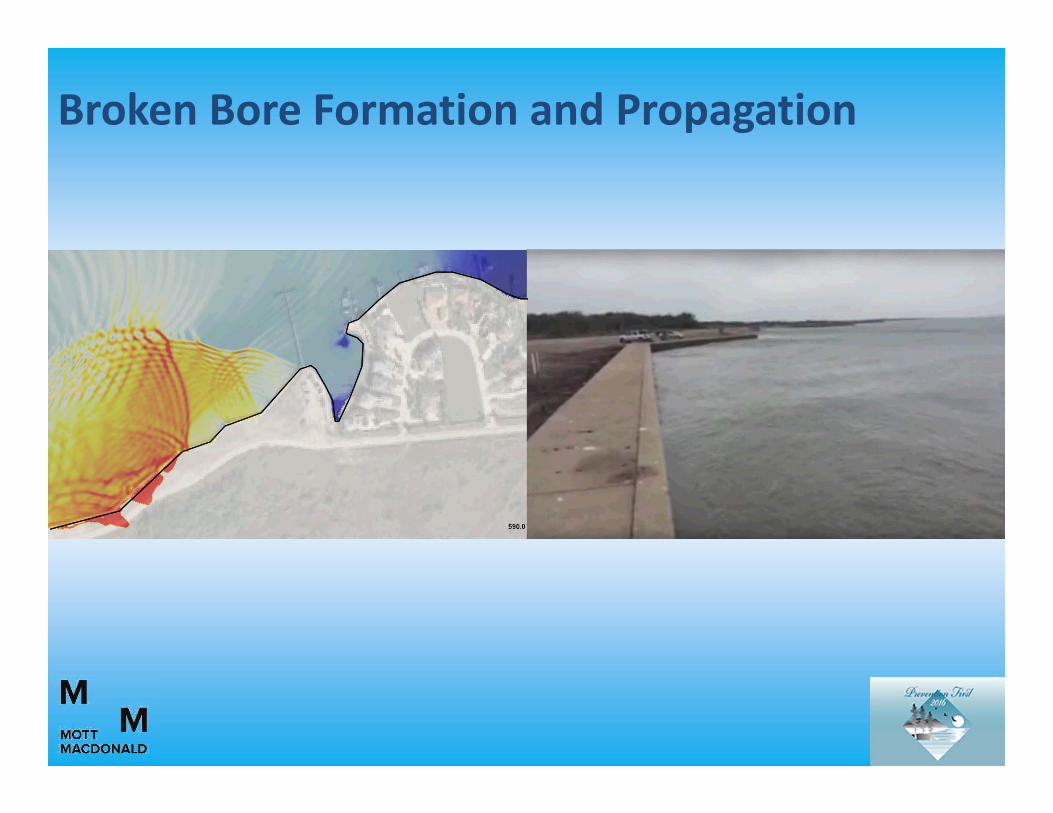
Broken Bore Formation and Propagation

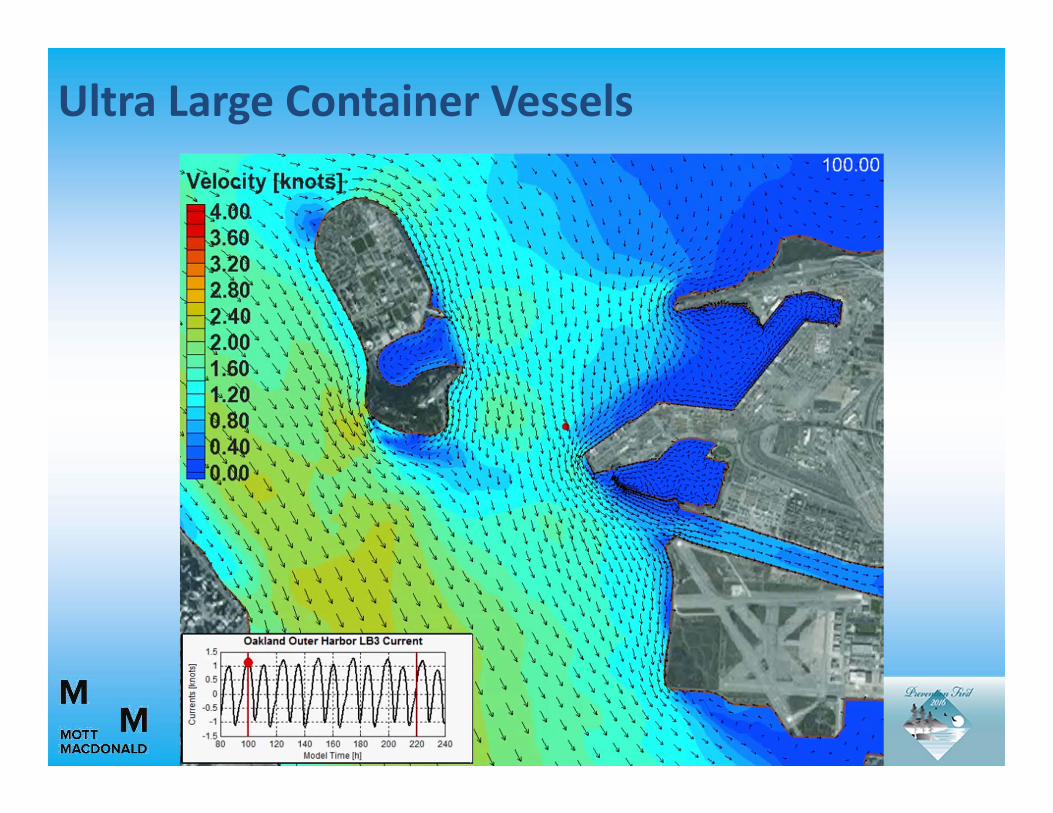
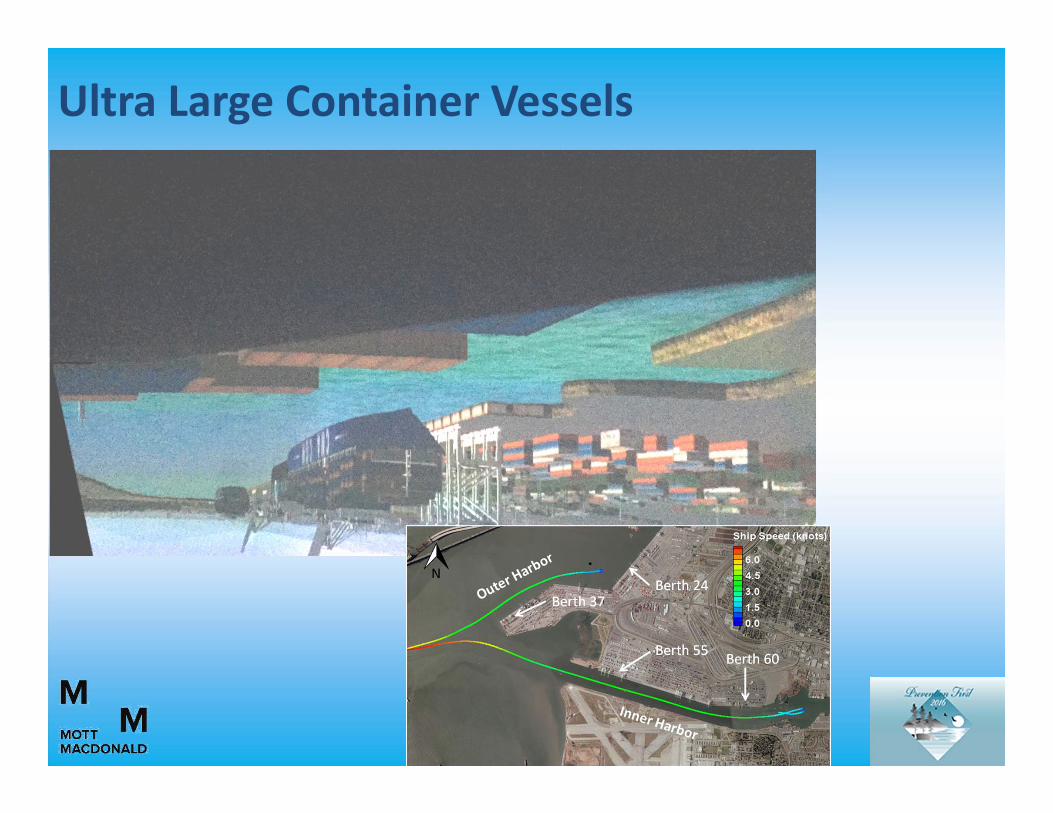
Ultra Large Container Vessels
Particular CMA CGM Ben FranklinLength Overall 1309.0 ftLength Between Perpendiculars 1251.4 ftBreadth 177.2 ftMoulded Depth 99.1 ftDraft 52.5 ft
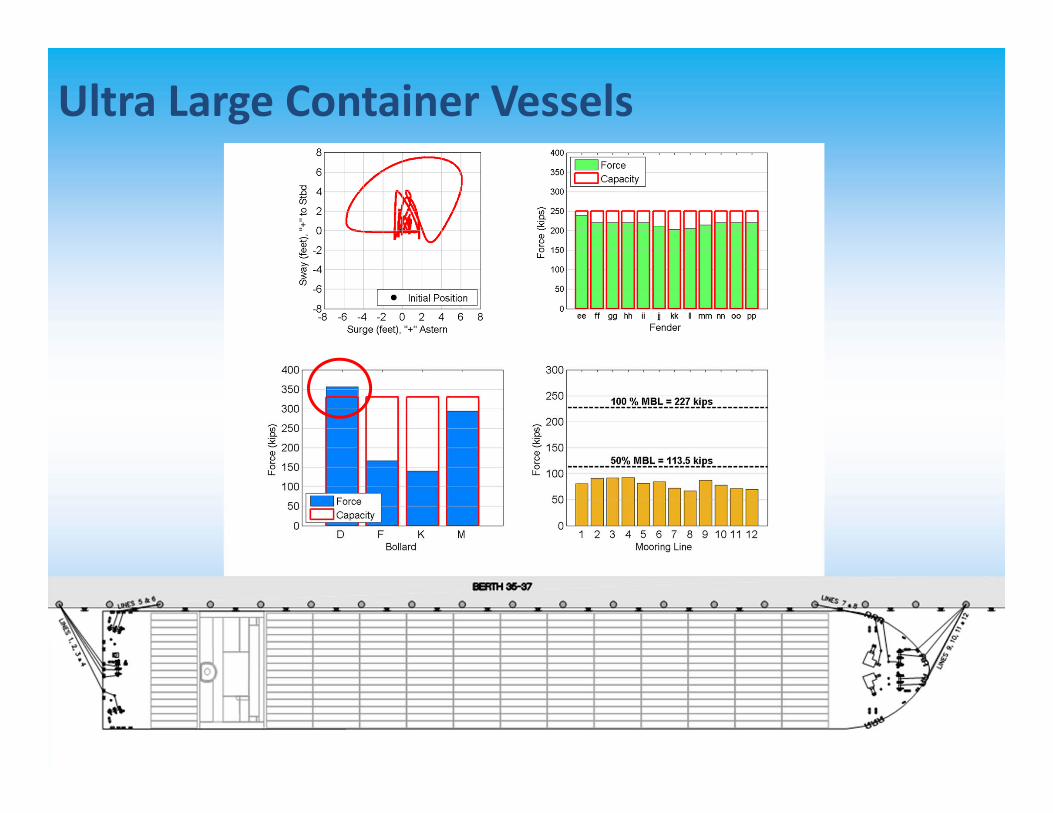
Ultra Large Container Vessels
Ultra Large Container Vessels

Ultra Large Container Vessels
Ultra Large Container Vessels
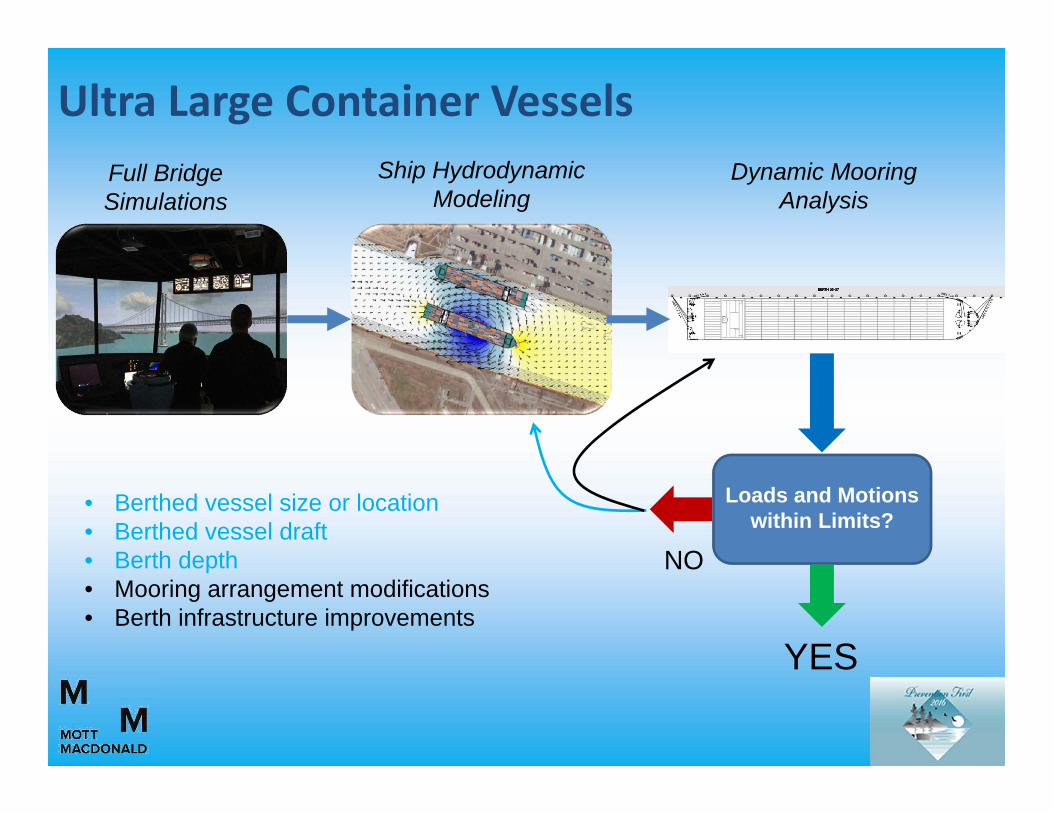
Loads and Motions within Limits?
YES
NO
Full Bridge Simulations
Ship Hydrodynamic Modeling
Dynamic Mooring Analysis
• Berthed vessel size or location• Berthed vessel draft• Berth depth• Mooring arrangement modifications• Berth infrastructure improvements
Ultra Large Container Vessels
Ultra Large Container Vessels
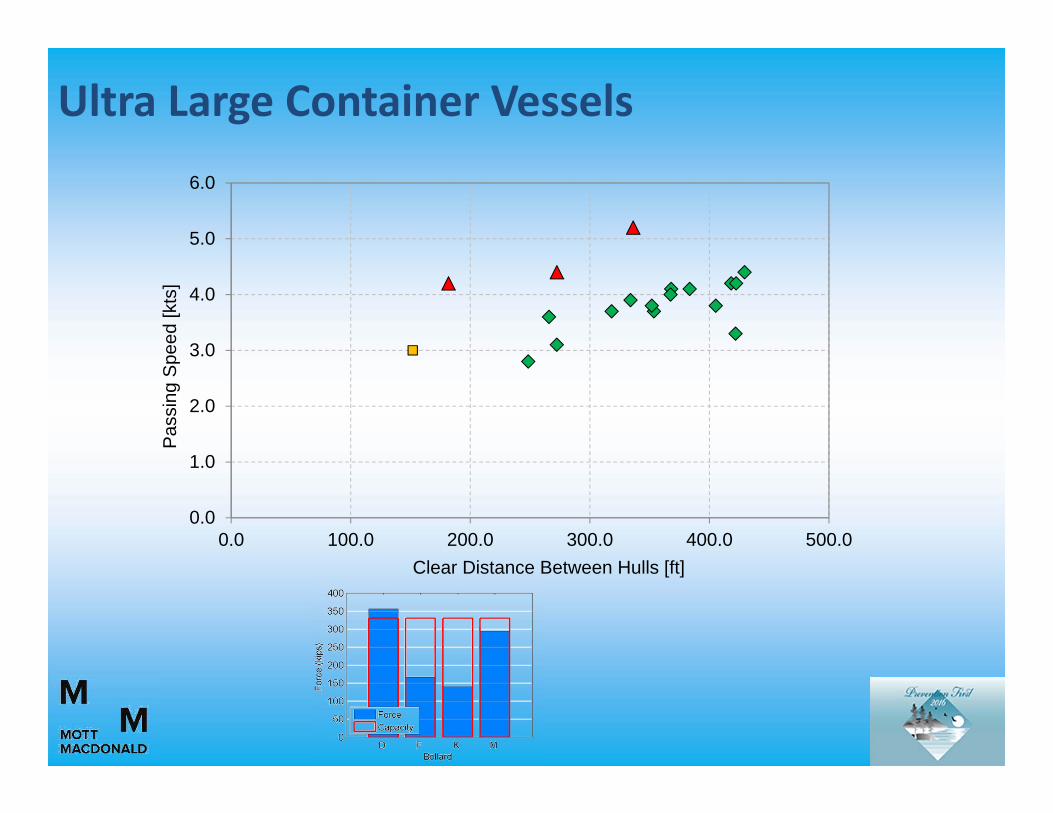
0.0
1.0
2.0
3.0
4.0
5.0
6.0
0.0 100.0 200.0 300.0 400.0 500.0
Pas
sing
Spe
ed [k
ts]
Clear Distance Between Hulls [ft]
Ultra Large Container Vessels

Ultra Large Container Vessels
• Thorough analysis performed to determine feasibility of accommodating 18k TEU vessels
• Real-time full bridge simulations determined to be essential for pilot comfort and testing maneuvering-based risk mitigation measures
• Efficient system developed:• Simulator data taken directly into ship hydrodynamic model to
produce loads and moments on berthed vessel(s)• Hydrodynamic model data taken directly into dynamic mooring
analysis to determine potential mooring impacts• Mooring analysis results used to develop guidance for pilots,
risk assessment for berth infrastructure, recommended improvements
Ultra Large Container Vessels
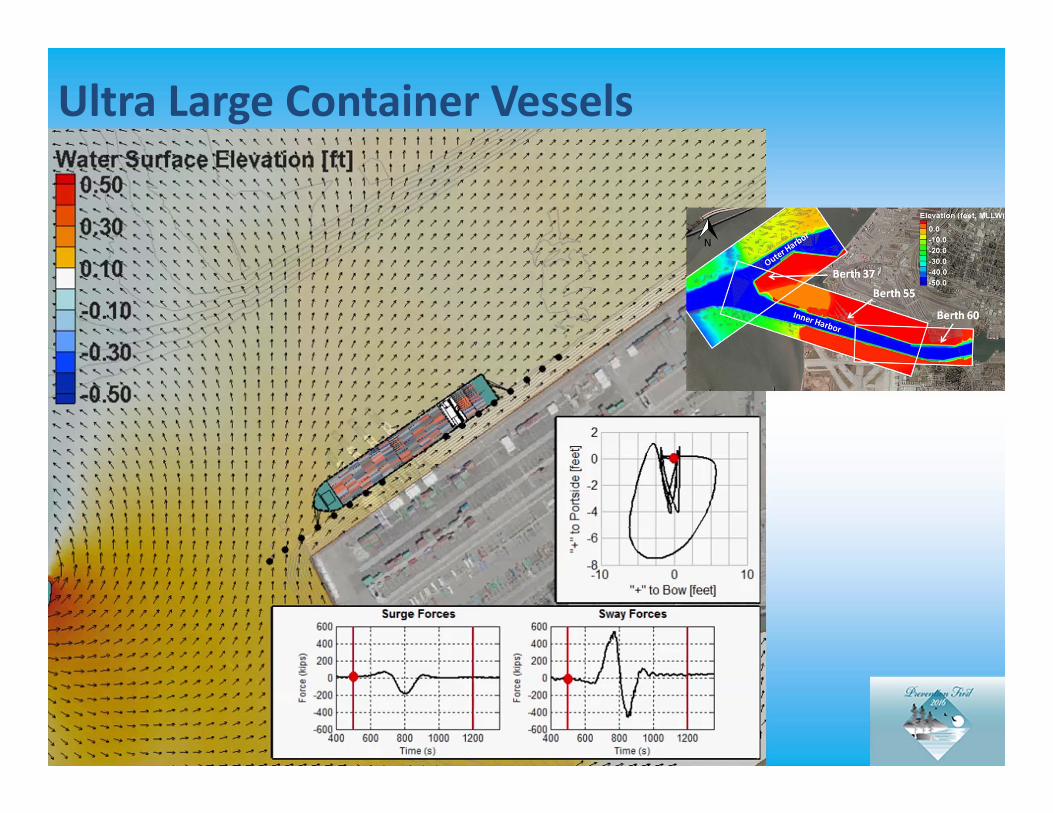
• Results indicate that ULCVs are so large that:• Maneuvering safety sensitive to environmental forces• Difficult to control speeds given large swept path with drift angle• Loads on berthed vessels are highly sensitive to speed and passing
distance• Maneuvering improvements crucial to reduce passing speeds• In some instances, ULCVs passing a particular berth pose the
largest new risk to existing berth infrastructure (vs. ULCVs mooring at a berth).

Conclusions• ULCVs require particular attention be paid to passing ship effects.
• Berth infrastructure risk during accommodation of ULCVs should also consider smaller ships passed at berth.
• Validations successfully expanded to include complex (realistic) maneuvering and hydrodynamic processes such as bow solitary waves, broken bore effects, and sloshing/bathtub effects.
• Real maneuvering is often complex, accurate loads on berthed vessels require simulations and/or AIS information.
• Numerical modeling proven critical in the development and testing of measures to mitigate the harmful impacts of these hydrodynamic phenomena.
Top Related