


Languages
Pages
Legal


Supporting Informations
Silicon Nanoparticle based Fluorescent Biological Label via Low
Temperature Thermal Degradation of Chloroalkylsilane
By Pradip Das,a Arindam Saha,a Amit Ranjan Maity,a Sekhar C. Rayb and Nikhil R. Janaa,*
Experimental Section
Materials: Chloro(dimethyl)octadecylsilane (95%), octadecylamine (ODA, 90%), folic acid (FA, 97%),
triethylamine (Et3N, 99%), poly(maleic anhydride-alt-1-octadecene) (Mn 30,000-50,000), O,O-Bis(2-
aminopropyl) polypropylene glycol-block-polyethylene glycol-block-polypropylene glycol (Mr 500),
dimethyl sulfoxide (DMSO), N,N-dicyclohexylcarbodiimide (DCC, 99%), N-hydroxy succinimide
(NHS, 98%) were purchased from Sigma-Aldrich. 1,3,5-trimethylbenzene (TMB, 98%) was purchased
from Spectrochem.
Synthesis of silicon nanoparticles: Silicon nanoparticles were synthesized by low temperature thermal
decomposition of chloro(dimethyl)octadecylsilane as a precursor in presence of octadecylamine as
capping agent at normal atmospheric environment. Briefly, chloro(dimethyl)octadecylsilane (69.4 mg)
and octadecylamine (6.7 mg) were added into 12 mL of TMB taken in three naked round bottom flask.
This solution was then heated to 140 ºC for different times from 6 to 72 hours. Depending on heating
time, the produced silicon nanoparticles were named as Si-6, Si-18, Si-36, Si-48 and Si-72. Silicon
nanoparticles were isolated from free reagents by conventional precipitation-redispersion method.
Typically, TMB solution of silicon nanoparticle is mixed with equal volume of hexane to precipitate the
particles and precipitated particle were then isolated and dissolved in chloroform. This chloroform
solution was then mixed with minimum volume of hexane to precipitate the particles. This precipitate is
again isolated and dissolves in chloroform. This hexane based precipitation and chloroform based
dissolution is repeated 2-3 times and finally particles were dissolved in chloroform.
Electronic Supplementary Material (ESI) for NanoscaleThis journal is © The Royal Society of Chemistry 2013
Synthesis of polymer coated Si-72 nanoparticles: Polymer coated Si-72 nanoparticles were prepared
using the previously described method with minor modification.52,53
In brief, 20 mg poly(maleic
anhydride-alt-1-octadecene) polymer was dissolved in 1 mL chloroform and mixed with 500 µL
chloroform solution of Si-72 nanoparticles (2 mg/mL) followed by sonication for 10 minutes.
Subsequently chloroform solution of 250 µL of O, O’-bis(2-aminopropyl) polypropylene glycol-block-
polyethylene glycol-block-polypropylene glycol (PEG-diamine) (prepared by mixing 3:25 volume ratio
of PEG-diamine and chloroform) was added and sonicated for 10 minutes. After that additional 250 µL
PEG-diamine solution was added and sonicated for further 10 minutes. The resultant solution was
allowed to stand overnight at room temperature and then chloroform was evaporated. The residue was
dispersed in 2 mL of aqueous Na2CO3 solution. The polymer coated aqueous Si-72 nanoparticles was
mixed with twice volume of acetone and precipitated particles were isolated from supernatant containing
free polymer by high speed centrifuge and dissolved in water. Finally particle solution was dialyzed to
remove any excess reagents.
Synthesis of folate-NHS: Folate-NHS was prepared following our reported method.58
Briefly, folic acid
(150 mg) and Et3N (75 µL) were added into 10 mL of distilled DMSO and subsequently DCC (70 mg)
was added. The solution was stirred for one hour in absence of light and then NHS (60 mg) was added to
the solution followed by stirring for overnight under nitrogen atmosphere. The resultant folate-NHS was
separated from solution by the addition of diethyl ether and purified by dry THF.
Folate functionalization of Si-72 nanoparticles: Polymer coated Si-72 nanoparticles were reacted with
folate-NHS to prepare the folate functionalized Si-72 nanoparticles. The primary amine groups present on
the surface of polymer coated particle reacted with NHS group with the resultant covalent linkage. In a
typical process, 1.5 mL polymer coated Si-72 nanoparticles solution was prepared in bicarbonate buffer
solution of pH 9. Next, freshly prepared folate-NHS (1 mM) solution was prepared in DMF and 200 µL
of this solution was added to it. The solution was stirred for overnight and then excesses reagents and free
folic acid were removed by dialyzing against basic water and then normal using dialysis membrane
(MWCO ~12000-14000 Da).
Electronic Supplementary Material (ESI) for NanoscaleThis journal is © The Royal Society of Chemistry 2013
Cell and tissue labeling: HeLa cells were cultured in cell culture flask and then subcultured in cell
culture plate with 0.5 mL folate free RPMI-1640 media having 10 % fetal bovine serum (FBS) and 1 %
penicillin/streptomycin. After overnight, cells which were attached to the tissue culture plate were washed
with phosphate buffer solution and then 500 µL fresh media was added. After overnight 10-150 µL of
nanoparticles solution (2 mg/mL) was added and incubated for 4 hours. After that 10 µL of nuclear
straining dye (Hoechst 33342) was added and incubated for 10 minutes. Next, unbound nanoparticles and
excesses dye were removed by repeated washing with PBS buffer solution. The washed cells were fixed
by using of 4 % paraformaldehyde followed by mounting with 50 % glycerol. The cells were then used
for imaging.
Human dissected cervical cancer positive tissue was frozen and sectioned following the standard
procedure.58
The conventional histopathological assay was used to detect cancer of the biopsy tissue
samples. For labeling study, 5 μm thick sectioned tissue sample was incubated with nanoparticle solution
for 4 hours and then extensively washed with PBS buffer solution to remove any unbound nanoparticles.
Next, sample was incubated with solution of hoechst dye for 5 minutes for staining of cell nucleus.
Finally, washed sample was imaged under bright field and fluorescence mode.
MTT assay: HeLa cells were seeded into 24-well plate in 500 µL folate free RPMI-1640 media. After 24
hours, cell were treated with various amounts of nanoparticles having different final concentration (0.15 -
2.5 mg/mL) and incubated for 24 hours. After that cells were washed with PBS buffer solution. Next, 50
µL of 3-(4,5-dimethylthiazol-2-yl)-2,5-diphenyltetrazolium bromide (MTT, 5 mg /mL in PBS buffer) was
added to every well and incubated for 4 hours. Next, the supernatant was removed carefully, leaving the
violet formazan in the plate. The precipitate was mixed with 500 µL of 1:1 water-DMF mixture and then
absorbance was measured at 570 nm using microplate reader. The relative cell viability was calculated
assuming 100 % cell viability for sample having no nanoparticle.
Instrumentation: UV-Visible absorption spectra were measured using Shimadzu UV-2550 UV-Visible
spectrophotometer and photoluminescence emission, excitation spectra were obtained using BioTek
Electronic Supplementary Material (ESI) for NanoscaleThis journal is © The Royal Society of Chemistry 2013

SynergyMx microplate reader. Transmission electron microscopy (TEM) imaging and energy dispersive
X-ray (EDS) spectroscopy was performed using FEI Technai G2 F20 electron microscope. X-ray
photoelectron spectroscopy (XPS) was performed using a Omicron (Serial No-0571) X-ray photoelectron
spectrometer. Time correlated single photon counting (TCSPC) spectra was obtained through exciting the
sample with picoseconds diode laser (IBH Nanoled) using Horiba Jobin Yvon IBH Fluorocube apparatus.
Temperature dependent photoluminescence (PL) of solid Si-72 nanoparticles was performed by Triax 310
monochromator and a multichannel photomultiplier detector under UV excitation with 325 nm line of He-
Cd laser. Fourier transform infrared (FTIR) spectroscopy was performed on Perkin Elmer Spectrum 100
FTIR spectrometer. Thermogravimetric analysis (TGA) and differential scanning calorimetry (DSC) were
performed using TA SDT Q600 and TA DSC Q2000 instrument, respectively. Electron paramagnetic
resonance (EPR) was measured using JEOL JES-FA 200 ESR spectrometer using purified solid samples
at 77 °K. Dynamic light scattering (DLS) and Zeta potential study were performed using a NanoZS
(Malvern) instrument, after dialyzing the samples. Fluorescence images and photostability of different
silicon nanoparticles were performed by drop casting of sample solution on glass slide and images were
taken using Olympus IX 81 microscope attached with digital camera. The fluorescence images of the
cell/tissue were captured by Carl Zeiss Apotome Imager.Z1 fluorescence microscope.
Electronic Supplementary Material (ESI) for NanoscaleThis journal is © The Royal Society of Chemistry 2013

Table S1. Summary of different synthetic methods for fluorescent silicon nanoparticles.
Silicon
precursor
Method Emission (QY) Size Functionalization/
application
Ref.
SiCl4 reduction with sodium
naphthalenide
blue (-) 2-10 nm --- 28
SiCl4 reduction with LiAlH4 blue (10 %) 1.4 nm bioimaging 29
Si(OMe)4 reduction with LiAlH4 blue (11-13 %) 1.6 nm bioimaging 30
SiCl4 reduction with LiAlH4 blue (13-23 %) 1-2 nm --- 31
SiCl4 reduction with NaPh2 blue (20 %) 1-4 nm --- 32
SiCl4,
hexyltrichloros
ilane,
reduction with LiAlH4 blue (25 %) 3 nm --- 33
diphenylsilane thermal degradation at 500°
and 345 bar
blue-green (23 %) 1-4 nm --- 16
Diphenylsilane thermal degradation at 500°
and 83 bar
blue to red
(---)
2-6 nm --- 17
tetramethylsila
ne/
tetraethylsilane
thermal degradation at 680 °
C
--- 1-10 nm --- 19
SiBr4 plasma assisted
decomposition
blue-green(24 %) 2-3 nm polymer coating (hydrodynamic
size 50 nm), cell imaging
23-24
silane laser pyrolysis followed by
HF-HNO3 etching
blue to red
(---)
5 nm --- 25
silane laser pyrolysis followed by
HF-HNO3 etching
red (17 % in
CHCl3, 2 % in
water)
4 nm micelle incorporated (50-120
nm), transferin functionalized
and cell imaging
26
silane laser pyrolysis followed by
HF-HNO3 etching
blue-NIR (---) 2-8 nm micelle encapsulated, in vivo
imaging
27
trichlorosilane pyrolysis followed by HF
etching
red-NIR (5-40 % in
toluene)
1-5 nm --- 22
octyltrichlorosi
lane
electrochemical reduction blue (6 %) 5 nm --- 34
Si wafer electrochemical etching in
presence of HF, H2O2,
polyoxometalate
blue-NIR (---) 1-4 nm --- 35
silicon wafer electrochemical etching red to NIR (10 %) 150
nm(porou
s)
in vivo application 36
hydrogen
silsesquioxane
thermal degradation at 500-
11000C followed by HF
etching
green-red (4 %) 3.4 nm --- 18
hydrogen
silsesquioxane
thermal degradation at
1100-12000C
NIR (26 %) 4 nm lipid capping, bioimaging 20
hydrogen
silsesquioxane
thermal degradation at
1100-14000C
red-NIR (0.4-8 %) 3-90 nm, -
---
---- 21
NaSi reaction with NH4Br blue (---) 4-5 nm -- 37
Mg2Si reaction with Br2 green (7 %) 2.4 nm functionalized with DNA 40
NaSi heating with NH4Br and
glutaric acid at 200 oC
green (13 %) 4 nm Gluteric acid functionalized,
bioimaging
38
Na4Si4 microwave heating with
NH4Br
blue (23 %) 3.4 nm --- 39
Si nanowire microwave heating with
glutaric acid
red (15 %) 4 nm antibody conjugated, cell
imaging
41
Si nanowire microwave heating with
immunoglobulin
red (18 %) 3.2 nm 40 nm hydrodynamic size,
bioimaging
42
Silicon pieces ball milling blue (60 %) <10 nm --- 43
Electronic Supplementary Material (ESI) for NanoscaleThis journal is © The Royal Society of Chemistry 2013

Table S2. Properties of various silicon nanoparticle prepared by present approach.
Sample Excitation/
Emission
Wavelength (nm)
Fluorescence
quantum yield1
()
Lifetime (ns)
Si-6 370 nm/430 nm 10 %a 0.8
Si-18 430 nm /500 nm 13 %b 0.01, 3.3, 9.2
Si-36 480 nm/570 nm 6 %c 1.4, 4.6
Si-48 480 nm/570 nm 6 %c 0.8, 2.7, 6.8
Si-72 515 nm/600 nm 8 %d 1.5, 4.6
Polymer
coated Si-722
515 nm/600 nm 5 %d 0.5, 1.9, 5.9
1Quantum yield was measured using different standards such as quinine sulfate
a, fluorescein
b, rhodamine
6Gc
and rhodamine Bd. Fluorescence quantum yield for each type of silicon nanoparticle is measured at
the excitation wavelength that produces maximum emission intensity.
2The quantum yield of polymer coated Si-6, Si-18, Si-36 and Si-48 nanoparticles are 10 %, 11 %, 3 %
and 3 %, respectively.
Electronic Supplementary Material (ESI) for NanoscaleThis journal is © The Royal Society of Chemistry 2013

Figure S1. TEM images of different size silicon nanoparticles under low and high magnifications. Size
distributions of these nanoparticles are shown in Figure 1.
Si-6
Si-6Si-48
Polymer coated Si-72Si-72 Polymer coated Si-72Si-72
Si-6
Si-48
Electronic Supplementary Material (ESI) for NanoscaleThis journal is © The Royal Society of Chemistry 2013
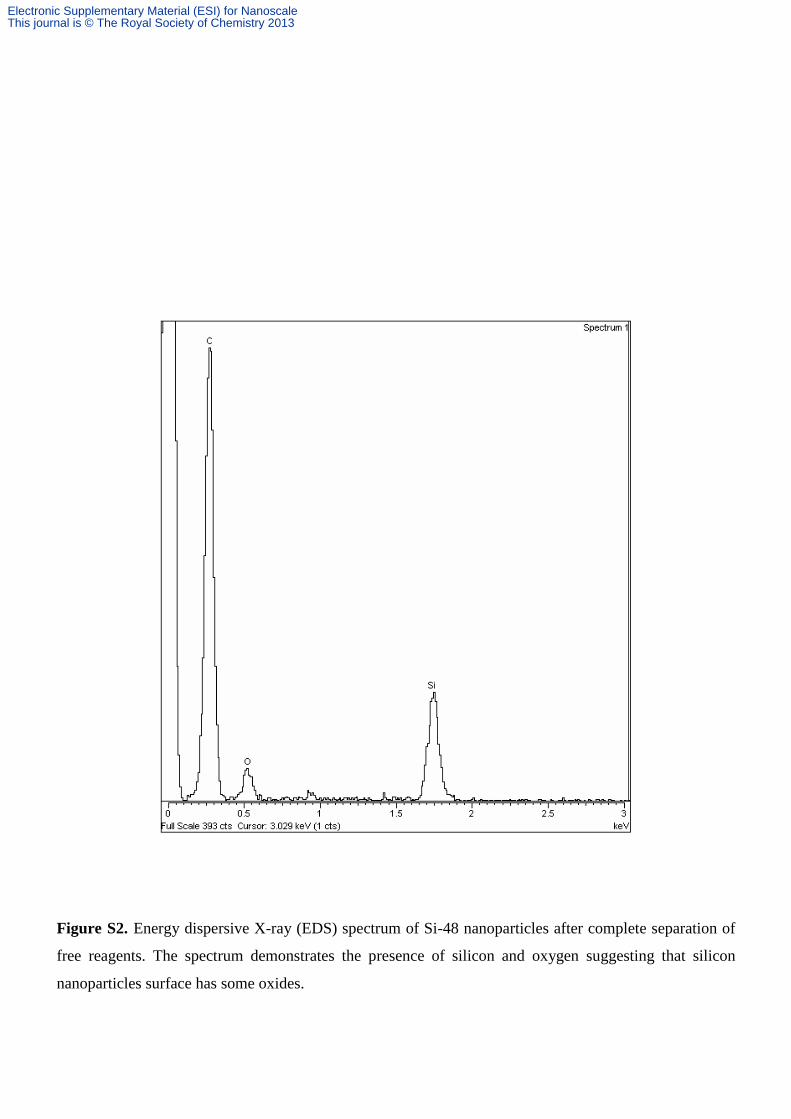
Figure S2. Energy dispersive X-ray (EDS) spectrum of Si-48 nanoparticles after complete separation of
free reagents. The spectrum demonstrates the presence of silicon and oxygen suggesting that silicon
nanoparticles surface has some oxides.
Electronic Supplementary Material (ESI) for NanoscaleThis journal is © The Royal Society of Chemistry 2013

4000 3500 3000 2500 2000 1500 1000 500
Wavenumber (cm-1
)
Si-72
% T
ran
smit
tan
ce
Polymer
Polymer coated Si-72
4000 3500 3000 2500 2000 1500 1000 500
% T
ran
smit
tan
ce
Wavenumber (cm-1
)
CDOS
ODA
Si-72
a) b)
Figure S3. a) FTIR spectra of chloro(dimethyl)octadecylsilane(CDOS), octadecylamine(ODS) and Si-72
nanoparticle. The strong peaks around 3000 cm-1
is due to C-H stretching of long chain hydrocarbons and
strong peaks around 3400 cm-1
is due to N-H/O-H stretching of octadecylamines/silanols. Si-C stretching
frequency present at 1245 cm-1
for CDOS is substantially decreased in Si-72, suggesting that Si-C bond in
chloro(dimethyl)octadecylsilane precursor is broken in nanoparticle formation condition. (b) FTIR spectra
of Si-72 nanoparticle, polymer and polymer coated Si-72 nanoparticle. The peaks at 1112 cm-1
and 1551
cm-1
in polymer coated samples indicates the presence of C-O and NH2 groups, respectively, which
proves effective polymer coating on the samples.
Electronic Supplementary Material (ESI) for NanoscaleThis journal is © The Royal Society of Chemistry 2013

0 100 200 300 400 500 600 700 8000
20
40
60
80
100
Wei
gh
t lo
ss (
%)
Temperature (0C)
CDOS
ODA
CDOS & ODA
Si-72
50 100 150 200 250-0.3
-0.2
-0.1
0.0
Heat
Flo
w (
W/g
)
Temperature (0C)
50 100 150 200 250
-0.6
-0.4
-0.2
0.0
Heat
Flo
w (
W/g
)
Temperature (0C)
a) b) c)
Figure S4. XPS spectra of (a) C 1s and (b) O 1s of purified Si-72 nanoparticles showing that silicon
nanoparticles consist of oxidized SiOxHy layer and passivating long chain octadecyl groups.
Deconvoluted C 1s has been fitted with two components and assigned as C-C/C-H bond (284.7 eV) and
carbon atoms bonded to electronegative element such as nitrogen or oxygen (286.8). Deconvoluted O 1s
spectrum fitted with three components with peaks at 530.7 eV, 531.7 eV and 533.3 eV. The first two
peaks are due to presence of Si-O and Si=O groups and third component comes from the surface hydroxyl
groups.
Figure S5. a) Thermogravimetric analysis of chloro(dimethyl)octadecylsilane(CDOS),
octadecylamine(ODA), mixture of CDOS and ODA and Si-72 nanoparticle, b) differential scanning
calorimetry of CDOS and c) differential scanning calorimetry of mixture of CDOS and ODA.
538 536 534 532 530 528 526
O 1s
Inte
nsi
ty (
CP
S)
Binding Energy (eV)290 288 286 284 282 280
Inte
nsi
ty (
CP
S)
Binding Energy (eV)
C 1sa b
Electronic Supplementary Material (ESI) for NanoscaleThis journal is © The Royal Society of Chemistry 2013
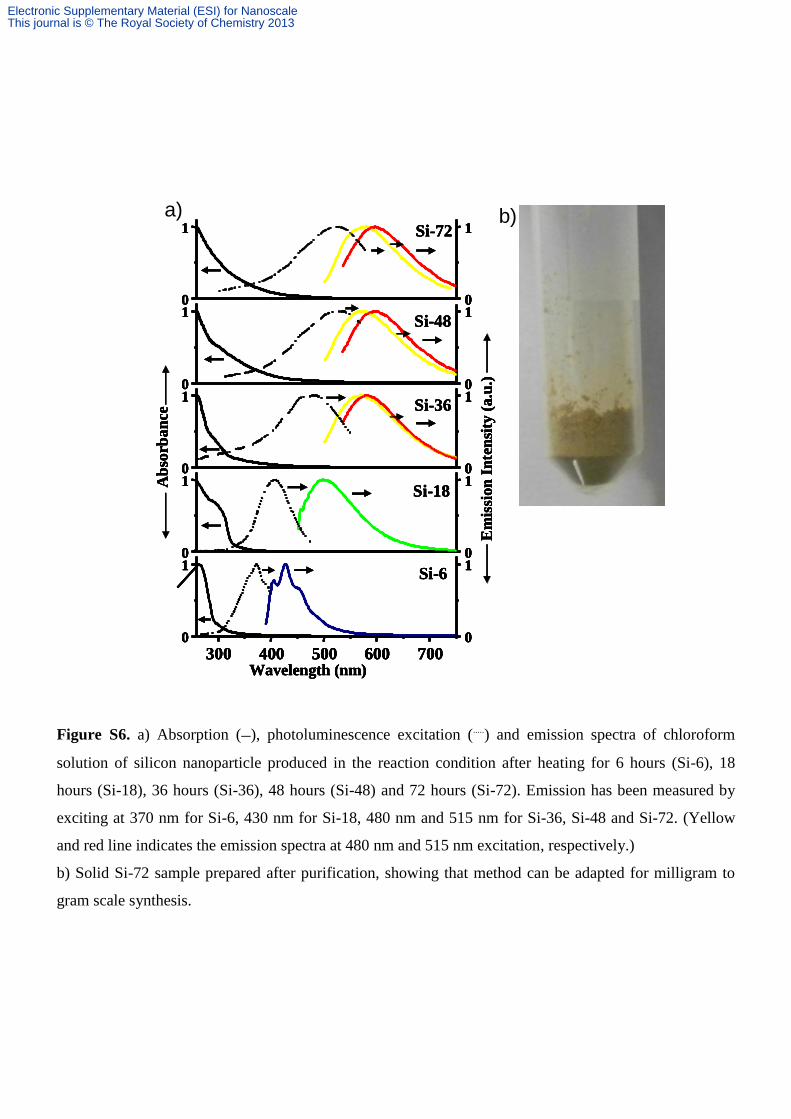
Figure S6. a) Absorption (—), photoluminescence excitation (…..) and emission spectra of chloroform
solution of silicon nanoparticle produced in the reaction condition after heating for 6 hours (Si-6), 18
hours (Si-18), 36 hours (Si-36), 48 hours (Si-48) and 72 hours (Si-72). Emission has been measured by
exciting at 370 nm for Si-6, 430 nm for Si-18, 480 nm and 515 nm for Si-36, Si-48 and Si-72. (Yellow
and red line indicates the emission spectra at 480 nm and 515 nm excitation, respectively.)
b) Solid Si-72 sample prepared after purification, showing that method can be adapted for milligram to
gram scale synthesis.
300 400 500 600 7000
1
0
10
1
0
10
1
0
10
1
0
10
1
0
1
Em
issi
on
In
ten
sity
(a
.u.)
Ab
sorb
an
ce
Wavelength (nm)
Si-6
Si-18
Si-36
Si-48
Si-72
300 400 500 600 7000
1
0
10
1
0
10
1
0
10
1
0
10
1
0
1
Em
issi
on
In
ten
sity
(a
.u.)
Ab
sorb
an
ce
Wavelength (nm)
Si-6
Si-18
Si-36
Si-48
Si-72
300 400 500 600 7000
1
0
10
1
0
10
1
0
10
1
0
10
1
0
1
Em
issi
on
In
ten
sity
(a
.u.)
Ab
sorb
an
ce
Wavelength (nm)
Si-6
Si-18
Si-36
Si-48
Si-72
300 400 500 600 7000
1
0
10
1
0
10
1
0
10
1
0
10
1
0
1
300 400 500 600 7000
1
0
10
1
0
10
1
0
10
1
0
10
1
0
1
Em
issi
on
In
ten
sity
(a
.u.)
Ab
sorb
an
ce
Wavelength (nm)
Si-6
Si-18
Si-36
Si-48
Si-72
a) b)
Electronic Supplementary Material (ESI) for NanoscaleThis journal is © The Royal Society of Chemistry 2013

Figure S7. Microscopic image of films of Si-6 (a, b, c), Si-18 (d, e, f) and Si-72 (g, h, i) which are
captured by depositing their respective chloroform solutions on the glass slide. The images are acquired
under bright field (a, d, g) or fluorescence modes under UV excitation (b), blue excitation (c, e, h) and
green excitation (f, i).
Electronic Supplementary Material (ESI) for NanoscaleThis journal is © The Royal Society of Chemistry 2013

Figure S8. Emission spectra of Si-6 (a), Si-18 (b), Si-36 (c), Si-48 (d), Si-72 (e) and polymer coated Si-
72 (f) under different excitation wavelengths.
Electronic Supplementary Material (ESI) for NanoscaleThis journal is © The Royal Society of Chemistry 2013
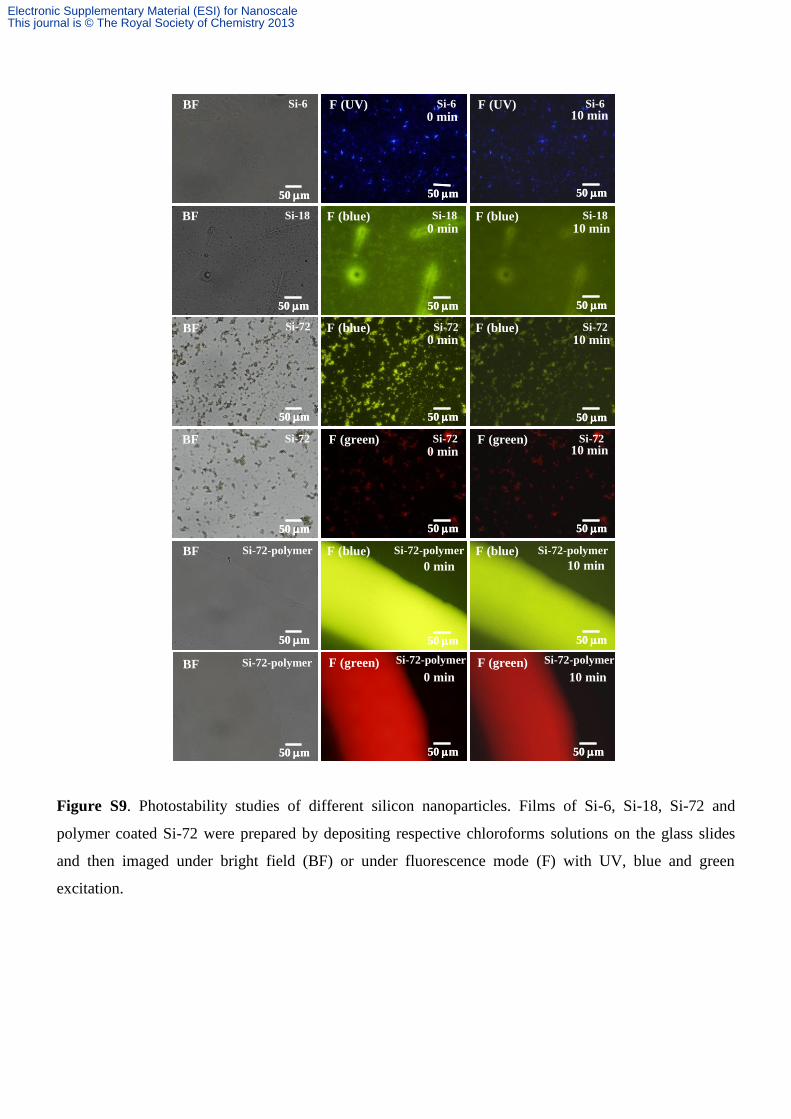
Figure S9. Photostability studies of different silicon nanoparticles. Films of Si-6, Si-18, Si-72 and
polymer coated Si-72 were prepared by depositing respective chloroforms solutions on the glass slides
and then imaged under bright field (BF) or under fluorescence mode (F) with UV, blue and green
excitation.
S8
50 m50 m50 m
0 min
50 m
0 min
50 m50 m
10 min
50 m
10 min
50 m50 m
50 m50 m50 m
0 min
50 m
0 min
50 m50 m
10 min
50 m
10 min
50 m50 m
10 min
50 m
10 min
50 m50 m
0 min
50 m
0 min
50 m50 m50 m50 m50 m
50 m50 m50 m 50 m
0 min
50 m50 m
0 min
50 m
10 min
50 m50 m
10 min
50 m50 m50 m 50 m
0 min
50 m50 m
0 min
50 m
10 min
50 m50 m
10 min
50 m50 m50 m 50 m
0 min
50 m50 m
0 min
50 m
10 min
50 m50 m
10 min
Si-6
Si-18
Si-72
Si-72
Si-72-polymer
Si-72-polymer
BF
BF
BF
BF
BF
BF
F (UV)
F (blue)
F (blue)
F (green)
F (blue)
F (green)
Si-6 Si-6F (UV)
F (blue)Si-18 Si-18
F (blue)Si-72 Si-72
Si-72 Si-72F (green)
Si-72-polymer Si-72-polymerF (blue)
Si-72-polymerF (green)Si-72-polymer
Electronic Supplementary Material (ESI) for NanoscaleThis journal is © The Royal Society of Chemistry 2013

Figure S10. Emission spectra of solid Si-72 nanoparticle at different temperatures, showing that emission
decreases with the increasing temperature.
Electronic Supplementary Material (ESI) for NanoscaleThis journal is © The Royal Society of Chemistry 2013

Figure S11. Fluorescence lifetime decay spectra of solutions of Si-6 (a), Si-18 (b), Si-36 (c), Si-48 (d),
Si-72 (e) and polymer coated Si-72 (f). Blue and red lines correspond to experimental and fitted data,
respectively.
Electronic Supplementary Material (ESI) for NanoscaleThis journal is © The Royal Society of Chemistry 2013
a) b) c)
500 550 600 650 700 7500
3500
7000
Em
issi
on
In
ten
sity
(a.u
.)
Wavelength (nm)
control
Si-folate
500 550 600 650 700 7500
3500
7000
Em
issi
on
In
ten
sity
(a.u
.)
Wavelength (nm)
control
Si-folate
500 550 600 650 700 7500
4000
8000
12000
Em
issi
on
In
ten
sity
(a.u
.)
Wavelength (nm)
control
Si-folate
500 550 600 650 700 7500
4000
8000
12000
Em
issi
on
In
ten
sity
(a.u
.)
Wavelength (nm)
control
Si-folate
300 400 500 6000.0
0.5
1.0
1.5
Ab
sorb
an
ce
Wavelength (nm)
control
Si-folate
300 400 500 6000.0
0.5
1.0
1.5
Ab
sorb
an
ce
Wavelength (nm)
control
Si-folate
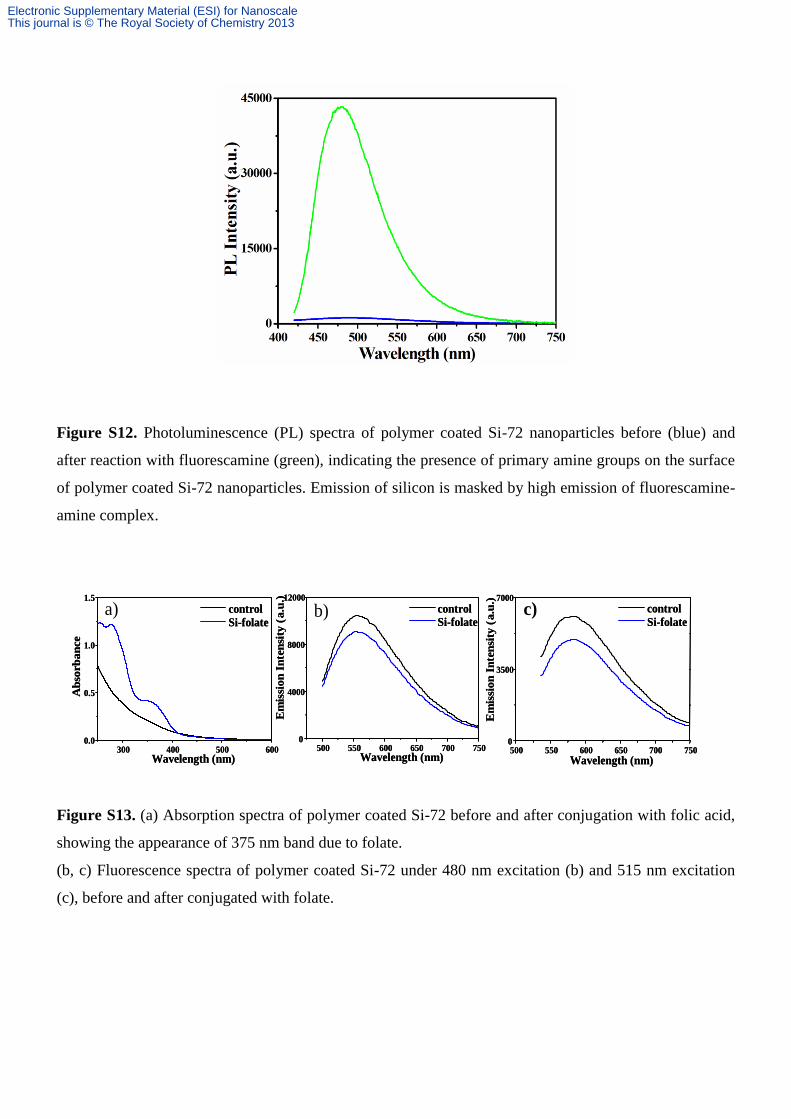
Figure S12. Photoluminescence (PL) spectra of polymer coated Si-72 nanoparticles before (blue) and
after reaction with fluorescamine (green), indicating the presence of primary amine groups on the surface
of polymer coated Si-72 nanoparticles. Emission of silicon is masked by high emission of fluorescamine-
amine complex.
Figure S13. (a) Absorption spectra of polymer coated Si-72 before and after conjugation with folic acid,
showing the appearance of 375 nm band due to folate.
(b, c) Fluorescence spectra of polymer coated Si-72 under 480 nm excitation (b) and 515 nm excitation
(c), before and after conjugated with folate.
Electronic Supplementary Material (ESI) for NanoscaleThis journal is © The Royal Society of Chemistry 2013

0
25
50
75
100
2.331.621.160.640.14
Cel
l V
iab
ilit
y (
%)
Concentration (mg/mL)
control
Si-folate
0
25
50
75
100
2.331.621.160.640.14
Cel
l V
iab
ilit
y (
%)
Concentration (mg/mL)
control
Si-folate
Figure S14. Fluorescence images of HeLa cells after labeling with polymer coated Si-72 nanoparticle
showing that it does not label cells as nanoparticle is not functionalized with folic acid. Cells were labeled
with nanoparticle and hoechst dye and imaged under differential interference contrast (DIC) mode (a) or
fluorescence mode with UV excitation (b), blue excitation (c) and green excitation (d). Blue emission
under UV excitation is due to nucleus staining by hoechst dye.
Figure S15. Viability of HeLa cells after 24 hours incubation with different concentrations of polymer
coated Si-72 (control) and folic acid conjugated functionalized Si-72 nanoparticle (Si-folate).
Electronic Supplementary Material (ESI) for NanoscaleThis journal is © The Royal Society of Chemistry 2013
Top Related