


Languages
Pages
Legal

Interaction of phosphonates onto the immobilized surface:
Nan Zhang
Rice University
March, 2013
Application to scale control in oil and gas flow assurance

Outline
• Background and previous batch study
• Hypothesis/Objectives
• Challenges and Methods
• Results
• Conclusions

Scale in oil and gas flow assurance (CaCO3,
FeCO3 ,CaSO4, BaSO4, SrSO4 , etc.)
Changes of temperature and pressure.
Variations of pH and CO2/H2S partial pressure during
operation.
Mixing of incompatible waters.
Effect of other constitnents.
Fouling in heat exchanger (CaCO3, CaSO4, etc.)
Fouling on the membrane surface (CaSO4,
BaSO4 ,etc.)
Scale in water transporting system

How much scale could potentially form ?
esprecipitat calcite and ated"supersatur" 0,
formt doesn' scale and m"equilibriu" zero,
dissolves calcite and ated"undersatur" 0,
SI
Scale tendency

Scale control with threshold inhibitor
Conventional onshore and Unconventional offshore reservoir
Pushing and fixing inhibitors into the formation via squeeze
treatment
Inject trace inhibitors downhole via a treat string
Unconventional onshore reservoir
Inject trace inhibitors with the fracturing fluid
DTPMP
(methylene phosphonic acid)
NTMP
(Methylene phosphonic acid)

Inhibitor return after squeeze treatment
Well NameDownhole
Temperature (F)TDS (mg/L)
Ca
(mg/L)ΔSI
Minimum
Inhibitor
Needed
Gladys
McCall298 96340 4130 1.04 0.18
N.R. Smith 160 50899 480 0.43 <0.7
0
1
10
100
1000
3.E+01 5.E+05 1.E+06 2.E+06
Ph
osp
ho
na
te (
mg
/L)
Volumes of Produced Water (bbl)
N. R. Smith
0
1
10
100
1000
3.E+01 1.E+07 2.E+07
Ph
osp
ho
na
te (
mg
/L)
Volumes of Produced Water (bbl)
Gladys McCall
Inhibitor return concentration is dropping to a few mg/L level in the early flowback stage,
but the interaction mechanism between the phosphonate inhibitor and scale is unclear,
so the return concentration of the inhibitor is unpredictable.

Phosphonates attachment to calcite surface(Previous Batch Study)
Crystal growth
Langmuir adsorption
CaCO3
Amorphous growth
Kan et al., JCIS, 2005
0.01
0.1
1
10
100
1000
10000
100000
0.00001 0.001 0.1 10 1000
Solution Phase Na4H2NTMP Conc. (mmol/L)
So
lid
Ph
ase N
TM
P C
on
c.
(m
ol/
m2
)
1, Langmuir adsorption
2, Crystal growth
3, Heterogeneous crystal growth
Tomson et al., SPE, 2003
Adsorption
precipitation
Solution Phase Na4H2NTMP Conc. (mmol/L)

Solubility of Ca-Inhibitor precipitates (Previous Batch Study)
Inhibitor Stoichiometry Solubility product
PKsp at 1 M
I, 70 ºC
Solubility1
(mg/L)
NTMP CaH4P
Ca2.5HP (am)
Ca2.5HP (cr)
Fe2.5HP (aged) )K(T/1315)M(I18.2)M(I6.14- 39.54
)K(T/2023)M(I76.1)M(I5.32- 32.92
)K(T/2380)M(I17.2)M(I6.88-32.96
46.32
32.46
21.31
23.46
31.74
22502
174
0.92
0.0953
DTPMP Ca3H4P (am)
Ca3H4P (cr) )K(T/5.2084I(M)0.04858.95
C70 I, M 2-1 @ 0.55
50.5
52.9
250
1.05
BHPMP Ca4H2P (am)
Ca4H2P (cr) )K(T/2998I(M)2.60- 48.46
)K(T/3448I(M)2.65-48.11
35.41
37.12
385
7.0
PPCA Ca3(A·A·A)2
(aged) 16.35 + 0.24·I(M) –252.1/(T( K) - 252.1) 13.82 1.45
Kan et al. Biogeochemistry of chelating agents chapter 15, 2005
The formation of CaPhn/FePhn precipitates with a low solubility may contribute to the
low inhibitor return concentrations

Inhibitor may deposit and retain on the surface by working with
the possible scale, such as CaCO3
Scaling risk can be controlled with a pulse injection of inhibitor
Objectives
1. Develop a CaCO3 pre-coated steel tubing for studies of
CaCO3 crystal growth kinetics and inhibition kinetics.
2. Evaluate the attachment kinetics of inhibitor on the surface
3. Investigate the detachment kinetics and equilibrium of
inhibitor from the surface and its inhibition impact on the
CaCO3 scaling to the pipe.
Hypothesis

Challenges No robust experimental method for kinetics study
Difficult to convert beaker result to real prediction
Limited information on inhibitor performance
MethodConventional
free drift
Rotating
disc
Constant
composition
Plug flow
reactor
Modified
Plug flow
reactor
(this study)
Surface area Variable Constant Variable Variable Constant
Saturation index Variable Variable Constant Constant Constant
Ionic strength Variable Variable Constant Constant Constant
pH Variable Variable Constant Constant Constant
Hydraulic
conditionNo Yes No Yes Yes
Ultra High
Temp/PressureHard Hard Hard Easy Easy

Modified Plug flow reactor Modified carbon steel tube (AISI1010, 5in length, ¼ in OD)
1. Coat the outer surface with rust-oleum for corrosion control
2. Polish inner surface with sandpaper to create a smooth surface for
CaCO3 deposition

Modified Plug flow reactor 3. Precoat uniform CaCO3 layer on the subsurface
Provide constant surface area
Eliminate initial preferential attachment
Time (hr)
0 2 4 6 8 10 12
C/C
0
0.84
0.86
0.88
0.90
0.92
0.94
0.96
0.98
1.00
1.02
Ca Conc.
Tubing surface area
A=18.3 cm2
Crystal surface area
A=55 cm2
Aragonite
Calcite

Water Bath
75 psi
Sample Collection & Analysis: ICP, ICP-MS
Soln. B NaHCO3+ NaCl
Apparatus
y = 0.001xR² = 0.999
00.10.20.30.40.50.6
0 200 400 600
Inte
nsi
ty
P conc. (ug/L)
ICP_MS STD P
100
% C
O2
Soln. A CaCl2+ NaCl
Parameter Value
Flow rate 10 -250 ml/min
Reactor I.D. 1/8 inch
Reactor Length 5 inch
Temperature 70 °C
Reactor volume 2.09 cm3
Residence time 75sec- 12.6 min
Reynolds’s
number9-100
Reactor:
Carbon steel AISI1010 tubing pre-
coated with CaCO3
pump
pump

Inhibitor attachmentC0= 680ppm, ΔSI_CaCO3= 0.6, 0.2-1330 mg/L DTPMP, pH= 5.9, 70C, Q=100ml/h for 1 hr
• The break through occurs in 20 min
• Inhibitor cannot accumulate on the surface with time
0
0.2
0.4
0.6
0.8
1
1.2
0 10 20 30 40 50
DT
PM
P E
fflu
ent
C/C
0
Time (min)
0.2 mg/L 2.5 mg/L 5 mg/L 50 mg/L
100 mg/L 363 mg/L 1331 mg/L K tracer

Inhibitor conc. effect on the attachment
.
DTPMP
(injected)
DTPMP
(retaine
d)
q
mg/L mg/m2
0.22 0.20
2.5 2.01
5 7.05
10 18.73
47 56.89
102 107.39
363.6 127.10
1331.8 128.78
Inhibitor attachment on the calcite surface (surface area 55cm2)
f=129.4087*(1-exp(-0.0145*x))
DTPMP (mg/L)
0 200 400 600 800 1000 1200 1400
q (
mg/m
2)
0
20
40
60
80
100
120
140

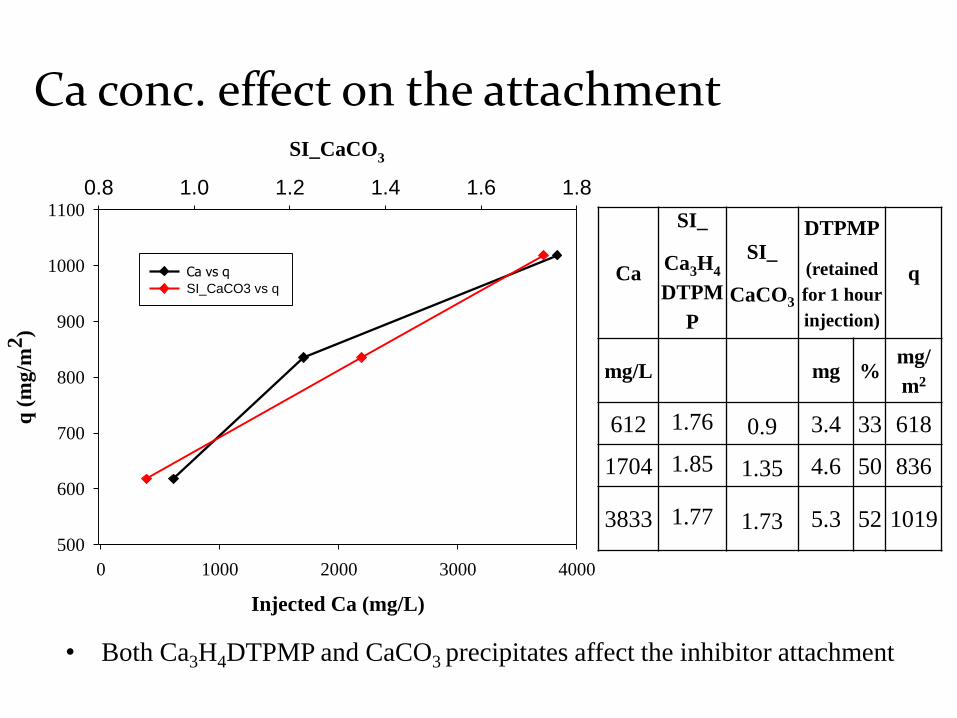
Cca= 612-3833 mg/L, 100 mg/L DTPMP, pH= 6.2, 70C, Q=100ml/h
Ca conc. effect on the attachment
0
0.2
0.4
0.6
0.8
1
1.2
0 60 120 180 240 300 360 420 480
C/C
0
Time (min)
Ca=612 mg/L Ca=1704 mg/L Ca=3833 mg/L
• The break through didn’t occur
• Inhibitor can accumulate on the surface with time
Injected Ca (mg/L)
0 1000 2000 3000 4000
q (
mg
/m2)
500
600
700
800
900
1000
1100
SI_CaCO3
0.8 1.0 1.2 1.4 1.6 1.8
Ca vs q
SI_CaCO3 vs q
Ca conc. effect on the attachment
Ca
SI_
Ca3H4
DTPM
P
SI_
CaCO3
DTPMP
(retained
for 1 hour
injection)
q
mg/L mg %mg/
m2
612 1.76 0.9 3.4 33 618
1704 1.85 1.35 4.6 50 836
3833 1.77 1.73 5.3 52 1019
• Both Ca3H4DTPMP and CaCO3 precipitates affect the inhibitor attachment

CaCO3 facilitates phosphonate retention
Ca HCO3
SI_
Ca3H4
DTPM
P
SI_
CaCO3
q
mg/Lmg/
m2
579 1224 2.09 0.01 59.2
583 1770 2.02 0.34 60.64616
581 2538 1.86 0.66 71.1
612 3274 1.76 0.9 609
1704 3274 1.85 1.35 835
3833 3274 1.77 1.73 966
0
200
400
600
800
1000
1200
0.0 0.5 1.0 1.5 2.0
q (
mg
/m2
)
CaCO3 SI
• SICaCO3 > 0.9, Ca concentration control the inhibitor attachment
• SICaCO3 > 0.6, Phosphonates concentration control the inhibitor attachment
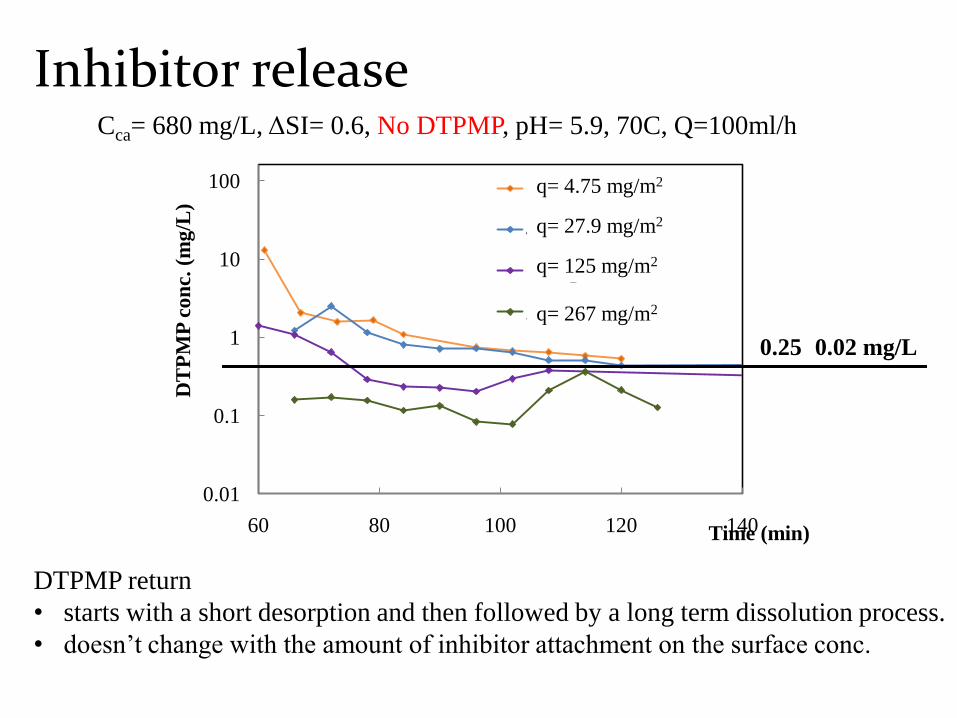
Inhibitor release
DTPMP return
• starts with a short desorption and then followed by a long term dissolution process.
• doesn’t change with the amount of inhibitor attachment on the surface conc.
0.01
0.1
1
10
100
60 80 100 120 140
DT
PM
P c
on
c. (
mg
/L)
Time (min)
102.5 mg/L DTPMP
47.4 mg/L DTPMP
10 mg/L DTPMP
2.5 mg/L DTPMP
0.25 0.02 mg/L
Cca= 680 mg/L, ΔSI= 0.6, No DTPMP, pH= 5.9, 70C, Q=100ml/h
q= 4.75 mg/m2
q= 27.9 mg/m2
q= 125 mg/m2
q= 267 mg/m2

“Memory effect” of inhibitor release
Time (min)0 500 1000 1500 2000 2500
DT
PM
P (
mg
/L)
0
20
40
60
80
100
Ca
(m
g/L
)
0
200
400
600
800
DTPMP
Ca
Time (min)0 100 200 300 400 500 600 700
DT
PM
P (
mg/L
)
0.00
0.05
0.10
0.15
0.20
0.25
0.30
Ca (
mg/L
)
0
200
400
600
800
DTPMP
Ca
DTPMP
(injected)
Injection
time
DTPMP
(retained)q
Protection
time
mg/L hr mg % mg/m2 hr
0.22 1 0.003 1.04 0.41 5.7
47.4 1 0.69 1.45 125 17
SI_CaCO3=0.59

Ca Concentration effect
• Ca precipitation and dissolution were both prevented.
• DTPMP failed when SI_CaCO3 > 1.1
• DTPMP return increased with a lower SI_CaCO3 .
050010001500200025003000350040004500
0.0
0.5
1.0
1.5
2.0
2.5
180 240 300 360 420 480
DT
PM
P (
mg
/L)
Time (min)DTPMP Ca
Ca
(mg
/L)
SI=0.74 SI=1.1 SI=-3.3 SI=-0.28
Ca HCO3 SI pH
mg/L mg/L
612.37 1643.73 0.29 5.89
1703.86 1643.73 0.74 5.90
3969.95 1643.73 1.11 5.92
0.175 1643.73 -3.25 5.88
163.69 1691.89 -0.28 5.88
SI=0.29

0
1
10
100
60 110 160 210 260 310 360
DT
PM
P (
mg
/L)
Time (min)
10 ml/hr
50 ml/hr
100 ml/hr
250 ml/hr
QLinear
Velocity
Return
DTPMP
Steady state
ml/hr cm/sec mg/L
10 0.017 1.3
50 0.08 0.4
100 0.17 0.25
250 0.42 0.12
Flow rate effect on the inhibitor release

Linear
Velocity
Return
DTPMP
Steady
state
Solubility
(cs)
Overall
Dissolution
rate
constant (k)
Mass
transfer
rate
constant
cm/sec mg/L mg/L sec-1 cm/sec
0.017 1.3
1.73 0.00182.86
E-4
0.08 0.4
0.17 0.25
0.42 0.12
Advection Dissolution
L/v £s(sec)
0 200 400 600 800
DT
PM
P S
.S.
Eff
luen
t C
on
c.
(mg
/L)
0.0
0.2
0.4
0.6
0.8
1.0
1.2
1.4

Pipe length at equilibrium (c=cs)
Q=1000 bbl/d,
I.D.=2.5-4 inch,
v=22.7-57.9 cm/sec,
km=2.86 E-4 cm/sec,
c/cs=1-exp(-3)=0.95
L=1250-3200 ft
0
0.2
0.4
0.6
0.8
1
1.2
0 1000 2000 3000 4000
c/cs(DTPMP)
pipe length (ft)
ID=4 inch ID=2.5 inch

Inhibitor-Saturation Index Relationship
At a specific T, SI, pH, and molar ratio (cation/anion) for
each specific inhibitor concentration, , there is a
unique saturation index value, , for those conditions.
These were solved for using Goal Seek. Illustrated here for
barite, the same applies for calcite.
32 40 1
2
31 2 4 5 10 2
4
10
0
10 ^
[ ]log
[ ]
1( / ) log
Barite
Barite Bartie
Barite
Inh Bartie
Barite Bartie
safety InhBarite
Inh Barite Barite
Inh
aa at a
SI TK SI TK
b Ba Mb b b SI b pH b
TK SO M
f tC mg L
b t
( / )Barite
InhC mg L
BartieSI

0.5
0.75
1
1.25
1.5
1.75
2
2.25
0
0.5
1
1.5
2
2.5
0 1000 2000 3000 4000 5000 6000
Ca
lcit
e a
nd
ba
rite
Sa
tura
tio
n I
nd
exes
DT
PM
P (
mg
/L),
blu
e d
iam
on
ds
Feet of flow in 2.5in. pipe with
Ca-DTPMP on steel surface
Barite
Calcite

Conclusion The phosphonate inhibitor layer was built up on the pipe
surface with CaCO3 pre-coated layer.
Amount of inhibitor attached is related with the DTPMP
adsorption on the CaCO3 surface.
CaCO3 can facilitate the inhibitor attachment on the
surface, may suggest the copercipitation of CaCO3 and
CaPhn crystal.
The DTPMP return is controlled by the dissolution of the
Ca3H4DTPMP precipitates attached on the surface with a
dissolution rate about 0.0018 cm-1.
Ca precipitation and dissolution were both prevented.

Acknowledgements
• Rice Brine Chemistry Consortium (BCC)
• Fellowship, China Scholarship Council
[Grant 2008102375] (2008-prsent)
• DOE (DE-FE0001910)
•Dr. Mason Tomson and Dr. Amy Kan