


Languages
Pages
Legal


RESEARCH ARTICLE
Sexual and individual foraging segregation in
Gentoo penguins Pygoscelis papua from the
Southern Ocean during an abnormal winter
Jose C. Xavier1,2*, Philip N. Trathan2, Filipe R. Ceia1, Geraint A. Tarling2, Stacey Adlard2,
Derren Fox2, Ewan W. J. Edwards2, Rui P. Vieira1¤, Renata Medeiros3, Claude De Broyer4,
Yves Cherel5
1 Marine and Environmental Sciences Centre, Department of Life Sciences, University of Coimbra, Coimbra,
Portugal, 2 British Antarctic Survey, Natural Environment Research Council, High Cross, Madingley Road,
Cambridge, UK, 3 Cardiff University, Cardiff School of Biosciences, Sir Martin Evans Building, Cardiff, United
Kingdom, 4 Royal Belgian Institute of Natural Sciences, OD Taxonomy and Phylogeny, Rue Vautier 29,
Bruxelles, Belgium, 5 Centre d´Etudes Biologiques de Chize, UPR 7372 du CNRS-Universite de La Rochelle,
Villiers-en-Bois, France
¤ Current address: Graduate School of the National Oceanography Centre Southampton, University of
Southampton, Waterfront Campus, European Way, Southampton, United Kingdom.
Abstract
Knowledge about sexual segregation and gender-specific, or indeed individual specializa-
tion, in marine organisms has improved considerably in the past decade. In this context, we
tested the “Intersexual Competition Hypothesis” for penguins by investigating the feeding
ecology of Gentoo penguins during their austral winter non-breeding season. We consid-
ered this during unusual environmental conditions (i.e. the year 2009 had observations of
high sea surface and air temperatures) in comparison with the long term average at Bird
Island, South Georgia. Through conventional (i.e. stomach contents) and stable isotopic
values from red blood cells, plasma and feathers of both male and female Gentoo penguins,
we showed that there were significant differences between sexes, with males feeding mainly
on fish (54% by mass) followed by crustaceans (38%) whereas females fed mainly on crusta-
ceans (89% by mass) followed by fish (4%). Themisto gaudichaudii was the most important
crustacean prey for males (64% by mass; 82% by number; 53% by frequency of occurrence)
and females (63% by mass; 77% by number; 89% by frequency of occurrence), contrasting
with all previous studies that found Antarctic krill Euphausia superba were generally the main
prey. Stable isotopic data showed that, in terms of habitat use (based on δ 13C), there were
significant differences in short-term carbon signatures between males and females (based
on plasma and red blood cells), suggesting that both sexes explored different habitats, with
females exploring more offshore pelagic waters and males feeding more in coastal benthic
waters. Based on δ 15N, males fed on significantly higher trophic level than females (based
on plasma and red blood cells), in agreement with our diet results., Thus, Gentoo penguins
behave in a similar manner to other non-breeding penguins species (e.g. king, macaroni
and rockhopper penguins), albeit at a smaller spatial scale (as they do not disperse as these
other penguins do), in that they have a wider habitat and trophic niche during the Antarctic
Winter (in comparison to Summer). We also detected individual specialization in feeding/
PLOS ONE | https://doi.org/10.1371/journal.pone.0174850 March 31, 2017 1 / 25
a1111111111
a1111111111
a1111111111
a1111111111
a1111111111
OPENACCESS
Citation: Xavier JC, Trathan PN, Ceia FR, Tarling
GA, Adlard S, Fox D, et al. (2017) Sexual and
individual foraging segregation in Gentoo penguins
Pygoscelis papua from the Southern Ocean during
an abnormal winter. PLoS ONE 12(3): e0174850.
https://doi.org/10.1371/journal.pone.0174850
Editor: Erik V. Thuesen, Evergreen State College,
UNITED STATES
Received: June 15, 2016
Accepted: March 16, 2017
Published: March 31, 2017
Copyright: © 2017 Xavier et al. This is an open
access article distributed under the terms of the
Creative Commons Attribution License, which
permits unrestricted use, distribution, and
reproduction in any medium, provided the original
author and source are credited.
Data Availability Statement: The relevant data are
included in the paper and its Supporting
Information file. For further data requests, please
contact the corresponding author at jccx@cantab.
net.
Funding: This work is part of SCAR AnT-ERA,
ICED, BAS-CEPH programs. JX is supported by the
Investigator FCT program (IF/00616/2013) and
FRC is supported by the Foundation for Science
and Technology (Portugal) and the European
Social Fund (POPH, EU) through a post-doc grant
trophic levels for each gender, with certain males feeding mainly on fish and certain females
mainly on crustaceans, which may be driven the prevailing environmental conditions that
lead individuals to search for alternative prey, and cause sexual diet segregation. Our results
provide further information to help improve understanding about sexual segregation and indi-
vidual specialization of marine organisms, while contributing valuable information on the win-
ter diet for Antarctic monitoring programs and for modelling Antarctic marine food webs.
Introduction
Understanding the natural variability of a marine ecosystem, and how organisms are able to
adapt/acclimatize to environmental change, is crucial to the conservation and management of
marine ecosystems. In the Southern Ocean, the network of food web interactions is now recog-
nised as being important in determining the resilience, and hence response, of marine ecosys-
tems to change [1, 2]. With the Southern Ocean currently showing signs of unusually rapid
warming [3–7], habitat modification is affecting species at all trophic levels, but particularly
those species at higher trophic levels that might integrate and/or amplify effects of change, e.g.
penguins [8–14].
Penguins (Spheniscidae) are a major component of the Antarctic marine ecosystem, consti-
tuting approximately 80% of the avian biomass, and as such occupy an important role as
meso-predators [15, 16]. Information on the diet and feeding ecology of penguins is vital for
parameterising consumption models in Antarctic food webs [17–19]. However, it is currently
unknown how penguin behaviour could adapt to change, over the longer term (i.e. decades),
to exploit alternative prey types [17]. Some studies have suggested that penguins may have dif-
fering success in adapting to the loss of Antarctic krill Euphausia superba [20] or fish [21] in
their diets. Such changes could then be linked to changes in populations; for example, Adelie
penguins Pygoscelis adeliae on the Antarctic Peninsula are declining, whereas Gentoo penguins
Pygoscelis papua [22, 23] are increasing, though data are not yet sufficiently comprehensive.
In this study, we assess the feeding ecology of a predator of the Southern Ocean, the Gentoo
penguin, at Bird Island, South Georgia (54˚ S, 38˚ W; Fig 1), during the austral winter, to assess
their levels of sexual and individual segregation. We consider this under unusual and extreme
environmental conditions, assuming that this will ensure differences between genders are
more extreme. Gentoo penguins are an inshore-feeding species and a year-round resident [24,
25], making them an excellent biological sampler of local prey abundance/availability, particu-
larly in inshore areas. The foraging range of Gentoo penguins is generally within 30 km of
South Georgia [25, 26], and their diet comprises largely Antarctic krill and fish [26–28].
Male Gentoo penguins are typically larger than females (i.e. dimorphic), although the dif-
ferences can be difficult to detect visually in the field [28, 29] as body size and morphology are
highly variable [30, 31]. Sexual segregation in birds is often linked to differing energetic con-
straints or nutrient requirements (particularly during the breeding season or related to repro-
duction duties) [32–34] and relatively little is known about sexual differences in the feeding
ecology of seabird species during their non-breeding period [27, 28, 32, 35–38]. Furthermore,
only a very few studies are available that explore individual specialization in the foraging and
feeding strategies of penguins [39], with only one on individual specialization in the diet of
Gentoo penguins at the Kerguelen archipelago during the austral summer [40]. Differences
between individuals may have a strong impact on ecological processes (e.g. competition
within/between sexes) and on population/species dynamics, as it may promote speciation [41].
Foraging segregation in penguins
PLOS ONE | https://doi.org/10.1371/journal.pone.0174850 March 31, 2017 2 / 25
(SFRH/BPD/95372/2013). RPV is currently
supported by a doctoral grant from the Portuguese
Science Foundation (SFRH/BD/84030/2012). This
study benefited from the strategic program of
MARE, financed by FCT (MARE - UID/MAR/04292/
2013)”.
Competing interests: The authors have declared
that no competing interests exist.

Therefore, it is important to understand both diet segregation and individual specialization
within a population. In our study, we looked at these mechanisms when animals have no
reproductive obligation (to assess their diet flexibility) during the austral winter at Bird Island,
South Georgia.
We focused on a period of unusual environmental conditions as such conditions are most
likely to reveal individual differences, and because information on such conditions is impor-
tant as they are likely to affect the ecology, management and conservation of Antarctic ecosys-
tems [42].
Ocean warming has been recorded at South Georgia during the austral winter (i.e. August),
with a mean increase of ~2.3˚ C since 1925 [43]. In 2009 (when our study took place), high sea
surface and temperatures occurred across many consecutive months, and coincided with
extremely low catches in local fisheries and poor breeding success in higher predators at South
Georgia [44, 45] (Fig 2). Prior to the fieldwork at Bird Island, a research cruise (March-April
2009) in the Scotia Sea (including around South Georgia), showed that Antarctic krill density
was lower (2.2 g m-2) than in previous years (Antarctic krill density assessments made annually
since 1996) [46]. These findings suggest that this region, during the austral winter of 2009, was
atypical for prey availability/abundance to penguins and other predators in the region. Indeed,
anomalous oceanographic, sea-ice and/or weather conditions can cause changes in prey avail-
ability [12, 47, 48] and are known to have negative impacts on populations of seabirds, includ-
ing mass mortalities (also known as “wrecks” of seabirds) [49–52].
Fig 1. Map of the Southern Ocean, with emphasis to Bird Island, South Georgia (our study area) and the 1,000 m isobaths.
https://doi.org/10.1371/journal.pone.0174850.g001
Foraging segregation in penguins
PLOS ONE | https://doi.org/10.1371/journal.pone.0174850 March 31, 2017 3 / 25

In the context of low Antarctic krill abundance, the behaviour of male and female penguins
could provide valuable data on diet sexual segregation and individual specialization. The
“Intersexual Competition Hypothesis” (see also [53] for intraspecific competition) predicts
that, in dimorphic species, reduction in competition for food between sexes results from the
capture of different prey types by each sex and that this is one of the main selective forces
maintaining sexual dimorphism [54, 55]. Here, we had the unique opportunity to investigate
the feeding ecology of Gentoo penguins during an oceanographically abnormal non-breeding
season. The objectives of the study were:
• Characterize the winter diet of Gentoo penguins using conventional techniques (i.e. stomach
contents), and stable isotope analyses of red blood cells, plasma and feathers to evaluate diet
changes, under known environmental conditions;
• Evaluate differences in diets according to sex and individual specialization;
• Assess implications of these results on the conservation of Gentoo penguins, under extreme
and low food availability.
Material and methods
Fieldwork and stomach content analyses
Fieldwork was carried out during the austral winter of 2009, between June and September,
at Bird Island, South Georgia. The British Antarctic Survey (BAS) provided all the support
related to the permits for the fieldwork (as fieldwork was carried out from a British Antarctic
research base): "The animal procedures used in this this study were reviewed and approved by
the Joint BAS–Cambridge University Animal Welfare and Ethical Review Committee. Permits
to operate were issued by the Government of South Georgia and the South Sandwich Islands".
Stomach samples were obtained each month (N = 13–15 penguins handled, always ensuring
that at least 10 samples contained food) from non-breeding Gentoo penguins at one colony
(known locally as Landing Beach).
For each month, all samples were collected within a 4-day period. Penguins were selected
randomly when returning to the colony at dusk. Birds may, or may not have used the site for
breeding, as Gentoo penguins move around the archipelago during the winter [25]. Each
Fig 2. Abnormal sea surface temperatures around South Georgia in 1999 (Sea surface temperature
(SST) data ± SD). Mean monthly sea surface temperature (SST) data for the 1˚ by 1˚ grid square centred at
34.5˚W, 54.5˚S, from the “OI.V2 Monthly SST” data set [109].
https://doi.org/10.1371/journal.pone.0174850.g002
Foraging segregation in penguins
PLOS ONE | https://doi.org/10.1371/journal.pone.0174850 March 31, 2017 4 / 25
penguin was handled as follows: after putting a cover on the penguin’s head (to reduce stress),
the bill was measured (length and depth), followed by the height of the penguin and its weight
(a harness was produced to specifically hold each penguin comfortably) using a 5 kg Pesola1
spring balance (Pesola AG, Barr, Switzerland). Post-molt feathers (6–8 chest feathers) and
blood were collected, following Ceia et al. [56], adapted to penguins; the blood samples were
collected using 1 ml syringes (25 G needles) and were separated into plasma and red blood
cells (RBC) using a centrifuge (15 min at 3000 rpm), stored frozen (– 20˚C), and later freeze-
dried and homogenized prior to stable isotopic analyses. Finally, a food sample was obtained
by stomach flushing, following Xavier et al. [57] adapted to penguins (stomach samples were
successfully obtained with a maximum of 3 flushes), following the Convention for the Conser-
vation of Antarctic Marine Living Resources (CCAMLR) Ecosystem Monitoring Program
(CEMP) Standard Methods. If the first flush produced a green or yellow coloured sample, it
was assumed that the penguins were without food and they were released. All penguins han-
dled were then marked to ensure they were sampled only once, and released. The procedures
lasted, on average, 15 minutes.
The analyses of the food samples were carried out at the Bird Island research station labora-
tory within 24 hours of collection. Each food sample was analysed following Xavier et al. [58].
The samples were weighed and the overall mass was recorded. To remove the liquid, each food
sample was washed carefully through two sieves (1.00 and 3.35 mm). Only fresh (recently con-
sumed) material was found (i.e. no old cephalopod beaks nor other indigestible material (e.g.
stones or plastics) was found). All components were then sorted into categories (crustaceans,
fish, cephalopods and others; the latter comprising other fresh prey). Crustaceans were identi-
fied when possible using the BAS and Royal Belgium Institute of Natural Sciences reference
collections, and the key reference bibliography of Kane [59] and Boltovskoy [60]. The total
length of crustaceans was measured when possible (from tip of the eyes to the end of uropods/
telson). The fish otoliths were identified following Hecht [61], Williams and McEldowney
[62], Smale et al. [63], Reid [64] and fish size relationships used were given by Adams and
Klages [65], Hecht [61], Williams and McEldowney [62], Smale et al. [63], Reid [64], Olsson
and North [66], Berrow and Croxall [67] and Croxall et al. [68, 69]. We putatively identified
one group of very small otoliths as? Gymnoscopelus braueri (preliminary identification sug-
gested by Marcella Libertelli) but subsequent genetic analyses using flesh did not confirm this
identification. The number of fish was estimated from the number of intact crania containing
both otoliths, and loose otoliths, in each sample. These loose otoliths were compared with each
other (right otolith compared with left otolith by size and level of erosion) and paired if possi-
ble (e.g. if four loose otoliths were found with similar sizes and similar sizes of erosion, and
two were left otoliths and the other two were right otoliths, it was assumed that there had been
two fish). The cephalopod beaks were counted (both upper and lower), identified and mea-
sured. Only the lower cephalopod beaks were measured, using the lower rostral length (LRL)
following Xavier and Cherel [70] and the BAS beak reference collection. Allometric equations,
of mantle length (ML) and estimated mass (W) for cephalopods were taken from Xavier and
Cherel [70]. The components and species were analysed by frequency of occurrence, number
and by mass following Xavier et al. [58].
Stable isotopic analyses
Tissue δ13C and δ15N values provide useful information about seabird diet at different temporal
scales [71]. The carbon stable isotope value (δ13C) mainly reflects consumers’ foraging habitat,
while the nitrogen stable isotope value (δ15N) is mainly used to define consumers’ diet and tro-
phic position. The isotopic niche of each adult was determined by using three complementary
Foraging segregation in penguins
PLOS ONE | https://doi.org/10.1371/journal.pone.0174850 March 31, 2017 5 / 25

tissues (plasma, RBC and feathers) that record trophic information at different time scales [72].
Plasma and RBC retain information on diet (carbon source and trophic level) from a few hours/
days prior to sample collection to the previous 3–4 weeks, respectively [73, 74]. Hence, the isoto-
pic signature of plasma is representative of the food and feeding ecology of the penguins during
their last few daily foraging trips. Breast feathers represent the diet during the previous pre-
moulting stage, since feather keratin is metabolically inert after synthesis, which in Gentoo pen-
guins from South Georgia occurs generally between March and April [75]. Therefore, based on
stable isotopic analyses of different tissues from the same penguin we are able to test for short-
term (i.e. days/weeks–RBC versus plasma) and medium-term (i.e. weeks to months–RBC versus
feathers, when these were grown) consistency in individual foraging niche [56].
Lipids are depleted in 13C relative to whole tissues and were removed from plasma using
successive rinses in a 2:1 chloroform: methanol solution [56, 76]. The low lipid content of
whole blood (or RBC) does not typically require lipid extraction [77]. Prior to stable isotopic
analyses, feathers were cleaned of surface contaminants using successive rinses in a 2:1 chloro-
form: ether solution, air-dried and then ground to a fine powder in a freezer mill operating at
liquid nitrogen temperature.
Nitrogen and carbon isotope ratios were determined by a continuous-flow isotope ratio
mass spectrometer (Delta V Advantage, Thermo Scientific) coupled to an elemental analyser
(Flash EA1112, Thermo Scientific) in the LIENSs, Universite de La Rochelle, France. Approxi-
mately 0.3 mg of each sample was combusted in a tin cup for the simultaneous determination
of nitrogen and carbon isotope ratios. Results are presented in the usual δ notation based on
the Vienna PeeDee Belemnite (V-PDB) for carbon and atmospheric N2 (AIR) for nitrogen.
Replicate measurements of internal laboratory standards (acetanilide) indicate measurement
errors <0.15 ‰ for both δ13C and δ15N.
To analyse stable isotope data in the context of isotopic niche between sexes, we
adopted the recent metrics based in a Bayesian framework (Stable Isotope Bayesian Ellip-
ses in R: SIBER [78]), which allows for robust statistical comparisons. The Bayesian app-
roximation of the standard ellipse area (SEAb) is a metric used to test whether Group 1
(males) standard ellipse area (SEA) is smaller than Group 2 (females) and is calculated
based on 1000 replications. The SEA corrected for small sample sizes (SEAc, an ellipse that
contains 40% of the data regardless of sample size) was adopted to compare niche width
between sexes (see Jackson et al. (2011) for more details). The SEAb and the layman metric
of convex hull area (TA) [79] were also calculated as a measure of isotopic niche area.
SEAb was used to test whether Group 1 is smaller than Group 2 (i.e. p, the proportion of
ellipses in males that were lower than females), following Jackson et al. (2011). We used
the computational code to calculate the metrics from SIBER implemented in the package
SIAR [80] under R 3.2.1.
Molecular sexing
Blood samples from Gentoo penguins were collected, as mentioned above, from 55 individuals
to identify their sex. DNA from blood was isolated using an adaptation of the Chelex extrac-
tion method [81]. All samples were centrifuged for 3 min and a small portion of blood was
removed for extraction with a spatula. 50 μl of distilled H2O and 20 μl of InstaGene™ Matrix
(BioRad) were added to each sample. The samples were then incubated at 50˚C for 30 min,
followed by 8 min at 100˚C. One negative control (a tube with all the reagents but without a
blood sample) was included for each set of 24 extractions to monitor for possible contamina-
tion with exogenous DNA. Primers P2/P8 [82] were used for PCR amplification. These prim-
ers have been commonly used for penguins [83, 84] and provided sufficient separation of
Foraging segregation in penguins
PLOS ONE | https://doi.org/10.1371/journal.pone.0174850 March 31, 2017 6 / 25

bands (~20 base pairs) to be differentiated on an agarose gel. All PCRs included two positive
controls to test for the success of the amplification and two negative controls, prepared with
distilled water, to test for possible contamination. Each male result was repeated at least three
times and each female result was repeated at least twice. Amplifications were performed using
a Multiplex kit, carried out in 10 μl reactions containing 1x of QIAGEN1 Multiplex PCR Mas-
ter Mix, 0.2 μM of each primer and 0.8 μl of DNA template (~1 ng/μl). The thermal conditions
were 95˚C for 15 min, 35 cycles of 95˚C for 1 min, 47˚C (annealing temperature) for 1 min
30 s, 72˚C for 1 min 30 s, and a final extension at 72˚C for 10 min. All reactions were carried
out using an Applied Biosystems Veriti1 Thermal Cycler PCR machine. Samples were run for
about 2h on 3% weight/volume agarose gels stained with ethidium bromide.
Dead counts
In September 2009 (1st and 8th Sept.), two surveys for dead Gentoo penguins (n = 111) were car-
ried out at Bird Island (at Landing Beach, Iceberg Point, Freshwater Beach, Stinker Point and
Everman Cove), due to the appearance of numerous dead Gentoo penguins on the beaches of
Bird Island, South Georgia. After identifying a body of a Gentoo penguin, the bill length and
bill depth were measured, as above. Sex was estimated using equations from Williams [85]. It
was also reported if it was recently dead or an old carcass. To avoid duplicating the identifica-
tion of dead animals in the second survey, stock marker was used to paint the bill of the
penguins.
Data were statistically analysed using Minitab statistical software (Sowers Printing Com-
pany, PA, USA) and R [86]. The values are as mean ± standard deviation, unless stated (signifi-
cance threshold: 0.05).
Results
The feeding ecology of 55 Gentoo penguins from Bird Island (South Georgia) was studied during
the austral winter of 2009 (Table 1; S1 Dataset). Of these, 12 had empty stomachs (or only minor
residues of food), which were removed from further analyses. Based on individuals whose stom-
ach contents were analysed, our study showed that male Gentoo penguins (N = 17; body mass =
6666 ± 653 g) were significantly heavier than females (N = 26; body mass = 5334 ± 520 g; Mann-
Witney U test, U = 409, P< 0.01). The mean solid proportion of Gentoo penguin food samples
ranged from 4 to 414 g (141 ± 101 g), with females having significantly more solids than males
(Mann-Witney U test, U = 114, P< 0.01).
Diet composition
Overall, when samples for both sexes were combined, Gentoo penguins fed primarily on crus-
taceans (68% by mass) followed by fish (25%; Table 2). Cephalopods and other prey/debris
represented <1% and 7% by mass, respectively. By prey species, Themisto gaudichaudii was
the most important crustacean by frequency of occurrence (74%), by number (77%) and by
mass (63%; Table 2). The proportion of crustaceans and fish consumed differed significantly
Table 1. Parameters collected from Gentoo penguins during winter 2009 at Bird Island, South Georgia (F = Female, M = Male).
Bill length (mm) Bill depth (mm) Penguin size (cm) Penguin mass (g) Sample solids (g)
Sex n Mean ± SD Range Mean ± SD Range Mean ± SD Range Mean ± SD Range Mean ± SD Range
F 30 49.1±0.4 44.4–54.4 15.5±0.1 13.5–17.0 42.0±0.2 39.0–44.0 5277±98 4350–6380 172.2±19.6 24.5–413.7
M 25 53.2±0.5 49.1–60.0 17.2±0.2 15.3–18.6 44.8±0.3 41.7–48.0 6524±127 5050–7500 92.7±20.5 4.4–297.8
F+M 55 50.9±0.4 44.4–60.0 16.3±0.2 13.5–18.6 43.3±0.3 39.0–48.0 5844±115 4350–7500 140.8±15.4 4.4–413.7
https://doi.org/10.1371/journal.pone.0174850.t001
Foraging segregation in penguins
PLOS ONE | https://doi.org/10.1371/journal.pone.0174850 March 31, 2017 7 / 25
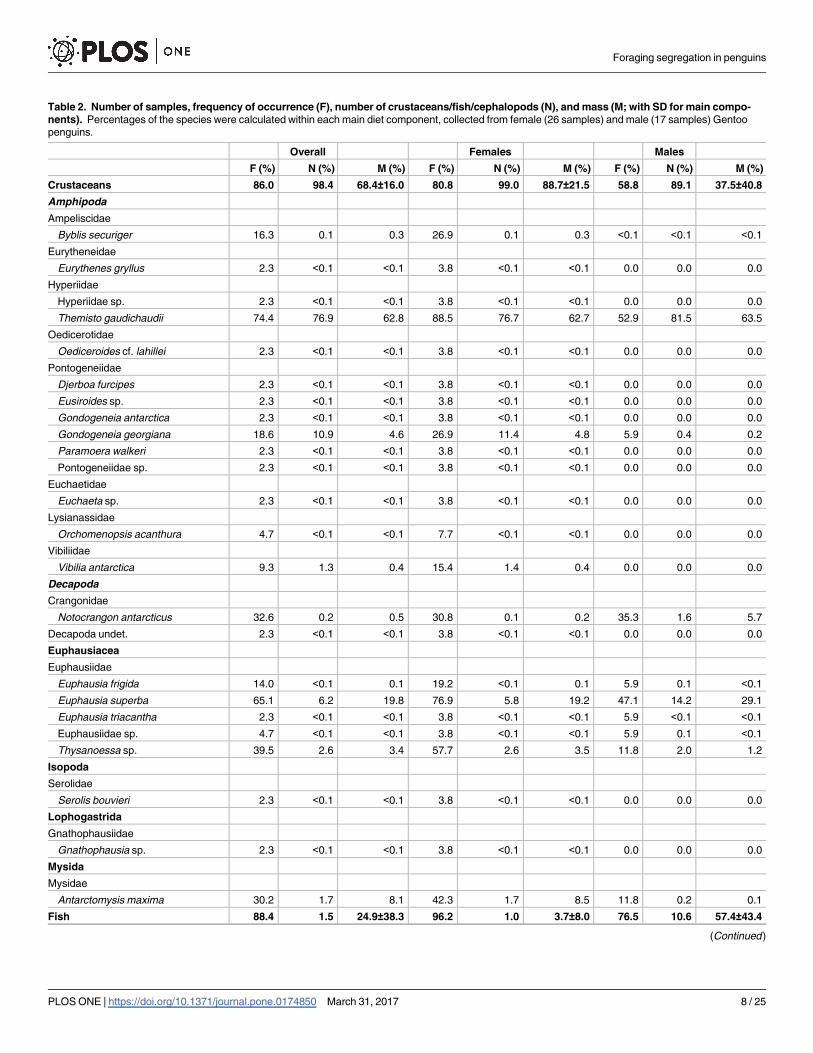
Table 2. Number of samples, frequency of occurrence (F), number of crustaceans/fish/cephalopods (N), and mass (M; with SD for main compo-
nents). Percentages of the species were calculated within each main diet component, collected from female (26 samples) and male (17 samples) Gentoo
penguins.
Overall Females Males
F (%) N (%) M (%) F (%) N (%) M (%) F (%) N (%) M (%)
Crustaceans 86.0 98.4 68.4±16.0 80.8 99.0 88.7±21.5 58.8 89.1 37.5±40.8
Amphipoda
Ampeliscidae
Byblis securiger 16.3 0.1 0.3 26.9 0.1 0.3 <0.1 <0.1 <0.1
Eurytheneidae
Eurythenes gryllus 2.3 <0.1 <0.1 3.8 <0.1 <0.1 0.0 0.0 0.0
Hyperiidae
Hyperiidae sp. 2.3 <0.1 <0.1 3.8 <0.1 <0.1 0.0 0.0 0.0
Themisto gaudichaudii 74.4 76.9 62.8 88.5 76.7 62.7 52.9 81.5 63.5
Oedicerotidae
Oediceroides cf. lahillei 2.3 <0.1 <0.1 3.8 <0.1 <0.1 0.0 0.0 0.0
Pontogeneiidae
Djerboa furcipes 2.3 <0.1 <0.1 3.8 <0.1 <0.1 0.0 0.0 0.0
Eusiroides sp. 2.3 <0.1 <0.1 3.8 <0.1 <0.1 0.0 0.0 0.0
Gondogeneia antarctica 2.3 <0.1 <0.1 3.8 <0.1 <0.1 0.0 0.0 0.0
Gondogeneia georgiana 18.6 10.9 4.6 26.9 11.4 4.8 5.9 0.4 0.2
Paramoera walkeri 2.3 <0.1 <0.1 3.8 <0.1 <0.1 0.0 0.0 0.0
Pontogeneiidae sp. 2.3 <0.1 <0.1 3.8 <0.1 <0.1 0.0 0.0 0.0
Euchaetidae
Euchaeta sp. 2.3 <0.1 <0.1 3.8 <0.1 <0.1 0.0 0.0 0.0
Lysianassidae
Orchomenopsis acanthura 4.7 <0.1 <0.1 7.7 <0.1 <0.1 0.0 0.0 0.0
Vibiliidae
Vibilia antarctica 9.3 1.3 0.4 15.4 1.4 0.4 0.0 0.0 0.0
Decapoda
Crangonidae
Notocrangon antarcticus 32.6 0.2 0.5 30.8 0.1 0.2 35.3 1.6 5.7
Decapoda undet. 2.3 <0.1 <0.1 3.8 <0.1 <0.1 0.0 0.0 0.0
Euphausiacea
Euphausiidae
Euphausia frigida 14.0 <0.1 0.1 19.2 <0.1 0.1 5.9 0.1 <0.1
Euphausia superba 65.1 6.2 19.8 76.9 5.8 19.2 47.1 14.2 29.1
Euphausia triacantha 2.3 <0.1 <0.1 3.8 <0.1 <0.1 5.9 <0.1 <0.1
Euphausiidae sp. 4.7 <0.1 <0.1 3.8 <0.1 <0.1 5.9 0.1 <0.1
Thysanoessa sp. 39.5 2.6 3.4 57.7 2.6 3.5 11.8 2.0 1.2
Isopoda
Serolidae
Serolis bouvieri 2.3 <0.1 <0.1 3.8 <0.1 <0.1 0.0 0.0 0.0
Lophogastrida
Gnathophausiidae
Gnathophausia sp. 2.3 <0.1 <0.1 3.8 <0.1 <0.1 0.0 0.0 0.0
Mysida
Mysidae
Antarctomysis maxima 30.2 1.7 8.1 42.3 1.7 8.5 11.8 0.2 0.1
Fish 88.4 1.5 24.9±38.3 96.2 1.0 3.7±8.0 76.5 10.6 57.4±43.4
(Continued )
Foraging segregation in penguins
PLOS ONE | https://doi.org/10.1371/journal.pone.0174850 March 31, 2017 8 / 25

between sexes (i.e. males consumed more fish (Mann-Witney U test, U = 348, P< 0.01) and
females more crustaceans (Mann-Witney U test, U = 26, P < 0.01), see below), whereas the
proportion of cephalopods (Mann-Witney U test, U = 242, P = 0.6) and other prey (Mann-
Witney U test, U = 212, P = 0.8) did not differ. Prey sizes of Gentoo penguins ranged from
5.6 mm total length (?Gymnoscopelus braueri) to 447 mm (Parachaenychthis georgianus;Table 3), with females eating bigger crustaceans (Mann-Witney U test, U = 157963, P < 0.01)
and fish (Mann-Witney U test, U = 18034, P< 0.01) than male penguins (Table 3; see below).
However, by comparing sizes (total length) of prey between penguin sexes (with� 10 individ-
ual prey in both sexes), T. gaudichaudii had similar sizes for both sexes (Mann-Witney U test,
U = 118166, P = 0.70; Fig 3), as well as Champsocephalus gunnari (Mann-Witney U test, U =
307, P = 0.98), Lepidonotothen larseni Mann-Witney U test, U = 364, P = 0.25), and? Gymnosco-pelus braueri (Mann-Witney U test, U = 407, P = 0.44). Only female Gentoo penguins fed on
significantly bigger Muraenolepis microps than males (Mann-Witney U test, U = 423, P< 0.01).
The mean solid proportion of male Gentoo penguin food samples ranged from 4 to 298 g
(93 ± 84 g). Males fed mainly on fish (54% by mass) followed by crustaceans (38%), other spe-
cies (5%) and cephalopods (< 1%). T. gaudichaudii was the most important crustacean prey
(64% by mass; 82% by number; 53% by frequency of occurrence) (Table 1). Euphausia superbarepresented only 29% by mass and 14% by number, although it had 47% by frequency of
occurrence (Table 1). Within the fish component, P. georgianus was the most important fish
Table 2. (Continued)
Overall Females Males
F (%) N (%) M (%) F (%) N (%) M (%) F (%) N (%) M (%)
Bathydraconidae
Parachaenichthys georgianus 4.7 10.1 46.3 0.0 0.0 0.0 11.8 26.6 55.3
Channichthyidae
Champsocephalus gunnari 37.2 15.8 24.5 46.2 19.2 66.8 23.5 10.1 16.3
Channichthyidae 2.3 0.3 <0.1 0.0 0.0 0.0 5.9 0.7 <0.1
Pseudochaenichthys georgianus 4.7 0.5 1.4 3.8 0.4 4.1 5.9 0.7 0.9
Myctophidae
?Gymnoscopelus braueri 48.8 38.6 0.6 65.4 59.4 3.6 23.5 4.3 0.1
Krefftichthys anderssoni 4.7 0.5 <0.1 3.8 0.4 <0.1 5.9 0.7 <0.1
Muraenolepididae
Muraenolepis microps 44.2 12.8 1.4 50.0 13.1 1.3 35.3 12.2 1.4
Nototheniidae
Gobionotothen gibberifrons 4.7 0.5 8.7 0.0 0.0 0.0 11.8 1.4 10.3
Lepidonotothen larseni 30.2 18.2 12.4 23.1 6.6 24.2 47.1 37.4 10.1
Trematomus hansoni 2.3 0.5 4.7 0.0 0.0 0.0 11.8 1.4 5.7
Unknown fish (Osteichthyes) 14.0 2.2 <0.1 7.7 0.9 <0.1 23.5 4.3 <0.1
Cephalopods 11.6 <0.1 0.1±0.0 11.5 <0.1 <0.1±0.2 11.8 0.2 0.1±0.4
Brachioteuthidae
Slosarczykovia circumantarctica 7.0 66.7 75.9 3.8 66.7 45.9 11.8 66.7 100.0
Onychoteuthidae
Kondakovia longimana 4.7 33.3 24.1 3.8 33.3 54.1 5.9 33.3 <0.1
Others 11.6 <0.1 6.6±16.0 19.2 0.1 7.6±19.6 0.0 5.0±8.0
Sagittidae
Sagitta sp. 11.6 1.2 19.2 2.5 0.0 0.0
Debris/stones/unidentified material 44.2 98.8 42.3 97.5 47.1 100.0
https://doi.org/10.1371/journal.pone.0174850.t002
Foraging segregation in penguins
PLOS ONE | https://doi.org/10.1371/journal.pone.0174850 March 31, 2017 9 / 25

Table 3. Measurements from crustaceans, fish and cephalopods obtained from the diet of Gentoo penguins.
Crustaceans Sex n CL Mean (range) TL Mean (range) Mass Mean (range)
Antarctomysis maxima F 101 8.4 (4.8–12.0) 33.1 (19.0–47.0) n/a
M 0
F+M 101 8.4 (4.8–12.0) 33.1 (19.0–47.0) n/a
Byblis securiger F 13 n/a 37.1 (34.0–39.0) n/a
M 0
F+M 13 n/a 37.1 (34.0–39.0) n/a
Euphausia frigida F 3 n/a 18.3 (12.0–23.0) n/a
M 1 n/a 23.0 n/a
F+M 4 n/a 19.5 (12.0–23.0) n/a
Euphausia superba F 254 n/a 44.5 (27.0–58.0) n/a
M 19 n/a 45.7 (40.0–55.0) n/a
F+M 273 n/a 44.6 (27.0–58.0) n/a
Euphausia triacantha F 1 n/a 26.0 n/a
M 0
F+M 1 n/a 26.0 n/a
Eurythenes gryllus F 2 n/a 25.0 (24.0–26.0) n/a
M 0
F+M 2 n/a 25.0 (24.0–26.0) n/a
Gondogeneia georgiana F 13 n/a 18.3 (15.0–21.0) n/a
M 0
F+M 13 n/a 18.3 (15.0–21.0) n/a
Notocrangon antarcticus F 8 n/a 37.3 (32.0–42.0) n/a
M 1 n/a 20.0 n/a
F+M 9 n/a 35.3 (20.0–42.0) n/a
Themisto gaudichaudii F 1202 n/a 22.0 (15.0–35.0) n/a
M 200 n/a 21.9 (17.0–25.0) n/a
F+M 1402 n/a 22.0 (15.0–35.0) n/a
Thysanoessa sp. F 185 n/a 28.0 (15.0–35.0) n/a
M 0
F+M 185 n/a 28.0 (15.0–35.0) n/a
Vibilia antarctica F 1 n/a 12.0 n/a
M 0
F+M 1 n/a 12.0 n/a
Fish OL Mean (range)
Champsocephalus gunnari F 77 1.1 (0.7–1.9) 142.3 (89.4–230.8) 17.1 (3.1–74.1)
M 25 1.4 (0.9–3.4) 168.5 (113.5–401.2) 67.7 (6.9–472.3)
F+M 102 1.2 (0.7–3.4) 148.3 (89.4–401.2) 29.5 (3.1–472.3)
Gobiotothen gibberifrons F 0
M 2 7.4 (6.8–8.0) 318.5 (285.5–351.5) 300.3 (199.4–401.1)
F+M 2 7.4 (6.8–8.0) 318.5 (285.5–351.5) 300.3 (199.4–401.1)
Krefftichthys anderssoni F 2 0.9 34.7 0.4
M 1 0.7 23.1 0.2
F+M 3 0.8 (0.7–0.9) 28.9 (23.1–34.7) 0.3 (0.2–0.4)
Lepidonotothen larseni F 26 3.2 (0.9–5.1) 82.7 (38.7–181.2) 18.7 (0.5–54.7)
M 82 2.6 (0.9–4.7) 83.7 (38.7–168.5) 11.7 (0.5–43.7)
F+M 108 2.7 (0.9–5.1) 89.1 (38.7–181.2) 13.5 (0.5–54.7)
Muraenolepis microps F 52 1.1 (0.7–2.5) 34.3 (15.9–121.8) 0.5 (<0.1–11.1)
(Continued )
Foraging segregation in penguins
PLOS ONE | https://doi.org/10.1371/journal.pone.0174850 March 31, 2017 10 / 25

Table 3. (Continued)
Crustaceans Sex n CL Mean (range) TL Mean (range) Mass Mean (range)
M 33 1.7 (1.0–3.2) 69.8 (28.1–180.8) 4.8 (0.1–42.5)
F+M 85 1.3 (0.7–3.2) 47.1 (15.9–180.8) 2.0 (<0.1–42.5)
Parachaenychthis georgianus F 0
M 64 2.4 (1.7–5.3) 198.9 (143.3–446.7) 86.8 (35.9–469.5)
F+M 64 2.4 (1.7–5.3) 198.9 (143.3–446.7) 86.8 (35.9–469.5)
Pseudochaenichthys georgianus F 2 1.9 160.1 46.2
M 1 2.0 168.6 51.8
F+M 3 1.9 (1.9–2.0) 164.3 (160.1–168.6) 49.0 (46.2–51.8)
Trematomus hansoni F 0
M 4 4.9 (4.8–5.0) 249.5 (244.4–254.7) 164.5 (152.6–176.3)
F+M 4 4.9 (4.8–5.0) 249.5 (244.4–254.7) 164.5 (152.6–176.3)
Gymnoscopelus braueri F 260 0.8 (0.4–1.5) 27.1 (5.6–69.5) 0.3 (0.1–2.4)
M 10 0.9 (0.4–1.3) 34.7 (5.6–57.9) 0.7 (0.1–1.3)
F+M 270 0.8 (0.4–1.5) 27.3 (5.6–69.5) 0.3 (0.1–2.4)
Cephalopods LRL Mean (range) ML Mean (range)
Kondakovia longimana F 1 1.1 18.7 2.5
M yes (upper beak)
F+M 2 1.1 18.7 2.5
Slosarczykovia circumantarctica F 2 0.7 30.4 1.0
M 2 1.4 (1.0–1.8) 44.6 (36.5–52.6) 2.9 (1.7–4.0)
F+M 4 1.1 (0.7–1.8) 37.5 (30.4–52.6) 1.9 (1.0–4.0)
(LRL = Lower rostral length (mm); OL = Otolith length (mm); CL = Carapace length (mm); TL = Total length (mm); ML = Mantle length (mm); F = Female;
M = Male) (n/a = not applicable)
https://doi.org/10.1371/journal.pone.0174850.t003
Fig 3. Length frequency distribution of Themisto gaudichaudii from the diet of Gentoo penguins
(females and males) obtained at Bird Island, South Georgia in winter 2009.
https://doi.org/10.1371/journal.pone.0174850.g003
Foraging segregation in penguins
PLOS ONE | https://doi.org/10.1371/journal.pone.0174850 March 31, 2017 11 / 25

prey by mass (55% by mass; 27% by number; 12% by frequency of occurrence) and L. larseniby number and frequency of occurrence (10% by mass; 37% by number; 47% by frequency of
occurrence; Table 1).
The mean solid proportion of female Gentoo penguins food samples ranged from 25 to 414
g (172 ± 100 g), significantly heavier than males (see above). Females fed mainly on crusta-
ceans (89% by mass) followed by fish (4%), others (8%) and cephalopods (< 1%). T. gaudi-chaudii was the most important crustacean prey (63% by mass; 77% by number; 89% by
frequency of occurrence), followed by E. superba (19% by mass; 6% by number; 77% by fre-
quency of occurrence). Of the fish, C. gunnari (67% by mass; 19% by number; 46% by fre-
quency of occurrence) was the most important fish prey by mass (Table 1). P. georgianus (the
most important fish species in male Gentoo penguins) was absent in female Gentoo penguins
(Table 1).
Stable isotopic and niche analyses
Stable isotopic and niche analyses, both δ13C and δ 15N, were carried out on RBC, plasma and
breast feathers of male and female Gentoo penguins (all individuals; n = 55) (Table 4). Overall,
the values in terms of δ13C in Gentoo penguins ranged between -21.0 and -17.8 ‰ (blood cells:
between -21.0 and -18.7 ‰ δ 13C; plasma: between -21.3 and -18.0 ‰ δ 13C; feathers: -21.0 and
-17.8 ‰ δ 13C) whereas in terms of δ15N, the values ranged between 8.6 and 15.1 ‰ (blood
cells: between 9.8 and 14.1 ‰ δ 15N; plasma values: between 10.5 and 15.1 ‰ δ 15N; feathers:
varied between 8.6 and 13.6 ‰ δ 15N) (Table 4).
Sexual differences
In terms of foraging habitat (δ13C), there were significant differences between sexes in plasma
values, with males having higher plasma δ 13C values (Mann-Witney U test, U = 471, P <0.05),
but not in RBC values (Mann-Witney U test, U = 380, P = 0.57) (Table 4). Feather δ13C values
showed that females had significantly higher δ13C values than males (Mann-Witney U test,
U = 172, P<0.01).
In terms of trophic level (δ15N), there were significant differences between sexes in plasma
values (Mann-Witney U test, U = 618, P<0.01) and in RBC values (Mann-Witney U test,
U = 626, P< 0.01), with males having higher values (Table 4). Feather δ15N values showed no
sex-related differences (Mann-Witney U test, U = 384, P = 0.52; Table 4).
There were also positive significant relationships between isotopic values of δ13C and δ15N,
both in plasma and RBC, with relationships significantly higher in males (δ13C versus δ15N in
RBC: Pearson correlation 0.92, P< 0.01; plasma: Pearson correlation 0.92, P< 0.01) than for
females (RBC: Pearson correlation 0.54, P< 0.01; plasma: Pearson correlation 0.43, P = 0.02).
Table 4. Stable isotopic values of plasma, red blood cells and feathers from female (F) and male (M) Gentoo penguins.
Temporal
integration
Plasma (few days) Red blood cells (few weeks) Feathers (March- April, when
producing them)
Sex F M F+M F M F+M F M F+M
n 30 25 55 30 25 55 30 25 55
δ13C -20.1±0.5 -19.6±0.8 -19.9± 0.7 -20.1 ± 0.4 -19.8±0.5 -20.0±0.5 -19.5±0.5 -20.0±0.8 19.7±0.7
Range (-21.3;
-19.5)
(-20.8;
-18.0)
(-21.3;
-18.0)
(-21.0;
-19.4)
(-20.7;
-17.5)
(-21.0;
-18.7)
(-20.6;
-18.5)
(-21.0;
-17.8)
(-21.0;
-17.8)
δ15N 11.7±0.5 13.3±1.2 12.4±1.2 10.8±0.5 12.1±1.0 11.4±1.0 11.5±1.0 11.8±1.1 11.7±1.0
Range (10.5; 13.2) (11.1; 15.1) (10.5; 15.1) (9.8; 11.8) (10.4; 14.1) (9.8; 14.1) (8.6; 13.2) (9.6; 13.6) (8.6; 13.6)
C:N mass ratio 3.5±0.1 3.4±0.1 3.4±0.1 3.3±0.1 3.3±0.1 3.3±0.1 3.2±0.0 3.2±0.0 3.2±0.0
https://doi.org/10.1371/journal.pone.0174850.t004
Foraging segregation in penguins
PLOS ONE | https://doi.org/10.1371/journal.pone.0174850 March 31, 2017 12 / 25

However, no significant relationships between isotopic values of δ13C and δ15N in feathers
were found in males (Pearson correlation 0.08, P = 0.18) or females (Pearson correlation 0.12,
P = 0.06).
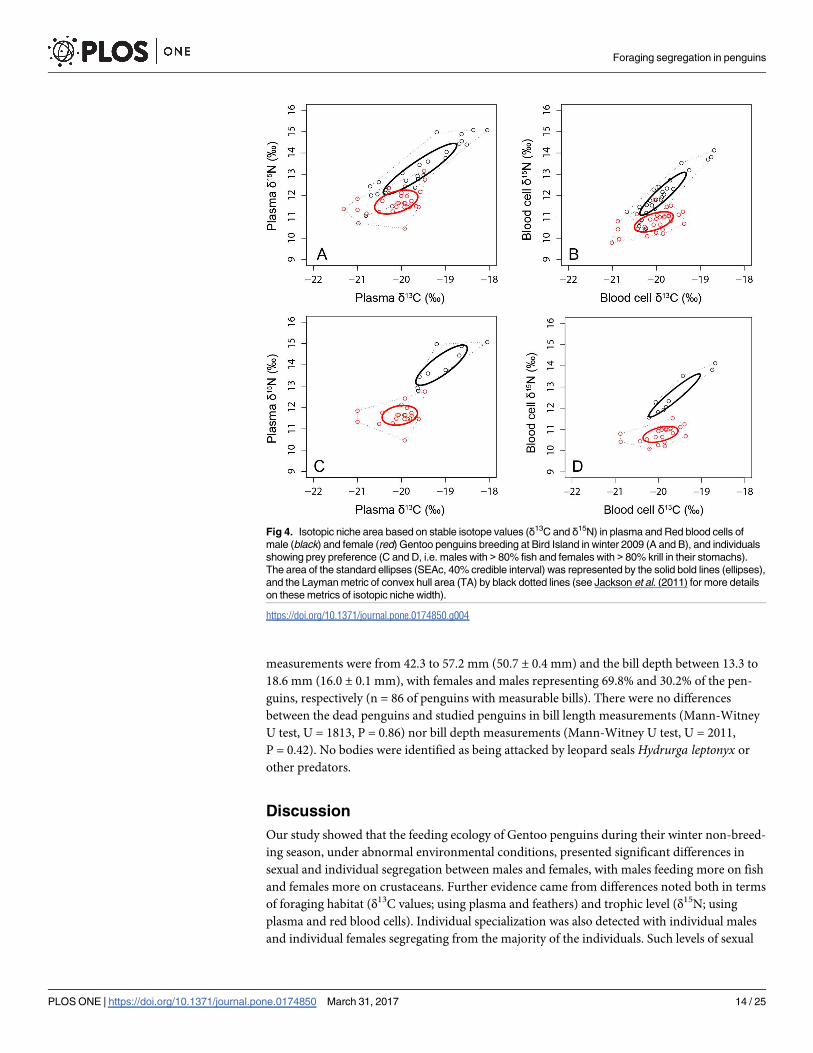
The isotopic niche width (SEAb) was estimated and found to be significantly higher in
males than in females using plasma (p = 0.01) and RBC (p = 0.04), and practically no overlap
was detected in the isotopic data (i.e. the area of the standard ellipses; SEAc) of males and
females, with males having higher levels of δ15N (Table 5; Fig 4). On the other hand, although
SEAb was also higher in males than in females using feathers (p = 0.05), a relatively high over-
lap was detected in the isotopic niche between sexes, with overall larger areas than in blood tis-
sues (Table 5).
Individual specialization
Both males and females exhibited individual specialization (Figs 4,5 and 6). A strong positive
relationship relating δ13C in RBC versus plasma was found for both males (Pearson correlation
0.80, P< 0.01) and females (Pearson correlation 0.77, P< 0.01) (Fig 5). Similarly, when relating
δ15N in RBC versus plasma, a strong positive relationship was found for both males (Pearson
correlation 0.88, P< 0.01) and females (Pearson correlation 0.76, P< 0.01) (Fig 5). Furthermore,
a group of female individuals (n = 4) segregated with lower δ13C and δ15N from most females
whereas a group of male individuals (of variable number) clearly segregated with higher δ13C
and δ15N from most males (Figs 4 and 6). Also, when assessing individuals with highly diver-
gent diets, male individuals that fed on> 80% by mass on fish and compared with females that
fed on> 80% by mass on Antarctic krill, the differences in δ15N is even more obvious (Fig 4).
Finally, when relating δ13C in feathers versus RBC, no relationships were found for either
males (Pearson correlation 0.22, P = 0.29) or females (Pearson correlation 0.24, P = 0.24). Sim-
ilar results were found when assessing δ15N in feathers versus RBC, with no relationships
found for either males (Pearson correlation 0.26, P = 0.21) or females (Pearson correlation
0.01, P = 0.95).
Dead counts
A total of 111 individual dead Gentoo penguins (of which 34 individuals were classified as
recently dead) were found along Bird Island beaches in the two surveys. The bill length
Table 5. Metrics of isotopic niche width in plasma and red blood cells’ tissues of Gentoo penguins obtained at Bird Island, South Georgia in winter
2009. The area of the standard ellipse (SEAc), the layman metric of convex hull area (TA) and the overlap between males and females for each metric were
calculated from SIBER (see Jackson et al. 2011 for more details on these metrics).
SEAc Overlap (SEAc) TA Overlap (TA)
Plasma
Overall (n = 55) 1.58 - 6.40 -
Males (n = 25) 1.23 < 0.01 3.71 1.12
Females (n = 30) 0.78 2.79
Red blood cells
Overall (n = 55) 1.08 - 4.21 -
Males (n = 25) 0.65 < 0.01 2.05 0.57
Females (n = 30) 0.56 1.93
Feathers
Overall (n = 55) 2.14 - 9.15 -
Males (n = 25) 2.58 0.95 7.24 4.79
Females (n = 30) 1.51 6.22
https://doi.org/10.1371/journal.pone.0174850.t005
Foraging segregation in penguins
PLOS ONE | https://doi.org/10.1371/journal.pone.0174850 March 31, 2017 13 / 25
measurements were from 42.3 to 57.2 mm (50.7 ± 0.4 mm) and the bill depth between 13.3 to
18.6 mm (16.0 ± 0.1 mm), with females and males representing 69.8% and 30.2% of the pen-
guins, respectively (n = 86 of penguins with measurable bills). There were no differences
between the dead penguins and studied penguins in bill length measurements (Mann-Witney
U test, U = 1813, P = 0.86) nor bill depth measurements (Mann-Witney U test, U = 2011,
P = 0.42). No bodies were identified as being attacked by leopard seals Hydrurga leptonyx or
other predators.
Discussion
Our study showed that the feeding ecology of Gentoo penguins during their winter non-breed-
ing season, under abnormal environmental conditions, presented significant differences in
sexual and individual segregation between males and females, with males feeding more on fish
and females more on crustaceans. Further evidence came from differences noted both in terms
of foraging habitat (δ13C values; using plasma and feathers) and trophic level (δ15N; using
plasma and red blood cells). Individual specialization was also detected with individual males
and individual females segregating from the majority of the individuals. Such levels of sexual
Fig 4. Isotopic niche area based on stable isotope values (δ13C and δ15N) in plasma and Red blood cells of
male (black) and female (red) Gentoo penguins breeding at Bird Island in winter 2009 (A and B), and individuals
showing prey preference (C and D, i.e. males with > 80% fish and females with > 80% krill in their stomachs).
The area of the standard ellipses (SEAc, 40% credible interval) was represented by the solid bold lines (ellipses),
and the Layman metric of convex hull area (TA) by black dotted lines (see Jackson et al. (2011) for more details
on these metrics of isotopic niche width).
https://doi.org/10.1371/journal.pone.0174850.g004
Foraging segregation in penguins
PLOS ONE | https://doi.org/10.1371/journal.pone.0174850 March 31, 2017 14 / 25

and individual segregation, in terms of diet, foraging habitat and trophic level under abnormal
environmental conditions, related to a bias of more female dead individuals, may have a nega-
tive impact in the population of local Gentoo penguin populations.
Characterization of the diet of Gentoo penguins during the austral winter
at South Georgia
Gentoo penguins at South Georgia during the austral winter feed mainly on crustaceans and
fish (our study; Kato et al. 1991; Williams 1991; Williams et al. 1992) (Table 6). Within the
crustacean component, our study showed that Gentoo penguins at South Georgia fed more on
Themisto gaudichaudii (63% by mass,) rather than Antarctic krill Euphausia superba (20% by
mass), contrasting with previous studies [26–28]. These previous studies have shown that Ant-
arctic krill dominated the diet in winter 1987 and 1988 (> 87% by mass). In 1989, fish (not
identified to species level) dominated the first sampling period, in early July (73–76% by mass)
and Antarctic krill dominated the second sampling period, in late July (> 89% by mass) [27].
Williams et al. [26] also conducted their study in late July, with Antarctic krill also dominating
the diet (63.3–100.0% by mass).
The variation in diets of Gentoo penguins at South Georgia have been linked to food avail-
ability locally [26–28], as Gentoo penguins are inshore-feeding species. Under the context of
low Antarctic krill availability in autumn 2009 [44, 46], the diet shift of Gentoo penguins to T.
gaudichaudii implies that high abundances of Antarctic krill did not occur during the follow-
ing austral winter 2009 in inshore areas where Gentoo penguins forage. Moreover, the occur-
rence of Gentoo penguins found dead on the beaches (potentially a seabird wreck; see [47])
may support such a statement, although we need to be cautious as no counts of dead penguins
from previous years are available, nor their cause of death. From other data available, it sug-
gests that in years of good Antarctic krill availability, Gentoo penguins do feed mainly on Ant-
arctic krill (Table 6). In years of low Antarctic krill availability, the importance of fish increases
and the crustacean component is replaced by T. gaudichaudii or other (not Antarctic krill)
crustaceans [20, 45, 87–90] (Table 6).
Fig 5. Individual relationships of stable isotope values (δ13C and δ15N) in plasma and Red blood cells of male (black) and female (red) Gentoo
penguins breeding at Bird Island in winter 2009.
https://doi.org/10.1371/journal.pone.0174850.g005
Foraging segregation in penguins
PLOS ONE | https://doi.org/10.1371/journal.pone.0174850 March 31, 2017 15 / 25

Sexual foraging segregation and individual specialization in Gentoo
penguins
To our knowledge, this is the first study to assess sexual dietary differences in austral winter
under known (abnormal) environmental conditions, when Gentoo penguins are not con-
strained by breeding duties. Female Gentoo penguins had significantly heavier meals (i.e. sol-
ids) than males (see Results) but as prey were inadequate (i.e. the availability of T. gaudichaudiiwas low), this fact was reflected in females struggling during austral winter 2009; with more
dead female Gentoo penguins found than males on shores (see Results).
Although both sexes of Gentoo penguins are known to forage in inshore waters [25], males
exhibited a different diet in comparison with females (Tables 1, 4 and 7): sexual differences in
Gentoo penguins were found, with females taking more crustaceans (i.e. T. gaudichaudii) and
Fig 6. Stable isotope values of carbon (δ13C) and nitrogen (δ15N) (means ± SD) in plasma and red
blood cells of male and female Gentoo penguins breeding at Bird Island in winter 2009 (the number of
individuals used are in brackets, which were grouped according to their different values of carbon
and nitrogen).
https://doi.org/10.1371/journal.pone.0174850.g006
Foraging segregation in penguins
PLOS ONE | https://doi.org/10.1371/journal.pone.0174850 March 31, 2017 16 / 25

males more fish. Also, Bearhop et al. [91] found that Gentoo penguin males foraged at a
slightly higher trophic level than females (although not statistically significant), during the aus-
tral summer. Therefore, the “Intersexual Competition Hypothesis” for dimorphic species, does
apply to Gentoo penguins. This is potentially due to the ability of male Gentoo penguins, with
slightly larger bills compared to females (and also heavier mass; see Results) being able to catch
fish prey when confronted with low availability of Antarctic krill around South Georgia during
their non-breeding period [26–28], as suggested for other penguins elsewhere [92, 93]. More-
over, male Gentoo penguins are larger, heavier and are able to go deeper to forage than females
[94, 95], and are able to feed on more bentho-pelagic prey (i.e. Lepidonotothen larseni, Para-chaenichthys georgianus [96, 97]) than females, which tend to be limited to shallower pelagic
waters. However, Croxall et al. [89] and Bost et al. [98] found no significant differences in the
diving parameters of male and female Gentoo penguins. With such flexibility in their diet and in
foraging habitat, male Gentoo penguins may be more resilient, especially in years when pelagic
prey (i.e. Antarctic krill, T. gaudichaudii) are generally scarce (see below); this interpretation is also
supported by our results in finding more females dead on the beaches than males (see results).
Volkman et al. [99] also showed that males fed significantly more on fish than female Gentoo pen-
guins, breeding at King George Island, despite the lack of differences in energy expenditure or for-
aging trip duration demonstrated for this species [75]. This supports the theory that sex differences
in dietary preference changes of Gentoo penguins may largely reflect local changes in the availabil-
ity of particular prey species within the inshore area exploited by this all-year-round predator,
where intraspecific competition is intense (particularly during the winter when food availability is
low). To avoid competition, Gentoo penguins switched their foraging behaviour by foraging at
deeper depths to limit competition with Adelie penguins Pygoscelis adeliae at West Antarctic Pen-
insula [23].
In comparison with other penguin species, comparable diet and foraging data is mostly
available for the summer breeding season (Table 7). Adelie penguins [99–101], southern
rockhopper penguins Eudyptes chrysocome [93, 102, 103], Magellanic penguins Spheniscusmagellanicus [92], Emperor penguins Aptenodytes forsteri [104] are also known to exhibit
sex differences in trip duration, foraging areas and diets. With these data, it is not clear why
these patterns vary across species (Tables 6 and 7), but differences during the breeding
period in some species (e.g. Emperor and Humboldt penguins Spheniscus humboldti) may
be related to body condition, and the role of each sex (e.g. females must produce the egg,
whereas Emperor penguin males are solely responsible for incubating the egg) [104, 105].
Table 6. Diets of Gentoo penguins at South Georgia according to poor/good Antarctic krill Euphausia superba years. (n = number of samples).
Diet (% by Mass) Antarctic
Year Season Females Males Krill abundance References
1976/1977 Summer 70.1% Antarctic krill/32.6% fish (n = 43) ? [90]
1985/1986 Summer 51.4% Antarctic krill/48.5.% fish (n> 100) Low? [20, 88, 89]
1987 Winter 87% crustaceans (n = 20) 83% fish (n = 13) ? [28]
1988 Winter > 87% Antarctic krill (n = 68) ? [28]
1989 Winter 27–99% Crustaceans (n = 36) 24–89% Crustaceans (n = 33) ? [27]
0.1–73% Fish (n = 9) 11–76% Fish (n = 9) ?
1993/1994 Summer 85.9% Fish (n = ?) Low [20]
1996 Winter 36.3–95.2% Antarctic krill (n = 48) ? [87]
1996/1997 Summer 42.6–61.3% Antarctic krill (n = 46) High [45, 87]
2009 Winter 89% Crustaceans/4% Fish (n = 26) 54% Fish/38% Crustaceans (n = 17) Low? Present study
https://doi.org/10.1371/journal.pone.0174850.t006
Foraging segregation in penguins
PLOS ONE | https://doi.org/10.1371/journal.pone.0174850 March 31, 2017 17 / 25

In terms of habitat use (based on δ13C), there were variable results in short-term carbon sig-
natures between males and females of Gentoo penguins (based on plasma and red blood cells),
emphasising a changeable habitat use through the austral winter. Such a result is possibly a
reflection of male and female Gentoo penguins trying to avoid (when possible) competition
for the same prey (due to the lack of prey availability locally), and thus broadening their habitat
use.
In terms of the trophic level (based on δ15N), males fed significantly at higher trophic levels
than females (based on plasma and red blood cells; Figs 4 and 5), confirmed by male Gentoo
penguins feeding on bentho-pelagic/benthic high trophic level prey (i.e. fish) whereas females
feeding on pelagic low-trophic level prey (i.e. crustaceans; Table 2); fish has a higher trophic
level than crustaceans [106]. Moreover, within males, some individuals clearly fed on a higher
trophic level than other males whereas within females, some individuals fed on a lower trophic
Table 7. Studies that provide evidence on sexual segregation (by diet, prey size or foraging) and individual specialization in penguins.
Sexual Segregation
Penguin Species Breeding cycle Diet Prey
size
Foraging Ind. specialization References
Adelie penguins Breeding season
(Summer)
Yes Yes ? [99]
Adelie penguins Breeding season
(Summer)
Yes ? Yes/No Site fidelity (feeding area specialization– 63% of
birds)
[100, 101, 110, 111]
Chinstrap penguins Breeding season
(Summer)
No No ? [99]
Chinstrap penguins Breeding season
(Summer)
Yes ? ? [112]
Emperor penguins Breeding season (Winter) Yes No? Yes [104]
Gentoo penguins Non-breeding season
(Winter)
Yes No ? Present study, [26–
28]
Gentoo penguins Breeding season
(Summer)
Yes ? No [91]
Gentoo penguins Breeding season
(Summer)
Yes No ? [99]
Gentoo penguins Breeding season
(Summer)
Yes ? ? Diet (related to mercury levels) [40, 113]
Gentoo penguins Breeding season
(Summer)
Yes ? ? [112]
Humboldt penguins Breeding season (Winter) ? ? Yes/No [105]
King penguins Breeding season
(Summer)
? ? ? Short-term consistency in the foraging niches [114]
Little penguins Breeding season
(Summer)
? ? Yes Diving behaviour [115–117]
Macaroni penguins Breeding season
(Summer)
No ? Yes/No Short-term specialization in the foraging niche
during Winter
[38, 75, 91, 118]
Magellanic
penguins
Breeding season
(Summer)
Yes ? ? [92]
Rockhopper
penguins
Breeding season
(Summer)
Yes ? ? [93, 102, 103]
Rockhopper
penguins
Breeding season
(Summer)
? ? No [119]
Royal penguins Breeding season
(Summer)
? ? No [119]
Yellow-eyed
penguins
Breeding season
(Summer)
? ? No [120]
https://doi.org/10.1371/journal.pone.0174850.t007
Foraging segregation in penguins
PLOS ONE | https://doi.org/10.1371/journal.pone.0174850 March 31, 2017 18 / 25

level than others. This suggests that, within sexes, there are clear feeding/habitat segregations
not identified before, which may be a reflection of the abnormal environmental conditions
causing individuals to search for alternative prey. Individual feeding preferences and adjust-
ments to spatial, seasonal and inter-annual variations in resources by exploiting different for-
aging niches were found in several other seabird species [39]. Therefore, fluctuations in
individual specialization within a population may be related to temporal changes in the avail-
ability and predictability of resources [107], and could be, to some extent, a consequence of
dietary sexual specializations. Indeed, when assessing sex-related specializations, females feed-
ing on Antarctic krill (i.e. individuals that fed more than> 80% on Antarctic krill) versus
males feeding on fish (i.e. individuals that fed more than > 80% on fish), females clearly feed
on lower trophic levels (on pelagic crustaceans) in comparison with males (on high trophic
levels (on benthic/bentho-pelagic fish); Fig 4). Therefore, in this abnormal season of low food
availability, males and females do exploit different prey in a consistent way (i.e. in various for-
aging trips, in various days, as confirmed by the red blood cells data).
Despite the significant differences in feather carbon signatures for the end of summer
(March-April; at the end of their breeding period, when their feathers were created), biologi-
cally both sexes may explore similar habitats, as these carbon stable isotopic values are similar
(from Southern Ocean waters; see Results). However, at this time of the year (i.e. pre-moulting
period), penguins may disperse more widely and feed in more profitable areas, despite their
foraging ranges during the breeding season being still relatively short (< 50 km, and often
much less) [37]. In terms of the trophic level (based on δ15N), no differences were found in
feathers, suggesting that both males and female Gentoo penguins also fed on similar prey
(likely to be T. gaudichaudii, that dominated the diet of C. gunnari [108]. Antarctic krill only
represented 12% by mass in Gentoo penguins diets during their breeding period [44]).
Supporting information
S1 Dataset. Raw dataset of the diet of gentoo penguins at Bird Island, South Georgia in
2009.
(XLSX)
Acknowledgments
Pierre Richard, Richard Phillips, Miguel Guerreiro, Pedro Alvito, Vitor Paiva and Jon Watkins
for providing valuable contributions in the laboratory during the planning and execution of
the project. David Thompson for reviewing a final version of the manuscript. We also thank
Marcella Libertelli for aiding the identification of small otoliths. This work is part of SCAR
AnT-ERA, ICED, BAS-CEPH programs. JX is supported by the Investigator FCT program
(IF/00616/2013) and FRC is supported by the Foundation for Science and Technology (Portu-
gal) and the European Social Fund (POPH, EU) through a post-doc grant (SFRH/BPD/95372/
2013). RPV is currently supported by a doctoral grant from the Portuguese Science Founda-
tion (SFRH/BD/84030/2012). This study benefited from the strategic program of MARE,
financed by FCT (MARE—UID/MAR/04292/2013).
Author Contributions
Conceptualization: JX PT GT YC.
Data curation: JX.
Formal analysis: JX FC RM YC.
Foraging segregation in penguins
PLOS ONE | https://doi.org/10.1371/journal.pone.0174850 March 31, 2017 19 / 25

Funding acquisition: JX PT.
Investigation: JX PT FC SA DF EE RV RM CB.
Methodology: JX PT FC SA DF EE RV RM CB.
Project administration: JX PT.
Resources: JX PT.
Software: JX FC RM.
Supervision: JX PT YC.
Validation: JX.
Visualization: JX FC RM.
Writing – original draft: JX PT FC GT RM YC.
Writing – review & editing: JX PT FC GT SA DF EE RV RM CB YC.
References1. Murphy EJ, Watkins JL, Trathan PN, Reid K, Meredith MP, Thorpe SE, et al. Spatial and temporal
operation of the Scotia Sea ecosystem: a review of large-scale links in a krill centred food web. Phil
Trans R Soc B. 2007; 362: 113–148. https://doi.org/10.1098/rstb.2006.1957 PMID: 17405210
2. Murphy EJ and Hofmann EE. End-to-end in Southern Ocean ecosystems. Current opinion in Environ-
mental Sustainability 2012; 4: 264–271.
3. King JC. Recent climate variability in the vicinity of the Antarctic Peninsula. Int J Climatol. 1994; 14:
357–369.
4. Meredith MP, King JC. Rapid climate change in the ocean west of the Antarctic Peninsula during the
second half of the 20th century. Geophys Res Lett. 2005; 32: L19604.
5. Kennicutt MC II, Chown SL, Cassano JJ, Liggett D, Massom R, Peck LS, et al. Six priorities for Antarc-
tic Science (and supplementary material). Nature. 2014; 512: 23–25. https://doi.org/10.1038/512023a
PMID: 25100467
6. Constable AJ, Melbourne-Thomas J, Corney SP, Arrigo K, Barbraud C, Barnes D, et al. Change in
Southern Ocean ecosystems I: How changes in physical habitats directly affect marine biota. Global
change biol. 2014; 20: 3004–3025.
7. Gutt J, Bertler N, Bracegirdle TJ, Buschmann A, Hosie G, Isla E, et al. The Southern Ocean ecosys-
tem under multiple climate change stresses—an integrated circumpolar assessment. Global Change
Biol. 2015; 21: 1434–1453.
8. Montes-Hugo M, Doney SC, Ducklow HW, Fraser W, Martinson D, Stammerjohn SE, et al. Recent
changes in phytoplankton communities associated with rapid regional climate change along the West-
ern Antarctic Peninsula. Science 2009; 323: 1470–1473. https://doi.org/10.1126/science.1164533
PMID: 19286554
9. Reid K, Croxall JP. Environmental response of upper trophic-level predators reveals a system change
in an Antarctic marine ecosystem. Proc R Soc B. 2001; 268: 377–384. https://doi.org/10.1098/rspb.
2000.1371 PMID: 11270434
10. Ducklow HW, Baker K, Martinson DG, Quetin LB, Ross RM, Smith RC, et al. Marine pelagic ecosys-
tems: the West Antarctic Peninsula. Phil Trans R Soc Lond B. 2007; 362: 67–94.
11. Trivelpiece WZ, Hinke JT, Miller AK, Reiss CS, Trivelpiece SG, Watters JM, et al. Variability in krill bio-
mass links harvesting and climate warming to penguin population changes in Antarctica. Proc Natl
Acad Sci USA. 2011; 108: 7625–7628. https://doi.org/10.1073/pnas.1016560108 PMID: 21482793
12. Croxall JP, Trathan PN, Murphy EJ. Environmental change and Antarctic Seabird populations. Sci-
ence 2002; 297: 1510–1514. https://doi.org/10.1126/science.1071987 PMID: 12202819
13. Forcada J, Trathan PN. Penguin responses to climate change in the Southern Ocean. Global Change
Biol. 2009; 15: 1618–1630.
14. Xavier JC, Peck LS. LIfe beyond the ice: marine ecosystems in the Southern Ocean. In: Liggett D.,
Storey B., Cook Y. and Meduna V., editors. Exploring the last continent. Springer International Pub-
lishing, Switzerland. 2015; pp. 229–252.
Foraging segregation in penguins
PLOS ONE | https://doi.org/10.1371/journal.pone.0174850 March 31, 2017 20 / 25

15. Brooke ML. The food consumption of the world´s seabirds. Proc R Soc Lond B. 2004; 271: S246–
S248.
16. Croxall JP, Prince PA. Seabirds as predators on marine resources, especially krill, at South Georgia.
In: Croxall J. P., editor editors. Seabirds: Feeding Ecology and Role in Marine Ecosystems. Cam-
bridge: Cambridge University Press. 1987; pp. 347–368.
17. Hill SL, Keeble K, Atkinson A, Murphy EJ. A food web model to explore uncertainties in the South
Georgia shelf pelagic ecosystem. Deep-Sea Res II. 2012; 59–60: 237–252.
18. Croxall J, Williams T. The gentoo penguin as a candidate species for the CCAMLR Ecosystem Moni-
toring Program Scientific Committee for the Conservation of Antarctic Living Resources, Selected Sci-
entific Papers 1991; WG-CEMP-90/14: 483–488.
19. Xavier JC, Hill SL, Belchier M, Bracegirdle TJ, Murphy EJ, Lopes-Dias J. From ice to penguins: the
role of mathematics in Antarctic research. In: Bourguignon J. P., Jeltsch R., Pinto A. and Viana M., edi-
tors. Mathematics of Energy and Climate Change. CIM Series in Mathematical Sciences 2. Springer-
Verlag, Switzerland. 2015; pp. 389–414.
20. Croxall JP, Reid K, Prince PA. Diet, provisioning and productivity responses of marine predators to dif-
ferences in availability of Antarctic krill. Mar Ecol Prog Ser. 1999; 177: 115–131.
21. Lescroel A, Ridoux V, Bost CA. Spatial and temporal variation in the diet of gentoo penguin (Pygosce-
lis papua) at Kerguelen Islands. Polar Biol. 2004; 27: 206–216.
22. Lynch HJ, Naveen R, Trathan PN, Fagan WF. Spatially integrated assessment reveals widespread
changes in penguin populations on the Antarctic Peninsula. Ecology 2012; 93: 1367–1377. PMID:
22834377
23. Cimino MA, Moline MA, Fraser WR, Patterson-Fraser DL, Oliver MJ. Climate-driven sympatry may
not lead to foraging competition between congeneric top-predators. Scientific reports 2016; 6: 18820.
https://doi.org/10.1038/srep18820 PMID: 26732496
24. Croxall JP, Davis LS. Penguins: paradoxes and patterns. Marine Ornithology 1999; 27: 1–12.
25. Tanton JL, Reid K, Croxall JP and Trathan PN Winter distribution and behaviour of gentoo penguins
Pygoscelis papua at South Georgia. Polar Biol. 2004; 27: 299–303.
26. Williams TD, Briggs DR, Croxall JP, Naito Y, Kato A. Diving pattern and performance in relation to for-
aging ecology in the gentoo penguin Pygoscelis papua. J Zool. 1992; 227: 211–230.
27. Kato A, Williams TD, Barton TR, Rodwell S. Short-term variation in the winter diet of gentoo penguins
Pygoscelis papua at South Georgia during July 1989. Marine Ornithology 1991; 19: 31–38.
28. Williams TD. Foraging ecology and diet of gentoo penguins Pygoscelis papua at South Georgia during
winter and an assessment of their winter krill consumption. Ibis. 1991; 133: 3–13.
29. Renner M, Valencia J, Davis LS, Saez D, Cifuentes O. Sexing of adult Gentoo Penguins in Antarctica
using morphometrics. Colonial Waterbirds 1998: 444–449.
30. Bost CA, Jouventin P. Evolutionary ecology of the Gentoo penguin Pygoscelis papua. In: Davis L. S.
and Darby J., editors. Penguins. Ac. Press. Orlando, Florida, USA. 1990; pp. 85–112.
31. Bost CA, Jouventin P, Pincson du Sel N. Morphometric variability on a microgeographical scale in two
inshore seabirds. J Zool. 1992; 226: 135–149.
32. Lewis S, Benvenuti S, Dall’Antonia L, Griffiths R, Money L, Sherratt TN, et al. Sex-specific foraging
behaviour in a monomorphic seabird. Proc Roy Soc Lond B. 2002; 269: 1687–1693.
33. Gray CM, Hamer KC. Food-provisioning behaviour of male and female Manx shearwaters, Puffinus
puffinus. Animal Behav. 2001; 62: 117e121.
34. Quillfeldt P, Masello JF, Hamer KC. Sex differences in provisioning rules and honest signalling of need
in Manx shearwaters, Puffinus puffinus. Animal Behav. 2004; 68: 613e620.
35. Wearmouth VJ, Sims DW. Sexual segregation in marine fish, reptiles, birds and mammals: behaviour
patterns, mechanisms and conservation implications. Adv mar biol. 2008; 54: 107–170. https://doi.
org/10.1016/S0065-2881(08)00002-3 PMID: 18929064
36. Ruckstuhl K, Neuhaus P. Sexual segregation in vertebrates. Cambridge University Press. 2005;
37. Ratcliffe N, Trathan PN A review of the diet and at sea-distribution of penguins breeding within the
CCAMLR convention area. CCAMLR Science. 2011; 18: 75–114.
38. Cherel Y, Hobson KA, Guinet C, Vanpe C. Stable isotopes document seasonal changes in trophic
niches and winter foraging individuals specialization in diving predators from the Southern Ocean. J
Anim Ecol. 2007; 76: 826–836. https://doi.org/10.1111/j.1365-2656.2007.01238.x PMID: 17584388
39. Ceia FR, Ramos JA. Individual specialization in the foraging and feeding strategies of seabirds: a
review. Mar Biol. 2015; 162: 1923–1938.
Foraging segregation in penguins
PLOS ONE | https://doi.org/10.1371/journal.pone.0174850 March 31, 2017 21 / 25

40. Carravieri A, Bustamante P, Churlaud C, Cherel Y. Penguins as bioindicators of mercury contamina-
tion in the Southern Ocean: Birds from the Kerguelen Islands as a case study. Science of the Total
Environ. 2013; 454: 141–148.
41. Bolnick DI, Smith T, Can intraspecific competition drive disruptive selection? An experimental test in
natural populations of sticklebacks. Evolution. 2004; 58: 608–618. PMID: 15119444
42. Ropert-Coudert Y, Kato A, Meyer X, Pelle M, MacIntosh AJJ, et al. A complete breeding failure in an
Adelie penguin clony correlates with unusual and extreme environmental events. Ecography. 2015;
38: 111–113.
43. Whitehouse MJ, Meredith MP, Rothery P, Atkinson A, Ward P, Korb R. Rapid warming of the ocean
around South Georgia, Southern Ocean, during the 20th Century: Forcings, characteristics and impli-
cations for lower trophic levels. Deep-Sea Research I. 2008; 55: 1218–1228.
44. Hill S, Belchier M, Collins MA, Fielding S, Murphy EJ, Trathan PN. Multiple indicators suggest a strong
ecosystem anomaly at South Georgia in 2009. WG-EMM-09/23.
45. Fielding S, Watkins JL, Trathan PN, Enderlein P, Waluda CM, Stowasser G. Interannual variability in
Antarctic krill (Euphausia superba) density at South Georgia, Southern Ocean: 1997–2013. ICES J
Mar Sci. 2014; 71: 2578–2588.
46. Fielding S, Watkins JL, Collins MA, Enderlein P, Venables HJ. Acoustic determination of the distribu-
tion of fish and krill across the Scotia Sea in Spring 2006, summer 2008 and autumn 2009. Deep-Sea
Research II. 2012; 59–60: 173–188.
47. Schreiber EA. Climate and weather effects on seabirds. In: Schreiber E. A. and Burger J., editors. Biol-
ogy of Marine Birds. CRC Press, Boca Raton, Florida. 2002; pp. 179e216.
48. Ainley DG, Wilson PR, Barton KJ, Ballard G, Nur N, Karl B. Diet and foraging effort of Adelie penguins
in relation to pack-ice conditions in the southern Ross Sea. Polar Biol. 1998; 20: 311–319.
49. Baduini C, Hyrenbach K, Coyle K, Pinchuk A, Mendenhall V, Hunt G. Mass mortality of short-tailed
shearwaters in the south-eastern Bering Sea during summer 1997. Fisheries Oceanogr. 2001; 10:
117–130.
50. Harris MP, Wanless S. Differential responses of Guillemot Uria aalge and Shag Phalacrocorax aristo-
telis to a late winter wreck. Bird Study 1996; 43: 220–230.
51. Tranquilla LM, Hedd A, Burke C, Montevecchi WA, Regular PM, Robertson GJ, et al. High Arctic sea
ice conditions influence marine birds wintering in Low Arctic regions. Estuarine, Coastal and Shelf Sci.
2010; 89: 97–106.
52. Fisher J, Lockley RM. Sea Birds. Collins, London. 1954;
53. Lewis S, Sherratt TN, Hamer KC, Wanless S. Evidence of intra-specific competition for food in a
pelagic seabird. Nature. 2001; 412: 816–819. https://doi.org/10.1038/35090566 PMID: 11518965
54. Selander RK. Sexual selection and dimorphism in birds. In: Champbell B., editor editors. Sexual selec-
tion and the descent of Man. Heinemann, Chicago. 1972; pp. 180–230.
55. Mancini PL, Bond AL, Hobson KA, Duarte LS, Bugoni L. Foraging segregation in tropical and polar
seabirds: Testing the Intersexual Competition Hypothesis. J Exp Mar Biol and Ecol. 2013; 449: 186–
193.
56. Ceia FR, Phillips RA, Ramos JA, Cherel Y, Vieira RP, Richard P, et al. Short- and long-term consis-
tency in the foraging niche of wandering albatrosses. Mar Biol. 2012; 159: 1581–1591.
57. Xavier JC, Trathan PN, Croxall JP, Wood AG, Podesta GP, Rodhouse PG. Foraging ecology and
interactions with fisheries of wandering albatrosses at South Georgia. Fisheries Oceanogr. 2004; 13:
324–344.
58. Xavier JC, Croxall JP, Reid K. Inter-annual variation in the diet of two albatross species breeding at
South Georgia: implications for breeding performance. Ibis. 2003; 145: 593–610.
59. Kane JE. The distribution of Parathemisto gaudichaudii (Guer.), with observations on its life-history in
the 0˚ to 20˚ E sector in the Southern Ocean. Discov Rep. 1966 34: 163–198.
60. Boltovskoy D. South Atlantic zooplankton. Netherlands: Backhuys Publishers, Leiden. 1999; 1–1706
p.
61. Hecht T A. guide to the otoliths of Southern Ocean fishes. South African J. of Antarctic Res. 1987; 17:
2–87.
62. Williams R, McEldowney A. A guide to the fish otoliths from waters off the Australian Antarctic Terri-
tory, Heard and Macquarie Island. ANARE Research Notes. 1990; 173 p.
63. Smale MJ, Watson G, Hecht T. Otolith atlas of Southern African marine fishes. Ichthyological Mono-
graphs of the JLB Smith Institute of Ichthyology. Grahamstown, South Africa. 1995; 1–253 p.
64. Reid K. A guide to the use of otoliths in the study of predators at South Georgia. Cambridge: British
Antarctic Survey. 1996; 40 p.
Foraging segregation in penguins
PLOS ONE | https://doi.org/10.1371/journal.pone.0174850 March 31, 2017 22 / 25

65. Adams NJ, Klages NT. Seasonal variation in the diet of king penguin Aptenodytes patagonicus at
Sub-Antarctic Marion Island. J Zool. 1987; 212: 303–324.
66. Olsson O, North AW. Diet of the king penguin Aptenodytes patagonicus during three summers at
South Georgia. Ibis. 1997; 139: 504–512.
67. Berrow SD, Croxall JP. The diet of white-chinned petrels Procellaria aequinoctialis, Linnaeus 1758, in
years of contrasting prey availability at South Georgia. Antarctic Sci. 1999; 11: 283–292.
68. Croxall JP, North AW, Prince PA. Fish prey of the wandering albatross Diomedea exulans at South
Georgia. Polar Biol. 1988; 9: 9–16.
69. Croxall JP, Hall AJ, Hill HJ, North AW, Rodhouse PG. The food and feeding ecology of the white-
chinned petrel Procellaria aequinoctialis at South-Georgia. J Zool. 1995; 237: 133–150.
70. Xavier JC, Cherel Y. Cephalopod beak guide for the Southern Ocean. British Antarctic Survey. 2009;
129 p.
71. Newsome SD, Rio CMD, Bearhop S, Phillips DL. A niche for isotopic ecology. Front Ecol Environ.
2007; 5: 429–436.
72. Cherel Y, Connan M, Jaeger A, Richard P. Seabird year-round and historical feeding ecology: blood
and feather δ13C and δ15N values document foraging plasticity of small sympatric petrels. Mar Ecol
Prog Ser. 2014; 505: 267–280.
73. Hobson KA, Clark RG. Turnover of δ13C in cellular and plasma reactions of blood: implications for
nondestructive sampling in avian dietary studies. Auk 1993; 110: 638–641.
74. Votier SC, Bearhop S, Witt MJ, Inger R, Thompson D, Newton J. Individual responses of seabirds to
commercial fisheries revealed using GPS tracking, stable isotopes and vessel monitoring systems. J
Appl Ecol. 2010 47: 487–497.
75. Davis RW, Croxall JP, O’Connell MJ. The reproductive energetics of gentoo (Pygoscelis papua) and
macaroni (Eudyptes chrysolophus) penguins at South Georgia. (SC-CAMLR-VIII/BG/14) 1989; 58:
59–74.
76. Cherel Y, Hobson KA, Weimerskirch H. Using stable isotopes to study resource acquisition and alloca-
tion in procellariiform seabirds. Oecologia 2005; 145: 533–540. https://doi.org/10.1007/s00442-005-
0156-7 PMID: 16001219
77. Cherel Y, Hobson KA, Hassani S. Isotopic discrimination between food and blood and feathers of cap-
tive penguins: implications for dietary studies in the wild. Physiol and Biochem Zool. 2005; 78: 106–
115.
78. Jackson AL, Inger R, Parnell AC, Bearhop S. Comparing isotopic niche widths among and within com-
munities: SIBER—Stable Isotope Bayesian Ellipses in R. J Anim Ecol. 2011; 80: 595−602. https://doi.
org/10.1111/j.1365-2656.2011.01806.x PMID: 21401589
79. Layman CA, Arrington DA, Montaña CG, Post DM. Can stable isotope ratios provide for community-
wide measures of trophic structure? Ecology. 2007; 88: 42–48. PMID: 17489452
80. Parnell AC, Inger R, Bearhop S, Jackson AL. Source partitioning using stable isotopes: coping with
too much variation. PLoS ONE. 2010; 5: e9672. https://doi.org/10.1371/journal.pone.0009672 PMID:
20300637
81. Walsh PS, Metzger DA, Higuchi R. Chelex-100 as a medium for simple extraction of DNA for PCR-
based typing from forensic material. Biotechniques. 1991; 10: 506–513. PMID: 1867860
82. Griffiths R, Double MC, Orr K, Dawson RJG. A DNA test to sex most birds. Molecular Ecol. 1998; 7:
1071–1075.
83. Bertellotti M, Tella JL, Godoy JA, Blanco G, Forero MG, Donazar JA, et al. Determining sex of Magel-
lanic penguins using molecular procedures and discriminant functions. Waterbirds. 2002 25(4): 479–
484.
84. Constantini V, Guaricci AC, Laricchiuta P, Rausa P, Lacalandra GM. DNA sexing in Humboldt Pen-
guins (Spheniscus humboldti) from feather samples. Animal Reproduction Sci. 2008 106: 162–167.
85. Williams TD. Annual variation in breeding biology of gentoo penguins, (Pygoscelis papua) at Bird
Island, South Georgia. (WG-CEMP-90/38) 1990.
86. R Core Team. R: a language and environment for statistical computing. R Foundation for Statistical
Computing, Viena. 2013;
87. Berrow SD, Taylor RI, Murray AWA. Influence of sampling protocol on diet determination of gentoo
penguins Pygoscelis papua and Antarctic fur seals Arctocephalus gazella. Polar Biol. 1999; 22: 156–
163.
88. Brierley AS, Watkins JL, Goss C, Wilkinson MT, Everson I. Acoustic estimates of krill density at South
Georgia, 1981 to 1998. CCAMLR Science. 1999; 6: 47–57.
Foraging segregation in penguins
PLOS ONE | https://doi.org/10.1371/journal.pone.0174850 March 31, 2017 23 / 25
89. Croxall JP, Davis RW, Oconnell MJ. Diving patterns in relation to diet of Gentoo and Macaroni Pen-
guins at South Georgia. Condor. 1988; 90: 157–167.
90. Croxall JP, Prince PA. The food of gentoo penguins Pygoscelis papua and macaroni penguins
Eudyptes chrysolophus at South Georgia. Ibis. 1980; 122: 245–253.
91. Bearhop S, Phillips RA, McGill R, Cherel Y, Dawson DA, Croxall JP. Stable isotopes indicate sex-spe-
cific and long-term individual foraging specialization in diving seabirds. Mar Ecol Prog Ser. 2006; 311:
157–164.
92. Forero MG, Hobson KA, Bortolotti GR, Donazar JA, Bertellotti M, Blanco G. Food resource utilisation
by Magellanic penguin evaluated through stable isotope analysis: segregation by sex and age and
influence of offspring quality. Mar Ecol Prog Ser. 2002; 234: 289–299.
93. Ludynia K, Dehnhard N, Poisbleau M, Demongin L, Masello JF, Voigt CC, et al. Sexual segregation in
rockhopper penguins during incubation. Animal Behav. 2013; 85: 255–267.
94. Rey AR, Putz K, Scioscia G, Luthi B, Schiavini A. Sexual differences in the foraging behaviour of Mag-
ellanic Penguins related to stage of breeding. Emu. 2012; 112: 90–96.
95. Green JA, Boyd IL, Woakes AJ, Warren NL, Butler PJ. Behavioural plasticity during year-round forag-
ing in Macaroni Penguins. Mar Ecol Prog Ser. 2005; 296: 183–196.
96. Gon O, Heemstra PC. Fishes of the Southern Ocean. Grahamstown, South Africa: JLB Smith Insti-
tute of Ichthyology. 1990;
97. McKenna JEJ. Trophic relationships within the Antarctic demersal fish community of South Georgia
Island. Fishery Bull. 1991; 89: 643–654.
98. Bost C- A, Lage J, Putz K. Maximum diving depth and diving patterns of the Gentoo penguin Pygosce-
lis papua at the Crozet Islands. Marine Ornit. 1994; 22: 237–244.
99. Volkman NJ, Jazdzewski K, Kittel W, Trivelpiece WZ. Diets of Pygoscelis Penguins at King George
Island, Antarctica. Condor. 1980; 82: 373–378.
100. Chappell MA, Janes DN, Shoemaker VH, Bucher TL, Maloney SK. Reproductive effort in Adelie pen-
guins. Behav Ecol Sociobiol. 1993; 33: 173–182.
101. Clarke J, Manly B, Kerry K, Gardner H, Franchi E, Corsolini S., et al. Sex differences in Adelie penguin
foraging strategies. Polar Biol. 1998; 20: 248–258.
102. Dehnhard N, Voigt CC, Poisbleau M, Demongin L, Quillfeldt P. Stable isotopes in southern rockhopper
penguins: foraging areas and sexual differences in the non-breeding period. Polar Biol. 2011; 34:
1763–1773.
103. Masello JF, Mundry R, Poisbleau M, Demongin L, Voigt CC, Wikelski M., et al. Diving seabirds share
foraging space and time within and among species. Ecosphere. 2010; 1: 1–28.
104. Wienecke BC, Robertson G. Foraging space of emperor penguins Aptenodytes forsteri in Antarctic
shelf waters in winter. Mar Ecol Prog Ser. 1997; 159: 249–263.
105. Taylor SS, Leonard ML, Boness DJ, Majluf P. Foraging by Humboldt penguins (Spheniscus hum-
boldti) during the chick-rearing period: general patterns, sex differences, and recommendations to
reduce incidental catches in fishing nets. Canadian J. Zool. 2002; 80: 700–707.
106. Stowasser G, Atkinson A, McGill RAR, Phillips RA, Collins MA, Pond DW. Food web dynamics in the
Scotia Sea in summer: A stable isotope study. Deep Sea Research Part II. 2012; 59–60: 208–221.
107. Ceia FR, Paiva VH, Garthe S, Marques JC, Ramos JA. Can variations in the spatial distribution at sea
and isotopic niche width be associated with consistency in the isotopic niche of a pelagic seabird spe-
cies? Marine Biol. 2014; 161: 1861–1872.
108. Main CE, Collins MA, Mitchell R, Belchier M. Identifying patterns in the diet of mackerel icefish
(Champsocephalus gunnari) at South Georgia using bootstrapped confidence intervals of a dietary
index. Polar Biol. 2009; 32: 569–581.
109. Reynolds RW, Rayner NA, Smith TM, Stokes DC, Wang W. An Improved In Situ and Satellite SST
Analysis for Climate. J Climate. 2002; 15: 1609–1625.
110. Angelier F, Bost CA, Giraudeau M, Bouteloup G, Dano S, Chastel O. Corticosterone and foraging
behavior in a diving seabird: The Adelie penguin, Pygoscelis adeliae. Gen Comp Endocrinol. 2008;
156: 134–144. https://doi.org/10.1016/j.ygcen.2007.12.001 PMID: 18221738
111. Watanuki Y, Takahashi A, Sato K. Feeding area specialization of chick-rearing Adelie penguins
Pygoscelis adeliae in a fast sea-ice area. Ibis. 2003; 145: 558–564.
112. Gorman KB, Williams TD, Fraser WR. Ecological sexual dimorphism and environmental variability
within a community of Antarctic Penguins (Genus Pygoscelis). PloSONE. 2014; 9: e90081.
113. Trivelpiece WZ, Trivelpiece SG, Volkman NJ, Ware SH. Breeding and feeding ecologies of Pygoscelid
penguins. Ant J US. 1983; 18: 209–210.
Foraging segregation in penguins
PLOS ONE | https://doi.org/10.1371/journal.pone.0174850 March 31, 2017 24 / 25

114. Baylis AMM, Orben RA, Pistorius P, Brickle P, Staniland I, Ratcliffe N. Winter foraging site fidelity of
king penguins breeding at the Falkland Islands. Mar Biol. 2015; 162: 99–110.
115. Bethge P, Nicol S, Culik B, Wilson R. Diving behaviour and energetics in breeding little penguins
(Eudyptula minor). J Zool. 1997; 242: 483–502.
116. Chiaradia A, Forero MG, Hobson KA, Swearer SE, Hume F, Renwick L, et al. Diet segregation
between two colonies of little penguins Eudyptula minor in southeast Australia. Austral Ecol. 2012;
37: 610–619.
117. Ropert-Coudert Y, Kato A, Naito Y, Cannell B. Individual diving strategies in the little penguin. Water-
birds. 2003; 4: 403–408.
118. Barlow KE, Croxall JP. Seasonal and interannual variation in foraging range and habitat of macaroni
penguins at South Georgia. Mar Ecol Prog Ser. 2002; 232: 291–304.
119. Hull CL. Comparative diving behaviour and segregation of the marine habitat by breeding royal pen-
guins, Eudyptes schlegeli, and eastern rockhopper penguins, Eudyptes chrysocome filholi, at Mac-
quarie Island. Can J Zool. 2000; 78: 333–345.
120. Seddon P, van Heezik Y. Diving depths of the yellow-eyed penguin Megadyptes antipodes. Emu.
1990; 90: 53–57.
Foraging segregation in penguins
PLOS ONE | https://doi.org/10.1371/journal.pone.0174850 March 31, 2017 25 / 25
View publication statsView publication stats
Top Related