


Languages
Pages
Legal


- 1 -
SEWERAGE MASTER PLAN: Phase 2 Stage 2 Urban Areas
COMMISSION No: B865 October 2009

- 2 -
COMMISSION No. B865
NELSON MANDELA BAY MUNICIPALITY
SEWERAGE MASTER PLAN: URBAN AREAS
CONTENTS
Page no.
1.
Executive Summary INTRODUCTION
4
2. GOALS AND OBJECTIVES OF THE URBAN SEWERAGE MASTER PLAN 4
2.1 The Integrated Development Plan (IDP) 4
2.2 The Water Services Development Plan (WSDP) 5
2.3 Spatial Development Plan 5
2.4 Sewer Master Plan Objectives 5
3 MASTER PLAN AREA 6
4 PLANNING METHODOLOGY 6
5 FLOW CALCULATIONS AND ANALYSIS 7
5.1 Flows from the various catchment areas 8
5.2 Analysis Summary 9
6 PROJECTED COST ESTIMATES 10
7 GENERAL DESCRIPTIONS OF THE CATCHMENTS 12
7.1 Upper Baakens – Consultant: Goba 12
7.2 Lower Baakens – Consultant: SSI 13
7.3 Driftsands – Consultant: Manong 14
7.4 City - Consultant: EAS 15
7.5 Paapenkuils - Consultant: FST/Goba 15
7.6 Chatty - Consultant: Africon 16
7.7 Swartkops - Consultant: Ninham Shand 17
7.8 Markman - Consultant: Lukhozi 17
7.9 Motherwell - Consultant: Izizwe 18
7.10 Motherwell North / Coega - Consultant: Letsunyane 19
7.11 Despatch - Consultant: KV3 20
7.12 Uitenhage - Consultant: SBA 21
7.13 Despatch - Consultant: Jeffares & Green 22
7.14 Jagtvlakte (Uitenhage) - Consultant: ILISO 22
8 WASTEWATER TREATMENT WORKS
24
- 3 -
9 10
PUMP STATIONS CONCLUSIONS
29 32
11 RECOMMENDATIONS 32
12 ACKNOWLEDGEMENTS 33
COMMISSION No. B865
NELSON MANDELA BAY MUNICIPALITY
SEWERAGE MASTER PLAN: URBAN AREAS

- 4 -

- 5 -
1. INTRODUCTION
In its letter Ref. B865, dated 12 September 2005, the Office of the Infrastructure
and Engineering Business Unit of the Nelson Mandela Bay Municipality (NMBM)
appointed ILISO Consulting, in conjunction with Cabitech, to provide consulting
engineering services and prepare a sewerage master plan for the urban areas of
the metro.
The NMBM is deemed a Water Service Authority (WSA) and incorporates the
management structure of the old Port Elizabeth Municipality, Uitenhage and
Despatch, which in the past was responsible for the provision of sanitation
infrastructure to predominantly urban areas.
2. GOALS AND OBJECTIVES OF THE URBAN SEWERAGE
MASTERPLAN
The sewerage master plan is part of a series of plans which cascade down from the
Integrated Development Plan (IDP); the Water Services Development Plan (WSDP)
and the Spatial Development Framework (SDF).
2.1 The Integrated Development Plan (IDP)
The Integrated Development Plan provides the basis for the managed
development of the NMBM and will be used by the political, business and
community leadership to determine activities and operational plans and guide the
allocation of resources until and beyond 2020. It is imperative that the future of
the NMBM be understood as reflected by the Vision 2020. The IDP is the initial
plan in pursuance of the long term transformation agenda.

- 6 -
2.2 The Water Services Development Plan (WSDP)
This section highlights the goals and objectives of the WSDP, that relate to the
sewerage master plan.
The WSDP for the Metro has to serve a number of purposes, viz.:
It should serve as a useful communication and reference tool for councillors,
when the status of water services within the various wards is under
discussion.
It should serve as proof to other spheres of government (e.g. as represented
by DWAF) that the NMBM is exercising due diligence in managing its water
services.
2.3 Spatial Development Framework (SDF)
The SDF has a spatial planning focus. Spatial planning is a public sector activity
that creates a public investment and regulatory framework within which private
sector decision making and investment occurs.
2.4 Sewer Master plan Objectives
The sewer master plan had the following objectives:
Capture and map the existing bulk lines, 200mm diameter and larger, pump
stations, flow diversions and siphons.
Analyse of the flow capacity of the existing sewer reticulation network
Highlight all existing network deficiencies
Identify, with the city planners, the future potential development nodes for
2010, 2015 and 2020 scenarios.
Determine the effect that the additional loading, as a result of these future
development nodes, will have on the existing sewer network and comment on
future upgrading requirements.
Estimate capital funding requirements for the planning scenarios up until the
year 2020.

- 7 -
3. MASTER PLAN AREA
The areas, as depicted on the Spatial Development Framework were used as the
basis for master planning. All areas within the urban fence were included, with
additional areas earmarked for urban sprawl, such as Greenbushes, Bushy Park
and Draaifontein.
This master plan was not based on percentage linear growth but rather on future
development scenarios – development time frames were determined by the
NMBM town planners. Unfortunately, however, the Local Development Frame
Work (LSDF) was not completed for the majority of the sewer catchment areas.
4. PLANNING METHODOLOGY
The NMBM appointed 14 consultants during September 2007 to conduct a
detailed study of their respective catchment areas, as shown on drawing no
B865_17
Work was broken down into the following components:
a) Existing infrastructure – Define the boundaries of the catchment area; identify
infrastructure detail from record drawings; survey areas where information is
lacking; update record drawings; undertake a flow analysis of the existing
network; provide augmentation proposals if required; capture all information
on GIS system.
b) Future developments – Identify all future developments within the urban
edge; determine development time frames in consultation with the NMBM
town planners; compile a preliminary layout of bulk lines required to drain
future developments; Analyse entire catchment network (existing and future)
for 2010, 2015 and 2020 scenarios, to determine future pipe sizes and
constrictions in existing system.
- 8 -
Catchment assessments were completed towards the end of 2008. This took
longer than was originally planned due to initial problems in obtaining the existing
sewer network information from the various offices of the NMBM.
Field surveys of existing infrastructure were also extremely time consuming and
in particular, the Swartkops catchment took 4 months longer than planned, as a
result of to silted lines, limited access to manholes and security problems.
5. FLOW CALCULATION AND ANALYSIS
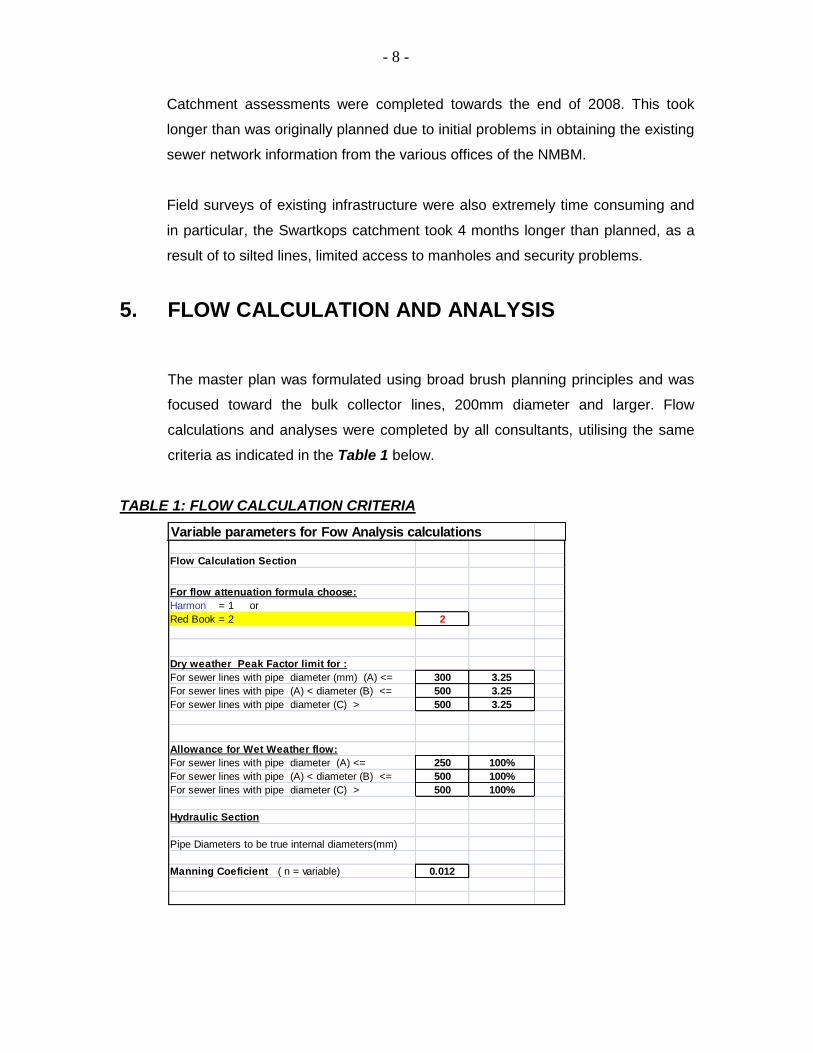
The master plan was formulated using broad brush planning principles and was
focused toward the bulk collector lines, 200mm diameter and larger. Flow
calculations and analyses were completed by all consultants, utilising the same
criteria as indicated in the Table 1 below.
TABLE 1: FLOW CALCULATION CRITERIA
Variable parameters for Fow Analysis calculations
Flow Calculation Section
For flow attenuation formula choose:
Harmon = 1 or
Red Book = 2 2
Dry weather Peak Factor limit for :
For sewer lines with pipe diameter (mm) (A) <= 300 3.25
For sewer lines with pipe (A) < diameter (B) <= 500 3.25
For sewer lines with pipe diameter (C) > 500 3.25
Allowance for Wet Weather flow:
For sewer lines with pipe diameter (A) <= 250 100%
For sewer lines with pipe (A) < diameter (B) <= 500 100%
For sewer lines with pipe diameter (C) > 500 100%
Hydraulic Section
Pipe Diameters to be true internal diameters(mm)
Manning Coeficient ( n = variable) 0.012

- 9 -
In addition, the ‘Red Book’ attenuation formula was utilised and all calculations
were undertaken in accordance with the agreed NMBM Flow Categories, as
shown in Table 2 below and the standard NMBM excel flow calculation spread
sheets.
TABLE 2: FLOW CALCULATION CRITERIA
Categories for Flow Analysis
ADWF/erf People Erf Size Socio -economic group
l/e/d per erf m2
1 750 4.8 850 High
2 625 4.5 650 Medium
3 550 5.5 400 Low
4 400 3.5 350 Town Houses & Group Housing
5 525 8.5 300 Site & Service - Formal Houses
6 400 6.5 200 Informal Structures - Green Fields dev.
7 3500 10 1000 Industrial & dense Commercial
8 1750 15 1000 Industrial for areas > 10ha
9 Variable figures to be provided for Wet Industries
5.1 Flows from the various Catchment Areas
Analysis was undertaken, based on four scenarios:
the existing systems
2010
2015
and 2020
The modelling of future development scenarios was based on the Spatial
Development Framework (SDF). In order to establish the ultimate incoming flows
at the various waste water treatment works, the individual drainage catchments
were linked in the model, to create a larger “Waste Water Treatment Catchment”.
The analysis results from this exercise, when compared to actual flows measured
at the various treatment works, compare well, but are generally slightly higher (in
the order of 10 to 15%) than the measured flows. For master planning purposes
this provides a conservative buffer.
- 10 -
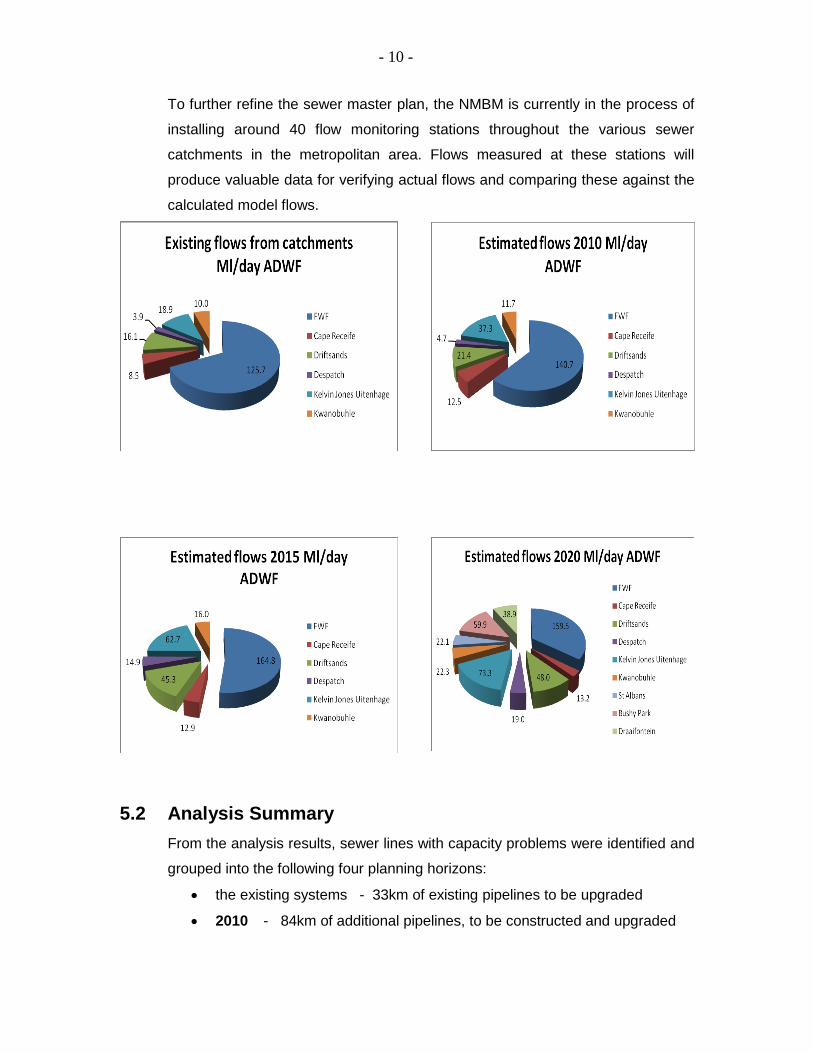
To further refine the sewer master plan, the NMBM is currently in the process of
installing around 40 flow monitoring stations throughout the various sewer
catchments in the metropolitan area. Flows measured at these stations will
produce valuable data for verifying actual flows and comparing these against the
calculated model flows.
5.2 Analysis Summary
From the analysis results, sewer lines with capacity problems were identified and
grouped into the following four planning horizons:
the existing systems - 33km of existing pipelines to be upgraded
2010 - 84km of additional pipelines, to be constructed and upgraded
- 11 -
2015 - 92km of additional pipelines, to be constructed and upgraded
2020 - 77km of additional pipelines, to be constructed and upgraded
Thus a total of 286km of sewer pipelines are required to be constructed and
upgraded from present, to the 2020 horizon.
6 PROJECTED COST ESTIMATES
Cost estimates for the upgrading of existing lines, construction of new sewer
lines, siphons, pump stations, pipe bridges, pipe jacking and rising mains were
prepared. These cost estimates only provide an indication of global costs, as no
designs have been undertaken. More detailed cost estimates will have to be
conducted on a project by project basis, as and when the required work is
programmed.
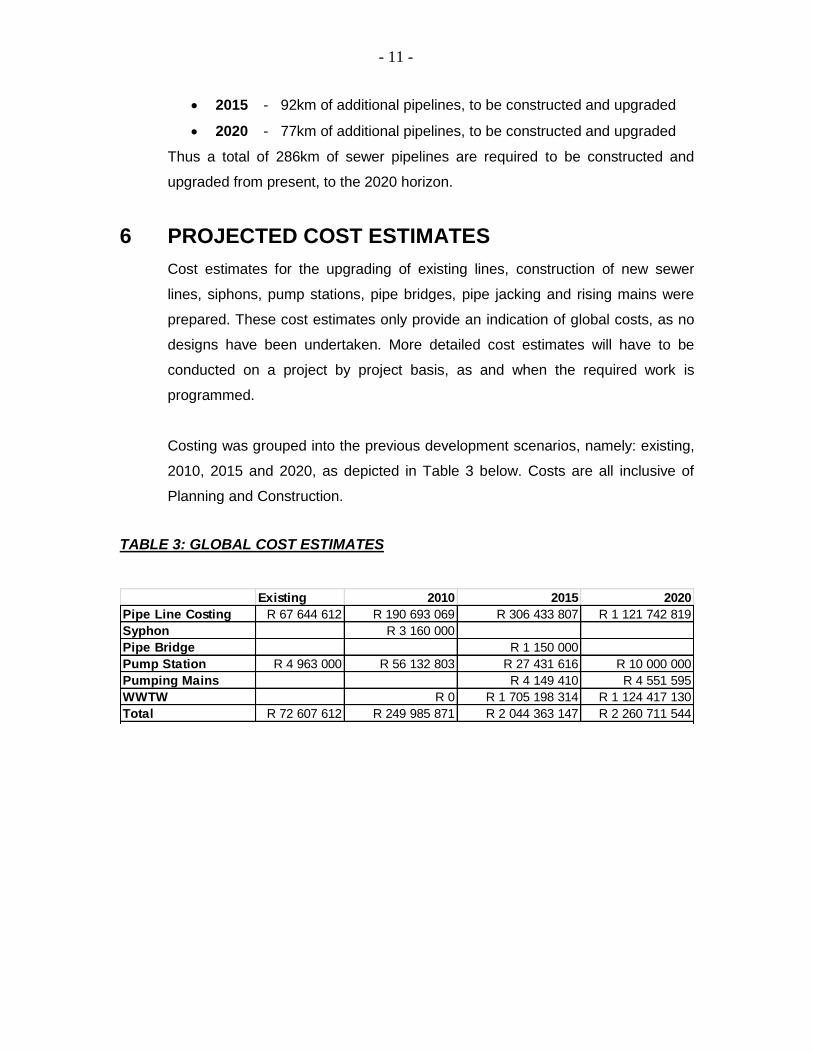
Costing was grouped into the previous development scenarios, namely: existing,
2010, 2015 and 2020, as depicted in Table 3 below. Costs are all inclusive of
Planning and Construction.
TABLE 3: GLOBAL COST ESTIMATES
Existing 2010 2015 2020
Pipe Line Costing R 67 644 612 R 190 693 069 R 306 433 807 R 1 121 742 819
Syphon R 3 160 000
Pipe Bridge R 1 150 000
Pump Station R 4 963 000 R 56 132 803 R 27 431 616 R 10 000 000
Pumping Mains R 4 149 410 R 4 551 595
WWTW R 0 R 1 705 198 314 R 1 124 417 130
Total R 72 607 612 R 249 985 871 R 2 044 363 147 R 2 260 711 544
- 12 -
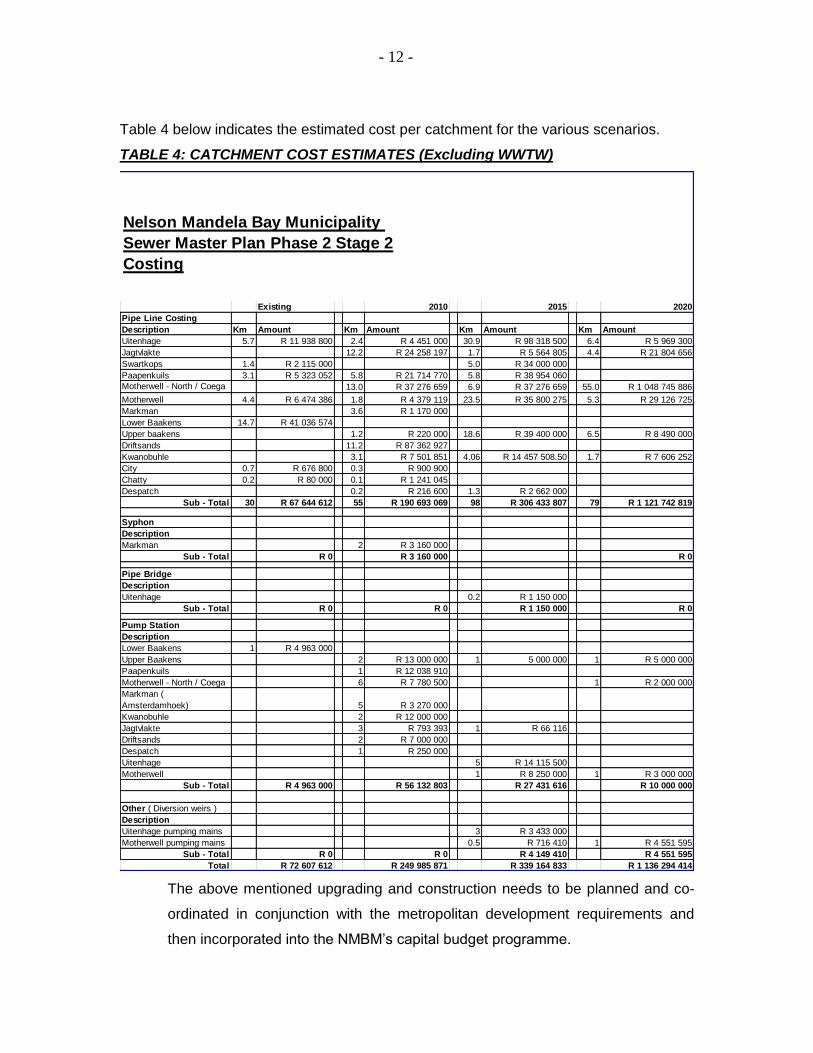
Table 4 below indicates the estimated cost per catchment for the various scenarios.
TABLE 4: CATCHMENT COST ESTIMATES (Excluding WWTW)
Nelson Mandela Bay Municipality
Sewer Master Plan Phase 2 Stage 2
Costing
Existing 2010 2015 2020
Pipe Line Costing
Description Km Amount Km Amount Km Amount Km Amount
Uitenhage 5.7 R 11 938 800 2.4 R 4 451 000 30.9 R 98 318 500 6.4 R 5 969 300
Jagtvlakte 12.2 R 24 258 197 1.7 R 5 564 805 4.4 R 21 804 656
Swartkops 1.4 R 2 115 000 5.0 R 34 000 000
Paapenkuils 3.1 R 5 323 052 5.8 R 21 714 770 5.8 R 38 954 060
Motherwell - North / Coega 13.0 R 37 276 659 6.9 R 37 276 659 55.0 R 1 048 745 886
Motherwell 4.4 R 6 474 386 1.8 R 4 379 119 23.5 R 35 800 275 5.3 R 29 126 725
Markman 3.6 R 1 170 000
Lower Baakens 14.7 R 41 036 574
Upper baakens 1.2 R 220 000 18.6 R 39 400 000 6.5 R 8 490 000
Driftsands 11.2 R 87 362 927
Kwanobuhle 3.1 R 7 501 851 4.06 R 14 457 508.50 1.7 R 7 606 252
City 0.7 R 676 800 0.3 R 900 900
Chatty 0.2 R 80 000 0.1 R 1 241 045
Despatch 0.2 R 216 600 1.3 R 2 662 000
Sub - Total 30 R 67 644 612 55 R 190 693 069 98 R 306 433 807 79 R 1 121 742 819
Syphon
Description
Markman 2 R 3 160 000
Sub - Total R 0 R 3 160 000 R 0
Pipe Bridge
Description
Uitenhage 0.2 R 1 150 000
Sub - Total R 0 R 0 R 1 150 000 R 0
Pump Station
Description
Lower Baakens 1 R 4 963 000
Upper Baakens 2 R 13 000 000 1 5 000 000 1 R 5 000 000
Paapenkuils 1 R 12 038 910
Motherwell - North / Coega 6 R 7 780 500 1 R 2 000 000
Markman (
Amsterdamhoek) 5 R 3 270 000
Kwanobuhle 2 R 12 000 000
Jagtvlakte 3 R 793 393 1 R 66 116
Driftsands 2 R 7 000 000
Despatch 1 R 250 000
Uitenhage 5 R 14 115 500
Motherwell 1 R 8 250 000 1 R 3 000 000
Sub - Total R 4 963 000 R 56 132 803 R 27 431 616 R 10 000 000
Other ( Diversion weirs )
Description
Uitenhage pumping mains 3 R 3 433 000
Motherwell pumping mains 0.5 R 716 410 1 R 4 551 595
Sub - Total R 0 R 0 R 4 149 410 R 4 551 595
Total R 72 607 612 R 249 985 871 R 339 164 833 R 1 136 294 414
The above mentioned upgrading and construction needs to be planned and co-
ordinated in conjunction with the metropolitan development requirements and
then incorporated into the NMBM’s capital budget programme.
- 13 -
7 GENERAL DESCRIPTIONS OF THE CATCHMENTS
This section provides more detailed information on each of the individual
catchment areas as summarised in section 6 above.
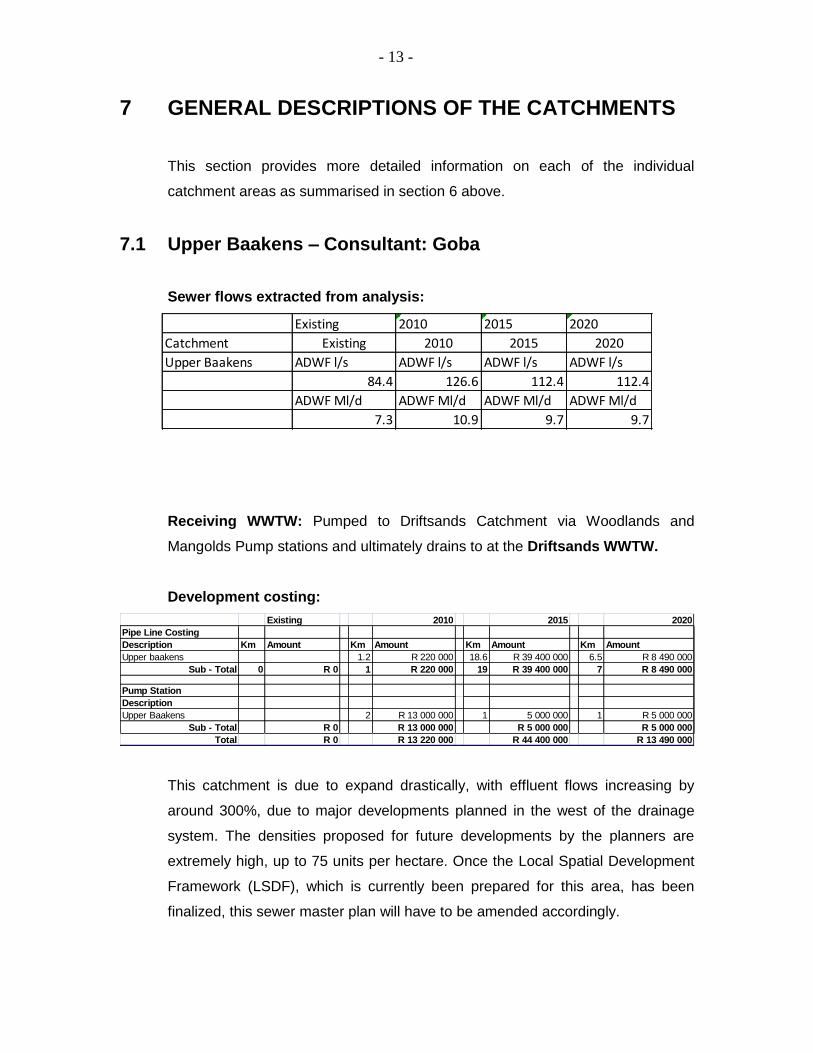
7.1 Upper Baakens – Consultant: Goba
Sewer flows extracted from analysis:
Existing 2010 2015 2020
Catchment
Upper Baakens ADWF l/s ADWF l/s ADWF l/s ADWF l/s
84.4 126.6 112.4 112.4
ADWF Ml/d ADWF Ml/d ADWF Ml/d ADWF Ml/d
7.3 10.9 9.7 9.7
Existing 2010 2015 2020
Receiving WWTW: Pumped to Driftsands Catchment via Woodlands and
Mangolds Pump stations and ultimately drains to at the Driftsands WWTW.
Development costing:
Existing 2010 2015 2020
Pipe Line Costing
Description Km Amount Km Amount Km Amount Km Amount
Upper baakens 1.2 R 220 000 18.6 R 39 400 000 6.5 R 8 490 000
Sub - Total 0 R 0 1 R 220 000 19 R 39 400 000 7 R 8 490 000
Pump Station
Description
Upper Baakens 2 R 13 000 000 1 5 000 000 1 R 5 000 000
Sub - Total R 0 R 13 000 000 R 5 000 000 R 5 000 000
Total R 0 R 13 220 000 R 44 400 000 R 13 490 000
This catchment is due to expand drastically, with effluent flows increasing by
around 300%, due to major developments planned in the west of the drainage
system. The densities proposed for future developments by the planners are
extremely high, up to 75 units per hectare. Once the Local Spatial Development
Framework (LSDF), which is currently been prepared for this area, has been
finalized, this sewer master plan will have to be amended accordingly.

- 14 -
Three areas bordering the Upper Baakens Catchment; namely, Bushy Park,
Draaifontein and Greenbushes, have been included in the master plan study.
Although these areas fall outside the current urban fence, they have been
identified as future development nodes, the timeframes of which would probably
extend past the 2020 planning horizon.
7.2 Lower Baakens – Consultant: SSI
Sewer flows extracted from analysis:
Lower baakens ADWF l/s ADWF l/s ADWF l/s ADWF l/s
98.4 144.8 149.0 152.7
ADWF Ml/d ADWF Ml/d ADWF Ml/d ADWF Ml/d
8.5 12.5 12.9 13.2
Existing 2010 2015 2020
Receiving WWTW: Cape Receife WWTW
(Effluent from the upper regions of this catchment is pumped, via the Mangolds
Pump Station, into the Driftsands system).
Development costing:
Existing 2010 2015 2020
Pipe Line Costing
Description Km Amount Km Amount Km Amount Km Amount
Lower Baakens 14.7 R 41 036 574
Sub - Total 15 R 41 036 574 0 R 0 0 R 0 0 R 0
Pump Station
Description
Lower Baakens 1 R 4 963 000
Sub - Total R 4 963 000 R 0 R 0 R 0
Total R 45 999 574 R 0 R 0 R 0
This catchment is one of the smallest catchments, with very little large scale new
development taking place. The long awaited Madiba Bay Development would
have a minor impact on this catchment. Flows increase by 55% up to 2020
mainly due to infill developments.

- 15 -
7.3 Driftsands – Consultant: Manong
Sewer flows extracted from analysis:
Driftsands ADWF l/s ADWF l/s ADWF l/s ADWF l/s
186.8 248.2 524.7 555.3
ADWF Ml/d ADWF Ml/d ADWF Ml/d ADWF Ml/d
16.1 21.4 45.3 48.0
2010 2015Existing 2020
Receiving WWTW: Driftsands WWTW
Development costing:
Existing 2010 2015 2020
Pipe Line Costing
Description Km Amount Km Amount Km Amount Km Amount
Driftsands 11.2 R 87 362 927
Sub - Total 0 R 0 11 R 87 362 927 0 R 0 0 R 0
Pump Station
Description
Driftsands 2 R 7 000 000
Sub - Total R 0 R 7 000 000 R 0 R 0
Total R 0 R 94 362 927 R 0 R 0
Effluent flow from the Upper Baakens drains into the Driftsands catchment via
the Woodlands and Mangolds pump station, as well as a small portion of the
effluent flow from the upper regions of the Lower Baakens Catchment.
Major developments will take place in the upper region of the Upper Baakens
system – draining down into the Driftsands system via a new proposed high level
collector sewer. Other than the increased flows from future developments in the
Upper Baakens system, additional developments in this catchment are relatively
small, with some minor development taking place around the Arlington race
course.

- 16 -
7.4 City – Consultant: EAS
Sewer flows extracted from analysis:
City combined ADWF l/s ADWF l/s ADWF l/s ADWF l/s
357.8 365.4 371.6 376.7
ADWF Ml/d ADWF Ml/d ADWF Ml/d ADWF Ml/d
30.9 31.6 32.1 32.5
Existing 2010 2015 2020
Receiving WWTW: Creek Pump Station – Fish Water Flats WWTW
Development costing:
Existing 2010 2015 2020
Pipe Line Costing
Description Km Amount Km Amount Km Amount Km Amount
City 0.7 R 676 800 0.3 R 900 900
Sub - Total 1 R 676 800 0 R 900 900 0 R 0 0 R 0
Total R 676 800 R 900 900 R 0 R 0
This is the oldest catchment and required substantial survey work to obtain
existing data. With the exception of a few land use changes within the catchment,
no new developments are anticipated. Flows increase by only 5 % by 2010,
when further development is complete. This is the smallest increase to flows out
of all the catchments.
7.5 Paapenkuils – Consultant: FST / Goba
Sewer flows extracted from analysis:
Existing 2010 2015 2020
Paapenkuils ADWF l/s ADWF l/s ADWF l/s ADWF l/s
246.7 284.4 329.4 335.8
ADWF Ml/d ADWF Ml/d ADWF Ml/d ADWF Ml/d
21.3 24.6 28.5 29.0
Receiving WWTW: Creek Pump station then on to Fish Water Flats WWTW

- 17 -
Development costing:
Existing 2010 2015 2020
Pipe Line Costing
Description Km Amount Km Amount Km Amount Km Amount
Paapenkuils 3.1 R 5 323 052 5.8 R 21 714 770 5.8 R 38 954 060
Sub - Total 3 R 5 323 052 6 R 21 714 770 6 R 38 954 060 0 R 0
Total R 5 323 052 R 21 714 770 R 38 954 060 R 0
The western portion of the old Paapenkuils catchment is fully developed with new
developments taking place along the western boundary of the catchment. These
developments increase the flow by 36% by the year 2020. The Paapenkuils
system is drained via two (2) bulk lines, one flowing to the Creek Pump Station
and the other into the rising main from the Creek pump station towards the Fish
Water Flats treatment works.
7.6 Chatty – Consultant: Africon
Sewer flows extracted from analysis:
ADWF Ml/d ADWF Ml/d ADWF Ml/d ADWF Ml/d
0.7 0.7 0.7 0.7
Total Chatty 18.1 20.2 31.0 32.0
Existing 2010 2015 2020
Receiving WWTW: Via the Swartkops catchment to the Fish Water Flats
WWTW.
Development costing:
Existing 2010 2015 2020
Pipe Line Costing
Description Km Amount Km Amount Km Amount Km Amount
Chatty 0.2 R 80 000 0.1 R 1 241 045
Sub - Total 0 R 80 000 0 R 1 241 045 0 R 0 0 R 0
Total R 80 000 R 1 241 045 R 0 R 0
The Chatty system is relatively new and additional bulk infrastructure has been
installed over the last 5 years to make provision for the proposed new
developments to the north. The existing bulk infrastructure can, to a large extent,
accommodate the 77 % increase in flow.
- 18 -
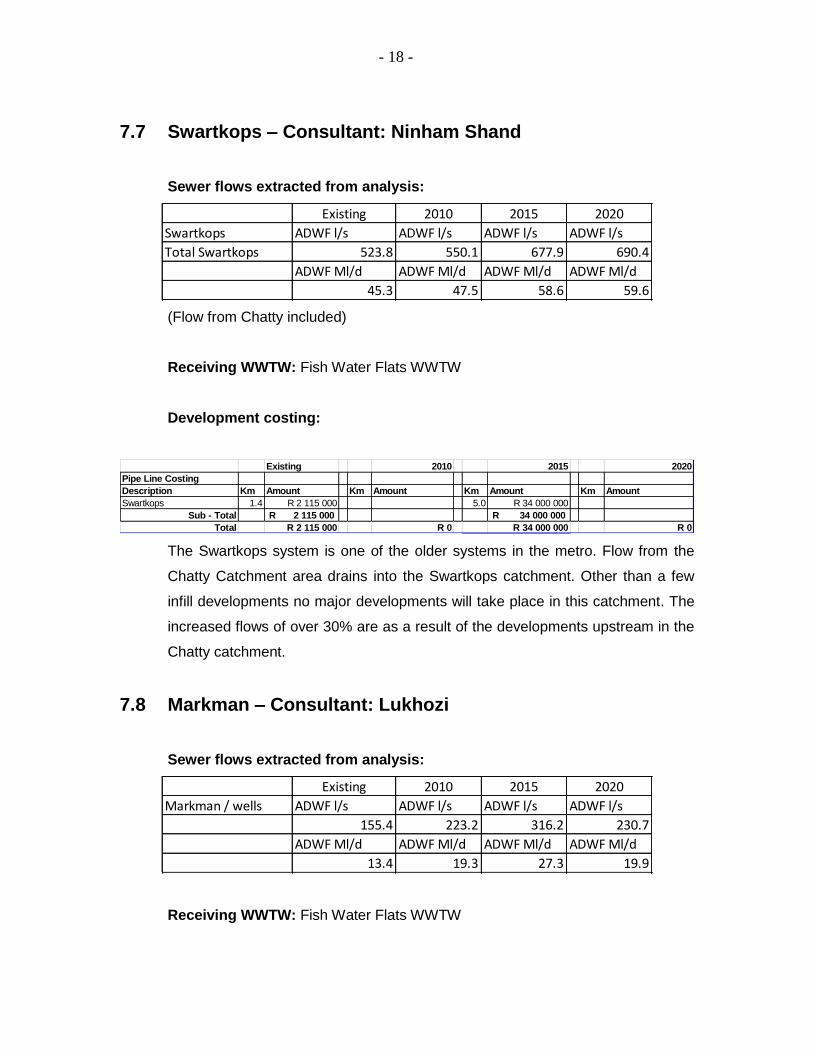
7.7 Swartkops – Consultant: Ninham Shand
Sewer flows extracted from analysis:
Swartkops ADWF l/s ADWF l/s ADWF l/s ADWF l/s
Total Swartkops 523.8 550.1 677.9 690.4
ADWF Ml/d ADWF Ml/d ADWF Ml/d ADWF Ml/d
45.3 47.5 58.6 59.6
2010 2015Existing 2020
(Flow from Chatty included)
Receiving WWTW: Fish Water Flats WWTW
Development costing:
Existing 2010 2015 2020
Pipe Line Costing
Description Km Amount Km Amount Km Amount Km Amount
Swartkops 1.4 R 2 115 000 5.0 R 34 000 000
Sub - Total 2 115 000R 34 000 000R
Total R 2 115 000 R 0 R 34 000 000 R 0
The Swartkops system is one of the older systems in the metro. Flow from the
Chatty Catchment area drains into the Swartkops catchment. Other than a few
infill developments no major developments will take place in this catchment. The
increased flows of over 30% are as a result of the developments upstream in the
Chatty catchment.
7.8 Markman – Consultant: Lukhozi
Sewer flows extracted from analysis:
Markman / wells ADWF l/s ADWF l/s ADWF l/s ADWF l/s
155.4 223.2 316.2 230.7
ADWF Ml/d ADWF Ml/d ADWF Ml/d ADWF Ml/d
13.4 19.3 27.3 19.9
Existing 2010 2015 2020
Receiving WWTW: Fish Water Flats WWTW

- 19 -
Development costing:
Existing 2010 2015 2020
Pipe Line Costing
Description Km Amount Km Amount Km Amount Km Amount
Markman 3.6 R 1 170 000
Sub - Total 0 R 0 4 R 1 170 000 0 R 0 0 R 0
Syphon
Description
Markman 2 R 3 160 000
Sub - Total R 0 R 3 160 000 R 0
Pump Station
Description
Markman (
Amsterdamhoek) 5 R 3 270 000
Sub - Total R 0 R 3 270 000 R 0 R 0
Total R 0 R 7 600 000 R 0 R 0
Initial flows from the Coega IDZ will be pumped into this system until such time
as the Coega WWTW is built. Flows will thus increase temporarily (up to 2015)
by 49% due to the new developments and the low cost housing project in Wells
Estate. However, these flows are expected to decrease toward 2020, when the
Coega WWTW becomes operational.
7.9 Motherwell – Consultant: Izizwe
Sewer flows extracted from analysis:
Motherwell ADWF l/s ADWF l/s ADWF l/s ADWF l/s
171.0 205.8 212.5 212.5
ADWF Ml/d ADWF Ml/d ADWF Ml/d ADWF Ml/d
14.8 17.8 18.4 18.4
Existing 2010 2015 2020
Receiving WWTW: Fish Water Flats; a portion to the Despatch and Coega
WWTW

- 20 -
Development costing:
Existing 2010 2015 2020
Pipe Line Costing
Description Km Amount Km Amount Km Amount Km Amount
Motherwell 4.4 R 6 474 386 1.8 R 4 379 119 23.5 R 109 718 549 5.3 R 29 126 725
Sub - Total 4 R 6 474 386 2 R 4 379 119 24 R 109 718 549 5 R 29 126 725
Pump Station
Description
Motherwell 1 R 8 250 000 1 R 3 000 000
Sub - Total R 0 R 0 R 8 250 000 R 3 000 000
Other ( Diversion weirs )
Description
Motherwell pumping mains 0.5 R 716 410 1 R 4 551 595
Sub - Total R 0 R 0 R 716 410 R 4 551 595
Total R 6 474 386 R 4 379 119 R 118 684 959 R 36 678 321
Major portions of land have been identified to the North of Motherwell for low cost
housing developments, which form part of the NMBM’s 10 year housing
programme.
7.10 Motherwell North/Coega – Consultant: Letsunyane
Sewer flows extracted from analysis:
Motherwell - Norh /
Coega ADWF l/s ADWF l/s ADWF l/s ADWF l/s
Flow from the
NMBM only 0.0 118.9 258.3 617.2
ADWF Ml/d ADWF Ml/d ADWF Ml/d ADWF Ml/d
0.0 10.3 22.3 53.3
Existing 2010 2015 2020
Receiving WWTW: Coega proposed WWTW
- 21 -
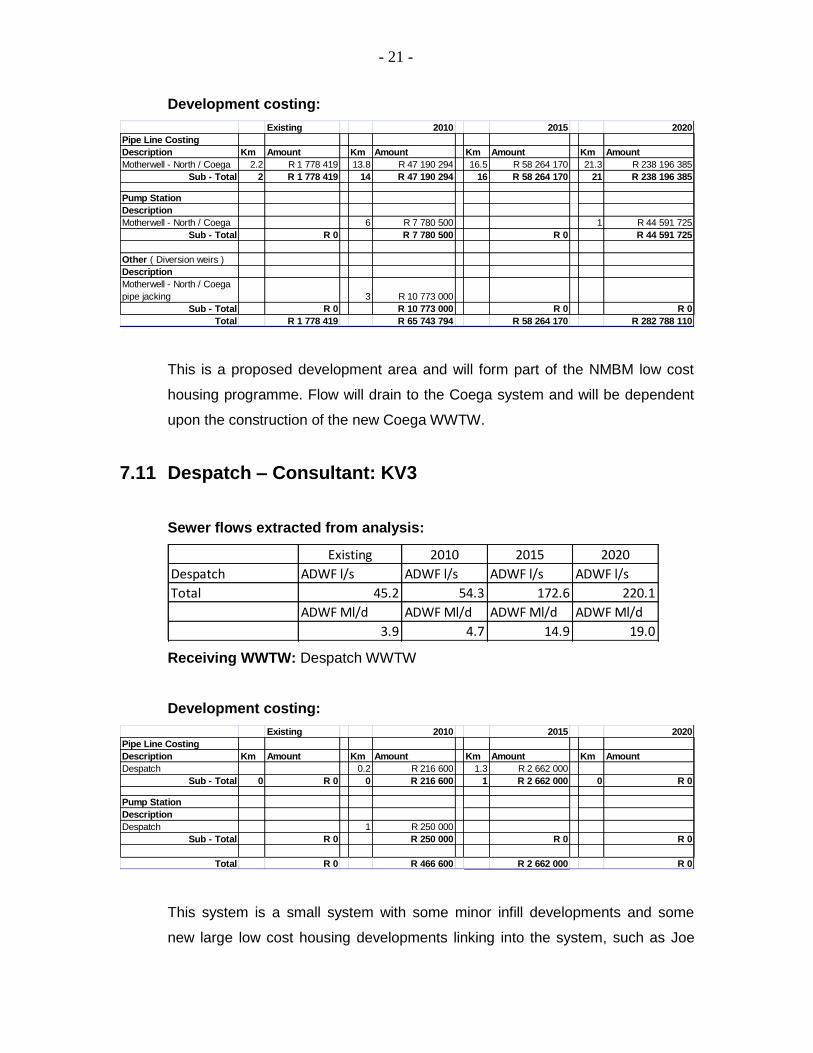
Development costing:
Existing 2010 2015 2020
Pipe Line Costing
Description Km Amount Km Amount Km Amount Km Amount
Motherwell - North / Coega 2.2 R 1 778 419 13.8 R 47 190 294 16.5 R 58 264 170 21.3 R 238 196 385
Sub - Total 2 R 1 778 419 14 R 47 190 294 16 R 58 264 170 21 R 238 196 385
Pump Station
Description
Motherwell - North / Coega 6 R 7 780 500 1 R 44 591 725
Sub - Total R 0 R 7 780 500 R 0 R 44 591 725
Other ( Diversion weirs )
Description
Motherwell - North / Coega
pipe jacking 3 R 10 773 000
Sub - Total R 0 R 10 773 000 R 0 R 0
Total R 1 778 419 R 65 743 794 R 58 264 170 R 282 788 110
This is a proposed development area and will form part of the NMBM low cost
housing programme. Flow will drain to the Coega system and will be dependent
upon the construction of the new Coega WWTW.
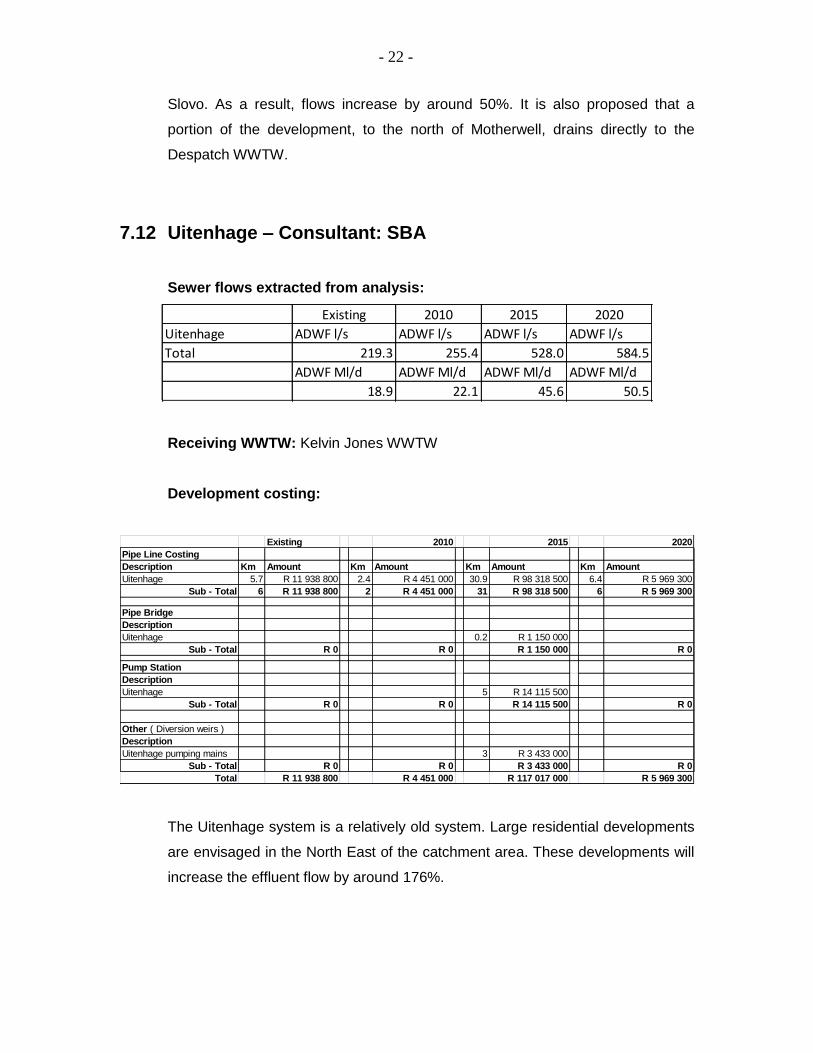
7.11 Despatch – Consultant: KV3
Sewer flows extracted from analysis:
Despatch ADWF l/s ADWF l/s ADWF l/s ADWF l/s
Total 45.2 54.3 172.6 220.1
ADWF Ml/d ADWF Ml/d ADWF Ml/d ADWF Ml/d
3.9 4.7 14.9 19.0
2015Existing 2010 2020
Receiving WWTW: Despatch WWTW
Development costing:
Existing 2010 2015 2020
Pipe Line Costing
Description Km Amount Km Amount Km Amount Km Amount
Despatch 0.2 R 216 600 1.3 R 2 662 000
Sub - Total 0 R 0 0 R 216 600 1 R 2 662 000 0 R 0
Pump Station
Description
Despatch 1 R 250 000
Sub - Total R 0 R 250 000 R 0 R 0
Total R 0 R 466 600 R 2 662 000 R 0
This system is a small system with some minor infill developments and some
new large low cost housing developments linking into the system, such as Joe
- 22 -
Slovo. As a result, flows increase by around 50%. It is also proposed that a
portion of the development, to the north of Motherwell, drains directly to the
Despatch WWTW.
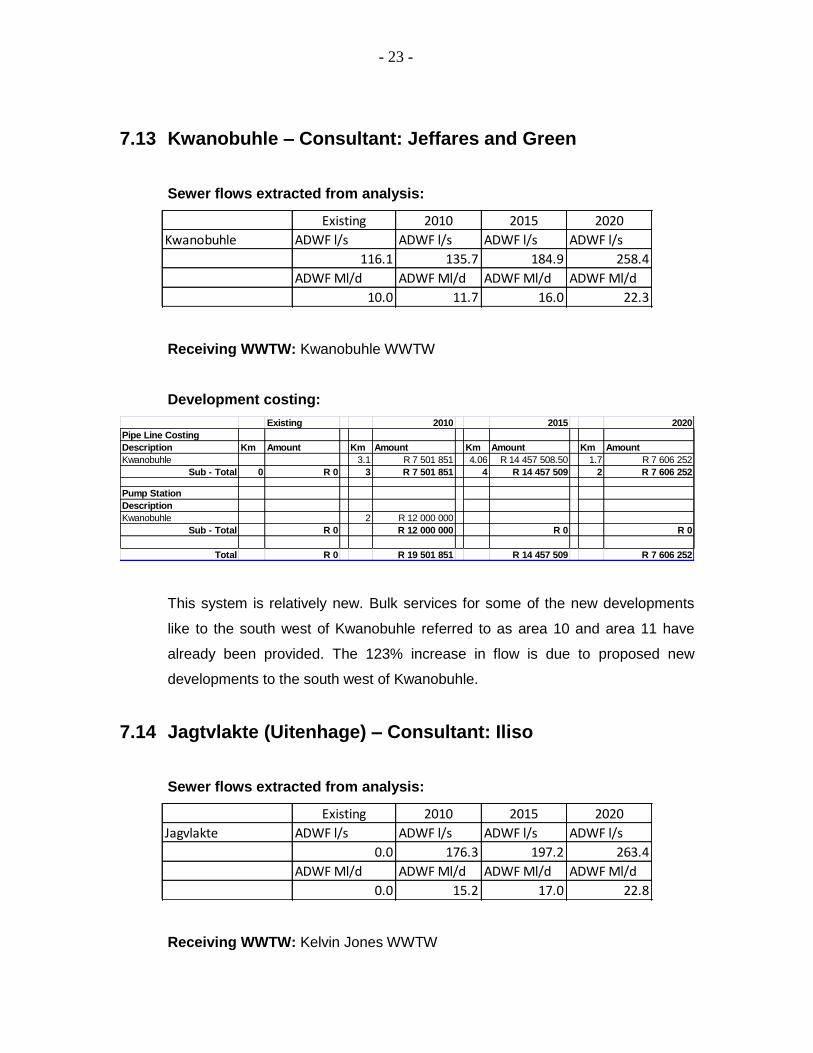
7.12 Uitenhage – Consultant: SBA
Sewer flows extracted from analysis:
Uitenhage ADWF l/s ADWF l/s ADWF l/s ADWF l/s
Total 219.3 255.4 528.0 584.5
ADWF Ml/d ADWF Ml/d ADWF Ml/d ADWF Ml/d
18.9 22.1 45.6 50.5
2020Existing 2010 2015
Receiving WWTW: Kelvin Jones WWTW
Development costing:
Existing 2010 2015 2020
Pipe Line Costing
Description Km Amount Km Amount Km Amount Km Amount
Uitenhage 5.7 R 11 938 800 2.4 R 4 451 000 30.9 R 98 318 500 6.4 R 5 969 300
Sub - Total 6 R 11 938 800 2 R 4 451 000 31 R 98 318 500 6 R 5 969 300
Pipe Bridge
Description
Uitenhage 0.2 R 1 150 000
Sub - Total R 0 R 0 R 1 150 000 R 0
Pump Station
Description
Uitenhage 5 R 14 115 500
Sub - Total R 0 R 0 R 14 115 500 R 0
Other ( Diversion weirs )
Description
Uitenhage pumping mains 3 R 3 433 000
Sub - Total R 0 R 0 R 3 433 000 R 0
Total R 11 938 800 R 4 451 000 R 117 017 000 R 5 969 300
The Uitenhage system is a relatively old system. Large residential developments
are envisaged in the North East of the catchment area. These developments will
increase the effluent flow by around 176%.
- 23 -
7.13 Kwanobuhle – Consultant: Jeffares and Green
Sewer flows extracted from analysis:
Kwanobuhle ADWF l/s ADWF l/s ADWF l/s ADWF l/s
116.1 135.7 184.9 258.4
ADWF Ml/d ADWF Ml/d ADWF Ml/d ADWF Ml/d
10.0 11.7 16.0 22.3
Existing 2010 2015 2020
Receiving WWTW: Kwanobuhle WWTW
Development costing:
Existing 2010 2015 2020
Pipe Line Costing
Description Km Amount Km Amount Km Amount Km Amount
Kwanobuhle 3.1 R 7 501 851 4.06 R 14 457 508.50 1.7 R 7 606 252
Sub - Total 0 R 0 3 R 7 501 851 4 R 14 457 509 2 R 7 606 252
Pump Station
Description
Kwanobuhle 2 R 12 000 000
Sub - Total R 0 R 12 000 000 R 0 R 0
Total R 0 R 19 501 851 R 14 457 509 R 7 606 252
This system is relatively new. Bulk services for some of the new developments
like to the south west of Kwanobuhle referred to as area 10 and area 11 have
already been provided. The 123% increase in flow is due to proposed new
developments to the south west of Kwanobuhle.
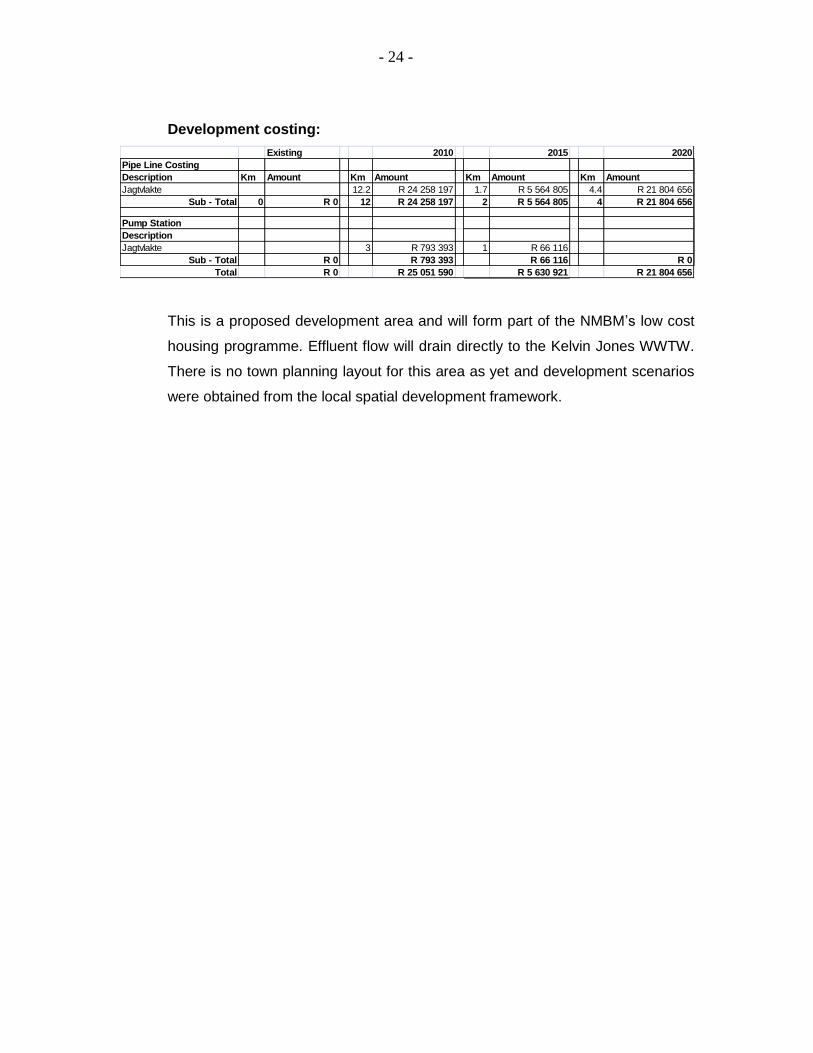
7.14 Jagtvlakte (Uitenhage) – Consultant: Iliso
Sewer flows extracted from analysis:
Jagvlakte ADWF l/s ADWF l/s ADWF l/s ADWF l/s
0.0 176.3 197.2 263.4
ADWF Ml/d ADWF Ml/d ADWF Ml/d ADWF Ml/d
0.0 15.2 17.0 22.8
Existing 2010 2015 2020
Receiving WWTW: Kelvin Jones WWTW
- 24 -
Development costing:
Existing 2010 2015 2020
Pipe Line Costing
Description Km Amount Km Amount Km Amount Km Amount
Jagtvlakte 12.2 R 24 258 197 1.7 R 5 564 805 4.4 R 21 804 656
Sub - Total 0 R 0 12 R 24 258 197 2 R 5 564 805 4 R 21 804 656
Pump Station
Description
Jagtvlakte 3 R 793 393 1 R 66 116
Sub - Total R 0 R 793 393 R 66 116 R 0
Total R 0 R 25 051 590 R 5 630 921 R 21 804 656
This is a proposed development area and will form part of the NMBM’s low cost
housing programme. Effluent flow will drain directly to the Kelvin Jones WWTW.
There is no town planning layout for this area as yet and development scenarios
were obtained from the local spatial development framework.
- 25 -
8. WASTE WATER TREATMENT WORKS
The NMBM appointed various Civil Engineering Consultants to investigate each
of the existing waste water treatment works (WWTW). The master plan does not
deal with the detail of the operations and physical condition of the WWTW – but
focuses more on the capacities and existing and future requirements at the
respective works.
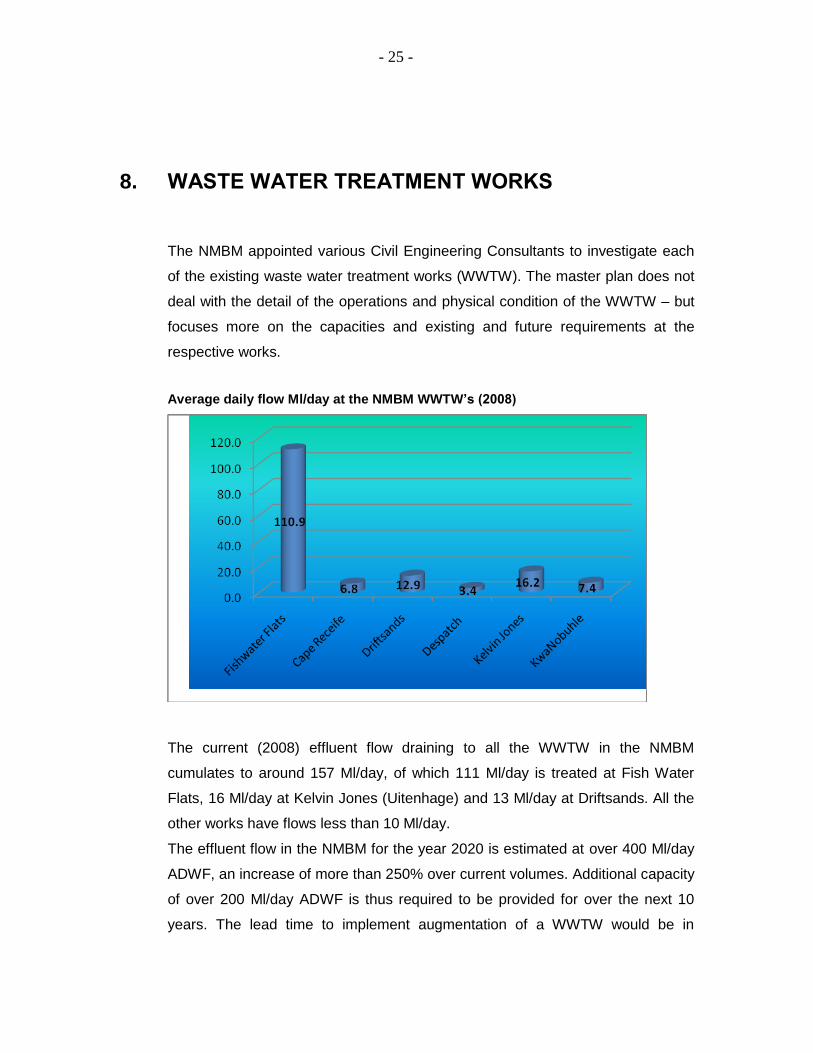
Average daily flow Ml/day at the NMBM WWTW’s (2008)
The current (2008) effluent flow draining to all the WWTW in the NMBM
cumulates to around 157 Ml/day, of which 111 Ml/day is treated at Fish Water
Flats, 16 Ml/day at Kelvin Jones (Uitenhage) and 13 Ml/day at Driftsands. All the
other works have flows less than 10 Ml/day.
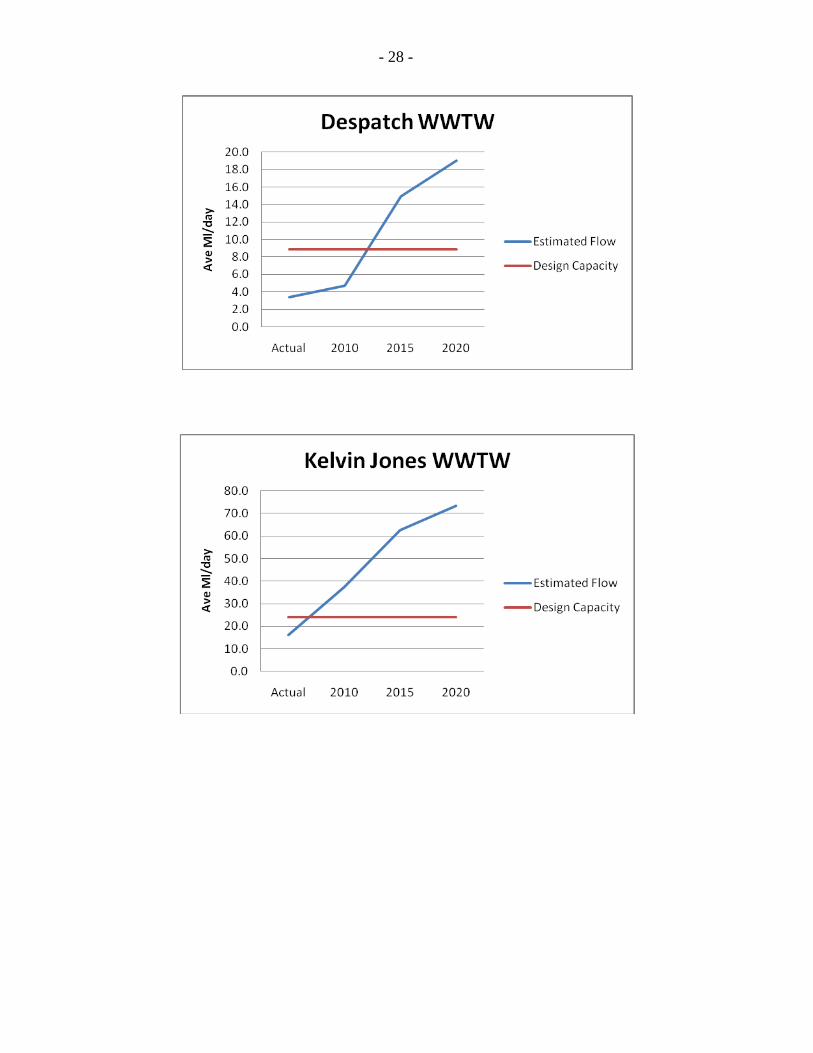
The effluent flow in the NMBM for the year 2020 is estimated at over 400 Ml/day
ADWF, an increase of more than 250% over current volumes. Additional capacity
of over 200 Ml/day ADWF is thus required to be provided for over the next 10
years. The lead time to implement augmentation of a WWTW would be in

- 26 -
approximately 2 years from the date of the appointment of a Consulting Engineer
to the start of construction. Construction periods would vary, but should not take
longer than 2 years in general.
As a result of the above discussion, it can be assumed that planning needs to
commence on almost all the WWTW, within the next year (2010). The exceptions
are Despatch and the proposed Draaifontein and Bushy Park WWTW.
The diagrams below illustrate graphically the Design Capacity, which is the
current operating capacity, of the various WWTW vs. the Estimated Flow.
The WWTW Augmentation Schedule below is a guide to illustrate the upgrading
time frames necessary to meet the calculated future demand. This schedule
needs to be revised once the investigations at the various WWTW are complete.

- 27 -
- 28 -

- 29 -
Waste Water Treatment Works Augmentation Schedule and costingPlanning Construction
WWTW
Current
Designed
Capacity
Future 2020
Capacity
Additional
capacity
Estimated Augmentation
cost 20
09
20
10
20
11
20
12
20
13
20
14
20
15
20
16
20
17
20
18
20
19
20
20
20
10
20
15
20
20
Fish Water Flats 132 160 28 R 1 212 000 000 Planning
Construction R 609 105 470 R 602 894 530
Cape Receife 9 13 4 R 58 000 000 Planning
Construction R 58 000 000
Driftsands 12 48 36 R 107 943 243 Planning
Construction R 60 296 000
Despatch 9 19 10 R 8 000 000 Planning
Construction R 8 000 000
Kelvin Jones 24 73 49 R 172 400 000 Planning
Construction R 76 150 000 R 96 250 000
Kwanobuhle 9 22 13 R 184 426 000 Planning
Proposed WWTW Construction R 63 500 000 R 120 926 000
St Albans 0 22 22 R 66 146 844 Planning
Construction R 66 146 844
Draaifontein 0 39 39 R 116 592 960 Planning
Construction R 116 592 960
Bushy Park 0 60 60 R 179 753 640 Planning
Construction R 179 753 640
Coega(NMBMM only ) 0 53 53 R 159 966 000 Planning
Construction R 772 000 000
Total R 2 265 228 687 R 0 R 1 705 198 314 R 1 124 417 130

- 30 -
9. PUMP STATIONS
There are 80 existing sewer pump stations located within the sewerage network,
operated by the NMBM. The majority of the pump stations are small pump
stations, lifting effluent from localised low lying areas into a nearby gravity
collector sewer.
Catchment No. Station Name Catchment No. Station Name
Chatty 44 Missionvale No.1 Markman 5 Bluewater ejector
Chatty Bethelsdorp Markman 6 Bluewater pumps
City 7 Boardwalk Markman 9 Brighton Beach
City 10 Creek Markman 61 Studebaker Street
City 21 Edgar Street Markman 1 Aloes
City 24 Fleming Street Motherwell 45 Motherwell No1
City 26 Hallack Road Motherwell 46 Motherwell No2
City 30 Johnson Street Motherwell 47 Motherwell No3
City 33 Kings Beach Motherwell 48 Motherwell No4
City 41 Matlock Bridge Motherwell 49 Motherwell No5
City 42 Mc Arthur Bath Motherwell 50 Motherwell No6
City 43 Mill Park Motherwell 51 Motherwell No7
City 52 Octagon Paapenkuils 4 Bishops Way
City 55 Red Windmill Paapenkuils 11 Deal Party
City 57 Rudolph Street Paapenkuils 34 Kwaford
City 59 Strand Street Paapenkuils 39 Malabar
City 60 Strang Street Paapenkuils 68 Waterford Road
City 64 Swartkops Street Swartkops 2 Baldwin Road 1
City 65 Valley Road Swartkops 3 Baldwin Road 2
City 67 Voyle Street Swartkops 35 Kwazakhele - Stage 7
Despatch 12 Despatch 1 Swartkops 53 Power Station
Despatch 13 Despatch 2 Swartkops 56 Redhouse
Despatch 14 Despatch 3 Swartkops 58 Schooner Crescent
Despatch 15 Despatch 4 Swartkops 66 Veeplaas
Despatch 16 Despatch 5 Swartkops Chatty
Despatch 17 Despatch 7 Swartkops Soweto - on - sea
Despatch 18 Despatch 8 Swartkops Zwide 1
Despatch 19 Despatch 9 Swartkops Zwide 2
Driftsands 8 Boundary Lane Swarkops 63 Swartkops Stat. 4
Driftsands Theescombe Uitenhage 27 Hella
Driftsands Walmer Area Q Uitenhage 32 Kelvin
Lower Baakens 23 Essexvale Uitenhage 37 Logistics Park
Lower Baakens 25 Fordyce Road Uitenhage 38 Lower Magennis
Lower Baakens 40 Mangold Park Uitenhage Peter Searle
Lower Baakens 54 Prospect Road Upper Baakens 31 Kabega Park
Lower Baakens 62 Summerstrand Upper Baakens Kuyga
Lower Baakens Stella Londt Upper Baakens 69 Woodlands
Lower Baakens Wendy Ave
- 31 -
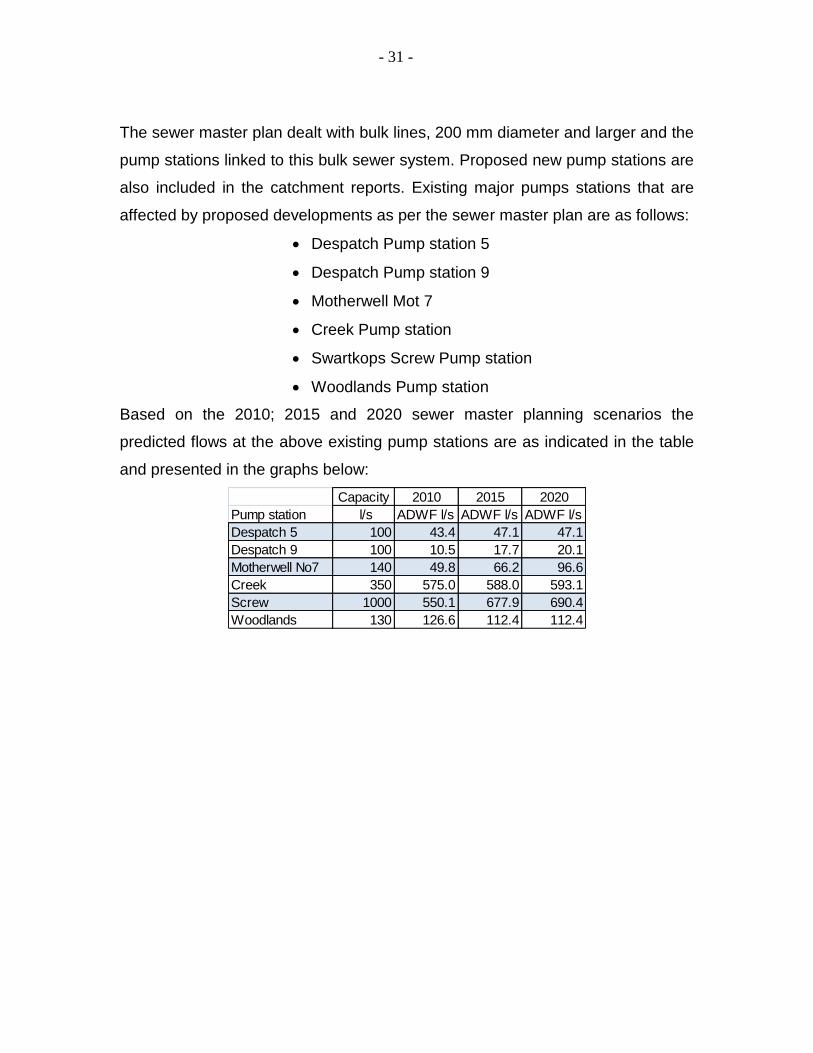
The sewer master plan dealt with bulk lines, 200 mm diameter and larger and the
pump stations linked to this bulk sewer system. Proposed new pump stations are
also included in the catchment reports. Existing major pumps stations that are
affected by proposed developments as per the sewer master plan are as follows:
Despatch Pump station 5
Despatch Pump station 9
Motherwell Mot 7
Creek Pump station
Swartkops Screw Pump station
Woodlands Pump station
Based on the 2010; 2015 and 2020 sewer master planning scenarios the
predicted flows at the above existing pump stations are as indicated in the table
and presented in the graphs below:
Capacity 2010 2015 2020
Pump station l/s ADWF l/s ADWF l/s ADWF l/s
Despatch 5 100 43.4 47.1 47.1
Despatch 9 100 10.5 17.7 20.1
Motherwell No7 140 49.8 66.2 96.6
Creek 350 575.0 588.0 593.1
Screw 1000 550.1 677.9 690.4
Woodlands 130 126.6 112.4 112.4

- 32 -
0
20
40
60
80
100
120
2011 2015 2020
l/s
Despatch PS 5
Est Flow
Capacity
0
20
40
60
80
100
120
2011 2015 2020
l/s
Despatch PS 9
Est. Flow
Capacity
0.0
20.0
40.0
60.0
80.0
100.0
120.0
140.0
160.0
2011 2015 2020
l/s
Motherwell Mot 7
Est. Flow
Capacity
0.0
100.0
200.0
300.0
400.0
500.0
600.0
700.0
2011 2015 2020
l/s
Creek
Est. Flow
Capacity
0.0
200.0
400.0
600.0
800.0
1 000.0
1 200.0
2011 2015 2020
l/s
Swartkops Screw
Est. Flow
Capacity
100.0
105.0
110.0
115.0
120.0
125.0
130.0
135.0
2011 2015 2020
l/s
Woodlands
Est Flow
Capacity
The above analysis summary indicates that all the pump stations, with the
exception of the Creek pump station, meet the flow requirements for the future
planning horizons. In consultation with NMBM officials it was agreed that the
actual measured flow at the Creek pump station is substantially lower than the
calculated flow analysis for the future scenarios and that their interpretation is
that no augmentation is currently needed.
It is thus determined that no augmentation is required for the pump stations for
the 2020 planning horizon.
It should however be noted that in order to maintain the existing capacity at the
pump stations, major repair and maintenance work is required. The NMBM
appointed CA du Toit Consulting Engineers in 2010 to do a maintenance backlog
report on all sewer pump stations. This report is attached for reference and also
deals with the costing required for operating and maintaining the pump stations.

- 33 -
10. CONCLUSIONS
Generally the existing sewer network functions well and the conservative design
principals adopted have served the NMBM well. The rapid development of the
city over the last 5 years necessitates that additional that bulk sewerage
infrastructure be installed as a matter of urgency to prevent bottlenecks and the
resulting spillages.
The sewer master planning commenced in 2007, at the height of the economic
boom in property development in the metro. Development at that stage was
Developer driven, and the rapid rate of such development overtook the present
planning horizons.
The sewer master plan aims to address this imbalance and will assist the NMBM,
not only to guide future development, but also to improve service delivery.
Detailed recommendations as contained in each of the attached comprehensive
catchment reports are summarised blow.
11. RECOMMENDATIONS
This master plan document is a guideline document. Proposals and
recommendations made, need to be investigated in more detail as development
progresses. The sewer master plan is a dynamic document and should be
constantly updated as and when new development takes place.
The NMBM Water and Sanitation sub directorates philosophy of “planning should
not stop”, should apply to this master plan. Planning of the recommended
augmentation works should start urgently and budget provisions should be
allocated over the next 10 years.
In recent years, cities have found it increasingly important to manage and control
wastewater flows in their sewer reticulation systems. Normally, the first step in
the process of gaining control of the drainage system is flow measurement. A

- 34 -
flow monitoring programme will be introduced, whereby 45 flow monitoring
stations will be installed within the metro. Information obtained from these
measuring stations will be used to refine the sewer master plan analysis.
High standards are applied for the design and construction of the sewer system
and the same standards need to be applied to the maintenance of the system.
Through the field investigations it has become evident that the system
maintenance is a matter of concern. A detailed investigation of the operation and
maintenance of the sewer system needs to be performed.
Another area of concern is the prevention of storm water ingress into the
sewerage system. The ingress of rain water runoff into the sewer network has a
major impact on the sewerage system, by drastically increasing the volume of
effluent required to be treated. In rainy periods the amount of effluent can be as
much as 100% more than that of dry periods.
A programme to prevent illegal connections into the sewerage network needs to
be implemented urgently. The proposal is that a pilot study be conducted to
determine the extent of the problem and to recommend practical solutions.
Internationally cities have reduced wet weather flows by as much as 50% when
such wet weather programmes have been introduced.
12. ACKNOWLEDGEMENTS
This master plan has been compiled and developed by the contributions of many.
The main contribution has been from the staff of the Nelson Mandela Bay Metro
Municipality, in particular we are indebted to Mr. B Martin, Miss. A Muthayan, Mr
E. Julyan and Mr. S Beattie for their contributions.
The master plan document is likely to require updating at a future stage.
Comments and suggestions from readers will be most welcome.
Communications should be directed to: Mr. A. Crouse at [email protected]
or Mr A J White at [email protected].
Top Related