


Languages
Pages
Legal

Scott W. Searle, CFA, (646) [email protected]
Sales (800) 933-6830, Trading (800) 933-6820
COMPANY NOTE | EQUITY RESEARCH | June 24, 2021Technology: Communications, Wireless & IoT
Sequans Communications SA | SQNS - $6.04 - NYSE | Buy
Company UpdateEstimates Changed, Target Price Changed
Stock Data
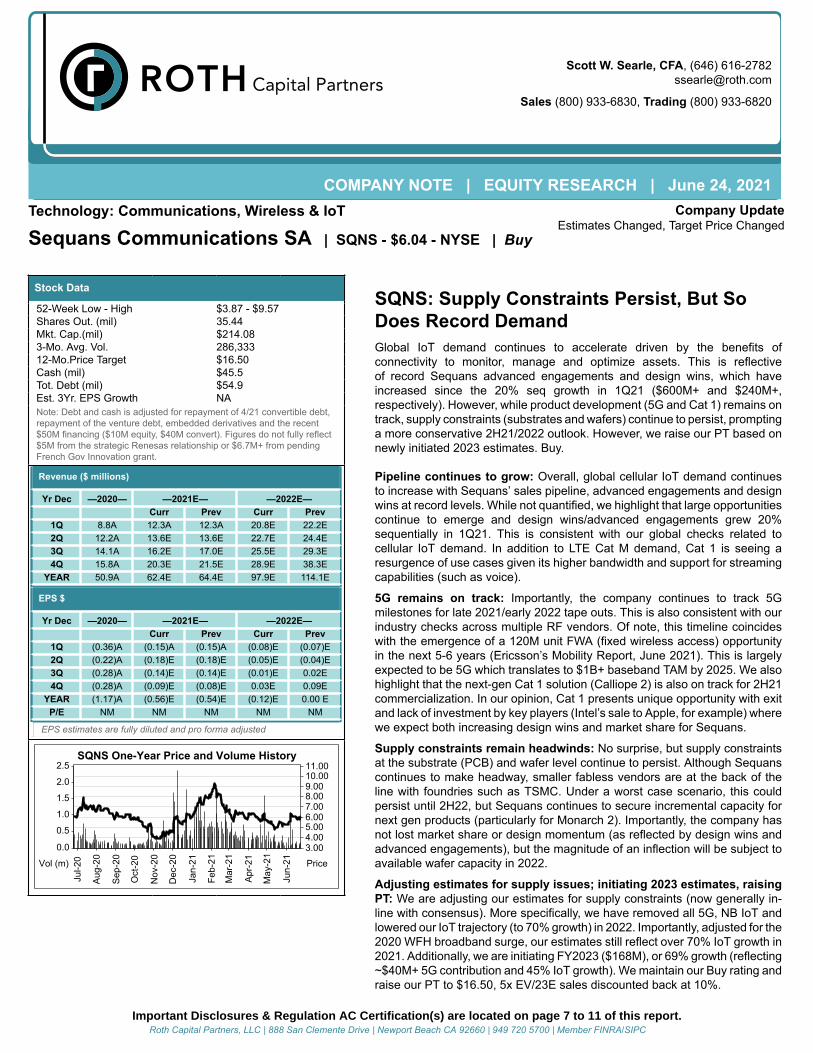
52-Week Low - High $3.87 - $9.57Shares Out. (mil) 35.44Mkt. Cap.(mil) $214.083-Mo. Avg. Vol. 286,33312-Mo.Price Target $16.50Cash (mil) $45.5Tot. Debt (mil) $54.9Est. 3Yr. EPS Growth NANote: Debt and cash is adjusted for repayment of 4/21 convertible debt,repayment of the venture debt, embedded derivatives and the recent$50M financing ($10M equity, $40M convert). Figures do not fully reflect$5M from the strategic Renesas relationship or $6.7M+ from pendingFrench Gov Innovation grant.
Revenue ($ millions)
Yr Dec —2020— —2021E— —2022E—Curr Prev Curr Prev
1Q 8.8A 12.3A 12.3A 20.8E 22.2E2Q 12.2A 13.6E 13.6E 22.7E 24.4E3Q 14.1A 16.2E 17.0E 25.5E 29.3E4Q 15.8A 20.3E 21.5E 28.9E 38.3E
YEAR 50.9A 62.4E 64.4E 97.9E 114.1E
EPS $
Yr Dec —2020— —2021E— —2022E—Curr Prev Curr Prev
1Q (0.36)A (0.15)A (0.15)A (0.08)E (0.07)E2Q (0.22)A (0.18)E (0.18)E (0.05)E (0.04)E3Q (0.28)A (0.14)E (0.14)E (0.01)E 0.02E4Q (0.28)A (0.09)E (0.08)E 0.03E 0.09E
YEAR (1.17)A (0.56)E (0.54)E (0.12)E 0.00 EP/E NM NM NM NM NM
EPS estimates are fully diluted and pro forma adjusted
11.0010.009.008.007.006.005.004.003.00
Jul-2
0
Aug
-20
Sep
-20
Oct
-20
Nov
-20
Dec
-20
Jan-
21
Feb-
21
Mar
-21
Apr
-21
May
-21
Jun-
21
2.5
2.0
1.5
1.0
0.5
0.0
PriceVol (m)
SQNS One-Year Price and Volume History
SQNS: Supply Constraints Persist, But SoDoes Record DemandGlobal IoT demand continues to accelerate driven by the benefits ofconnectivity to monitor, manage and optimize assets. This is reflectiveof record Sequans advanced engagements and design wins, which haveincreased since the 20% seq growth in 1Q21 ($600M+ and $240M+,respectively). However, while product development (5G and Cat 1) remains ontrack, supply constraints (substrates and wafers) continue to persist, promptinga more conservative 2H21/2022 outlook. However, we raise our PT based onnewly initiated 2023 estimates. Buy.
Pipeline continues to grow: Overall, global cellular IoT demand continuesto increase with Sequans’ sales pipeline, advanced engagements and designwins at record levels. While not quantified, we highlight that large opportunitiescontinue to emerge and design wins/advanced engagements grew 20%sequentially in 1Q21. This is consistent with our global checks related tocellular IoT demand. In addition to LTE Cat M demand, Cat 1 is seeing aresurgence of use cases given its higher bandwidth and support for streamingcapabilities (such as voice).
5G remains on track: Importantly, the company continues to track 5Gmilestones for late 2021/early 2022 tape outs. This is also consistent with ourindustry checks across multiple RF vendors. Of note, this timeline coincideswith the emergence of a 120M unit FWA (fixed wireless access) opportunityin the next 5-6 years (Ericsson’s Mobility Report, June 2021). This is largelyexpected to be 5G which translates to $1B+ baseband TAM by 2025. We alsohighlight that the next-gen Cat 1 solution (Calliope 2) is also on track for 2H21commercialization. In our opinion, Cat 1 presents unique opportunity with exitand lack of investment by key players (Intel’s sale to Apple, for example) wherewe expect both increasing design wins and market share for Sequans.
Supply constraints remain headwinds: No surprise, but supply constraintsat the substrate (PCB) and wafer level continue to persist. Although Sequanscontinues to make headway, smaller fabless vendors are at the back of theline with foundries such as TSMC. Under a worst case scenario, this couldpersist until 2H22, but Sequans continues to secure incremental capacity fornext gen products (particularly for Monarch 2). Importantly, the company hasnot lost market share or design momentum (as reflected by design wins andadvanced engagements), but the magnitude of an inflection will be subject toavailable wafer capacity in 2022.
Adjusting estimates for supply issues; initiating 2023 estimates, raisingPT: We are adjusting our estimates for supply constraints (now generally in-line with consensus). More specifically, we have removed all 5G, NB IoT andlowered our IoT trajectory (to 70% growth) in 2022. Importantly, adjusted for the2020 WFH broadband surge, our estimates still reflect over 70% IoT growth in2021. Additionally, we are initiating FY2023 ($168M), or 69% growth (reflecting~$40M+ 5G contribution and 45% IoT growth). We maintain our Buy rating andraise our PT to $16.50, 5x EV/23E sales discounted back at 10%.
Important Disclosures & Regulation AC Certification(s) are located on page 7 to 11 of this report.Roth Capital Partners, LLC | 888 San Clemente Drive | Newport Beach CA 92660 | 949 720 5700 | Member FINRA/SIPC

Modeling details
Supply constraints obscure intermediate-term visibility
It is important to note that it remains extremely early the development of the cellular IoT and 5G FWA
product cycle. This represents literally billions of units by 2026 with a $4B+ annual TAM
� Cellular IoT: 5.4B units by 2026 (from 1.6M in 2020) or a $2.5B+ TAM according to Ericsson’s Mobility
Report, June 2021.
� 5G FWA: 120M incremental lines by 2026 (to 180M total lines, or a 3x increase). Most of this is
expected to be serviced by 5G solutions translating to a $1B+ annual baseband TAM by 2026.
Figure 1: Outstanding Convertible Debt
Converts
Principal
$ Amt @
Maturity
Conversion
Price
Due
Date
Shares
Comments
Aug-2019 @ 7% $5M $6.1M $4.12 8/22 1.5M Likely to convert by 8/22
May-2021@ 5.0625% $40M $40M $7.66 5/24 5.2M 6% PIC
Total $45M $46.1M 6.7M Outstanding converts ~6M in 2Q21 Source: ThomsonReuters Eikon, SEC filings, company reports and ROTH Capital. * Believed to be partially converted.
Model adjustments
We are adjusting our 2H21 and 2022 expectations to reflect supply chain headwinds (wafers and PCBs) in
addition to taking a more conservative view of new product adoption (5G). More specifically, we have
adjusted LTE Cat M expectations for wafer availability and removed 5G and NB IoT from our 2022
expectations.
Figure 2: Segment Sales Estimates (2018-2022E)
2019
2020
2021E
2022E
2023E
CAGR
’20-23
Comments
IoT
Cat 1 ~$12M ~$10M+ ~$15M+ $20M+ $25M+ 20%+ Intel exits market. Wearables enter?
Cat M1/NB1 ~$3M+ $3-5M ~$15M $40M+ ~$60M ~70% 2H21 inflection ($600M+ pipeline)
NB IoT Only <$5M $5M+ >100%
Broadband ~$7M ~$20M+ $10M+ $20M+ $25M+ - FKWL removed from model
(CBRS in
BB)
<$1M ~$5M $10M+ $15-20M >100% • CBRS offsets hotspot weakness
5G $40M+ - Samples late 2021/early 2022
Vertical ~$8M ~$8-10M ~$10M+ $12M+ ~$15M 10%+ Public safety, satellite and other
Strategic ~$1M ~$8M $8M $8M $8M - Strategic 5G deal(s)
Total $32M $51M+ $60-70M $95M+ $160M+ ~50% Cat M, Cat 1 & NB IoT Inflection Source: ThomsonReuters Eikon, SEC filings, company reports and ROTH Capital.
Raising price target to $16.50
Despite the constraints, Sequans continues to be uniquely positioned as a supplier of cellular based IoT
connectivity (Cat 1, Cat M & NB IoT) and 5G silicon for FWA, satellite and other broadband applications.
Given current comp valuations of 5-7x EV/22E sales and recent M&A (Silicon Labs (SLAB-NC) sale of its
Infrastructure and Auto business for 7x+ EV/21E Sales), SQNS remains deeply discounted to its semi
peers at 2x+ EV/22E sales. We maintain our Buy rating and raise our price target to $16.50, or ~5x EV/23E
sales, discounted back at 10%. We believe that if Sequans executes on its IoT and 5G strategy that our
estimates and valuation could prove to be conservative. Buy.
Sequans remains uniquely
positioned for both IoT
and 5G markets yet trades
at a 60%+ discount to
semi comps.
Page 2 of 11
SEQUANS COMMUNICATIONS SA Company Note - June 24, 2021

Figure 3: Sequans Comp Table
Source: ThomsonReuters Eikon, SEC filings, company reports and ROTH Capital Page 3 of 11
SEQUANS COMMUNICATIONS SA Company Note - June 24, 2021
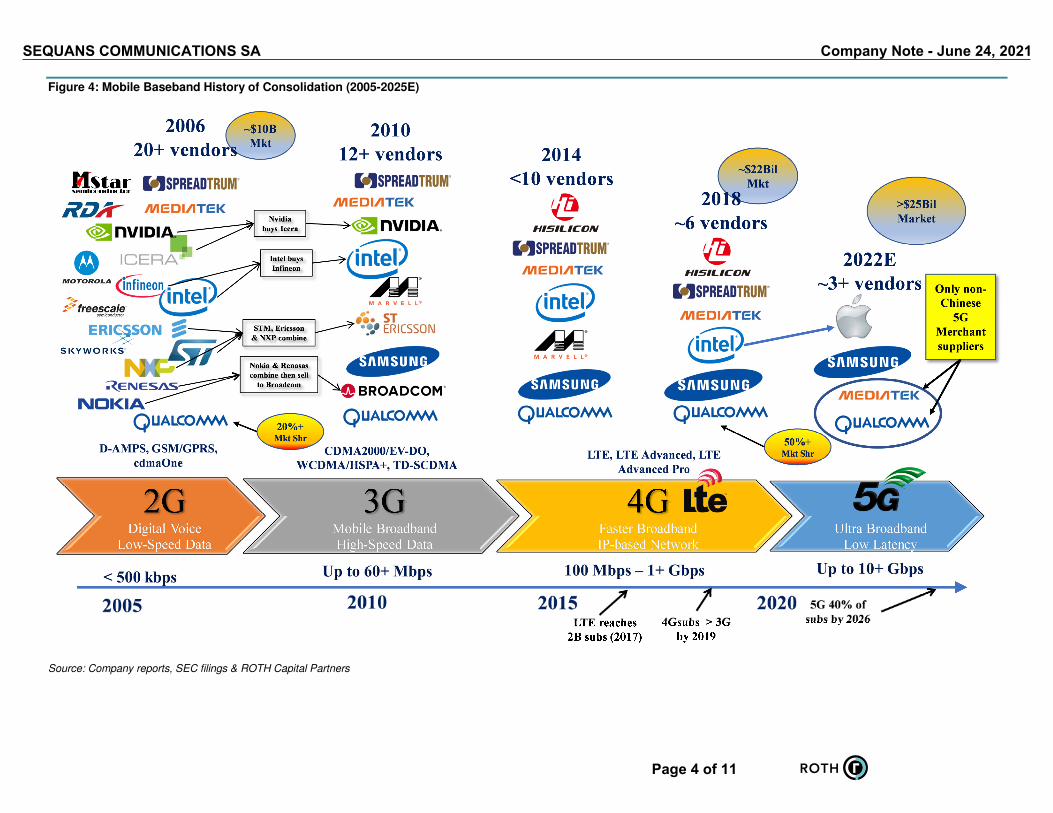
Figure 4: Mobile Baseband History of Consolidation (2005-2025E)
Source: Company reports, SEC filings & ROTH Capital Partners
Page 4 of 11
SEQUANS COMMUNICATIONS SA Company Note - June 24, 2021

VALUATION
Our $16.50 price target is derived from an EV/23E sales multiple of ~5 x our CY22 estimate of $165.9M,discounted back at 10%. This is at the lower end of the public comp range of 5-7x and recent semiconductorconnectivity M&A of 4-7x+.
Impediments to achieving our $16.50 price target include competition and the timing and development of theIoT market, particularly LPWA solutions with LTE Cat M1 and NB IoT.
RISKS■ The competitive landscape: LTE landscape is defined by some of the largest, most profitable companies
within the semiconductor arena including Qualcomm, Intel, Samsung and “China Inc.” Collectively, thesecompanies have invested over $4B on LTE solutions vs. the capital “constrained” ~$200M we believe hasbeen invested by Sequans. However, Sequans has been able to compete in niche markets with feature-richsingle-mode (LTE only) solutions have been core to the company’s success. This focus has translated toindustry firsts in broadband LTE (TDD, carrier aggregation, Cat 4, Cat 6) as well as IoT optimized solutions(Cat 1, Cat M1/NB IoT). We believe Sequans is the market leader in this oligopoly for IoT (and in the future5G) silicon.
■ Market Timing: Timelines of ramping new wireless solutions are fluid and subject to technology evolution andmaturation (including the standards process), carrier urgency (or lack thereof), and the rollout of networkswith adequate service coverage. LTE Cat M1 and NB IoT are no different. However, incumbent LTE footprintsand software rollouts enable relatively seamless infrastructure upgrades. While we acknowledge theseimpediments, including poor marketing and pricing strategies (not a big stretch to imagine), the technologyis commercially available, operators are live, and Sequans silicon is carrier certified. We believe LTE CatM1 is in the early stages of an inflection, which we currently anticipate in 2H21.
■ Balance Sheet: After the most recent round of funding, we believe that Sequans is fully funded throughprojected cash flow break-even in1H22.
■ Supply constraints: Consistent across the technology and semiconductor universe, supply constraints at thewafer level continue to extend lead times and the ability to service growing demand. Given that Sequans isa relatively small fabless semiconductor vendor it receives a lesser priority than larger competing vendors.However, despite these headwinds we do not believe that SQNS is losing share as larger vendors haveprioritized capacity to larger smartphone opportunities rather than IoT end markets. Wafer constraints areexpected to lessen by 2022 while substrate (PCB) constraints are expected to ease by late 2021.
■ Pushouts: Pushouts have been a constant recurring theme from the company over the past two plus years.While this has been a consistent frustration, we believe the increasing breadth and diversity of the designwin pipeline (particularly Cat M1 wins) is providing a strong indicator of ramping sales into late 2020. Whilea future quarterly disappointment remains a possibility (particularly with COVID), we believe that the designtraction in Broadband, CBRS, LTE Cat 1 and LTE Cat M1 is broad based.
Pagebreak
COMPANY DESCRIPTION
Sequans Communications S.A. is a leading provider of single-mode LTE and 5G multi-mode solutions targetedat broadband (FWA, CBRS, mobile hotspots) and IoT markets. The company has had multiple LTE marketfirsts including TDD, Cat 4, Cat 6, carrier aggregation and IoT optimized solutions including LTE Cat 1, CatM1 and NB IoT. The Paris based company is an early market lead in LTE Cat M1 & NB IoT solutions with 5Gbaseband silicon expected by late 2021/early 2022.
Page 5 of 11
SEQUANS COMMUNICATIONS SA Company Note - June 24, 2021

Sequans Communications SAFiscal Year Ends December
Mar-20 Jun-20 Sep-20 Dec-20 Mar-21 Jun-21 Sep-21 Dec-21 Mar-22 Jun-22 Sep-22 Dec-22 Mar-22 Jun-22 Sep-22 Dec-22
Income Statement 1Q20 2Q20 3Q20 4Q20 1Q21 2Q21E 3Q21E 4Q21E 1Q22E 2Q22E 3Q22E 4Q22E 1Q23E 2Q23E 3Q23E 4Q23E 2016 2017 2018 2019 2020E 2021E 2022E 2023E
Revenue 8.8 12.2 14.1 15.8 12.3 13.6 16.2 20.3 20.8 22.7 25.5 28.9 30.7 36.0 43.5 55.7 45.6 48.3 40.3 32.4 50.9 62.4 97.9 165.9
COGS 4.3 6.3 8.2 8.6 6.1 7.1 8.4 10.5 11.0 11.8 13.2 14.8 15.9 18.5 22.2 27.9 25.6 27.1 24.1 18.4 27.4 32.1 50.9 84.6
Gross Profit 4.5 5.9 5.9 7.1 6.2 6.5 7.8 9.8 9.8 10.8 12.2 14.1 14.8 17.4 21.3 27.7 20.0 21.2 16.1 14.0 23.5 30.3 47.0 81.3
R&D 7.1 7.2 7.8 7.3 6.7 6.8 6.9 7.1 6.9 6.9 6.9 7.0 7.0 7.3 7.3 8.0 26.1 24.8 27.4 23.3 29.5 27.5 27.6 29.5
S&M 2.1 1.8 1.7 1.8 2.1 2.2 2.2 2.3 2.1 2.2 2.2 2.3 2.3 2.6 2.8 3.3 7.1 8.5 9.2 7.7 7.4 8.7 8.9 11.1
G&A 2.3 1.8 1.9 2.3 2.1 2.1 2.1 2.2 2.1 2.2 2.2 2.3 2.3 2.4 2.7 3.0 5.9 5.8 8.8 7.1 8.3 8.6 8.8 10.4
Operating Income (7.1) (4.9) (5.4) (4.3) (4.7) (4.6) (3.4) (1.7) (1.3) (0.4) 1.0 2.5 3.2 5.2 8.5 13.3 (19.1) (17.8) (29.2) (24.0) (21.7) (14.5) 1.7 30.3
Amortization 0.7 0.6 0.5 1.2 1.2 1.2 1.2 1.2 1.2 1.2 1.2 1.2 1.2 1.2 1.2 1.2 0.9 1.6 1.8 1.8 3.0 4.6 4.6 4.6
Non-recurring Costs 0.0 0.0 0.0 0.0 0.0 0.0 0.0 0.0 0.0 0.0 0.0 0.0 0.0 0.0 0.0 0.0 0.0 0.0 0.0 0.5 0.0 0.0 0.0 0.0
Operating Income (reported) (7.8) (5.6) (5.9) (5.4) (5.8) (5.8) (4.6) (2.9) (2.4) (1.6) (0.2) 1.4 2.1 4.0 7.4 12.2 (19.9) (19.5) (31.0) (26.3) (24.7) (19.1) (2.9) 25.6
Net Interest (3.5) (3.7) (3.6) (3.6) (2.7) (2.4) (1.8) (1.7) (1.6) (1.5) (1.4) (1.3) (1.2) (1.2) (1.2) (1.2) (3.7) (4.6) (5.4) (9.0) (14.4) (8.6) (5.8) (4.8)
Other 0.7 (9.6) 0.6 (1.8) (2.7) 0.0 0.0 0.0 0.0 0.0 0.0 0.0 0.0 0.0 0.0 0.0 (1.1) (1.7) (0.3) 0.1 (10.2) (2.7) 0.0 0.0
EBT (10.6) (18.9) (8.9) (10.9) (11.3) (8.2) (6.4) (4.6) (4.0) (3.1) (1.6) 0.1 0.9 2.8 6.2 11.0 (24.7) (25.8) (36.7) (35.2) (49.3) (30.4) (8.7) 20.8
Income Tax 0.0 0.0 0.1 0.4 0.1 0.1 0.1 0.1 0.1 0.1 0.1 0.0 0.1 0.4 0.9 1.6 0.3 0.2 0.2 (0.7) 0.5 0.4 0.3 3.1
Net Income (10.6) (19.0) (9.0) (11.3) (11.4) (8.3) (6.5) (4.7) (4.1) (3.2) (1.7) 0.0 0.7 2.4 5.2 9.3 (25.0) (26.0) (36.9) (34.6) (49.8) (30.9) (9.0) 17.7
Share (Basic) 23.9 27.2 30.3 31.0 34.7 37.3 37.3 37.4 37.5 37.6 39.2 39.3 39.4 39.5 39.6 39.7 15.9 19.4 23.4 23.8 28.1 36.7 38.4 39.5
Shares (FD) 23.9 27.2 30.3 31.0 34.7 37.3 37.3 37.4 37.5 37.6 39.2 44.5 44.6 44.7 44.8 44.9 15.9 19.4 23.4 23.8 28.1 36.7 39.7 44.7
EPS (Basic) - non-IFRS ($0.44) ($0.70) ($0.30) ($0.36) ($0.33) ($0.22) ($0.17) ($0.13) ($0.11) ($0.09) ($0.04) $0.00 $0.02 $0.06 $0.13 $0.24 ($0.31) ($0.28) ($1.55) ($1.54) ($1.77) ($0.84) ($0.23) $0.00
Pro Forma EPS (FD) ($0.36) ($0.22) ($0.28) ($0.28) ($0.15) ($0.18) ($0.14) ($0.09) ($0.08) ($0.05) ($0.01) $0.03 $0.04 $0.08 $0.14 $0.23 ($0.31) ($0.28) ($1.30) ($1.33) ($1.17) ($0.56) ($0.12) $0.00
% of Sales
Gross Margin 51.4% 48.3% 42.0% 45.2% 50.3% 47.8% 48.1% 48.3% 47.2% 47.9% 48.1% 48.7% 48.2% 48.5% 49.0% 49.8% 43.9% 43.9% 40.0% 43.3% 46.1% 48.5% 48.0% 49.0%
R&D 81.5% 59.2% 55.1% 46.2% 54.4% 50.2% 42.5% 34.7% 33.0% 30.3% 27.0% 24.1% 22.7% 20.2% 16.7% 14.4% 57.3% 51.3% 68.0% 71.8% 57.9% 44.0% 28.2% 17.8%
G&A 26.7% 15.0% 13.3% 14.6% 16.9% 15.8% 13.2% 11.0% 10.2% 9.6% 8.6% 7.9% 7.4% 6.8% 6.2% 5.5% 12.9% 12.0% 21.8% 21.8% 16.4% 13.8% 9.0% 6.3%
Op Inc (normalized) (81.2%) (40.4%) (38.1%) (27.0%) (37.9%) (34.3%) (21.0%) (8.6%) (6.2%) (1.9%) 3.8% 8.7% 10.5% 14.3% 19.6% 24.0% (41.8%) (36.9%) (72.6%) (74.1%) (42.6%) (23.2%) 1.8% 18.2%
Net Inc (120.9%) (155.0%) (63.6%) (71.3%) (92.7%) (61.3%) (39.8%) (23.2%) (19.9%) (14.1%) (6.7%) 0.1% 2.4% 6.6% 12.1% 16.8% (54.8%) (53.9%) (91.7%) (106.6%) (97.8%) (49.5%) (9.2%) 10.7%
% Change
Revenue 24.6% 51.0% 92.9% 58.4% 40.5% 10.8% 14.9% 28.6% 69.2% 67.2% 56.9% 42.5% 47.4% 58.7% 70.9% 92.4% 40.1% 6.0% (16.7%) (19.4%) 57.0% 22.6% 56.9% 69.4%
Op Inc 3.0% (19.8%) (19.3%) (0.4%) (34.4%) (6.0%) (36.8%) (59.0%) (72.5%) (90.5%) (128.4%) (243.6%) (350.5%) ######## 784.7% 431.4% (16.5%) (6.5%) 63.9% (17.8%) (9.7%) (33.4%) (112.1%) 1630.3%
EPS 2.9% (32.3%) (12.6%) (5.2%) (59.3%) (19.0%) (49.2%) (65.5%) (45.7%) (69.1%) (90.4%) (128.5%) (153.3%) (246.0%) ######## 764.7% (20.5%) (9.7%) 364.3% 2.3% (12.0%) (52.2%) (78.4%) (100.0%)
Source: SEC filings, company reports and ROTH Capital Partners
Scott W Searle, CFA
(646) 616-2782
Page 6 of 11
SEQUANS COMMUNICATIONS SA Company Note - June 24, 2021

Regulation Analyst Certification ("Reg AC"): The research analyst primarily responsible for the content of this report certifiesthe following under Reg AC: I hereby certify that all views expressed in this report accurately reflect my personal viewsabout the subject company or companies and its or their securities. I also certify that no part of my compensation was, is orwill be, directly or indirectly, related to the specific recommendations or views expressed in this report.
Disclosures:An Associated Person owns debt or equity securities of Intel Corporation.
ROTH makes a market in shares of Sequans Communications SA, Akoustis Technologies, Inc., Ambarella Inc., CEVA Inc.,Intel Corporation, Knowles Corp., MaxLinear, Inc, Impinj, Inc., Pixelworks, Inc., QuickLogic Corp, SiTime Corp. and SemtechCorp. and as such, buys and sells from customers on a principal basis.
A Research Analyst and/or a member of the Analyst's household own(s) debt or equity securities of SequansCommunications SA stock.
Within the last twelve months, ROTH has received compensation for investment banking services from Pixelworks, Inc.and SiTime Corp..
Shares of Pixelworks, Inc. may be subject to the Securities and Exchange Commission's Penny Stock Rules, which mayset forth sales practice requirements for certain low-priced securities.
Within the last twelve months, ROTH has managed or co-managed a public offering for Pixelworks, Inc. and SiTime Corp..
Within the last twelve months, ROTH has received compensation for non-investment banking securities-related servicesfrom QuickLogic Corp.
Rating and Price Target History for: Sequans Communications SA (SQNS) as of 06-23-2021
10
8
6
4
2
0Q1 Q2 Q3 2019 Q1 Q2 Q3 2020 Q1 Q2 Q3 2021 Q1 Q2
07/31/18B:$3.5
10/30/18B:$2.75
02/19/19B:$2.5
07/30/19B:$3
11/06/19B:$3.5
12/31/19B:$12.25
05/15/20B:$11.5
07/28/20B:$13
01/21/21B:$15
Created by: BlueMatrix
Rating and Price Target History for: Intel Corporation (INTC) as of 06-23-2021
70
65
60
55
50
45
40Q1 Q2 Q3 2019 Q1 Q2 Q3 2020 Q1 Q2 Q3 2021 Q1 Q2
04/27/18B:$65
10/26/18B:$60
01/24/20B:$75
07/23/20N:$55
10/23/20N:$50
01/22/21N:$60
03/23/21N:$65
Created by: BlueMatrix
Page 7 of 11
SEQUANS COMMUNICATIONS SA Company Note - June 24, 2021

Rating and Price Target History for: Akoustis Technologies, Inc. (AKTS) as of 06-23-2021
20
15
10
5
0Q1 Q2 Q3 2019 Q1 Q2 Q3 2020 Q1 Q2 Q3 2021 Q1 Q2
06/21/18B:$10
08/24/20B:$12
12/30/20B:$16
02/01/21B:$25
05/03/21B:$16
Created by: BlueMatrix
Rating and Price Target History for: CEVA Inc. (CEVA) as of 06-23-2021
80
70
60
50
40
30
20Q1 Q2 Q3 2019 Q1 Q2 Q3 2020 Q1 Q2 Q3 2021 Q1 Q2
05/09/18B:$44
08/07/18B:$35
02/18/20B:$40
07/16/20B:$50
08/10/20B:$60
02/16/21B:$100
05/10/21B:$70
Created by: BlueMatrix
Rating and Price Target History for: Ambarella Inc. (AMBA) as of 06-23-2021
140
120
100
80
60
40
20Q1 Q2 Q3 2019 Q1 Q2 Q3 2020 Q1 Q2 Q3 2021 Q1 Q2
06/06/18N:$45
08/31/18N:$35
11/30/18N:$40
03/06/19N:$45
08/30/19N:$55
11/26/19N:$60
03/04/20N:$65
06/26/20N:$50
09/03/20N:$55
11/23/20N:$70
12/30/20N:$95
01/12/21B:$130
03/03/21B:$150
06/02/21B:$130
Created by: BlueMatrix
Page 8 of 11
SEQUANS COMMUNICATIONS SA Company Note - June 24, 2021
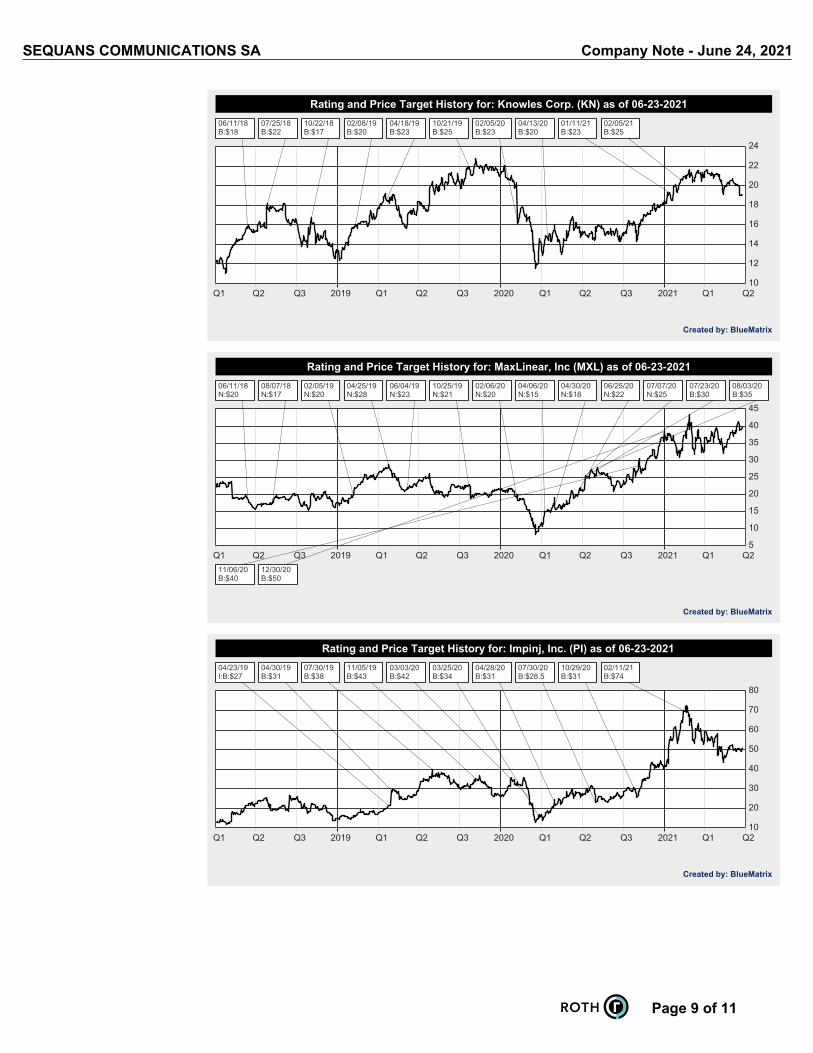
Rating and Price Target History for: Knowles Corp. (KN) as of 06-23-2021
24
22
20
18
16
14
12
10Q1 Q2 Q3 2019 Q1 Q2 Q3 2020 Q1 Q2 Q3 2021 Q1 Q2
06/11/18B:$18
07/25/18B:$22
10/22/18B:$17
02/08/19B:$20
04/18/19B:$23
10/21/19B:$25
02/05/20B:$23
04/13/20B:$20
01/11/21B:$23
02/05/21B:$25
Created by: BlueMatrix
Rating and Price Target History for: MaxLinear, Inc (MXL) as of 06-23-2021
45
40
35
30
25
20
15
10
5Q1 Q2 Q3 2019 Q1 Q2 Q3 2020 Q1 Q2 Q3 2021 Q1 Q2
06/11/18N:$20
08/07/18N:$17
02/05/19N:$20
04/25/19N:$28
06/04/19N:$23
10/25/19N:$21
02/06/20N:$20
04/06/20N:$15
04/30/20N:$18
06/25/20N:$22
07/07/20N:$25
07/23/20B:$30
08/03/20B:$35
11/06/20B:$40
12/30/20B:$50
Created by: BlueMatrix
Rating and Price Target History for: Impinj, Inc. (PI) as of 06-23-2021
80
70
60
50
40
30
20
10Q1 Q2 Q3 2019 Q1 Q2 Q3 2020 Q1 Q2 Q3 2021 Q1 Q2
04/23/19I:B:$27
04/30/19B:$31
07/30/19B:$38
11/05/19B:$43
03/03/20B:$42
03/25/20B:$34
04/28/20B:$31
07/30/20B:$28.5
10/29/20B:$31
02/11/21B:$74
Created by: BlueMatrix
Page 9 of 11
SEQUANS COMMUNICATIONS SA Company Note - June 24, 2021

Rating and Price Target History for: Pixelworks, Inc. (PXLW) as of 06-23-2021
6
5
4
3
2
1Q1 Q2 Q3 2019 Q1 Q2 Q3 2020 Q1 Q2 Q3 2021 Q1 Q2
05/03/18B:$6
08/31/18B:$7
10/29/18B:$6
08/11/20B:$5
Created by: BlueMatrix
Rating and Price Target History for: QuickLogic Corp (QUIK) as of 06-23-2021
25
20
15
10
5
0Q1 Q2 Q3 2019 Q1 Q2 Q3 2020 Q1 Q2 Q3 2021 Q1 Q2
08/09/18B:$21
06/19/19N:$7
08/07/19N:$5.6
11/06/19N:$4.9
01/13/20N:$8.5
01/28/20N:$6.5
02/13/20N:$7
05/12/20N:$5
06/24/20N:$3.5
11/05/20N:$3
02/18/21N:$7
05/19/21B:$8
Created by: BlueMatrix
Rating and Price Target History for: Semtech Corp. (SMTC) as of 06-23-2021
90
80
70
60
50
40
30
20Q1 Q2 Q3 2019 Q1 Q2 Q3 2020 Q1 Q2 Q3 2021 Q1 Q2
05/31/18B:$51
08/30/18B:$54
10/08/18B:$63
11/29/18B:$62
01/28/19B:$59
03/14/19N:$49
05/30/19N:$45
11/18/19N:$48
03/09/20N:$44
05/28/20N:$48
08/27/20N:$52
12/03/20N:$53
03/18/21N:$66
06/02/21B:$83
Created by: BlueMatrix
Page 10 of 11
SEQUANS COMMUNICATIONS SA Company Note - June 24, 2021
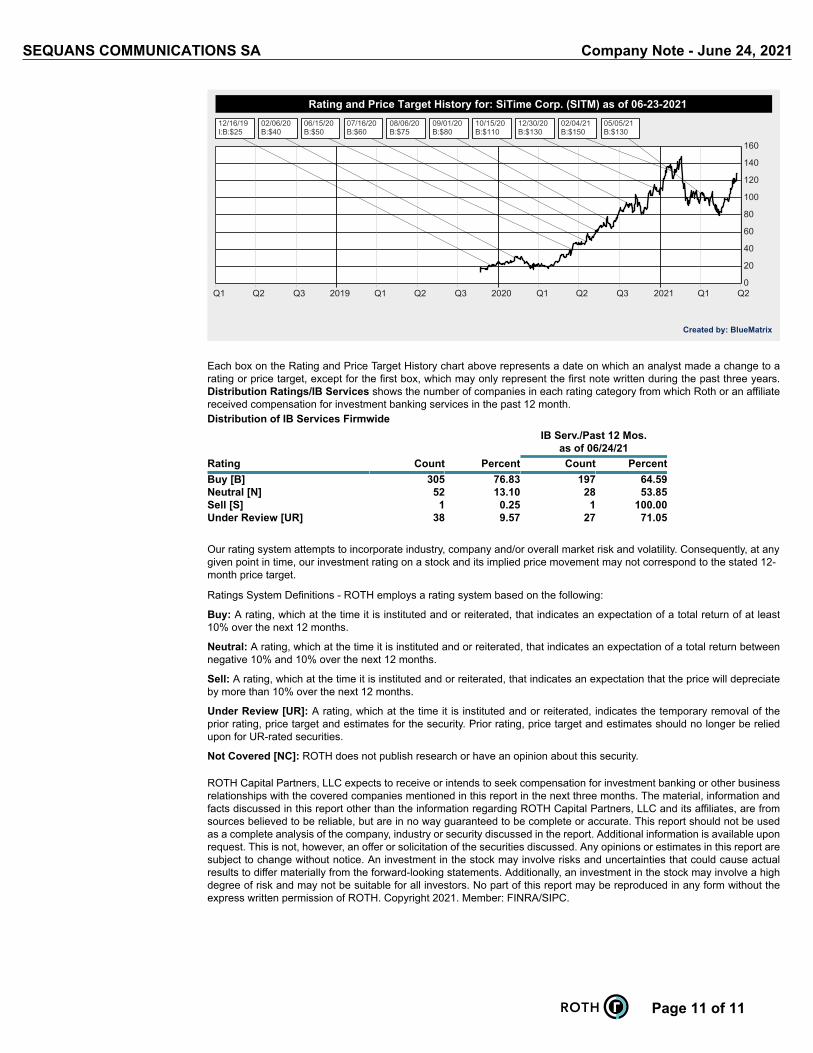
Rating and Price Target History for: SiTime Corp. (SITM) as of 06-23-2021
160
140
120
100
80
60
40
20
0Q1 Q2 Q3 2019 Q1 Q2 Q3 2020 Q1 Q2 Q3 2021 Q1 Q2
12/16/19I:B:$25
02/06/20B:$40
06/15/20B:$50
07/16/20B:$60
08/06/20B:$75
09/01/20B:$80
10/15/20B:$110
12/30/20B:$130
02/04/21B:$150
05/05/21B:$130
Created by: BlueMatrix
Each box on the Rating and Price Target History chart above represents a date on which an analyst made a change to arating or price target, except for the first box, which may only represent the first note written during the past three years.Distribution Ratings/IB Services shows the number of companies in each rating category from which Roth or an affiliatereceived compensation for investment banking services in the past 12 month.Distribution of IB Services Firmwide
IB Serv./Past 12 Mos.as of 06/24/21
Rating Count Percent Count PercentBuy [B] 305 76.83 197 64.59Neutral [N] 52 13.10 28 53.85Sell [S] 1 0.25 1 100.00Under Review [UR] 38 9.57 27 71.05
Our rating system attempts to incorporate industry, company and/or overall market risk and volatility. Consequently, at anygiven point in time, our investment rating on a stock and its implied price movement may not correspond to the stated 12-month price target.
Ratings System Definitions - ROTH employs a rating system based on the following:
Buy: A rating, which at the time it is instituted and or reiterated, that indicates an expectation of a total return of at least10% over the next 12 months.
Neutral: A rating, which at the time it is instituted and or reiterated, that indicates an expectation of a total return betweennegative 10% and 10% over the next 12 months.
Sell: A rating, which at the time it is instituted and or reiterated, that indicates an expectation that the price will depreciateby more than 10% over the next 12 months.
Under Review [UR]: A rating, which at the time it is instituted and or reiterated, indicates the temporary removal of theprior rating, price target and estimates for the security. Prior rating, price target and estimates should no longer be reliedupon for UR-rated securities.
Not Covered [NC]: ROTH does not publish research or have an opinion about this security.
ROTH Capital Partners, LLC expects to receive or intends to seek compensation for investment banking or other businessrelationships with the covered companies mentioned in this report in the next three months. The material, information andfacts discussed in this report other than the information regarding ROTH Capital Partners, LLC and its affiliates, are fromsources believed to be reliable, but are in no way guaranteed to be complete or accurate. This report should not be usedas a complete analysis of the company, industry or security discussed in the report. Additional information is available uponrequest. This is not, however, an offer or solicitation of the securities discussed. Any opinions or estimates in this report aresubject to change without notice. An investment in the stock may involve risks and uncertainties that could cause actualresults to differ materially from the forward-looking statements. Additionally, an investment in the stock may involve a highdegree of risk and may not be suitable for all investors. No part of this report may be reproduced in any form without theexpress written permission of ROTH. Copyright 2021. Member: FINRA/SIPC.
Page 11 of 11
SEQUANS COMMUNICATIONS SA Company Note - June 24, 2021
Top Related