


Languages
Pages
Legal


University of Montana University of Montana
ScholarWorks at University of Montana ScholarWorks at University of Montana
Graduate Student Theses, Dissertations, & Professional Papers Graduate School
1995
Selected factors and the music reading ability of high school Selected factors and the music reading ability of high school
choral students in western Montana choral students in western Montana
Dawn Beryl Matt The University of Montana
Follow this and additional works at: https://scholarworks.umt.edu/etd
Let us know how access to this document benefits you.
Recommended Citation Recommended Citation Matt, Dawn Beryl, "Selected factors and the music reading ability of high school choral students in western Montana" (1995). Graduate Student Theses, Dissertations, & Professional Papers. 3507. https://scholarworks.umt.edu/etd/3507
This Thesis is brought to you for free and open access by the Graduate School at ScholarWorks at University of Montana. It has been accepted for inclusion in Graduate Student Theses, Dissertations, & Professional Papers by an authorized administrator of ScholarWorks at University of Montana. For more information, please contact [email protected].

{
Maureen and MikeM A N S F I E L D L I B R A R Y
The University of I V I O N T A N A
Permission is granted by the author to reproduce this material in its entirety, provided that this material is used for scholarly purposes and is properly cited in published works and reports.
** Please check.!Yes" or "No" and provide si^ature **
Yes, I grant permission No, I do not grant permission
Author's Signature
Date 19 9 ^ ____________
Any copying for commercial purposes or financial gain may be undertaken only with the author's explicit consent.


Selected Factors and the Music Reading Ability
of High School Choral Students in Western Montana
by
Dawn Beryl Matt
B.M.E. Illinois State University, 1983
presented in partial fulfillment of the requirements
for the degree of
Master of Music Education
The University of Montana
1995
Approved by:
Chairper^n
T x . A ^ - L ODean
Date

UMI Number: EP34838
All rights reserved
INFORMATION TO ALL USERS The quality of this reproduction is dependent upon the quality of the copy submitted.
In the unlikely event that the author did not send a complete manuscript and there are missing pages, these will be noted. Also, if material had to be removed,
a note will indicate the deletion.
UMI EP34838
Published by ProQuest LLO (2012). Copyright in the Dissertation held by the Author.
Microform Edition © ProQuest LLO.All rights reserved. This work is protected against
unauthorized copying under Title 17, United States Code
uesfProQuest LLO.
789 East Eisenhower Parkway P.O. Box 1346
Ann Arbor, Ml 4 8 1 0 6 -1 3 4 6

Matt, Dawn B ., M.M.E., May, 1995 Music
Selected Factors and the Music Reading Ability of High School Students in Western Montana
Director: Cheryl Hewson
A basic musical foundation should include the conceptual knowledge necessary to correctly interpret melodic and rhythmic notation. The shift to child-centered education in the beginning of the century led vocal teachers to incorporate the rote-teaching approach as part of their teaching methodology. This has caused concern.
The purpose of this study was to assess the music reading skills of high school choral students in Western Montana. Research indicates that these skills are influenced by several variables. Richard Colwell's Music Achievement Test Two was utilized for the assessment. Teacher and student survey information was correlated with the test results. While results of the assessment indicated a low level of student success when identifying correct melodic and rhythmic passages, four variables seemed to have a significant positive influence on the ability of students to perform well on the assessment. These included overall choir experience, aural recognition, music in the home, and frequency of rehearsals.
11

Table of Contents
Abstract................................................................................................................................ ü
Table of Contents...............................................................................................................ni
Text.......................................................................................................................................1
References..........................................................................................................................20
Appendix A; Maps of Study Area..................................................................................... 21
Geographical Location of Study.....................................................................................22
Montana..................................................................................... 23
Appendix B: Instructor Survey..........................................................................................24
y^pendix C: Student Survey................... 28
Appendix D Comprehensive Survey and Assessment Results......................................... 30
Appendix E: Complete Student Survey Responses and Test Results.............................. 49
y^pendixF: Tables...........................................................................................................58
Table 1; Mean Assessment Scores; Points and Percentages..........................................59
Table 2: Correlation of Aural Scores and Aural-Visual Identification Scores...............60
Table 3: Correlation of Aural Discrimination and Aural-Visual Melodic
Discrimination..................................................................................................61
Table 4: Assessment Score Percentages by Grade Level............................................... 62
Table 5: Student & Teacher Perceptions and Actual Scores.......................................... 63
Table 6: Correlation of Length of Piano Study and Test Scores....................................65
Table 7: Correlation of Length of Study of a Band or Orchestra Instrument and
Test Scores.....................................................................................................66
iii

Table 8: Correlation of Length of Study in Band or Orchestra and Test Scores...........67
Table 9: Correlation of Private Vocal Study and Test Scores....................................... 68
Table 10: Correlation of Choir Size and Test Scores.....................................................69
Table 11: Correlation of Frequency and Length of Rehearsals and Test Scores...........70
Table 12: Correlation of Areas Taught and Test Scores................................................71
Table 13: Correlation of Individual Choral Experience and Test Scores...................... 72
Table 14: The Influence of the Home Musical Environment......................................... 73
Table 15; Correlation of Outside Singing and Test Scores........................................... 77
Table 16: Correlation of Experience Level of Choir and Test Scores...........................78
Table 17: Correlation of Teacher Experience and Test Scores..................................... 79
IV

Selected Factors and the
Music Reading Ability of High School Choral Students
in Western Montana
The Problem
The ability to read music is a learned skill that expedites the learning process and fosters
musical independence. At a minimum a basic musical foundation should include the
conceptual knowledge necessary to correctly interpret melodic and rhythmic notation and
expressive markings.
The twentieth century has witnessed a vast array of educational movements and
philosophies. The child-centered educational movement toward the beginning of the
century led music educators away from the drill-like approach to teaching music reading
to one of rote teaching, especially in the field of vocal music (Dwiggins Daniels, 1986).
While the effect of rote teaching on the music reading abilities of voice studoits is not new
to educators of vocal music, the resulting limitations have been of great concern over
recent years. The topic has often been the focus of informal conversation at music
conferences and conventions. Recognition of this topic of discussion indicates the need to
assess the music reading skills of high school choral students under more formal
circumstances.
Conversations with vocal music educators and personal teaching experience lead this
investigator to believe that choral students experience difficulty while reading music. The
purpose of this study will be to assess the music reading skills of high school choral music
students in Western Montana. While there are many skills inherent in reading music, this

Selected Factors
2
study will focus specifically on the interpretation of melodic and rhythmic notation. An
assessment of these skills will provide music educators with an indication of what their
students know and what areas need to be improved upon. Essential to this stutfy will be
an investigation of different variables that may affect the reailts of the assessment. These
variables will include those related to the immediate educational environment and those
related to the personal experiences of each audent.
It is important that the term "music reading" is not confused with "sight-singing."
Sight-singing implies the act of singing. The psychological and physiological factors
involved in a sight-singing examination would be much more involved than those of this
particular music reading assessment, which involves aural and aural-visual identification.
Review of Related Literature
According to the National Assessment of Educational Progress (NAEP), the goals of
music education are to develop aesthetic senativity in students while enabling them to
develop musical abilities at the elementary and secondary school levels. These goals
include five objectives. Students will;
1. value music as an important realm of human experience;2. perform music;3. create music;4. identify the elements and expressive controls of music;5. identify and classify music historically and culturally (NAEP, 1981, p. 3).
The Music Educators National Conference (MENC) recognizes similar goals,
recommending that a music program shall provide the opportunities for students to:
1. appreciate music as an art;

Selected Factors
32. develop skills in recognizing and using the components of music;3. develop musical judgment;4. develop facility in singing and playing an instrument (MENC, 1959, p.8).
More recently, the MENC (1986) stressed that the abilities to perform, to create, and to
understand music should be developed in each student.
The document Arizona Essential Skills for Music (19881 supports the recommendations
of the NAEP and MENC, recognizing that a quality music program should include these
aspects of music at every level: performance, creation, organization, study, description,
and analysis.
Regarding the reading of music, the Committee of the document Arizona Essential Skills
for Music (1988, pp.21 - 23) suggests several learner outcomes by the completion of
eighth grade general music:
1. Use a systematic means for reading music.2. Sing or play simple melodies in treble or bass clef at sight.3 Use standard notation as a guide to singing or playing classroom instruments.4. Employ traditional or nontraditional notation as a means of retrieving musical ideas. 5 Identify by name and function, standard notational symbols for pitch, rhythm,
articulation, and dynamics.6. Recognize similar and contrasting ideas when presented in musical notation.
It is also suggested that students should be able to follow a single line of notation while
listening to music. Students who complete seventh and eighth grade choral music are
expected to interpret rhythmic and melodic notation while singing, and to demonstrate
knowledge of music notation and symbols.
There has been little research investigating music reading skills over the past five years.
As a result it is necessary to review the results of less recent material. The Second

Selected Factors
4
National Music Assessment assessed the musical knowledge of 2,500 randomly selected
nine, thirteen, and seventeen year-olds. These students were not necessarily involved in
school music programs; as such, it is likely the results would differ from an assessment of
students involved in programs of musical emphasis.
While the mean scores of the assessment cannot be compared to the present study
because of differences in population experiences, the results of the assessment revealed
some interesting information. Overall, achievement results were higher for those who
participated in five or more outside musical activities than for those who participated in
one activity. A positive correlation was established for those students who participated in
band or orchestra: the longer students were in band or orchestra, the higher the number of
correct responses to the music assessment. Also, the mean was higher for students of
instrumental music than for those of non-instrumental music (NAEP, 1981).
A study by Rose Dwiggins Daniels supports the findings of the Second National Music
Assessment. Her research reveals a strong correlation between the ability to read music
and instrumental experience. She deduced that three factors in her study "formed the best
prediction model for sight-singing ability: students who had a piano in their home, who
participated in all-state chorus, and who had experience playing a musical instrument
(1986, p.288).
Contrastingly, Carole Harrison (1990) determined that instrumentalists did not do as
well as pianists or vocalists in the written work and sightsinging components of a first
semester theory course. Pembrook & Taylor (1986) found that those whose principal

Selected Factors
5
was the piano performed better than vocalists on a melodic discrimination test. There was
no mention of band or orchestral influence.
Wig & Boyle (1982) did a comparative study utilizing the Colwell Music Achievement
Tests (MAT), One and Two. The tests included pitch discrimination, major-minor
discrimination, aural-visual pitch discrimination, and aural-visual rhythmic discrimination.
The study covered a two-year period; teaching approaches examined included those of a
keyboard-laboratory approach and a general music approach (singing, listening, playing,
study of musicians and style). Results of the study suggest that class piano experience can
facilitate greater musical achievement than a general music approach. During the first
year, differences between the two groups were significant for meter and mjyor-minor
discrimination. The second year, statistically significant differences were found between
the two groups' mean scores on interval discrimination, meter discrimination, major-minor
discrimination, and aural-visual pitch discrimination.
While the results of Wig & Boyle's study indicate a positive correlation between
keyboard class experience and musical achievement, the reference to musical achievement
implies a specific body of musical knowledge. Musical achievement and musical
understanding are not necessarily perceived in the same manner. It is quite possible that
the musical understanding of the general music group encompasses an entirely different
body of musical knowledge than that of the laboratory group, and therefore a different
area of musical achievement.
In summary, the NAEP, MENC, and Committee of the document Arizona Essential

Selected Factors
6
Skills for Music recommend that music education should include the objective areas of
aesthetic appreciation and the ability to understand and use music notation in a functional
manner.
Results of the Second National Music Assessment and research by Dwiggins Daniels,
Harrison, Pembrook & Taylor, and Wig & Boyle indicate that success in sight-reading is
determined by several variables. Students who have piano or instrumental experience
seem to be more successful sight-readers than those who don't have the experience.
Likewise, students who participate in many out of school musical activities have greater
musical knowledge than those who participate in fewer out of school musical activities.
The purpose of th isi^dy is to assess the music reading skills of high school choral
music students in Western Montana. Previous research reveals that different variables
affect a student's ability to read music. This information leads the investigator to believe
that several questions need to be considered in this study:
1. Does piano or instrumental experience affect the ability of a student to read music?
2. Does piano or instrumental experience affect the ability of a student to apply aural
recognition skills?
3 Does private study of the voice affect the ability of the student to read music or
apply aural recognition skills?
4. Do a student's aural recognition skills affect the ability of the student to read
melodic notation?
5. Do the variables of time and size affect the ability of a choir to perform well on the

Selected Factors
7
assessment?
6. Does the amount of teacher instruction time spent on music reading skills affect the
ability of students to read music?
7. Does the amount of student choral experience affect a student's ability to read
music?
8. Does the amount of student choral experience affect a student's ability to apply
aural recognition skills?
9. Does the amount of music present in a student's home environment affect the
ability of the student to read music notation or apply aural recognition skills?
Procedure
Because of the vast area in the state of Montana, subjects were selected according to a
small geographic area in the western comer of the state. The area included all towns
along Hwy 93, north to the western boundaries of Glacier Park, and west to the Montana
border (Appendix A).
Initially, 29 public high schools were asked to participate in the study. Schools were
selected based upon their geographic location and their listing in the 1994-1995 Montana
High School Association Directory. An investigator-created surv^ was mailed to choral
directors prior to the assessment process. The survey included three sections; the first
section requested background information on the choir; the second section asked directors
to informally assess the ability of each grade level to read melodic and riiythmic notation;
the third section asked directors to reveal one area of concern regarding the teaching of

Selected Factors
8
music reading skills (Appendix B). Directors were asked to complete one survey per choir
assessed, and to complete each survey prior to the assessment of the choir(s). This was
done as a precautionary measure to prevent biased results.
The decision to participate in the study was left to each director Directors were given
the option to respond to the survey, participate in the assessment, not participate in the
assessment, or not participate in the study at all, by neither responding to the survey nor
participating in the assessment.
Eleven schools responded 6vorably, agreeing to participate in all aspects of the study.
These schools included seventeen choirs, a total o f402 students in grades nine through
twelve. Five directors agreed to complete the survey, but in the interest of time did not
want their students to participate in the assessment. The remaining thirteen schools either
expressed a desire not to participate in any aspect of the study or did not respond at all.
Directors who wished for their students to participate in the assessment were contacted
by telephone to schedule the assessment. The assessment was to take approximately 45
minutes, including the completion of the student survey (Appendix C). Anonymity was
assured for the students and directors involved in the assessment. Schools were randomly
assigned a number; choirs from each school were also assigned a number based upon their
order of participation in the assessment. Students were asked to put their first names on
their assessments and surveys so that correlations could be established. Assessments were
scored, placed in numerical order based upon Part 3 scores, and assigned a number. This
number was then used in the final interpretation of the results.

Selected Factors
9
This investigator is the only person who had access to the results of the assessment.
However, since it is the primary purpose of any assessment to improve the teaching or
learning process, the investigator determined it would be appropriate for choral directors
to have access to the results of their individual choral students upon request.
Students were asked to complete surveys prior to their participation in the assessment.
This was done to prevent possible bias of results. The purpose of the study was explained
and the importance of correlating the results of the survey with the assessment results was
acknowledged. The assessment tool used was Richard Colwell's Music Achievement Test
Two (MAT 2). The assumption was made by the investigator that the test met reliability
and validity standards. The test consisted of three parts: Part 1 was an aural assessment
that measured a student's ability to hear major or minor; Part 2 was an aural assessment
that measured the student's ability to hear the key tone, or tonic; Part 3 was an aural-visual
discrimination assessment that measured a student's ability to identify correct melodic and
rhythmic passages.
A total of 867 miles was covered during the assessment process. To assure
consistency, the investigator administered each assessment personally, with the exception
of one due to emergency illness. Every effort was made to provide an adequate testing
environment. A Panasonic RX-FT560 cassette player was utilized during each
assessment, again to assure consistency.
The test was administered according to the directions provided by Dr Colwell in the
Administrative and Scoring Manual of MAT 2. In addition, students were instructed not

Selected Factors
10
to hum or sing during the assessment. Directors were present during the assessment and
were not allowed to assist their students in any way. Students were asked to select the
correct answers on an Opscan form. All assessments were hand-scored and double
checked by the investigator.
Results
Variables examined in this study were obtained from completed teacher and student
surveys, and from results of the assessment. Variables considered included those of
student background experience, teacher experience and approach to teaching music
reading, the choral environment, and the assessment.
The variables of student background experience included; the amount of piano or other
instrumental experience; whether or not there was a piano or keyboard instrument in the
student's home; the length of time the student was in band or orchestra; the amount of
private voice study; the amount of singing done outside of school hours; grade level in
school; the amount of choral experience; and the amount of musical exposure in the home.
The variables of teacher experience and approach to teaching music reading included the
experience of the director, the length of time the director was in the present school system,
and the amount of teacher instruction time related to music reading skills. Variables of the
choral environment included the length and amount of choral rehearsal time, experience
level of the choir, and size of the choir. Variables related to the assessment included the
scores of the aural and aural-visual components of the assessment.
Data were analyzed utilizing the Microsoft Excel program. Results of the assessment
Selected Factors
11
and surveys were recorded (Appendix D) and correlated. A level of 0.5 was selected as
statistically significant for purposes of the correlation. Possibile delimitations of the test
included a fatigue factor due to such intense concentration for the approximate 30 minutes
of the test, and the fact that the aural-visual melodic discrimination component of the
assessment contained only treble clef examples.
For the purpose of this study, the assessment will be referred to in two different ways.
The first way is by part: Part 1 will designate the major-minor discrimination assessment;
Part 2 will designate assessment of tonality; Part 3 A will designate the aural-visual
melodic discrimination assessment; and Part 3B will designate the aural-visual rhythmic
discrimination assessment. The other instance of referral will refer to Parts 1&2 as
Section I, and to Parts 3 A and 3B as Section H.
Results of the assessment revealed the following: the mean score of all students on the
ability to identify major or minor (Part 1) was 17.26 points, with 28 points possible; the
mean score of all students on the ability to hear tonal center (Part 2) was 8.44 points, with
20 points possible; the mean score of all students on the ability to identify correctly
notated melodic line (Part 3A) was 14.87, with 28 points possible; and the mean score of
all students on the ability to identify correctly notated rhythmic passages (Part 3B) was
17.88 points, with 32 points possible. The total mean score for the aural part of the
assessment (Section I) was 25.7 points, with 48 points possible. The total mean score for
the aural-visual melodic and rhythmic identification part of the assessment (Section II) was
32.75, with 60 points possible. The total mean score for the entire assessment was 58.44

Selected Factors
12
points, with 108 points possible (Table F-1).
A statistically significant correlation of .61 was established between Section I and
Section II, as students who did better on the aural section of the assessment also did better
on the aural-visual discrimination section (Table F-2). Another significant correlation
(.54) was found between the total score of Section I and the aural-visual melodic
discrimination section (Part 3 A) of the assessment. Students who did better on the aural
section were more able to identify correctly notated melodic passages (Table F-3).
Assessment scores were further divided into those of students in grades 9, 10, 11, and
12. The delineation between grade levels revealed an improvement in the scores of both
melodic and diythmic reading skills according to grade level (Table F-4). Interestingly,
teacher expectations increased as students advanced by grade level, while student
perception of their abilities was higher than actual assessment scores (Table F-5).
A statistically significant correlation of .51 was made between the amount of piano study
and aural scores (Section I). Evidently, the more piano study a student had, the more
likely the student was to develop the ability to distinguish between major and minor and
hear the tonal center. While a positive correlation was established with the effect of piano
study on the ability to correctly interpret melodic and rhythmic notation (Section II), it
was not statistically significant (Table F-6).
The amount of study a student had on a band or orchestral instrument showed a positive
correlation on both the aural and aural-visual discrimination sections of the assessment.
While the correlations were both positive, neither was statistically significant (Table F-7).

Selected Factors
13
The length of time a student had participated in band or orchestra was also not
statistically significant, but once again, the correlation was positive for both sections
(Table F-8). It is noteworthy that experience playing a band or orchestra instrument
appeared to have more influence on a student's melodic and rhythmic reading abilities
(Section II) than on the student's ability to hear major or minor or tonal center (Section I)
(Tables F-7 & F-8).
The length of private voice study was not significantly related to a student's ability to
recognize major or minor or hear tonal center (Section I). Even less significant was the
effect of private voice study on the ability of a student to recognize correct melodic and
rhythmic notation (Section II) (Table F-9).
There was a positive correlation between the size of the choir and the scores on all parts
of the assessment. However, the correlation was not statistically significant (Table F-10).
Of particular interest is the importance of the frequency of rehearsals, the length of
rehearsals, and the effect of each on the assessment. The fi*equency of rehearsals revealed
a statistically significant correlation of .50 for Section I of the assessment. Almost
significant, at a level of .42 was the correlation for Section II of the assessment.
Surprisingly, a negative correlation was established between the length of the rehearsal
and the scores on the assessment. Longer rehearsals resulted in lower scores on both
sections of the assessment. This indicates that continuity in vocal music education is an
important factor in the development of music reading and listening skills (Table F-11).
Apparently the vocal directors in this study utilized an average of 0-5 minutes per

Selected Factors
14
rehearsal on sight-reading and the practice of music theory, and 6-10 minutes per rehearsal
practicing melodic or rhythmic passages from current literature without lyrics (Table
F-12). This teaching practice resulted in a negative correlation in almost all areas of the
assessment. The exception was the positive, although statistically insignificant, correlation
between music theory practice and the results of the aural-visual rhythmic assessment
(Part 3B) (Table F-12).
There was a positive correlation between the amount of high school choral experience a
student has and both sections of the assessment. Neither correlation was significant.
However, the amount of choral experience was reflected in higher scores on Section II of
the assessment than in Section I (Table F-13).
Students whose parents didn't play a musical instrument regularly earned a mean score
of 23.16 points on Section I and 27.97 points on Section II of the assessment. Students
whose parents did play a musical instrument regularly earned a mean score of 27.76 points
on Section I and 36.72 points on Section II Students whose parents did not listen to
music for one hour or more each week scored a mean o f26.29 points on Section I and
30.67 points on Section II Students whose parents did listen to music for one hour or
more each week scored a mean of 25.9 points on Section I and 33.07 points on Section II.
Students without a piano or keyboard instrument in their homes scored a mean of 23 .13
points on Section I and 27.28 points on Section II. Students with a piano or keyboard
instrument in their homes scored a mean of 27.34 points on Section I and 36.29 points on
Section II Students who did not play the guitar scored a mean o f25.37 points on

Selected Factors
15
Section I and 32.1 points on Section II. Students who did play the guitar scored a mean
of 27.92 points on Section I and 37.21 points on Section II. These results indicate that a
positive relationship exists between the amount of music in the home environment and a
student's ability to read music (Table F-14).
Other correlations revealed in this study are as follows. The amount of time a student
sings outside of school hours had a positive, although insignificant effect on the scores of
the assessment (Table F-15).
The experience level of the choir showed a significant correlation to both the scores of
Section I ( 71) and Section II (.85). This reveals that growth is occurring in music reading
and listening skills as students receive more choral experience (Table F-16).
A positive correlation of .52 exists between the length of time a director has been
teaching in the school district and a student's ability to hear major or minor (Part 1). The
correlations were also positive for the remaining parts of the assessment, but not
significantly. The length of time a director has been teaching in the field of education was
also related positively to the scores on both sections of the assessment, but this correlation
was not statistically significant (Table F-17).
Discussion
Results of the assessment reveal that high school choral students in Western Montana
experience a success rate of 53% when asked to identify correct melodic passages. The
success rate is slightly higher, 56%, when students are asked to identify correct rhythmic
passages.

Selected Factors
16
There are many positive correlations between the surveys and the assessment. While
many are positive, only a few are statistically significant. Members of more experienced
choirs are likely to interpret melodic and rhythmic patterns more successfully than less
experienced choirs. This indicates a need for different levels of choral organizations and
"feeder" choirs.
Students who performed better on the aural section of the assessment also performed
better on the aural-visual discrimination section. Success on the aural section of the
assessment was also an indicator of the success level on the melodic discrimination part of
the test. This indicates that the development of music listening skills is important to the
success of music reading skills.
On the aural section of the assessment, students with a piano back^ound performed
significantly better than those with no piano experience. Students with guitar experience
were likely to perform better on both the aural and aural-visual discrimination sections of
the test. The amount of music in a student's home environment seems to have a positive
effect on the student's aural recognition skills and the ability to read music.
Perhaps the most important result of the study is the fact that the fi'equency of rehearsals
has a greater effect on a student's music reading ability than the length of rehearsals.
Longer rehearsals resulted in lower scores on the assessment, whereas more frequent
rehearsals resulted in higher scores.
Conclusions
The ability to read music is a learned skill that expedites the learning process and fosters

Selected Factors
17
musical independence. At a minimum a basic musical foundation should include the
conceptual knowledge necessary to correctly interpret melodic and rhythmic notation and
expressive markings.
The NAEP, MENC, and Committee of the document Arizona Essential Skills for Music
recommend that music education should include the objective areas of aesthetic
appreciation and the ability to understand and use music notation in a functional manner.
Previous research indicates that the ability to read music is affected by a number of
different variables. Correlations between Colwell's MAT 2 and the teacher and student
surveys support the results of the Second National Music Assessment (1981). Music
reading results are higher for those who regularly experience music outside of school than
for those who don't. Likewise, playing a band or orchestra instrument has a poative effect
on a student's music reading skills. The latter information also supports the study of
Dwiggins Dmiiels (1986).
This study supports the findings of Pembrook & Taylor (1986) and Wig & Boyle
(1982). Piano experience has a positive effect on a student's ability to read music.
Results of Richard Colwell's MAT 2 indicate that high school choral students in
Western Montana experience a success rate of 53% when asked to identify correct
melodic passages, and 56% when asked to identify correct melodic passages. Variables
that affected the results of the assessment significantly were those of the amount of choir
experience, a student's ability to recognize major or minor and tonal center, a student's
piano background, the amount of music a student experiences in the home environment.

Selected Factors
18
and the frequency of choir rehearsals. Western Montana high school choral students
experienced a success level of 53 - 56% when interpreting melodic and rhythmic notation.
This indicates a need for improvement if we are to foster musical independence. It is
possible that these scores could be improved upon with some changes in teaching
approach and scheduling.
The amount of time teaching and practicing music reading skills needs to be increased,
as the amount of time spent on these skills reflected a negative correlation. Teachers also
need to incorporate listening as a part of their regular curriculum, as aural recognition of
major, minor, and tonality has a positive affect on a student's ability to read music. This
recognition supports a study by Grutzmacher (1987), in which she indicated the same idea.
Results of this study indicate that choirs need to be of different experience levels if
students are to learn in a hierarchical sense. Results also indicate that the frequency of
rehearsals is more important to the development of music reading skills than the length of
rehearsals.
Teachers indicate that there are problems inherent with teaching music reading. These
problems include.
1. music difficulty;
2. the degree of student preparation prior to entering the high school choir;
3. the different levels of sequential understanding in choral students;
4. inconsistency;
5 lack of progression

Selected Factors
19
6. lack of a regularly scheduled approach;
7. time;
8. classroom interruptions;
9. the pressure to perform with high standards;
10. lack of attention to basic skills.
11. lack of sight-reading resources.
The most common problems cited were those of limited time and inconsistency of student
background.
There is a need for more research in this area. A beneficial study would be a
comparative study, in which a teacher instructs two or more classes in the skills of reading
music for 15 minutes per rehearsal while instructing the same number and levels of classes
in the skills of reading music for five minutes per rehearsal.
There is a need to establish a positive relationship between music reading and other
choral skills if music literacy is to be considered an important element of the choral
curriculum. Students need to be intelligent about what they are doing if musical
independency is to be acquired. As Dr. Richard Graham of the University of Georgia
remarked, "Musical literacy, and all but the most superficial comprehensions of music,
must be nurtured to be sustained (NAEP, 1981, p. 42)."

Selected Factors
20References
Andrews, P.M. (Ed.). (1959). The music curriculum in secondary schools: Handbook for
junior and senior high schools. Music Educators National Conference for March 1959
Bulletin of the National Association of Secondary School Principals. Washington 6, B.C.
Arizona Essential Skills for Music. (1988). Arizona State Department of Education.
Phoenix, A Z .
Colwell, R. (1969-70). Music Achievement Tests. Chicago: Follett Publishing Co.
Dwiggins Daniels, R. (1986). Relationships among selected factors and the sight-reading
ability of high school mixed choirs. Journal of Research in Music Education, 34(4),
279-289.
Grutzmacher, P.A. (1987). The effect of tonal pattern training on the aural perception,
reading recognition, and melodic sight-reading achievement of first-year instrumental
music students. Journal of Research in Music Education, 35(3), 171-181.
Harrison, C.S. (1990). Relationships between grades in the components of Freshman music
theory and selected background variables. Journal of Research in Music Education,
38(3), 175-186.
Microsoft Excel version 4.0. (1985-1992). [Computer program].
Music Educators National Conference.(1986). The school music program: Descriptions and
Standards, 2nd ed. Reston, Va. (Reprinted 1989).
National Assessment of Educational Progress Education Commission of the States. (1981).
Music 1971-79: Results from the Second National Music Assessment. (Report No. 10-
MU-01). Denver, CO.
Soft-Art Dictionary & Program. (1984-1992). Trade Secret, Soft-art, Inc.[Computer Program]
Wig, J.A.,Jr,. & Boyle, J.D. (1982). The effect of keyboard learning experiences on
middle school general music students' music achievement and attitudes. Journal
of Research in Music Education, 30(3), 163-172.

S e le c te d F actors
21
APPENDIX A
MAPS OF STUDY AREA

GEOGRAPHICAL LOCATION OF STUDY 22
|l "
1^ c! k
Fort N«c'ènbrook
Stirling Conrta
C ard s to o
L . „ c J ,Wt*M iCuttj
McOomal Oflmo«tWâckfèetL»b6y ^ m - A
Qlaci#r ParkCpTumttajfSValiprK a lis3 |(II A.hltyL ^
l cCrgOrjTut Crmek
I Nl^rada iynumï'ttptn*& D E^R^s ‘*\punofhoteiuLon«oin#
mpso Spring JLc~ / a.
^»r»dùi ir f i*
Aufunak..L E w
• A N Dr i c K
wm Ri\m *Foft Sh«St. R#g
t. ïfcnatiù^ ^ i o r
\ s U r k
Mownfflack oc
orshak H..n«*.,;0 ;\ p o w r 7 r i 3 i oc*;s
IfeHamilton > ''"'PSbur/ |l K£ /?.T^^'ck*,oRcrtyT| ' . V Southern C . 4 . r K : T - H & / I I
'StHilsn>'d«y oCorvjiiia N \n £ oÀr Lodg^^HamiltonPhihpsbur/ jl Æ f.t
% rr> f aB R O X d w
Boolder fpjder JrElk Park I I _v » » ? 0 « l -
-1 Ük>f#l Park
^ J^ 'var Star
in Bridgaa

23
STATE OF MONTANA
/ -
KfCCI
MlKNAf I
i
■t
Miitli'tl <*4 **1
V«I#I. U s inWfvUW 9

S e le c t e d F actors2 4
APPENDIX B
INSTRUCTOR SURVEY

25INSTRUCTOR SURVEY OF MUSIC READING SKILLS
SemestcR Spring 1995 Return by: Febniary 10, 1995SECTION IDirections: Circle the answer(s) that best describes the following questions.
A The choral group being considered for this survey is:
1. a novice choir (no previous e:q)erience)2. an intermediate choir ( 1 2 yrs. experience)3. an advanced choir (experienced; selected
by audition)4. a choir of mixed erqaerience levels
B. What is the size of the choir?1.20 or less2.21*35 3.36.49 4. SOwmore
C. How many these students are:1.FVeshma n _____________2. Sophomores__________3. Juzûors________________4. Seniors
D. How often does the chrâr meet each week? 1. twiceZAreetimes3. four tiroes4. doily
E. What is die usual lengtti of each rehearsed? 1.40 minutes or lessZ 41. SO minutes Z 51 • 60 minutes 4. m ue Aon 60 minutes
F. How much each rehearsal is spent on sight-reading?
1.0- Sminutes Z 6 - lOmbiules Z 11 -15 minutes 4. more Aon 15 minutes
G. How much each rehearsed is spent on music Aeory (xactioe, such as note/rhythmic identificertiui. Atervcdttc identification, meter, tenyo, etc.?
1.0-5 minutes Z 6 • 10 minutes Z 11-15 minutes 4. m ue Aon 15 minutes
H. How much of each rehearsal is spent practicing melodic or rhythmic passages directly from current literature without lyrics?
1.0-Sminutes 2.6-10 minutes 3.11 • 15 minutes 4 more than 15 minutes
I. Which do you use regularly?1. on estoWished sight-reading method Z a set of sight-reading exercises that you developed
3. sight-reading passages from current literature
4. ncme of Ae above
I. Which do you use regularly?1. a qteidfic music Aeory me Aod book Z a variety of Aeory eaercises from a
variety of puUished bodte3. flashoords u other music theuy devices4. none of Ae above
K. Is there a juniu high u middle schod choral program m your district? (H yes, please answer LandM.)
lyes Zno
L Are music theory skills such as noteAhythmic identification, motor, and tempo taught or reinfoTced A the Juniu high choral program?
lyes Zno
M. Are sight-reading skills practiced regularly m the juniu high choral program?
lyes Zno
N. Is Aere a Juniu high u middle school general music program A your district? (If yes, please answer O, PandQ.)
lyes Zno
O. Are music recKfing skills such as noteAhyAmIc identification, meter, and tenyo taught u reinforced A the junior high general music program?
lyes Zno

26
P. Are sight-reading skills practiced regularly in the junior high general music program?
1. yes 2. no
0 . Is general music a required subject at the junior high or middle school level?
1. yes 2. no
R. How long have you been teaching choral music in this district?
1. one year or less2.2-4 years 3 5-7 years4.8 years or more
S. How long have you been teaching in the field of music education?
1. one year or less2.2-4 years 3.5 - 7 years4.8 years or more
SECTION nDirections: Circle the answer that best describes the majority of students identified in each question. Use the following key:
1. UNACCEPTABLE: students are able to perform the task described less than 25% ofthe time.
2. ACCEPTABLE: students are able to perform the task described 25 - 50% of the time.3. ABOVE AVERAGE: students are able to perform the task described 51 - 75% of the time.4. VERY GOOD: students are able to perform the task described 76 - 100% of the time.
A The ability of Freshman choral students to read rhythms is:
1 2 3 4
B. The ability of Sophomore choral students to read rhythms is:
1 2 3 4
C. The ability of Junior choral students to read rhythms is:
1 2 3 4
D. The ability of Senior choral students to read rhythms is:
1 2 3 4
E. The ability of Freshman choral students to read melodic lines is:
1 2 3 4
F. The ability of Sophomore choral students to read melodic lines is:
1 2 3 4
G. The ability of Junior choral students to read melodic lines is:
1 2 3 4
H. The ability of Sophomore choral students to read melodic lines is:
1 2 3 4
I. The ability of Junior choral students to read melodic lines is:
1 2 3 4
J. The ability of Senior choral students to read melodic lines is:
1 2 3 4
K. The ability of the chorus to sight-read in unison is:
1 2 3 4
L The ability of the chorus to sight-read in two parts is:
1 2 3 4
M. The ability of the chorus to sight-read in more than two parts is:
1 2 3 4

27SECTION f f lIf you were to identify one area of concern regarding the teaching of music reading skills, what would it be?

S e le c te d F a cto r s
2 8
APPENDIX C
STUDENT SURVEY

29
STUDENT SURVEY OF MUSIC REAPING SKILLS
SECTION IDirccttons: Clrck the aniwcr that beet appUei to your personal eiperiencc.
A. What year are you in school?1 Freshman 2. Sophonune 3. Junior 4. Senior
B How long have you participated in a high school choral organization?1. one year 2. 2 years 3. 3 years 4. 4 years
C. How often do you sing outside of school hours each week, either as a soloist or in a performing organization?
1. less than one hour2. 1 - 2 hours3. 2 - 3 hours4 more than 3 hours
D. How often are you accurate with your rhythmic reading skills?1. less than 25% of the time2. 25 • 50% of the time3. 51-75% of the time4. 76- 100% of the time
E. How often are you accurate with your melodic reading skills?1. less than 25% of Ae time2. 25 - 50% of the time3. 51 - 75% of the time4. 76 - 100% of the time
P. How long have you studied voice with a private, or applied, voice teaclwr?1. never2. less than one year3. 1 - 3 years4. more ttian 3 years
G. How long have you studied the piano?1. never2. less them one year3. 1 - 3 years4. nxare than 3 years
H. How long have you studkd a band or orchestral instrument?1. never2. less than one year3. 1 - 3 years4. more than 3 years
I. How long have you been a member of a band or orchestra?1. never2. less than one year3. 1 - 3 years4. more than 3 years

S e le c t e d F a cto r s
30
APPENDIX D
COMPREHENSIVE SURVEY AND ASSESSMENT RESULTS

31COMPREHENSIVE SURVEY AND ASSESSMENT RESULTS
[Instructor |Section 11 Section W 1[School A B Cl 02 03 04 0 E F Q H__ K L M N o P__ Q R S A B .0 D E F O J K L M
1 1 3 alt 4 1 1 __^ __2 __4 __4 __3 J l J l J^ _2_2 J l J i J,
__ __
1 Student Survey & Test |1 Response Data Box Test Score I# A B 0 D E F Q H 1 J K L M m i W2 msi mo# #K1 ##c2
1 1 2 1 1 1 2 1 1 1 1 2 1 2 10 3 0 6 13 6 192 1 1 2 2 1 3 1 2 3 1 2 1 2 15 4 2 8 19 10 293 1 1 1 3 2 1 1 3 3 2 2 1 2 19 8 6 4 27 10 374 1 1 1 2 1 1 3 1 2 1 2 15 4 4 6 19 10 295 1 4 4 2 1 1 1 2 2 1 2 16 5 6 6 21 12 336 1 1 2 1 1 2 1 1 2 1 2 13 10 2 10 23 12 357 1 1 1 1 3 1 1 1 1 2 1 2 11 3 4 8 14 12 268 1 1 1 1 1 1 1 1 2 2 1 2 18 3 __2 12 21 149 1 4 4 3 2 1 1 1 2 18 11 4 10 29 14
10 1 1 1 1 1 1 1 1 1 2 1 2 14 4 8 _ j 8 1411 1 1 1 1 2 1 1 1 1 2 1 2 10 5 8 6 15 14 _2912 1 1 1 1 1 1 1 1 2 2 1 2 16 9 8 8 25 16 4113 1 1 2 1 2 1 3 3 2 1 1 2 11 7 12 4 18 16 3414 1 1 3 3 1 1 1 1 1 1 2 18 10 8 10 28 18 4615 1 1 4 4 1 1 2 1 2 1 2 14 ~ 3 10 8 17 18 35 __16 1 1 1 2 3 1 1 1 1 2 1 1 2 17 9 12 6 26 18 4417 1 1 1 3 4 1 3 3 1 1 2 17 5 8 2018 1 1 1 2 2 1 1 3 3 1 2 1 2 21 12 10 28 5019 1 1 1 4 2 1 1 1 2 2 1 2 9 6 14 8 15 22 3720 1 1 1 2 3 1 1 1 1 2 2 15 4 14 8 19 22 41 —21 1 1 1 2 2 1 1 1 1 2 2 1 2 16 7 14 8 23 22 45 1 !22 1 1 1 3 4 1 2 2 1 1 1 2 18 10 16 8 28 24 5223 1 1 1 2 2 1 1 1 2 2 2 13 2 10 16 15 26 4124 1 1 1 3 2 1 1 3 3 2 2 1 2 17 11 14 26 28 40 6825 1 1 4 4 3 4 2 1 1 1 1 1 2 18 7 14 12 25 26 5126 1 1 1 2 2 1 2 L _ 1 2 1 2 1 2 16 9 12 18 25 30 5527 1 1 2 3 3 2 2 4 2 2 1 2 24 2 16 16 26 32 5828 1 1 2 3 2 1 2 3 3 2 2 1 2 17 8 20 14 25 34 5929 1 1 3 4 4 1 1 1 3 2 1 1 2 20 1 20 14 21 34 553cr 1 1 1 3 2 1 1 1 1 2 2 1 2 17 10 14 24 27 38 6531 1 1 1 4 2 4 1 3 4 1 1 1 2 9 7 16 22 16 38 5432 1 2 2 4 1 1 4 4 1 2 1 2 16 2 12 28 18 40 5833 1 1 1 1 1 1 2 2 2 2 1 2 16 7 18 23 40 6334 1 2 2 3 1 1 3 3 1 2 1 2 ___ ! 22 8 20 24 30 44 7435 1 1 2 4 4 1 4 __ 1 1 1 2 2 27 14 16 30 41 46 8736 1 1 2 4 4 1 3 4 1 2 2 2 28 12 20 30 40 50 90
Meen 1 ij o e 1J6# 2#14 242# 1.6 #6# 1.929 2.02# 1.444 1.994 1.06# 2 16.42 #J#9 10J4 1396 __» ___ 34 47Mode 1 1 1 2 2 1 1 1 1 1 2 1 2 __ 1#____ 7 14 1 26 __M
SD__ 073# 0.#8# 1.106 1.12# 0### 096# 0.971 1.0#6 0.497 0461 Qj29 0 4.366 3.226 5096 JJS. MW 11J3 16.16

32COMPREHENSIVE SURVEY AND ASSESSMENT RESULTS
1 Instructor SectionI j Sectionii nScHool A B Ci C2 C3 C4 D E F 0 H TTI L w ~ N O p Q R s A B C OLT w J K r W
2 4 2 0 4 6 15 4 2 3 3 2 __2 __2 2 __4 4 _2 J_ _3 u _2 J . JL 1
iStudsnt Survey & Test1 Response Data Box Test Score |« A B__ D E F O H 1 J K n d M PI1 M2 M3» M3fe #wl •wt T«M
1 3 1 1 1 1 1 1 1 1 2 2 9 8 4 4 15 8 232 4 2 2 2 1 1 1 1 2 2 2 15 6 2 8 21 10 313 2 1 T 2 3 1 __V 1 1 1 2 16 7 6 6 23 12 35 ' !— !4 3 __2j 1 1 1 1 2 2 2 1 r 1 18 10 2 10 28 12 405 4 1 ij 1 1 1 1 1 1 2 2 1 17 7 2 12 24 14 38
_6 4 Ïl 4 3 1 1 2 2 2 1 2 17 4 2 14 21 16 377 4 4 3 3 1 1 4 4 2 2 1 2 11 9 10 a 20 18 388 3 2 2 2 3 1 1 1 2 2 1 2 16 12 10 12 28 22 509 2 2 1 2 2 3 1 1 1 1 1 1 2 20 10 14 8 30 22 52
10 4 2 1 3 1 1 1 1 1 1 2 1 2 23 9 8 14 32 22 5411 2 1 1 4 3 2 1 4 2 1 1 2 17 10 4 28 27 32 5912 4 4 1 2 1 1 1 4 2 1 1 2 18 4 20 14 22 34 58IS 3 3 1 2 2 1 1 1 2 1 1 2 18 10 12 24 28 36 6414 2 1 1 2 2 1 4 1 1 1 2 16 11 14 24 27 38 6515 4 3 1 1 1 1 1 4 1 1 1 2 9 6 24 16 15 40 5516 4 4 1 4 3 4 4 1 1 1 1 24 12 12 28 38 40 7617 4 2 1 3 3 1 1 1 2 1 1 2 28 12 18 24 40 42 8218 4 1 1 2 3 1 1 4 2 2 1 2 20 2 20 22 22 42 6419 4 4 3 3 1 1 1 2 1 1 2 12 5 20 22 17 42 5920 4 2 1 1 4 1 1 4 2 1 1 2 15 11 20 28 26 48 7421 3 1 1 4 1 1 2 3 2 2 1 ! 2 23 10 24 32 33 58 89
Mean i.it 2jas 2.143 ij#i 1.23# 2311 1337 131 1 1J§7 1734 #33# 1131 1733 234# 2#3# 3433Mode 4 1 1 2 3 1 1__ y___ 1_ 2 1__ V 2 1# 1# 2 # 2# 22 3#
~s s _ L iia -12S 1.03#-221L2±± 04#3 _1^ 0/471 049# 0L o^ L za 74#1 L2a 133# 173#

COMPREHENSIVE SURVEY AND ASSESSMENT RESULTS33
llnstnictor jSection t Sectionii | r "Mool A B Cl 02 03 04 D E F Q H K L M N 0 P__ Q R S A B 0 D E F O \L K L M
103 1 2 alt 4 1 1 __2 1 __ 1__1_ 1 __2 __4 __4 1 JL _2 J L J _ _2 U J L
|Stud«nt Survey & Test[Response Date Box Test Score |# A B C D E F O H 1 J K L M~ mi R2 m9* ms* •Ml •m 2 TMS
1 1 1 3 4 4 1 3 3 2 2 2 2 14 4 8 2 18 10 282 1 1 2 4 4 4 1 2 2 2 1 1 2 14 11 4 6 25 10 353 1 1 1 1 2 1 2 2 2 2 1 2 16 3 6 6 19 12 314 1 2 1 3 2 2 1 2 2 2 2 17 7 8 4 24 12 365 1 1 4 3 3 2 2 3 1 1 1 1 2 9 3 8 6 12 12 246 1 1 1 4 3 3 2 2 2 2 1 1 1 1 11 8 8 8 19 14 33 2 27 1 1 1 3 2 3 3 3 4 3 1 1 1 2 9 8 8 8 17 14 318 1 1 1 1 1 1 1 1 1 2 1 2 14 8 8 18 14 329 1 1 4 1 2 3 1 1 1 2 2 2 11 8 10 15 16 31
10 1 1 1 2 3 1 1 3 3 1 1 1 1 - J l __9 16 2 T o 18 4811 1 1 1 3 3 1 1 1 1 2 1 1 2 19 3 8 10 22 4012 1 1 1 1 1 1 1 2 2 2 1 1 2 10__5 12 8 15 20 3513 1 1 1 2 2 1 1 2 2 2 1 1 2 18 4 10 10 22 20 4214 1 1 1 1 1 1 1 3 3 2 2 1 2 18 10 6 14 28 20 4815 1 1 1 3 2 4 4 1 2 1 2 16 11 8 12IÆ. 20 4716 1 1 1 2 2 1 3 3 2 1 1 2 13 5 12 8 M 8 20 3817 1 1 1 2 2 1 1 1 1 2 1 1 2 6 4 6 16 12 22 3418 1 1 1 1 1 1 3 3 1 2 1 2 10 8 10 12 16 22 3819 1 1 1 1 1 1 1 1 1 2 1 1 2 11 7 12 12 18 24 4220 1 1 2 3 1 1 4 4 2 1 1 2 14 0 14 10 14 24 3821 1 1 1 2 2 1 1 4 4 2 2 1 11 7 8 16 18 24 4222 1 1 1 4 4 4 1 2 2 1 1 1 1 16 8 12 14 24 26 5023 1 1 1 3 2 1 1 2 1 2 1 1 1 14 10 16 12 24 28 5224 1 1 2 2 1 3 3 1 2 1 2 17 10 6 24 27 30 57 '25 1 1 4 4 3 1 3 3 1 2 1 18 7 12 18 25 30 5526 1 3 2 2 4 1 4 4 1 1 1 15 12
~10 22 27 32 59
27 1 4 1 1 1 1 3 3 2 1 1 2 12 16 18 19 5328 1 2 3 2 2 1 1 1 1 1 1 2 10 3 18 18 13 36 4929 1 1 1 3 3 1 3 3 1 2 2 14 7 10 26 21 36 5730 1 1 4 2 3 2 1 4 4 1 1 1 22 10 22 16 32 38 7031 1 1 3 __3 __2 1 2 4 4 1 2 1 __2 12 5 24 24 17 48 65
Meen 1 1 2.1*7 236* ISO* IS* 2S4* 2S*2 1S1* 1A1* 1.0*7 1S99 14 *ji* 104* 122* 20J2 22.71 4929Mode 1 1 1__ 2__ 9 1 1 9 9 2 1 1__ 2 __14__ 7 *__ *__ __20 91SD 0__ 0 oje* oj*i 1.0* 1.079 1.079 OS 04*9L22S 0S79 9574 2*17 J2SL • I* 1124

COMPREHENSIVE SURVEY AND ASSESSMENT RESULTS3 4
1 Instructor Section 1 [Sectionii 1School A B Cl 02 08 04 D E F 0 H K L M N o P Q R s A B O D E F O J K lT¥
4 3 3 7 21 17 3 4 1 1 1 1 1 1 11 2 2 1 __y 4 3 _4 lI __4_3 _3 _3 _3 _4 _4 J i—
1 Student Survey & Test '1 Response Date Box Test Score I« A B 0 D E F Q H 1 J K 1 L M mi m t m3» mso ëëêv 0M2
1 4 4 3 3 1 2 1 2 2 2 20 6 10 6 26 16 422 4 4 2 1 1 2 3 3 __g 1 1 2 11 6 4 12 17 16 333 2 2 2 2 1 1 1 1 1 2 2 2 13 4 10 6 17 16 334 3 3 1 3 2 1 1 1 2 2 1 2 22 8 12 8 30 20 505 2 2 1 3 3 1 1 1 1 2 1 2 11 12 8 12 23 20 43 !6 3 3 3 2 4 1 1 3 3 2 2 1 2 13 7 6 18 20 24 44 I—7 3 2 1 3 3 1 1 1 1 1 2 1 2 15 3 14 12 18 26 448 3 3 1 3 2 2 3 3 1 1 1 2 20 10 16 12 30 28 58 1__9 4 4 1 2 2 1 1 1 1 1 1 1 2 15 11 14 14 26 28 54
10 2 2 1 3 2 1 1 3 3 2 2 1 2 20 9 12 18 29 30 59 t11 4 4 3 4 4 4 3 3 2 2 1 1 27 11 18 14 38 32 7012 4 4 4 2 2 2 1 3 3 1 1 1 1 18 4 22 12 22 34 1 5613 2 2 1 2 3 3 1 3 3 2 2 2 14 5 20 16 19 3614 3 3 1 4 4 2 1 4 4 2 2 1 2 13 15 16 22 28 38 6615 4 4 2 3 4 2 1 2 2 1 2 1 2 21 9 22 16 30 38 6816 3 3 1 2 3 1 2 2 1 2 1 10 10 22 16 20 38 5817 3 3 2 3 3 1 1 1 2 2 1 2 21 5 20 20 26 40 6618 3 3 4 3 ~ 3 l 1 3 3 1 Î1 1 2 20 5 14 26 25 40 6519 3 2 1 4 4 2 V 3 4 2 “ T 1 2 21 8 20 22 29 42 7120 3 1 2 2 2 2 1 4 4 1 __^ 1 1 21 6 18 24 27 42 8921 3 3 2 2 3 1 1 1 1 1 2 15 7 24 18 22 42 6422 3 3 1 2 3 2 1 1 1 1 2 27 13 24 20 40 44 8423 4 4 4 3 3 1 1 1 1 2 1 2 9 9 14 30 18 44 6224 4 4 1 3 3 1 1 1 1 1 1 1 2 18 11 22 22 29 44 7325 2 1 2 4 3 1 4 4 1 1 1 1 19 8 20 26 27 46 7326 3 3 3 2 4 1 1 4 3 1 1 1 2 18 7 22 26 25 48 7327 3 3 2 3 2 1 1 1 1 1 1 2 21 12 26 22 33 48 8128 3 3 2 2 2 1 1 3 1 1 1 1 2 16 9 24 24 25 48 j 73 r —29 3 3 1 4 1 3 3 1 1 2 25 11 22 26 36 48 1—30 4 4 2 4 1 1 3 3 2 1 2 17 11 18 28 50 1 7831 3 1 2 4 1 4 4 4 1 1 1 1 28 18 24 46 5032 3 3 2 3 2 3 4 4 1 1 1 2 25 8 22 30 33 52 8533 4 3 3 3 2 3 3 1 1 1 2 24 15 24 28 39 52 9134 4 4 3 4 4 4 1 1 1 1 1 2 26 12 24 30 38 54 9235 2 2 2 3 2 1 4 4 2 1 1 2 22 15 24 30 37 54 9136 3 3 4 4 2 4 2 1 1 1 1 2 20 11 22 32 31 54 8537 3 1 1 4 2 1 4 4 2 1 1 2 23 15 24 32 38 56 9438 2 4 1 __4 1 4 2 1 1 1 1 1 14 14 24 32 28 56 8439 4 4 2 4 1 2 4 4 2 1 2 23 15 24 32 38 56 94 '40 2 2 2 4 2 4 2 1 1 1 1 2 28 20 24 32 48 56 10441 3 3 2 2 4 4 4 1 1 1 24 20 28 30 44 58 10242 4 4 4 4 2 4 1 1 1 1 1 1 28 19 26 32 47 58 105
Meen 311# 2S20 2 3073 3.000! 1.000 1020 247# 2.333 1201 1420 1.024 1020 1043 1033 10.14 2130 20.70 41 70.70Mode 3 3 2 __ ^ 3 1 1 3 1 1 1 1 2 20 11 24 32 30 40 73SO 0007 OJW JOSSO OOP 0.790 L a 1.10 1247 0400 0400 0.152 0.30 ______ 0311 4 3 0 3 5320 L a L a 12.40 L a

COMPREHENSIVE SURVEY AND ASSESSMENT RESULTS35
llnstmctorl Section 1 Section It |•chool A B Cl 02 03 04 0 E F Q H K L M N 0 P Q S A B 0 D E 0 J K k- M
5 4 1 6 4 2 4 alt 4 2 2 2 __^ __2 __2 __ __2 __2 __ 1__^ __3 3 JL ]2 J _ 3 a ]2 1 2 _±___ 1___ I___ ___ 1_1_
|Stud«nt Survey & Test I 1 L ~ j_ uResponse Data Box i Test Score |# A B 0 D i F O H Ï J K L w T mi mi m)# moo •Ml •m 2 T#W 1 ZxZ j_
1 4 1 1 1 2 1 1 1 1 2 2 1 1 18 7 2 6 25 8 33 12 1 1 1 1 1 1 1 1 Z 2 2 2 2 11 7 6 4 18 10 283 3 1 1 __1 1 1 1 1 1 2 2 1 2 14 2 8 4 16 12 284 3 1 1 1 1 1 2 2j 2 2 9 6 6 6 17 12 295 1 1 T Z3] 2 2 2 2 1 2 11 7 4 10 18 14 326 2 1 __^ 1 1 1 1 1 2 2 2 2 10 6 8 13 - i l 27 j___
7 1 1 3 1 1 2 2 2 2 1 2 7 12 6 10 19 356 1 1 1 1 1 1 1 2 2 1 2 13 6 6 Z M 19 18 379 4 T T 2 1 1 2 1 2 2 1 H 10 6 8 14 16 20 3 8
10 3 2 2 1 1 2 2 2 2 2 __2j 10 8 12 18 40 Zj11 1 f 4 3 1 3 4 4 1 V ZE 4 6 24 31 81 1
12 1 T 4 4 3 2 3 3 1 1 1 2 6 8 ~ l ï 20 32 46 1
13 2 2 f 3 4 1 1 4 3 1 1 1 1 4 "1 ? 18 38 5114 1 1 3 2 2 1 3 3 1 1 1 1 14 9 18 20 23 38 8115 __4 __ 3 T 2 __ 2 Z J __ 3 __ 3 __ 3 1 _ _ _ 1 ___1___ 2 14 15 18 32 29 50 7 9
Meen 1.407 1307 1J07 2 1.))> 1 3 3 ) 2.007 _____ 2 1.007 1.007 1307 _^ 123 7.007 0.007 133 1037 ^ 3 7 4100 _ _ 1 _ _ jMode 1 1 1 1 1 1 1 1 1 2 2 1 _____ 2 14 7 0 10 10 ____12 __s
SD 1304 0 = 0.07) 1.007 1 0 )3 0.000 0.471 0.471 0.442 - 2 1 3 3 )0 0.400 7 020 1230 J 4 3 0 z z z z

36COMPREHENSIVE SURVEY AND ASSESSMENT RESULTS
1 Instructor Section 1 Sectionii I nSchool A B Cl 02 03 04 D E o H > L _ ^ __ M N O P__ Q R s A B 0 0 E F Q J K r ] M
6 __ 4 ___1 ___4 __ 2 L _ i __ 2 2 __ 2 __ 2 3 3 2 _2 _2 _2 _2 _2 _3
1 Student Survey & Test |[Response Data Box] Test Score I# A B 0 D Ë F gT “ H I J __ K L w ~ mi mi mi6 m» tcci #6Cl
1 4 1 1 1 1 1 1 1 1 2 2 1 2 22 8 6 4 30 10 402 3 2 2 4 3 1 1 1 3 1 1 2 2 11 5 10 4 16 14 303 4 1 1 1 1 1 1 1 1 2 2 1 2 10 4 10 4 14 14 284 4 3 4 2 3 2 3 2 1 1 1 2 19 12 16 14 31 30 615 4 2 1 3 3 1 1 V 1 2 2 1 2 23 7 16 20 30 36 666 1 1 1 2 1 1 1 3 3 1 2 2 13 8 16 28 21 44 657 2 1 2 4 4 3 2 4 4 2 1
__1 12 22 30 20 52 72
8 4 3 4 4 4 3 4 3 3 1 1 2 12 22 32 37 54 91 19 4 3 1 4 3 1 4 1 1 1 2 2 8 26 30 27 56 83
10 __ 3 __ 1___ 2 __ 3 __ 4 __ 1 __ 3 __ 4 __ 2j__V__V __ 2 3 10 24 32 37 56 93Meen _« _IS_IS_« _^ __^ _2^ __2^__TV__w _M __IS H.1 __#2 16S lis 2iS 36S #2S !Mode ___4___ ___ ___4___3___ 1 1 1 1 1___2___^___2 __1# ___S 16 4 30 14 mmSO -122i 0J72 1.136 1.166 1.167 0.606JJ2L 1S21 _1S4£ 0.46 0 3 0.3 _6SJj 6SS7 11S4 7.772 17S6 72Â2

COMPREHENSIVE SURVEY AND ASSESSMENT RESULTS
37
[instnjctor SectionI ,___ iSectlonN ISchool A B Cl 02 03 04 D E F 0 H K L M N
___0 P Q R s A 0 0 E F" Q T K L I t1 7 4 2 15 3 1 13 4 1 1 1 ##* 1 __2 2 1__2 2 2 4 3 _3 _4 _2 _2 4 _3 _2 2
1IStudsnt Survey & Test L “1 Response Dsts Box [Test Score# A B C D E F 0 H 1 J K L M P11 Pit mo# PI 30 #0*1 #oc2 To m
1 2 1 1 3 1 1 1 1 4 1 1 1 2 14 4 4 4 18 8 262 1 1 1 1 1 1 2 3 3 2 2 2 9 7 8 2 16 10 263 1 3 4 3 3 1 1 1 1 1 2 11 7 _ 8 2 18 10 284 1 1 1 1 3 1 1 3 3 2 1 1 2 16 5 4 10 21 14 355 1 2 1 2 3 1 1 2 1 2 2 2 11 2 _ 6 i 8 13 14 276 2 2 1 1 2 2 2 2 1 ____2j 2 14 7 4 12 21 16 3771 4 1 2 2 2 1 1 2 2 2 2 1 2 14 7 8 10 21 18 398 4 1 1 1 4 ____ 1 3 4 4 2 2 2 24 10 12 8 34 20 549 4 4 4 I 3 4 2 3 3 1 1 2 14 7 10 10 21 20 41
10 1 3 4 4 2 Î" 1 3 3 2 1 1 2 11 6 8 12 17 20 3711 1 1 1 2 2 1 3 2 2 _ 2 ! 1 2 8 9 8 14 17 22 3912 1 1 1 1 1 ____ V 1 2 2 2 2 1 2 11 4 14 8 15 22 3713 1 1 1 2 2 2 1 1 1 1 1 2 18 9 10 14 25 24 4914 3 3 2 4 4 3 4 4 1 1 1 1 8 13 16 8 19 24 4315 4 3 2 4 4 3 1 1 1 1 1 1 2 14 8 6 18 22 24 4616 4 1 2 4 2 3 2 3 3 2 2 1 2 11 9 6 20 20 26 4617 4 3 1 2 2 1 1 2 2 2 2 1 2 12 4 16 10 16 26 4218 4 4 2 3 3 2 1 1 1 ____ I j 1 2 26 10 22 4 36 26 6219 4 3 1 3 3 3 3 3 1 1 2 14 8 14 12 22 26 48 —20 2 2 1 3 2 1 1 4 4 2 1 1 2 10 5 18 10 15 28 4321 1 1 4 1 3 1 1 2 1 2 1 2 15 11 18 10 26 28 54 '22 4 4 3 3 1 3 2 2 2 1 2 17 5 4 24 22 28 5023 41 4 4 3 4 1 1 1 1 1 1 2 12 12 24 10 24 34 5824 1 1 1 3 3 1 3 3 1 2 1 2 12 12 26 12 24 38 6225 4 4 2 4 4 1 1 2 2 1 2 19 7 16 22 26 38 6426 1 1 1 4 4 1 4 4 3 1 1 1 2 28 12 24 24 40 48 8827 1 1 1 2 __1 1 2 3 3 1 1 1 2 18 9 20 30 27 50 77 z j z28 4 4 2 3 4 3 2 3 3 2 2 1 2 9 8 24 26 17 SO 67 — —!
Mesn 2.4041 2.170 1003 2071 2.714 10 1070 2003 2000 1 0 1.043 1 1003 14.14 7.76 12.70 1204 2100 2043 4732Mode 1 1 1 3 3 1 1 3 3 1 2 1 2 14 7 0 10 21 20 37 — 'SO -liSL 1220 1.178 1.06 L a 0034 1.047 0906 0 0 0>*70 __ 2J 0.100 5070 2.70 J L E Ü 7.132 Lsii 1107 1406 z z z

3 8COMPREHENSIVE SURVEY AND ASSESSMENT RESULTS
[instructor jSection 1 Section M 1Sctml A B C1 C2 C3 C4 D E F Q H K lT“ M N 0 P Q R s A B C D r F 0 J K L M
106 13 1 1 4 1__1__3 __1__[ 2 __2 __4 __4 __2 _3 __4 4 _4 L I__ __ __
1 Student Survey & Test |iResponse I Data Box Test Score I# A B C D E F 0 H 1 J K L ~ w z m i mi m* mm •Ml • ü L
1 1 1 1 1 1 1 2 3 3 2 2 2 16 6~
4 2 22 6 " l82 1 1 1 1 1 1 1 1 1 2 1 ~ 2 15 4 6 22 10 323 1 1 ____ ^ 3 _ 2 T 2 3 3 1 2 1 2 19 4 10 6 23 16 394 3 2 3 3 1 2 3 1 1 1 1 1 1 18 8 14 12 26 28 525 1 1 T 3 __3 1 1 1 1 1 2 1 2 18 7 16 14 25 30 556 4 4 4 4 1 __1_ 1 1 2 1 1 1 23 9 16 18 32 34 867 1 1 1 3 1 3 3 2 1 1 2 24 9 12 33 34 678 1 1 1 4 1 T 2 1 1 1 1 2 25 14 14 22 38 759 1 1 1 4 1 ____ 1 1 1 1 1 1 _ 2 19 14 20 22 42 75
10 1 1 1 4 1 1 1 1 1 1 2 19 6 18 28 25 44 8911 1 1 1 3 3 1 T 3 3 2 1 2 19 7 20 28 28 48 7412 1 1 4 3 2 1 1 3 3 1 T ____1 2 26 11 22 26 37 48 8513 __1__ ^ __4 __4 __3 __ 1 ____ 1 __3 __3 __1___ i_ 2 21 6 2 2 30 27 52 79
I j * 1 jO# 1.7» ».077 2J29 1 1.01» 2.194 1J29 1.90» I j * 1Ü77 1 * 9 20.1» » j * 14.77 2»4# 9277 # 1 *__ 1 1 __ ^ 9 ____ 4 _____1_____]_____ 9 1 1 1 __ 1|____ 2 __« __ » ____ 4 22 22 94 ___ g j
ISO 1 0J23 0J21 1.071 ____ 0 0J29 0402 04#7 O j* 0j79 937» 2 * » ».7W » * 9472 1432 17.7»

COMPREHENSIVE SURVEY AND ASSESSMENT RESULTS39
1 Instructor Section 1 Section W I r "School A B Cl 02 03 04 D E F O H K L M 0 JP__ Q R s A B 0 D 1 “ f“ w J K L M
206 1 2 35 4 1 1 1 3 1 1__2 __2 4 4 2 j4 j4 _± 1_3 _4 _3 J _
IStudont Survey & Test i___IResponse Data Box! Test Score I# A B C D E F O H 1 J K L M M l M2 M3» MSO 0#el Owl T«M
1 1 1 1 2 4 1 2 2 2 2 1 2 13 6 6 __8j 19 12 312 1 1 4 3 3 1 1 1 2 1 2 18 10 10 6 28 16 443 1 4 1 1 3 3 3 18 7 2 14 25 18 414 1 2 2 2 1 1 1 1 2 1 1 2 22 4 10 6 26 16 425 1 1 3 2 __Z 3 2 2 1 2 18 4 6 22 18 406 1 1 1 1 11 1 1 1 2 2 8 3 14 6 11 20 317 1 1 1 1 1 1 1 1 2 1 1 2 18 5 8 12 23 20 438 1 1 1 1 1 2 3 2 1 2 14 3 6 141 17 20 37 —I9 1 2 3 __2j 1 1 3 2 2 8 6 10 12 14 22 36
10 1 2 2 2 2 1 1 2 1 2 16 8 12 14 24 28 5011 _ L 1 3 1 1 1 1 1 2 1 2| 22 4 20 8 26 28 5412 1 2 3 2 1 3 3 2 1 2 21 8 22 8 29 30 5913 1 1 1 1 4 3 4 1 1 1 2 12 4 20 __10i 16 30 4614 1 1 2 2 3 4 4 1 1 2 15 8 14 18 23 32 55 —115 1 ll 3 3 1 3 3 3 1 1 1 1 22 6 16 16 28 32 60 n16 1 2 2 2 1 2 1 2 1 2 16 10 22 12 26 34 60 —!17 1 3 1 1 2 1 1 2 22 11 22 12 33 34 6716 1 4 2 2 1 1 3 3 2 1 1 2 20 9 12 22 29 34 63 d19 1 1 3 3 2 1 4 J 1 1 2 18 8 6 32 26 38 84 —I20 1 1 2 3 2 1 4 1 1 1 __V 2 14 8 12 28 22 40 62
121 1 1 2 2 4 3 4 1 1 1 25 8 18 22 33 40 7322 1 1 2 2 2 1 4 4 1 1 2 22 10 14 26 32 40 72 z j23 1 1 4 4 4 4 3 2 1 1 1 2 21 9 22 24 30 46 7624 1 2 4 1 2 3 3 1 2 26 7 22 26 33 48 81 '25 1 1 3 2 2 3 3 1 1 12 9 24 24 21 48 6926 1 1 1 3 1 1 4 4 1 1 2 24 7 22 28 31 SO 8127 1 1 4 1 4 4 4 1 1 2 26 8 22 28 34 50 8426 1 1 4 1 3 4 S 1 2 20 9 22 32 29 54 8329 1 — 1 1 4 2 3 4 4 2 26 15 22 32 41 54 9530 1 l' 1 2 1 4 4 __± 1 1 2 17 8 24 32 25 56 81
Mesn 1 1.033 1J87 2J17 2.333 1233 2.233 2 607 _^ 1.403 131 1.034 1007 1047 74 164 10.07 2037 3347 6033Mode 1 1 1 2 2 1 1 3 __ 1 1 2 10 0 23 12 20 10 01SD -L2Î 1071 1011 0 4 M 1.23 1.174 —J21 0^403 0.102 0300 4011 2 30 0.600 0322 0307 1230 1740

4 0COMPREHENSIVE SURVEY AND ASSESSMENT RESULTS
ilnstructor [Section 11 Section M |Uchoal A B Cl 02 03 04 D E F Q H K L M N 0 P Q R s A B 0 D E F 0 J K L M
306 2 2 20 2 4 1 1 1 __2 __1 __1 __2 __2 __4 __4 _3 _4 J l _3 _4 _3 _2 _1
Istudent Survey & TestIResponse Data Box] Test Score |# A B 0 D E F O H 1 J K I •T“ mi ma ma# ma* *#cl *##a T#W
1 3 1 1__2 2 1 1 2 2 1__1 1 2 17 4 2“ 4 21 8 272 2 4 1 1 1 1 1 1 1 1__2 1 1 10 5 2 4 15 8 213 2 4 1 3 2 1 1 1 1 2 1 1 2 11 5 8 10 16 18 344 2 2 1 3 2 1 1 1 1 2 2 __1 2 13 6 8 12 21 20 415 2 1 __1 1 1 2 _ L 1 1 1 2 ___ j 13 3 10 24 406 2 1 1 1 1 2 3 2 1 T 2 14 1 6 -J 4 15 247 2 2 3 3 1 1 1 1 2 1 2 11 24 29 328 2 Z 4 3 1 3 3 2 2 1 1 Z 21 7 □ I z #9 2 2 4 4 1 1 4 4 1 2 1 __11 11 8 10 30 19 40 59
10 2 2 r 4 4 2 1 4 4 1 2 1 2 16 11 "l6i 24 27 40 6711 2 2 1 4 3 3 3 1 3 1 2 1 2 24 10 18 22 34 40 7412 2 2 1 4 3 1 1 3 1 2 2 1 2 15 3 22 20 18 42 6013 2 2 1 4 3 2 1 4 4 1 1 1 1 15 11 22 24 26 46 7214 2 2__1 3 3 1 2 3 3 2 2__1 2 16 10 22 26 26 48 7415 2 2 3 3 2 1 4 4 1 1 2 21 11 22 26 32 48 8016 2 2 3 3 3 1 3 3 1 2 T 2 15 10 24 26 25 50 7517 2 2 T 4 3 1 1 3 3 2 2 1 2 13 6 26 24 19 50 6918 2 2 1 3 3 1 4 3 3 1 1 1 2 20 10 22 30 30 52 8219 2 4 1 3 3 2 4 4 4 1 2 1 2 26 16 22 32 42 54 9620 2 2 4 4 4 2 2 4 4 1 1 1 2 21 9 22 32 30 54 84
__21 2 __2 __1 4 __4 __1 1 3 __3 1 1 ____ 1__2 21 10 24 32 31 56 87ZjM 2.143 iJti 3.143 2732 1.429 1.887 2.887 2571 1533 1.671 1.048 1587 18.71 8048 1857 2058 24.78 3752
2 _____2 __ _____4 _____ 3 _____ 1 1 _____ 3 _____ _____1_____ 2 _____1_____2 __M__^__a __24 __a _40 _uISO 0S4 0.821 0.88 0 8*2 JL22S 1.178 0.471 0.486 0213 _3512 JJSL 18.13

COMPREHENSIVE SURVEY AND ASSESSMENT RESULTS4 1
ilnstructor ISectionii Sectionii IIsctwQi A B Cl 02 03 04 D E F 0 H K L M N 0 P Q R s A B 0 D E f 0 J K L M
9 __4 __ 1 __2 __4 __3 __3 __2 __2 2 __1__4 __^ 1__ 1___2 __1__1__2 __1___1 __4 2 _2 _2 l 2 _1
(student Survey & Test j r ~Response 1l ZZ Data Box Test Score |# A B 0 d H E F O H 1 J K L w T Ml M2 M9# M» #—1 #-2
1 4 3 2 3 1 3 4 3 2 2 1 1 12 3 6 _J2 15 18 332 2 2 4 3 3 3 1 3 3 2 1 1 2 10 6 10 12 16 383 4 4 4 2 1 2 1 1 1 2 1 1 2 -J5 9 12 14 - J t 26 504 3 3 1 1 1 1 2 1 2 1 2 1 2 12 _ z 6 22 19 28 475 1 1 1 1 1 1 1 1 2 1 2 1 2 14 18 _14 32 506 1 1 1 4 4 2 4 2 2 1 1 1 1 16 10 22 16 28 38 867 2 1 1 4 3 1 4 4 4 1 1 1 1 24 15 12 28 39 40 798 2 2 3 2 2 2 1 2 2 2 1 1 2 12 10 26 14 22 40 629 4 2 1 4 4 3 3 4 4 1 1 1 2 28 12 22 26 40 46
10 __3 __3 __1 __4 __3 __1 __ 1 __4 4 __1 __1 __1 __1 20 __6 24 32 26 56 82Mean _^ _T2 __^ _« _« _^ _ll _n 2.7_w_w 1 1# i#a_•£ H4 1#4 24.7 MSMode __ 4 __ 3 1 4 __ s 1 1 4 __ 2 1 1 1__ 2 __12 __ # __ # __12 _— —SD JLllL -IHl 11 — 111# 07»^ -121 1 j#1 -L22i 0.4— 0 04# #72# 3J2# 7102 #41# J M 2

4 2COMPREHENSIVE SURVEY AND ASSESSMENT RESULTS
linstnictor 1Section 11 ..... 'T Section W |«dM A C1 C2 C3 C4 0 E F 0 H K L M N 0 P Q R s A B C D E F 0 J K L M
110 1 3 32 4 2 4 2 1 2 2 __1 __1 __1 __1 __1 __1 2 3 4 3 _4 _4 J . _3 _4 J# _4 _3 _2
Istudent Survey & Test1 Response I Data Box Test Score |# A B C D E F Q H I J K L M mi mt mtrn m* •Ml •Mt T«M
1 1 1 1 1 1 1 1 2 1 1 2 1 2 12 6 6 4 18 10 282 1 1 1 3 3 1 1 1 1 1 1 2 11 4 8 6 15 12 273 2 2 2 2 1 1 1 2 1 2 12 9 6 8 21 14 354 1 1 1 2 3 1 1 1 2 1 2 11 4 8 6 15 14 295 1 1 1 1p T 1 1 2 2 13 6 8 6 19 14 336 1 1 4 1 1 1 2 1 1 1 1 1 2 14 13 8 8 27 16 437 1 1 2 1 1 1 3 3 2 1 1 20 8 2 18 28 20 488 1 1 2 3 3 1 1 1 1 2 ___ 1 2 23 5 4 18 28 22 509 1 1 1 3 4 1 1 1 2 2 20 2 10 12 22 22 44
10 1 1 4 2 2 1 1 1 1 1 T 2 13 6 14 10 19 24 4311 1 4 3 3 1 1 1 1 2 1 2 13 _L 16 8 20 24 4412 1 1 1 2 2 1 1 1 1 1 1 1 2 9 8 10 18 17 26 4313 1 1 1 2 2 1 1 2 4 1 1 1 2 12 5 18 12 17 30 4714 1 2 2 2 1 2 3 2 1 1 1 2 25 12 18 34 30 6415 1 1 2 2 1 1 2 1 1 1 2 1 2 18 12 18 28 30 5816 1 1 2 3 1 2 1 1 1 1 1 2 10 8 24 14 32 4617 1 1 1 2 2 1 1 3 1 1 2 1 2 13 8 16 18 21 34 5518 1 1 1 2 2 1 1 3 3 1 2 1 2 20 7 12 24 27 36 6319 1 1 1 2 2 1 3 3 3 1 1 1 2 17 3 16 24 20 40 8020 1 1 3 3 1 1 4 4 1 2 __1 2 14 12 18 24 26 42 6821 1 1 1 3 2 1 1 2 2 2 2 17 6 24 22 23 46 8922 1 2 4 4 3 1 1 1 1 T 2 21 5 22 24 26 46 7223 1 1 1 4 4 1 1__1 1 1 1 2 16 7 16 30 23 46 6924 1 1 2 4 4 2 1 1 Ï 2 21 10 24 24 31 48 7925 1 4 3 3 1 2 1 2 1 2 22 12 22 28 34 50 8426 1 1 3 4 4 1 3 1 2 1 2 25 18 24 28 43 52 9527 1 1 4 4 3 1 4 1 1 1 2 26 14 20 32 40 52 9228 1 2 3 3 3 1 2 1 1 1 2 20 13 24 32 33 58 8929 1 1 3 3 3 3 __4 1 __1 ___ 1__2 21 9 32 30 58 88
Mesn 1^1 1414 1*1 2 * 2 2417 1 * 7 1 * 2.172 2.1* 1 * 7 1417 1.1* 1 0 * 7491 1441 1041 94.70 9 2 * 0741Mode 1 1 1 2 9 __ [ __ ^ 1 1 1 ____ 2 ____ 1 2 ___ 19 • ____# ___* ___* ___ 14 ___*SD 0 J » 0.7* _ 0 * 4 0 * 0414 1*1 1422 0 4 * 04 0 4 * 0.1* 4404 JSL 1441 J O *

4 3COMPREHENSIVE SURVEY AND ASSESSMENT RESULTS
llnstmctor ISection! 1 Sectionii ISchool A B Cl 02 03 04 D E F Q H K L M N 0 P Q R S A B 0 D E F Q J K L M
210 __2 ___ 1 14 __2 __4 __2 1__2 __2 ___ ^ ___ ^ ____^ ___ 1 ___ 1 ___ 2 ___ 3 ___ 4 ___ 3 _ 4 j4 _4 _4 _4 _3___
|S tud«nt Survey & Test J L ~ ~ L ~IResponse 1 Dete Box Test Score |# A B 0 0 1 F 0 ~ H 1 J K L ÜT" m i m i mso mso Owl owl ToM 1___
1 2 1__3 2 1 2 1 1 1 1 2 16 9 4 10 25 14 392 3 y 2 2 ___ 1 1 1 1 2 2 f Z g 11 2 14 8 13 22 353 2 2 1 1 1 2 4 2 1 14 6 12 12 20 24 444 2 2 2 2 1 1 1 1 1 1 3 1 9 12 14 26 525 2 1 T 2 2 1 1 1 1 1 2 1 2 16 11 8 20 27 26 556 2 1 ____1 1 1 1 1 1 1 1 ___ 1 2 17 7 3 1 12 24 30 5471 2 2 4 4 T 3 2 1 1 1 1 _26 11 3 ^ 18 37 34 71 —I8 2 2 r 2 3 1 1 1 1 1 2 T 2 15 28 22 44 689 2 2 1 4 4 1 2 3 3 2 1 1 2 15 11 20 26 48 ZM10 2 2 4 2 1 2 3 3 1 1 1 2 17 13 24 24 30 48 78
11 2 ___ 2 1 3 3 ___ 1 ___ 1 ___ 3 3 ___ 2 ~ 2 ___ 1 ___ 1 22 12 24 34 50 84Meen 2.001 iJ i i 1727 2273 2273 1-102 1204 1 727 1J10 ___12 1400 ____ 1 1.727 10J1 0200 1027 10.10 2022 3340 •027Mode ____ 2 ____ 2 ____ 1 ____ 2 ____ 2 ____ 1 ____ ^____ ^ 1 ____ ^____ 1 1 ____2 17 ___ 11 ___ 12 12 ___n ___W fNM
1S D _ 0J7O -L2E 0.002 -L22 0.648 JLHÎ 0400 0 3200 •020 3 E jmo 11.7 J Ü

44COMPREHENSIVE SURVEY AND ASSESSMENT RESULTS
1 instructor 1Ssctionll " I"— r— r ”T Section II ISchool A B Cl 02 03 04 D E F 0 H K L M N 0 P Q R s A B 0 D E F 0 J K L M
310 3 3 2 14 24 4 2 1 2 2 __^ __1 __^ __^ __ __^ 2 __3 __4 3 _4 _4 __4‘ _4‘_4 _4
StudofIt Survcy < ItResDonso 1 DataBoxI TastScora |» A B 0 D E F 0 H 1 J K L M mi m2 m3» ma •M l •M l Tow
1 3 3 1 3 2 2 2 1 1 1 2 2 11 8 8 8 19 18 352 3 3 1 3 2 1 1 1 1 1 1 2 12 7 6 14 19 393 4 4 1 2 3 2 1 1 1 2 2 2 17 7 10 14 24 24 484 2 2 2 3 3 1 1 4 1 2 20 4 10 14 24 24 485 3 3 2 4 3 3 1 3 3 1 2 21 8 8 18 29 26 55 i6 3 3 1 1 1 1 1 2 2 2 2 18 10 20 10 26 30 56 z7 4 4 1 2 2 4 1 1 1 2 2 18 8 14 18 24 32 56 _8 3 3 2 3 3 1 4 1 1 1 2 14 6 10 __22 20 32 52 ZJ9 4 1 3 2 3 1 3 3 1 2 16 10 10 26 34
10 1 1 2 3 1 2 1 2 1 2 1 9 7 20 14 16 34 5011 4 1 3 3 1 2 1 1 15 11 14 24 26 38 6412 2 1 2 3 1 1 1 1 2 2 28 18 24 14 46 38 8413 3 3 3 3 3 1 4 4 1 2 15 9 12 28 24 40 6414 1 1 1 1 1 1 1 1 2 2 8 9 16 24 17 40 5715 1 1 2 2 1 1 1 1 2 1 18 13 14 28 31 42 7316 4 2 4 4 3 4 4 4 1 2 28 9 20 37 44 _8117 4 1 3 2 1 4 1 1 1 2 21 5 20 28 26 48 7418 3 3 2 3 3 1 1 3 3 2 2 26 15 20 41 48 8919 4 3 3 4 4 3 2 4 4 1 2 13 13 18 32 __26 50 7620 3 2 1 4 4 1 3 1 1 1 2 24 20 18 32 44 50 9421 3 4 4 3 1 4 1 1 1 1 2 20 7 22 28 27 50 7722 2 2 2 2 2 4 2 2 2 1 2 19 19 22 28 38 50 8823 3 1 1 3 4 1 4 4 4 1 2 24 8 24 28 32 52 8424 4 1 3 3 1 1 2 1 1 1 14 8 20 32 20 52 "7225 2 2 4 3 1 2 4 4 1 1 17 7 22 32 24 54 7826 4 1 2 3 2 1 2 2 2 1 15 6 24 30 21 54 7527 3 2 4 4 1 3 1 1 1 2 28 19 26 30 47 56 10328 3 1 3 3 2 1 3 3 1 2 22 9 24 32 31 56 8729 2 1 4 4 1 4 4 4 1 2 24 10 24 32 34 56 9030 2 1 4 4 1 4 4 4 1 2 27 11 24 32 38 56 94
__ 31 3 1 1 3 __3 __2■__4 __3 3 1 2 2 28 14 24 32 42 56 983410 2.742 1.4M 2403 2400 1.774__ 2 Z2201 2.220 1.207 u 1 1007 1007 1003 17.001 2402 _» _« 71
4 3 1 3_3_1_i_1 1 1 1 1_2 _a __7 _M_» _M_so_WISO 0.010 0.707L s j s i 0400 JL22! -liS» 1.203 0.442 0.400 0;_o^ 5.700 ■ 740 0.073 JIB 1700

4 5
COMPREHENSIVE SURVEY AND ASSESSMENT RESULTS
llnstnjctor 1Section 11— r— r r ' 1 ...... Section H IScfMl h B Cl 02 03 04 0 E F 0 H K L M N 0 |p R s A B 0 D E 'F 0 J K L a
111 4 2 9 12 9 4 2 1 1 1 1 2 2 __1 2 2 __1 __4 4 2 _3'_3 JL _2 _3 _2 _21
StudefIt Su rv e v & Test 1iRMPOfflM 1 Data Box Teat Score |« A B 0 D E F O H 1 J K L nT ” M l M t 1M3m MSO Oaci OKI T«M
1 1 1 1 1 1 1 2 2 2 9 8 8 4 15 10 252 2 1 2 3 1 1 2 2 2 ___ 16 11 10 4 27 14 413 2 — 2 r i 3 1 2 1 2 2 Z J 20 5 8 10 25 18 41 224 2 4 2 3 1 2 2 U_1 1 2 18 9 16 4 25 20 45 _5 3 1 3 2 2 1 2 2 __2 2 19 10 8 14 29 51 □ zzz_ _6 2 1 1 2 1 2 2 2 2 9 8 12 10 17 39 17 1 4 3 3 4 3 1 1 18 8 14 24 28 508 2 T 3 4 3 4 4 1 2 23 15 20 18 38 38 78 !9 1 1 3 2 2 2 2 1 1 19 10 10 18 29 28 57
10 2 1 2 “ 2 1 3 3 1 1 10 7 16 12 17 28 4511 3 1 3 1 3 1 1 1 2 18 _ 5 14 18 21 30 5112 1 1 2 2 1 1 1 2 2 13 5 6 24 18 30 4813 , 1 1 2 2 1 1 1 1 2 18 7 14 2514 .. 4 1 3 2 1 3 3 2 2 17 11 24 8 28 32 6015 2 2 3 3 4 2 2 1 2 20 12 24 14 32 38 7016 3 2 2 2 3 4 4 2 2 13 8 22 18 21 40 6117 3 4 3 3 2 4 4 1 1 18 8 18 22 26 40 6618 1 2 4 3 3 3 3 1 1 24 11 20 24 35 44 7919 1 1 4 4 3 3 2 1 2 24 10 20 24 34 44 7820 2 1 4 3 1 4 4 1 2 17 9 _20 26 26 46 7221 1 3 3 3 3 1 3 3 1 2 17 13 24 24 30 48 7822 2 2 3 4 2 3 1 1 1 2 25 11 18 30 36 48 8423 3 2 2 3 4 2 4 3 2 1 2 24 16 24 26 40 50 9024 3 4 3 4 4 1 4 1 1 1 2 21 14 24 30 36 54 8925 __2 __1 __1 __3 __3___ 1 4■__4 4 __ I ■__2 28 11 24 32 39 56 95
MMn ____ 21 1J62 2.72 2M1 1.32! 2.32 2.381 2.32 1.20 134 1.04 _u 1038 80 18.88 17.81 Z788 34.18i 8134Mode ____ 21 1 1___3____ 2! 1_____ 1 1 2 1 1 1___a 18 11 __M 14 28 __X 1 41SD 0J17 0.802l| 0J7iLïmIjjâ1 1.005 0448 04271±1= 4002 8.104 8317 7.082 1207 - I Î 2

4 6COMPREHENSIVE SURVEY AND ASSESSMENT RESULTS
llnstructor [SectlonI 1 T Sect#on IISchool k B C1 02 03 04 D E F Q H K L M N 0 P Q R S A B C D E_ F 0 J K L M
211 3 3 0 — 5 17 15 4 2 1 1 1 __1 1 2 __1 __2 2 __I 4 __4 3 _4 _4 j4 _3
Studsrit Swrvey 1&TeiItIRssponse DataBoxI Test Score I# A 8 C D E F 0 H 1 J K L M Ml Ml M9a M90 Owl Owl Twe
1 3 3 4 2 2 3 4 1 1 2 2 23 11 14 12 34 26 802 2 2 3 2 2 2 1 2 2 1 2 12 5 12 18 17 30 473 4 4 4 3 2 1 1 1 2 2 15 8 14 16 23 30 534 2 2 1 1 1 1 1 3 3 1 Z I Î . 2 23 9 12 18 32 30 625 3 3 1 2 3 3 1 3 3 1 i1 2 22 10 12 18 32 U30 62 _6 2 2 4 3 2 1 1 1 1 1 2 16 7 10 23 55 z Z H7 4 4 1 1 2 1 1 1 1 2 2 19 9 18 14 28 32 60 !& 4 4 4 3 2 3 1 1 1 1 2 21 10 16 22 31 38 699 2 “ 2 2 3 2 3 1 3 3 1 2 28 9 24 16 37 40 77
10 4 4 1 3 3 1 1 1 1 2 2 23 5 20 20 26 40 6811 3 3 1 3 1 1 1 1 1 1 2 19 9 18 24 28 42 7012 3 3 2 3 3 1 1 2 2 2 1 13 8 22 22 21 44 6513 4 4 1 4 2 1 1 3 3 2 2 16 9 20 26 27 46 7314 4 4 4 3 3 1 1 3 3 __2 2 16 10 26 48 7415 2 2 2 3 3 2 3 3 2 24 16 18 30 40 46 8816 4 4 1 2 4 3 4 4 2 28 10 24 30 38 54 9217 2 2 4 3 4 1 3 3 1 27 13 22 28 40 50 9018 4 4 4 4 4 1 1 1 2 26 20 24 28 48 52 10019 4 2 3 3 4 3 4 3 2 17 4 22 30 21 52 7320 3 2 3 3 3 3 3 3 2 15 9 20 32 24 52 7621 3 3 4 4 4 3 3 3 2 27 9 22 32 36 54 9022 4 4 3 3 2 3 4 4 2 20 18 24 30 38 54 9223 3 3 2 4 4 1 4 4 1 28 17 24 32 45 56 10124 __3 3 __ 4 4 __3 4 3 4 4 1 22 13 24 32 35 56 91
Mean 9.107 9iM2: 2.028, 2J7B 2.700 1060 2.107 2.460 2.417 10001 1.202 1009 1099 __« 10.99 1900 a o o 9109 49.17 740Mode ____ 4 4 ____ 4 9 2 1 1 9 9 1 1 1 2 a 9 __a 90 90 90SD _0700 0J41 1.252 0092 0.094 1.02 1.404 1.154 1.115 0.406 0.455 0.276 0.979EZZ 4807 9955 4 .1a _6£ 9Li£ JL2!LÜ2Î

COMPREHENSIVE SURVEY AND ASSESSMENT RESULTS4 7
[Instnjctor iScction 11...-T mmm— S#cSon NA B Cl 02 C3 04 D E F O H K L M N 0 p R s A B_C_ 0_ E F_ 0_ K L M
311 1 2 30 4 2 1 1 1 1 1 2 _ _ _ 1 _ _ 1 2 _ _ _ 1 __4 __4 1 _2
Stud##it SurveyiITe*t 1IR#spons# ] DmtmBoK T#st Scot# |# A 8 0 D E F O H 1 J K L M mi m t m u m m • m l • M t
1 1 1 3 1 1 1 1 2 2 2 13 8 0 8 21 8 292 2 1 1 2 _ l J 3 3 1 2 2 ~| 12 4 I__4 10 16 14 30 z3 1 2 2 1 4 4 1 1 1 2 18 5 8 6 23 14 37 Z4 _ _ _ 2 3 3 1 1 3 3 2 2 2 12 8 6 8 18 14 32 r _ _5 1 2 1 1 1 1 1 2 2 2 9 5 8 8 14 16 30 z ]6 1 3 3 1 1 3 3 1 1 2 13 f 8 8 20 16 38 17 1 3 3 1 3 2 2 1 2 2 12 11 12 8 20 438 1 2 2 1 1 1 1 2 2 2 10 8 12 10 18 22 409 4 " 3 4 2 1 3 3 _ _ _ 1 __2 2 15 12 14 12 27 26 53
10 4 3 3 1 1 2 2 12 5 18 12 17 30 4711 1 3 3 1 3 2 2 2 2 2 15 8 14 16 23 30 5312 1 2 2 1 2 2 2 2 2 2 21 12 16 14 33 30 8313 1 4 4 1 1 2 2 2 1 2 12 14 16 18 26 32 5814 1 3 2 1 1 3 3 1 1 2 21 7 16 16 28 32 6015 1 3 3 1 4 3 3 1 1 2 10 9 10 _J9 32 5116 3 4 4 1 3 4 3 2 1 2 23 13 12 22 36 34 7017 1 4 4 2 3 1 1 1 2 2 15 9 22 16 24 38 8218 3 4 4 2 4 2 2 1 1 2 22 7 18 24 29 40 6919 3 4 4 1 4 1 1 1 1 2 20 11 18 22 31 40 7120 3 4 4 3 4 1 1 1 2 2 26 14 22 22 40 44 8421 1 3 3 1 1 3 3 2 2 2 16 9 18 30 25 48 7322 2 3 2 1 1 1 1 2 1 1 21 7 20 28 28 48 7823 3 4 4 2 3 2 2 2 1 2 28 17 24 26 45 50 9524 __1 __4 4 __1 3 3 3 1 1 2 23 7 28 30 52 8225 3 3 _ _ _ 1 _ _ _ 1[ 1 17 24 30 43 54 97
M##n 1 1 1.712 _ _ _ s ) 1312 2 3 234 2.042 1.401 u 1.042 1.117 17 131 143# 114 2131 >131 1734
Mod# 1 1 _____ 1 ) 4 _____ 1 1 a1 ) _____ 1 _____ 2 1 2 _____12 7 ____ 11 __ I _ _ » ____14 30
SD 0 1.04 0.11) 0.107 L lS2L is 0.141 _ 0 3 L o 3 0371 JSi 1.471 7.777 1.117 1 )3 )UÎSL

COMPREHENSIVE INSTRUCTOR SURVEY RESULTS
Instructor Seelton 1 Sect on 1School A B Cl 02 03 04 D E F G H K L M N 0 P Q R S A 8 0 D E F G J K L M
1 1 3 2.5 4 1 1 1 1 1 2 4 4 3 3 3 3 2 2 3 3 3 3 2
2 4 2 0 4 6 15 4 2 3 3 2 2 2 2 4 4 2 1 3 2 1 2 1 1 1
103 1 2 2.5 4 1 1 2 1 1 1 1 2 4 4 1 1 2 2 1 1 2 2 1 1 1
4 3 3 7 21 17 3 4 1 1 1 1 1 1 1 2 2 1 3 4 3 4 4 4 3 3 3 3 4 45 4 1 6 4 2 4 2.5 4 2 2 1 2 2 1 2 2 1 1 3 3 1 2 1 3 1 2 1 2 1 1
6 4 1 4 2 1 2 2 2 3 3 2 2 1 2 2 2 2 3 2 2 17 4 2 15 3 1 13 4 1 1 1 3 1 1 2 2 1 2 2 2 4 3 3 3 4 2 2 3 4 3 2
108 1 1 13 1 1 4 1 1 1 3 1 1 2 2 4 4 2 3 4 4 1 1 3 4 3 2 1208 1 2 35 4 1 1 1 3 1 1 2 2 4 4 2 3 4 4 1 1 3 4 3 1 1308 2 2 20 2 4 1 1 1 2 1 1 2 2 4 4 2 3 4 4 1 1 3 4 3 2 1
9 4 1 2 4 3 3 2 1 4 1 1 2 1 1 2 1 1 4 2 2 2 2 1 1 1 1 1 1 1110 1 3 32 4 2 4 2 1 2 2 1 1 1 1 1 1 2 3 4 3 4 4 4 2 3 4 4 4 3 2210 2 1 14 2 4 2 1 2 2 1 1 1 1 1 1 2 3 4 3 4 4 4 2 3 4 4 4 4 3310 3 3 2 14 24 4 2 1 2 2 1 1 1 1 1 1 2 3 4 3 4 4 4 2 3 4 4 4 4 4111 4 2 9 12 9 4 2 1 1 1 1 2 2 1 2 2 1 4 4 2 2 3 3 1 2 3 3 3 2 2211 3 3 0 5 17 15 4 2 1 1 1 1 1 2 1 2 2 1 4 4 3 3 4 3 3 4 4 4 3311 1 2 30 4 2 1 1 1 1 1 2 1 1 2 1 4 4 1 1 3 2 2
Mean 292*4 2 14.2 71818 6.6667 11.9 33668 22363 1.2363 1.4118 2.0629 1.1178 1 1333 1.6 14116 1.4 1.7 1.6 3.2363 3.6624 2.3333 276 3 3.29 1.667 1.936 275 3125 2824 2294 1882
Mode 1 2 0 4 2 16 4 2 1 1 2 1 1 2 1 1 2 2 4 4 3 3 4 4 1 1 3 4 3 2 1
s n 12*M 0.767 12.636 5.4242 6.6873 7.8166 0.7047 10666 0.6496 0.9(96 06266 0.3222 0.3389 04698 04922 04899 04963 0.6 1.0017 0.3222 06992 0966 1.061 0968 0.669 0.827 0.9011 1.0631 1042 112S 1.022
00

s e l e c t e d F actors
4 9
APPENDIX E
COMPLETE STUDENT SURVEY RESPONSES AND TEST RESULTS

50COMPLETE STUDENT SURVEY RESPONSES AND TEST RESULTS
Response Data Box Test Score# A B C D E F Q H 1 J K L M mi Ml Ml* mib •wl •m 2 ToM
1 1 2 1 1 1 2 1 1 1 1 2 1 2 10 3 0 6 13 6 192 1 1 2 2 1 3 1 2 3 1 2 1 2 15 4 2 8 19 10 293 1 1 1 3 2 1 1 3 3 2 2 1 2 19 8 6 4 27 10 374 1 1 1 1 2 1 1 3 1 2 1 2 15 4 4 6 19 10 296 1 1 4 4 2 1 1 1 2 2 1 2 16 5 6 6 21 12 336 1 1 1 2 1 1 2 1 1 2 1 2 13 10 2 10 23 12 357 1 1 1 1 3 1 1 1 1 2 1 2 11 3 4 8 14 12 268 1 1 1 1 1 1 1 1 1 2 2 1 2 18 3 2 12 21 14 359 1 1 4 4 3 2 2 1 1 1 2 18 11 4 10 29 14 43
10 1 1 1 1 1 1 1 1 1 1 2 1 2 14 4 6 8 18 14 3211 1 1 1 2 1 1 1 1 2 1 2 10 5 8 6 15 14 2912 1 1 1 1 1 1 1 1 1 2 2 1 2 16 9 8 8 25 16 4113 1 1 2 1 2 1 3 3 2 1 1 2 11 7 12 4 18 16 3414 1 1 1 3 3 1 1 1 1 1 1 2 18 10 8 10 28 18 4616 1 1 4 4 1 1 2 1 2 1 1 2 14 3 10 8 17 18 3516 1 1 1 2 3 1 1 1 1 2 1 1 2 17 9 12 6 26 18 4417 1 1 1 3 4 1 3 3 1 1 1 2 17 5 8 12 22 20 4218 1 1 1 2 2 1 1 3 3 1 2 1 2 21 7 12 10 28 22 5019 1 1 1 4 2 1 1 1 2 2 1 1 2 9 6 14 8 15 22 3720 1 1 1 2 3 1 1 1 1 2 1 2 15 4 14 8 19 22 4121 1 1 1 2 2 1 1 1 1 2 2 1 2 16 7 14 8 23 22 4522 1 1 1 3 4 1 2 2 1 1 1 2 18 10 16 8 28 24 5223 1 1 1 2 2 1 1 1 1 2 2 2 13 2 10 16 15 26 4124 1 1 1 3 2 1 1 3 3 2 2 1 2 17 11 14 26 28 40 6825 1 1 4 4 3 4 2 1 1 1 1 1 2 18 7 14 12 25 26 5126 1 1 1 2 2 1 2 2 2 1 2 1 2 16 9 12 18 25 30 5527 1 1 2 3 3 2 2 4 4 2 2 1 2 24 2 16 16 26 32 5828 1 1 2 3 2 1 2 3 3 2 2 1 2 17 8 20 14 25 34 5929 1 1 3 4 4 1 1 1 3 2 1 1 2 20 1 20 14 21 34 5530 1 1 1 3 2 1 1 1 1 2 2 1 2 17 10 14 24 27 38 6531 1 1 1 4 2 4 1 3 4 1 1 1 2 9 7 16 22 16 38 5432 1 2 2 4 1 1 4 4 1 2 1 2 16 2 12 28 18 40 5833 1 1 1 1 1 1 2 2 2 2 1 2 16 7 18 22 23 40 6334 1 1 2 2 3 1 1 3 3 1 2 1 2 22 8 20 24 30 44 7435 1 1 2 4 4 1 1 1 1 2 1 2 27 14 16 30 41 46 8736 1 1 2 4 4 1 4 1 2 2 28 12 20 30 40 50 90
1 3 1 1 1 1 1 1 1 1 1 2 1 2 9 6 4 4 15 8 232 4 1 2 2 1 1 1 1 2 2 1 2 15 6 2 8 21 10 313 2 1 1 2 3 1 1 1 1 1 1 1 2 16 7 6 6 23 12 354 3 1 1 1 1 1 2 2 2 1 1 1 18 10 2 10 28 12 405 4 1 1 1 1 1 1 1 1 2 2 1 1 17 7 2 12 24 14 386 4 1 1 4 3 1 1 2 2 2 1 1 2 17 4 2 14 21 16 377 4 4 1 3 3 1 1 4 4 2 2 1 2 11 9 10 8 20 18 388 3 2 2 2 3 1 1 1 2 2 1 2 16 12 10 12 28 22 509 2 2 1 2 2 3 1 1 1 1 1 1 2 20 10 14 8 30 22 52
10 4 2 1 3 1 1 1 1 1 1 2 1 2 23 9 8 14 32 22 5411 2 1 1 4 3 2 1 4 4 2 1 1 2 17 10 4 28 27 32 5912 4 4 1 2 1 1 1 4 4 2 1 1 2 18 4 20 14 22 34 5613 3 3 1 2 2 1 1 1 1 2 1 1 2 18 10 12 24 28 36 6414 2 1 1 2 2 1 4 4 1 1 1 2 16 11 14 24 27 38 6515 4 3 1 1 1 1 1 4 4 1 1 1 2 9 6 24 16 15 40 5516 4 4 1 4 3 4 4 4 1 1 1 1 24 12 12 28 36 40 7617 4 2 1 3 3 1 1 1 1 2 1 1 2 28 12 18 24 40 42 82

COMPLETE STUDENT SURVEY RESPONSES AND TEST RESULTSbi
« A B C D E F 0 H 1 J K L M mi mi mi* mib 8*c1 S*c2 Total
18 4 1 1 2 3 1 1 4 4 2 2 1 2 20 2 20 22 22 42 6419 4 4 4 3 3 1 1 1 1 2 1 1 2 12 5 20 22 17 42 5920 4 2 1 1 4 1 1 4 4 2 1 1 2 15 11 20 28 26 48 7421 3 1 1 4 1 1 2 3 4 2 2 1 2 23 10 24 32 33 56 89
1 1 1 1 3 4 4 1 3 3 2 2 2 14 4 8 2 18 10 282 1 1 2 4 4 4 1 2 2 2 1 1 2 14 11 4 6 25 10 353 1 1 1 1 1 2 1 2 2 2 2 1 2 16 3 6 6 19 12 314 1 1 2 1 3 2 2 1 2 2 2 2 17 7 8 4 24 12 365 1 1 4 3 3 2 2 3 1 1 1 1 2 9 3 6 6 12 12 246 1 1 4 3 3 2 2 2 2 1 1 1 1 11 8 6 8 19 14 337 1 1 3 2 3 3 3 4 3 1 1 1 2 9 8 6 8 17 14 31a 1 1 1 1 1 1 1 1 1 1 2 1 2 14 4 6 8 18 14 329 1 1 4 1 2 3 1 1 1 2 2 2 11 4 6 10 15 16 31
10 1 1 1 2 3 1 1 3 3 1 1 1 1 21 9 16 2 30 18 4811 1 1 1 3 3 1 1 1 1 2 1 1 2 19 3 8 10 22 18 4012 1 1 1 1 1 1 1 2 2 2 1 1 2 10 5 12 8 15 20 3513 1 1 1 2 2 1 1 2 2 2 1 1 2 18 4 10 10 22 20 4214 1 1 1 1 1 1 1 3 3 2 2 1 2 18 10 6 14 28 20 4815 1 1 1 3 4 4 1 2 1 2 16 11 8 12 27 20 4716 1 1 1 2 2 1 3 3 2 1 1 2 13 5 12 8 18 20 3817 1 1 1 2 2 1 1 1 1 2 1 1 2 8 4 6 16 12 22 3418 1 1 4 1 1 1 1 3 3 1 2 1 2 10 6 10 12 16 22 3819 1 1 1 1 1 1 1 1 1 2 1 1 2 11 7 12 12 18 24 4220 1 1 4 2 3 1 1 4 4 2 1 1 2 14 0 14 10 14 24 3821 1 1 1 2 2 1 1 4 4 2 2 1 11 7 8 16 18 24 4222 1 1 1 4 4 1 2 2 1 1 1 1 16 8 12 14 24 26 5023 1 1 1 3 2 1 1 2 1 2 1 1 1 14 10 16 12 24 28 5224 1 1 1 2 2 1 3 3 1 2 1 2 17 10 6 24 27 30 5725 1 1 1 4 4 1 3 3 1 2 1 2 18 7 12 18 25 30 5526 1 1 2 2 1 4 4 1 1 1 2 15 12 10 22 27 32 5927 1 1 4 1 1 1 1 3 3 2 1 1 2 12 7 16 18 19 34 5328 1 1 3 2 1 1 1 1 1 1 2 10 3 18 18 13 36 4929 1 1 3 3 1 1 3 3 1 2 1 2 14 7 10 26 21 36 5730 1 1 4 2 3 1 4 4 1 1 1 1 22 10 22 16 32 38 7031 1 1 3 3 2 1 4 4 1 2 1 2 12 5 24 24 17 48 65
1 4 4 3 3 1 1 2 1 2 2 1 2 20 6 10 6 26 16 422 4 4 2 1 1 1 3 3 2 1 1 2 11 6 4 12 17 16 333 2 2 2 2 1 1 1 1 1 2 2 1 2 13 4 10 6 17 16 334 3 3 1 3 1 1 1 2 2 1 2 22 8 12 8 30 20 505 2 2 1 3 3 1 1 1 1 1 2 1 2 11 12 8 12 23 20 436 3 3 3 2 4 1 1 3 3 2 2 1 2 13 7 6 18 20 24 447 3 2 1 3 3 1 1 1 1 1 2 1 2 15 3 14 12 18 26 448 3 3 1 3 2 1 3 3 1 1 1 2 20 10 16 12 30 28 589 4 4 1 2 2 1 1 1 1 1 1 1 2 15 11 14 14 26 28 54
10 2 2 1 3 2 1 1 3 3 2 2 1 2 20 9 12 18 29 30 5911' 4 4 3 4 4 4 3 3 2 2 1 1 27 11 18 14 38 32 7012 4 4 4 2 2 2 1 3 3 1 1 1 1 18 4 22 12 22 34 5613 2 2 1 2 3 3 1 3 3 2 2 2 14 5 20 16 19 36 55i f 3 3 1 4 4 2 1 4 4 2 2 1 2 13 15 16 22 28 38 6615 4 4 2 3 4 2 1 2 2 1 2 1 2 21 9 22 16 30 38 6816 3 3 1 2 3 1 1 2 2 1 2 1 10 10 22 16 20 38 5817 3 3 2 3 3 1 1 1 1 2 2 1 2 21 5 20 20 26 40 6618 3 3 4 3 3 1 3 3 1 1 1 2 20 5 14 26 25 40 6519 3 2 1 4 4 2 1 3 4 2 2 1 2 21 8 20 22 29 42 7120 3 1 2 2 2 2 1 4 4 1 2 1 1 21 6 18 24 27 42 6921 3 3 2 2 3 1 3 1 1 1 1 1 2 15 7 24 18 22 42 64

COMPLETE STUDENT SURVEY RESPONSES AND TEST RESULTS52
« A B C D E F Q H 1 J K L M PI1 PI2 PI la PI lb tael tael Total22 3 3 1 2 3 2 3 1 1 1 1 1 2 27 13 24 20 40 44 8423 4 4 4 3 3 1 1 1 1 2 2 1 2 9 9 14 30 18 44 6224 4 4 1 3 3 1 1 1 1 1 1 1 2 18 11 22 22 29 44 7325 2 1 2 4 3 1 3 4 4 1 1 1 1 19 8 20 26 27 46 7326 3 3 3 2 4 1 1 4 3 1 1 1 2 18 7 22 26 25 48 7327 3 3 2 3 2 1 3 1 1 1 1 1 2 21 12 26 22 33 48 8128 3 3 2 2 2 1 1 3 1 1 1 1 2 16 9 24 24 25 48 7329 3 3 1 4 4 1 3 3 3 1 1 1 2 25 11 22 26 36 48 8430 4 4 2 4 4 1 1 3 3 1 2 17 11 18 32 28 50 7831 3 1 2 4 4 1 4 4 4 1 1 1 1 28 18 24 26 46 50 9632 3 3 2 4 3 2 3 4 4 1 1 1 2 25 8 22 30 33 52 8533 4 3 3 3 2 3 3 1 1 1 2 24 15 24 28 39 52 9134 4 4 3 4 4 4 4 1 1 1 1 1 2 26 12 24 30 38 54 9235 2 2 2 4 3 2 1 4 4 1 1 2 22 15 24 30 37 54 9136 3 3 4 4 2 4 2 1 1 1 1 2 20 11 22 32 31 54 8537 3 1 1 4 4 2 1 4 4 1 1 2 23 15 24 32 38 56 9438 2 4 1 4 3 1 4 2 1 1 1 1 1 14 14 24 32 28 56 8439 4 4 2 4 4 1 2 4 4 1 2 23 15 24 32 38 56 9440 2 2 2 4 4 2 4 2 1 1 1 1 2 28 20 24 32 48 56 10441 3 3 2 4 2 4 4 4 1 1 1 24 20 28 30 44 58 10242 4 4 4 4 4 2 4 1 1 1 1 1 1 28 19 26 32 47 58 105
1 4 1 1 1 2 1 1 1 1 2 2 1 1 18 7 2 6 25 8 332 1 1 1 1 1 1 1 1 2 2 2 11 7 6 4 18 10 283 3 1 1 1 1 1 1 1 1 2 2 1 2 14 2 8 4 16 12 284 3 3 1 1 1 1 1 1 2 2 2 9 8 6 6 17 12 295 1 1 1 1 1 1 2 2 2 1 2 11 7 4 10 18 14 326 2 1 1 1 1 1 1 1 1 2 2 2 10 3 6 8 13 14 277 1 1 1 1 3 1 1 2 2 2 1 2 7 12 6 10 19 16 358 1 1 1 1 1 1 1 1 1 2 2 1 2 13 6 6 12 19 18 379 4 1 1 1 2 1 1 2 1 2 2 1 2 10 6 6 14 16 20 36
10 3 3 1 2 2 1 1 2 2 2 2 2 10 8 12 10 18 22 4011 1 1 1 4 3 1 4 4 1 1 1 2 27 4 6 24 31 30 6112 1 1 4 4 3 3 1 1 1 2 6 8 12 20 14 32 4613 2 2 1 3 4 1 1 4 3 1 1 1 1 9 4 20 18 13 38 5114 1 1 3 2 1 3 3 1 1 1 1 14 9 18 20 23 38 6115 4 3 1 2 2 3 3 1 1 1 2 14 15 18 32 29 50 791 4 1 1 1 1 1 1 1 1 2 2 1 2 22 8 6 4 30 10 402 3 2 4 3 1 1 1 3 1 1 2 11 5 10 4 16 14 303 4 1 1 1 1 1 1 1 1 2 2 1 2 10 4 10 4 14 14 284 4 3 2 3 2 2 1 1 1 2 19 12 16 14 31 30 615 4 2 1 3 3 1 1 1 1 2 2 1 2 23 7 16 20 30 36 666 1 1 1 2 1 1 1 3 3 1 2 1 2 13 8 16 28 21 44 657 2 1 4 4 2 4 4 2 1 1 1 12 8 22 30 20 52 728 4 3 4 4 4 3 3 1 1 1 2 25 12 22 32 37 54 919 4 3 1 4 3 1 4 1 1 1 2 1 2 19 8 26 30 27 56 83
10 3 1 3 4 1 3 4 2 1 1 1 2 27 10 24 32 37 56 931 2 1 1 3 1 1 1 1 4 1 1 1 2 14 4 4 4 18 8 262 1 1 1 1 1 1 2 3 3 2 2 1 2 9 7 8 2 16 10 263 1 3 3 3 1 1 1 1 1 2 11 7 8 2 18 10 284 1 1 1 1 3 1 1 3 3 2 1 1 2 16 5 4 10 21 14 355 1 2 1 2 3 1 1 2 1 2 2 1 2 11 2 6 8 13 14 276 2 2 1 1 2 2 2 2 1 2 1 2 14 7 4 12 21 16 377 4 1 2 2 2 1 1 2 2 2 2 1 2 14 7 8 10 21 18 398 4 1 1 1 4 1 3 4 4 2 2 1 2 24 10 12 8 34 20 549 4 4 4 3 4 3 2 3 3 1 2 1 2 14 7 10 10 21 20 41
10 1 3 4 4 2 1 1 3 3 2 1 1 2 11 6 8 12 17 20 37

COMPLETE STUDENT SURVEY RESPONSES AND TEST RESULTS53
# A B C D E F Q H 1 J K L M «1 mz P tU FI 3b $#Cl 90C 2 Total
11 1 1 1 2 2 1 1 3 2 2 2 1 2 8 9 8 14 17 22 3912 1 1 1 1 1 1 1 2 2 2 2 1 2 11 4 14 8 15 22 3713 1 1 1 2 2 1 2 1 1 1 1 1 2 16 9 10 14 25 24 4914 3 3 2 4 4 3 4 4 1 1 2 1 1 6 13 16 8 19 24 4316 4 3 2 4 4 3 1 1 1 1 1 1 2 14 8 6 18 22 24 4616 4 1 2 4 2 3 2 3 3 2 2 1 2 11 9 6 20 20 26 4617 4 3 1 2 2 1 1 2 2 2 2 1 2 12 4 16 10 16 26 4218 4 4 2 3 3 1 2 1 1 1 1 1 2 26 10 22 4 36 26 6219 4 3 1 3 3 1 3 3 3 1 2 1 2 14 8 14 12 22 26 4820 2 2 1 3 2 1 1 4 4 2 1 1 2 10 5 18 10 15 28 4321 1 1 4 1 3 1 1 2 1 2 1 2 15 11 18 10 26 28 5422 4 4 3 3 1 1 3 2 2 2 1 2 17 5 4 24 22 28 5023 4 4 3 4 1 1 1 1 1 1 1 2 12 12 24 10 24 34 5824 1 1 1 3 3 1 2 3 3 1 2 1 2 12 12 26 12 24 38 6225 4 2 4 4 1 1 1 2 2 1 2 19 7 16 22 26 38 6426 1 1 1 4 4 1 4 4 3 1 1 1 2 28 12 24 24 40 48 8827 1 1 1 2 1 1 2 3 3 1 1 1 2 18 9 20 30 27 50 7728 4 2 3 4 2 3 3 2 2 1 2 9 8 24 26 17 50 67
1 1 1 1 1 1 1 2 3 3 2 2 16 6 4 2 22 6 282 1 1 1 1 1 1 1 1 1 1 2 1 2 15 7 4 6 22 10 323 1 1 1 3 2 1 2 3 3 1 2 1 2 19 4 10 6 23 16 394 3 3 1 2 3 1 1 1 1 1 18 8 14 12 26 26 525 1 1 1 3 3 1 1 1 1 1 2 1 2 18 7 16 14 25 30 556 4 4 4 4 1 1 1 1 2 1 1 1 23 9 16 18 32 34 667 1 1 1 3 4 1 3 3 3 2 1 1 2 24 9 12 22 33 34 678 1 1 1 4 4 1 1 2 1 1 1 1 2 25 14 14 22 39 36 759 1 1 1 4 4 1 1 1 1 1 1 1 2 19 14 20 22 33 42 75
10 1 1 1 4 4 1 4 1 1 1 1 1 2 19 6 18 26 25 44 6911 1 1 1 3 3 1 1 3 3 2 1 2 19 7 20 28 26 48 7412 1 1 4 3 2 1 1 3 3 1 1 1 2 26 11 22 26 37 48 8513 1 1 4 4 3 1 1 3 3 1 1 1 2 21 6 22 30 27 52 79
1 1 1 1 2 4 1 2 2 2 2 1 1 2 13 6 6 6 19 12 312 1 1 4 3 3 1 1 1 1 2 1 1 2 18 10 10 6 28 16 443 1 1 4 1 1 3 3 3 18 7 2 14 25 16 414 1 1 2 2 2 1 1 1 1 2 1 1 2 22 4 10 6 26 16 425 1 1 1 3 2 1 2 3 2 2 1 2 18 4 6 12 22 18 406 1 1 1 1 1 1 1 1 1 2 1 2 8 3 14 6 11 20 317 1 1 1 1 1 1 1 1 1 2 1 1 2 18 5 8 12 23 20 438 1 1 1 1 1 1 1 2 3 2 1 2 14 3 6 14 17 20 379 1 1 2 3 2 1 1 1 3 2 1 1 2 8 6 10 12 14 22 36
10 1 1 2 2 2 1 2 1 1 2 1 1 2 16 8 12 14 24 26 5011 1 1 3 1 1 1 1 1 1 2 1 2 22 4 20 8 26 28 5412 1 1 2 3 2 1 1 3 3 2 1 1 2 21 8 22 8 29 30 5913 1 1 1 1 1 4 3 4 1 1 1 2 12 4 20 10 16 30 4614 1 1 1 2 2 1 3 4 4 1 1 2 15 8 14 18 23 32 5515 1 1 1 3 3 1 3 3 3 1 1 1 1 22 6 16 16 28 32 6016 1 1 2 2 2 1 1 2 1 2 1 2 16 10 22 12 26 34 6017 1 1 1 4 3 1 1 1 1 2 1 1 2 22 11 22 12 33 34 6718 1 4 2 2 1 1 3 3 2 1 1 2 20 9 12 22 29 34 6319 1 1 3 3 2 1 4 4 1 1 2 18 8 6 32 26 38 6420 1 1 2 3 2 1 4 1 1 1 1 1 2 14 8 12 28 22 40 6221 1 1 1 2 2 1 4 3 4 1 1 1 1 25 8 18 22 33 40 7322 1 1 2 2 2 1 4 4 4 1 1 2 22 10 14 26 32 40 7223 1 1 4 4 4 2 4 3 2 1 1 1 2 21 9 22 24 30 46 7624 1 1 2 4 1 2 3 3 1 1 1 2 26 7 22 26 33 48 8125 1 1 3 2 2 2 3 3 3 1 2 2 1 12 9 24 24 21 48 69

COMPLETE STUDENT SURVEY RESPONSES AND TEST RESULTS54
« A B C D E F G H 1 J K L M p t i P t2 P î U PI 3b #ec1 ##c2 TcW26 1 1 1 4 3 1 1 4 4 1 1 1 2 24 7 22 28 31 50 8127 1 1 1 4 4 1 4 4 4 1 1 1 2 26 8 22 28 34 50 8428 1 1 1 4 4 1 3 4 3 1 1 1 2 20 9 22 32 29 54 8329 1 1 1 4 4 2 3 4 4 1 1 1 2 26 15 22 32 41 54 9530 1 1 1 4 2 1 4 4 4 1 1 1 2 17 8 24 32 25 56 81
1 3 1 1 2 2 1 1 2 2 1 1 1 2 17 4 2 4 21 6 272 2 4 1 1 1 1 1 1 1 1 2 1 1 10 5 2 4 15 6 213 2 4 1 3 2 1 1 1 1 2 1 1 2 11 5 8 10 16 18 344 2 2 1 3 2 1 1 1 1 2 2 1 2 13 8 8 12 21 20 415 2 1 1 2 1 1 2 1 1 1 1 1 2 13 3 10 14 16 24 406 2 1 1 1 1 2 3 2 1 2 1 2 14 1 6 18 15 24 397 2 2 1 3 3 1 1 1 1 2 2 1 2 18 11 24 8 29 32 61a 2 2 1 4 3 1 3 3 2 2 1 1 2 21 7 18 20 28 38 669 2 2 1 4 4 1 1 4 4 1 2 1 1 11 8 10 30 19 40 59
10 2 2 1 4 4 2 1 4 4 1 2 1 2 16 11 16 24 27 40 6711 2 2 1 4 3 3 3 1 3 1 2 1 2 24 10 18 22 34 40 7412 2 2 1 4 3 1 1 3 1 2 2 1 2 15 3 22 20 18 42 6013 2 2 1 4 3 2 1 4 4 1 1 1 1 15 11 22 24 26 46 7214 2 2 1 3 3 1 2 3 3 2 2 1 2 16 10 22 26 26 48 7416 2 2 3 3 2 1 4 4 1 1 2 21 11 22 26 32 48 8016 2 2 3 3 3 1 3 3 1 2 1 2 15 10 24 26 25 50 7517 2 2 1 4 3 1 1 3 3 2 2 1 2 13 6 26 24 19 50 6918 2 2 1 3 3 1 4 3 3 1 1 1 2 20 10 22 30 30 52 8219 2 4 1 3 3 2 4 4 4 1 2 1 2 26 16 22 32 42 54 9620 2 2 4 4 4 2 2 4 4 1 1 1 2 21 9 22 32 30 54 8421 2 2 4 4 1 1 3 3 1 1 1 2 21 10 24 32 31 56 87
1 4 3 3 3 1 3 4 3 2 2 1 1 12 3 6 12 15 18 332 2 2 4 3 3 3 1 3 3 2 1 1 2 10 6 10 12 16 22 383 4 4 4 2 1 2 1 1 1 2 1 1 2 15 9 12 14 24 26 504 3 3 1 1 1 1 2 1 2 1 2 1 2 12 7 6 22 19 28 475 1 1 1 1 1 1 1 1 2 1 2 1 2 12 6 14 18 18 32 506 1 1 1 4 4 2 4 2 2 1 1 1 1 18 10 22 16 28 38 667 2 1 1 4 3 1 4 4 4 1 1 1 1 24 15 12 28 39 40 798 2 2 2 2 2 1 2 2 1 1 2 12 10 26 14 22 40 629 4 2 1 4 4 3 3 4 4 1 1 1 2 28 12 22 26 40 48 88
10 3 3 1 4 3 1 1 4 4 1 1 1 1 20 6 24 32 26 56 821 1 1 1 1 1 1 1 2 1 1 2 1 2 12 6 6 4 18 10 282 1 1 1 3 3 1 1 1 1 1 1 2 11 4 6 6 15 12 273 2 2 2 2 1 1 1 2 1 2 12 9 6 8 21 14 354 1 1 1 2 3 1 1 1 1 2 1 2 11 4 8 6 15 14 295 1 1 1 1 1 1 1 2 2 13 6 8 6 19 14 336 1 1 4 1 1 1 2 1 1 1 1 1 2 14 13 8 8 27 16 437 1 1 2 1 1 1 3 3 1 2 1 1 20 8 2 18 28 20 488 1 1 3 3 1 1 1 1 1 2 1 2 23 5 4 18 28 22 509 1 1 1 3 4 1 1 1 1 2 2 20 2 10 12 22 22 44
101 1 1 4 2 2 1 1 1 1 1 1 1 2 13 6 14 10 19 24 4311 1 4 3 3 1 1 1 1 2 1 2 13 7 16 8 20 24 4412 1 1 1 2 2 1 1 1 1 1 1 1 2 9 8 10 16 17 26 4313 1 1 1 2 2 1 1 2 4 1 1 1 2 12 5 18 12 17 30 4714 1 2 2 1 2 3 2 1 1 1 2 25 9 12 18 34 30 6416 1 1 2 1 1 2 1 1 1 2 1 2 18 10 12 18 28 30 5816 1 1 2 3 1 2 1 1 1 1 1 2 10 4 8 24 14 32 4617 1 1 1 2 2 1 1 3 1 1 2 1 2 13 8 16 18 21 34 5518 1 1 1 2 2 1 1 3 3 1 2 1 2 20 7 12 24 27 36 6319 1 1 1 2 2 1 3 3 3 1 1 1 2 17 3 16 24 20 40 6020 1 2 1 3 3 1 1 4 4 1 2 1 2 14 12 18 24 26 42 68

COMPLETE STUDENT SURVEY RESPONSES AND TEST RESULTS55
# A B C 0 E F G H 1 J K L M pti M 2 P*3# PI 3b ##C l ##c2 Total21 1 1 1 3 2 1 r i 2 2 2 2 2 2 17 6 24 22 23 46 6922 1 3 2 4 4 3 3 1 1 1 1 1 2 21 5 22 24 26 46 7223 1 1 1 4 4 1 1i 1 1 1 1 2 2 16 7 16 30 23 46 6924 1 1 2 4 4 2 2 4 4 1 1 1 2 21 10 24 24 31 48 7925 1 2 4 3 3 1 2 4 1 2 1 2 22 12 22 28 34 50 8426 1 1 3 4 4 1 31 4 4 1 2 1 2 25 18 24 28 43 52 9527 1 1 4 4 3 1 4j 4 4 1 1 1 2 26 14 20 32 40 52 9228 1 2 3 3 3 1 2 4 4 1 1 1 2 20 13 24 32 33 56 8929 1 1 3 3 3 3 4 4 4 1 1 1 2 21 9 26 32 30 58 88
1 2 1 3 2 1 2 1 1 1 1 2 16 9 4 10 25 14 392 3 3 1 2 2 1 1 1 1 2 2 1 2 11 2 14 8 13 22 353 2 2 1 1 1 1 1 2 4 1 2 1 2 14 6 12 12 20 24 444 2 2 2 2 2 1 1 1 1 1 1 1 1 17 9 12 14 26 26 525 2 1 1 2 2 1 1 1 1 1 2 1 2 16 11 8 20 27 28 556 2 1 1 1 1 2 1 1 1 1 1 1 2 17 7 18 12 24 30 547 2 2 3 4 4 1 3 2 1 1 1 1 1 26 11 16 18 37 34 718 2 2 1 2 3 1 1 1 1 1 2 1 2 15 7 16 28 22 44 669 2 2 1 4 4 1 2 3 3 2 1 1 2 15 11 20 28 26 48 74
10 2 2 4 2 2 1 2 3 3 1 1 1 2 17 13 24 24 30 48 7811 2 2 1 3 3 1 1 3 3 2 2 1 1 22 12 24 26 34 50 841 3 3 1 3 2 2 2 1 1 1 2 1 2 11 8 8 8 19 16 352 3 3 1 3 2 1 1 1 1 1 1 1 2 12 7 6 14 19 20 393 4 4 1 2 3 2 1 1 1 2 2 1 2 17 7 10 14 24 24 484 2 2 2 3 3 1 1 4 4 1 1 1 2 20 4 10 14 24 24 485 3 3 2 4 3 3 1 3 3 1 1 1 2 21 8 8 18 29 26 556 3 3 1 1 1 1 1 2 2 2 2 1 2 16 10 20 10 26 30 567 4 4 1 2 2 4 1 1 1 2 1 1 2 18 6 14 18 24 32 568 3 3 2 3 3 1 4 1 1 1 1 1 2 14 6 10 22 20 32 529 4 4 1 3 2 3 1 3 3 1 1 1 2 16 10 10 24 26 34 60
10 4 1 1 2 3 1 2 1 2 1 2 1 2 9 7 20 14 16 34 5011 4 4 1 3 3 1 2 1 1 15 11 14 24 26 38 6412 4 2 1 2 3 1 1 1 1 2 1 1 2 28 18 24 14 46 38 8413 3 3 3 3 3 1 4 4 1 1 1 2 15 9 12 28 24 40 6414 4 1 1 1 1 1 1 1 1 2 2 1 2 8 9 16 24 17 40 5715 4 1 1 2 2 1 1 1 1 2 1 1 1 18 13 14 28 31 42 7316 4 4 2 4 4 3 4 4 4 1 1 1 2 28 9 20 24 37 44 8117 4 4 1 3 2 1 4 1 1 1 1 1 2 21 5 20 28 26 48 7418 3 3 2 3 3 1 1 3 3 2 2 1 2 26 15 20 28 41 48 8919 4 3 3 4 4 3 2 4 4 1 1 1 2 13 13 18 32 26 50 7620 3 2 1 4 4 1 3 1 1 1 1 1 2 24 20 18 32 44 50 9421 3 4 4 3 1 4 1 1 1 1 1 1 2 20 7 22 28 27 50 7722 2 2 2 2 2 4 2 2 2 1 1 1 2 19 19 22 28 38 50 8823 3 1 1 3 4 1 4 4 4 1 1 1 2 24 8 24 28 32 52 8424 4 1 3 3 1 1 2 1 1 1 1 1 14 6 20 32 20 52 7225 2 2 4 3 1 2 4 4 1 2 1 1 17 7 22 32 24 54 7826 4 1 2 3 2 1 2 2 2 2 1 1 15 6 24 30 21 54 7527 3 2 4 4 1 3 1 1 1 1 1 2 28 19 26 30 47 56 10328 3 1 3 3 2 1 3 3 1 1 1 2 22 9 24 32 31 56 8729 2 1 4 4 1 4 4 4 1 1 1 2 24 10 24 32 34 56 9030 2 1 4 4 1 4 4 4 1 1 1 2 27 11 24 32 38 56 9431 3 1 1 3 3 2 4 3 3 1 2 1 2 28 14 24 32 42 56 98
1 1 1 1 1 1 1 1 1 2 2 1 2 9 6 6 4 15 10 252 2 2 1 2 1 3 1 1 2 2 1 2 16 11 10 4 27 14 413 2 1 1 2 3 1 3 1 2 1 2 1 2 20 5 6 10 25 16 414 2 2 4 2 3 1 1 2 2 1 1 1 2 16 9 16 4 25 20 455 3 1 1 3 2 1 2 1 2 2 2 1 2 19 10 8 14 29 22 51

56COMPLETE STUDENT SURVEY RESPONSES AND TEST RESULTS
« A B C D E F O H J K L M Ml M2 M2* MM •*Cl «**2 Total6 2 1 1 1 2 1 1 2 2 2 1 1 2 9 8 12 10 17 22 397 1 1 1 4 3 1 3 4 3 1 1 1 1 16 8 12 14 24 26 508 2 1 1 3 4 3 3 4 4 1 1 1 2 23 15 20 18 38 38 769 1 1 1 3 2 1 2 2 2 1 1 1 1 19 10 10 18 29 28 57
10 2 1 1 2 2 1 1 3 3 1 1 1 10 7 16 12 17 28 4511 3 1 1 3 1 1 3 1 1 1 1 1 2 16 5 14 16 21 30 5112 1 1 1 2 2 1 1 1 1 1 2 13 5 6 24 18 30 4813 1 1 1 2 2 1 1 1 1 1 1 1 2 18 7 16 14 25 30 5514| 4 1 1 3 2 1 1 3 3 1 1 2 17 11 24 8 28 32 6015 2 2 2 3 3 3 4 2 2 1 1 1 2 20 12 24 14 32 38 7016 3 1 2 2 2 1 3 4 4 1 1 2 13 8 22 18 21 40 6117 3 1 4 3 3 1 2 4 4 1 1 1 1 18 8 18 22 26 40 6618 1 1 2 4 3 1 3 3 3 1 1 1 1 24 11 20 24 35 44 7919 1 1 1 4 4 1 3 3 2 1 1 1 2 24 10 20 24 34 44 7820 2 1 1 4 3 1 1 4 4 1 1 2 17 9 20 26 26 46 7221 1 1 3 3 3 3 1 3 3 1 1 1 2 17 13 24 24 30 48 7822 2 1 2 3 4 2 3 1 1 1 1 1 2 25 11 18 30 36 48 8423 3 2 2 3 4 2 4 3 2 1 1 1 2 24 16 24 26 40 50 9024 3 4 3 4 4 1 4 1 1 1 1 1 2 21 14 24 30 35 54 8925 2 1 1 3 3 1 4 4 4 1 1 1 2 28 11 24 32 39 56 95
1 3 3 4 2 2 3 4 1 1 1 1 2 23 11 14 12 34 26 602 2 2 3 2 2 2 1 2 2 1 1 1 2 12 5 12 18 17 30 473 4 4 4 3 2 1 1 1 1 2 15 8 14 16 23 30 534 2 2 1 1 1 1 1 3 3 1 1 1 2 23 9 12 18 32 30 625 3 3 1 2 3 3 1 3 3 1 1 1 2 22 10 12 18 32 30 626 2 2 4 3 2 1 1 1 1 1 1 1 2 16 7 22 10 23 32 557 4 4 1 1 2 1 1 1 1 1 2 19 9 18 14 28 32 608 4 4 4 3 2 3 1 1 1 1 1 2 21 10 16 22 31 38 699 2 2 2 3 2 3 1 3 3 1 1 1 2 28 9 24 16 37 40 77
10 4 4 1 3 3 1 1 1 1 2 1 2 23 5 20 20 28 40 6811 3 3 1 3 1 1 1 1 1 1 1 1 2 19 9 18 24 28 42 7012 3 3 2 3 3 1 1 2 2 1 2 1 1 13 8 22 22 21 44 6513 4 4 1 4 2 1 1 3 3 2 1 2 18 9 20 26 27 46 7314 4 4 4 3 3 1 1 3 3 1 2 1 2 16 10 22 26 26 48 7415 2 2 2 3 3 2 3 3 1 1 1 2 24 16 18 30 40 48 8816 4 4 1 2 4 3 4 4 1 1 1 2 28 10 24 30 38 54 9217 2 2 4 3 4 1 3 3 1 1 1 1 27 13 22 28 40 50 9018 4 4 4 4 4 1 1 1 1 1 1 2 28 20 24 28 48 52 10019 4 2 3 3 4 3 4 3 1 1 1 2 17 4 22 30 21 52 7320 3 2 3 3 3 3 3 3 1 1 1 2 15 9 20 32 24 52 7621 3 3 4 4 4 3 3 3 1 1 2 27 9 22 32 36 54 9022 4 4 3 3 2 3 4 4 1 1 1 2 20 18 24 30 38 54 9223 3 3 2 4 4 1 4 4 1 1 1 1 28 17 24 32 45 56 10124 3 3 4 4 3 4 3 4 4 1 1 1 1 22 13 24 32 35 56 91
1 1 1 1 1 3 1 1 1 1 2 1 2 13 8 0 8 21 8 292 1 1 2 1 1 2 1 3 3 1 2 1 2 12 4 4 10 16 14 303 1 1 1 2 2 1 4 1 1 1 1 2 18 5 8 6 23 14 374 1 1 2 3 3 1 1 3 3 2 1 2 12 6 6 8 18 14 325 1 1 1 2 1 1 1 1 1 2 1 2 9 5 8 8 14 16 306 1 1 1 3 3 1 1 3 3 1 1 1 2 13 7 8 8 20 16 367 1 1 1 3 3 1 2 2 1 2 1 2 12 11 12 8 23 20 438 1 1 1 2 2 1 1 1 1 2 2 1 2 10 8 12 10 18 22 409 1 1 4 3 4 2 1 3 3 1 2 1 2 15 12 14 12 27 26 53
10 1 1 4 3 3 1 1 2 2 12 5 18 12 17 30 4711 1 1 1 3 3 1 3 2 2 2 2 1 2 15 8 14 16 23 30 5312 1 1 1 2 2 1 2 2 2 2 2 1 2 21 12 16 14 33 30 63

57COMPLETE STUDENT SURVEY RESPONSES AND TEST RESULTS
# A B 0 D E F o H 1 J K L M mi mi mi# mib S#c1 8#c2 ToM
13 1 1 4 4 1 1 2 2 2 1 1 2 12 14 16 16 26 32 5814 1 1 3 2 1 1 3 3 1 1 1 2 21 7 16 16 28 32 6015 1 1 3 3 1 4 3 3 1 1 1 2 10 9 22 10 19 32 5116 1 3 4 4 1 3 4 3 2 1 2 23 13 12 22 36 34 7017 1 1 4 4 2 3 1 1 1 2 1 2 15 9 22 16 24 38 6218 1 3 4 4 2 4 2 2 1 1 1 2 22 7 16 24 29 40 6919 1 3 4 4 1 4 1 1 1 1 1 2 20 11 18 22 31 40 71201 1 3 4 4 3 4 1 1 1 2 1 2 26 14 22 22 40 44 8421 1 1 3 3 1 1 3 3 2 2 1 2 16 9 18 30 25 48 7322 1 2 3 2 1 1 1 1 2 1 1 1 21 7 20 28 28 48 7623 1 3 4 4 2 3 2 2 2 1 1 2 28 17 24 26 45 50 9524 1 1 4 4 1 3 3 3 1 1 1 2 23 7 24 28 30 52 8225 1 3 3 1 1 1 1 26 17 24 30 43 54 97
Mean 2.087 1.833 1.776 2673 2614 1.481 1806 2.312 2.272 1.389 1451 1055 1.871 17.28 8.44 14.87 17.88 28.7 32.75 58.44Mode 1 1 1 3 3 1 1 1 1 1 1 1 2 18 7 24 8 28 48 56SD 1.187 1074 1.08 103 1024 0.815 1.101 1.185 1.184 0.49 0.498 0229 0.336 5.32 3885 8.903 8839 7794 14.24 19.98

58
APPENDIX F
TABLES

59
1 U è L ê l l ...1 1 ■ T' j" t .......... _______L. , ,
MEANASSÎESSMENT SCORES; POINTS AND PERCENTAGES !j 1j 1
MMm 4 18 35441 9.1519 16 6078 20 3038 27 5063 ! 36 91141 64.4177Mod# 4 17] 9 24 14 26 34 73SO 0 5 6435 ! 3.79236 6.8721 869214 819057) 13.7714 19.0007# A PI 1P2 P3A P3B T1 1t2 GTSE 79 6] 0 b 0 o) 0 0
0 0 65.55% 45.76% 5931% 63 45% 5730% 61.52% 59 65%
Mean 3 18 2462 ] 9 38462 165538 198462 27.6308) 36.4 64 0308Mode 3 13i 8 24 32 28) 561 64SD 0 5.502531 3.88168 6.91494 914369 6.194881 14.9469 21.507« A PI |P2 P3A P3B T1 1t2 GTJU 66 01 Ô 0 0 o) 0 0
0 0 65.16%) 46 92% 59.12% 62.02% 57.56%) 60 67% 59.29%0 0 0 0 b 0 0 b 0
Meen 2 17 2429 9.08571 159143 19.1429 26 3286 ) 35.0571 61.3857Mode 2 16 11 24 18 27 4b 84SD 0 5 060871 3 76352 6.94826 8.64917 7.89886) 13.7808 19.438# A P1 |P2 P3A P3B T1 )t2 GTSO 70 o| 0 0 0 o! 0 0
0 0 61.58% 45.43% 5684% 59 82% 54.85% 58.43% 5684%
Meen 1 16.4574 ) 7.57447 13.1596 15.7128 24 0319 28.8723 52.9043Mode 1 18 7 6 8 18) 30 3730 0 5 06482 ) 3 28274 647713 6.33491 7 04764) 13.3035 18 4921# A PI jP2 P3A P3B T1 )t2 GTFR 188 0 0 0 0 0 0 0
0 0 58.78% 37 87% 47.00% 49.10% 50.07% 48.12% 48.99%
# A PI |P2 P3A P3B T1 T2 GTFR188 58 78%) 37.87% 47.00% 49.10% 50.07% 48.12% 48.99%SO 70 61.58%) 45.43% 56.84% 59.82% 54.85%) 58.43% 56 84%JU65 6516%) 46.92% 59.12% 62.02% 57.56%) 60.67% 59.29%SE 79 65.55% 45.76% 59.31% 63.45% 57.30% 61.52% 59.65%
--------4--------- -------- 1--------
0.7
0.6
0.5
04
0.3
0.2
0.1
SE 79JU65
P3A SO 70P3BFR 188
GT
□ FR 188
# 8 0 70
■ JU65
□ SE79

6 0
TABLE 2
Correlation of Aural Scores and Aural-Visual Identification Scores
Aural Scores
Section 1 Section 2
Mel. & Rhy. Scores
Section 1
Section 2
1
0.61216294

Table 3
Correlation of Aural Discrimination and
Aural Visual Melodic Discrimination
Section 1 1
Vis. & Mel. Discrim. Part 3A 0.539278815
61
Aural Scores
Section 1 Part 3A

62
TABLE 4
ASSESSMENT SCORE PERCENTAGES BY GRADE LEVEL
Rhy Mel
9th grade 49.10% 47.00%
10th grade 59.82% 56.84%
11th grade 62.02% 59.12%
12th grade 83.45% 59.31%
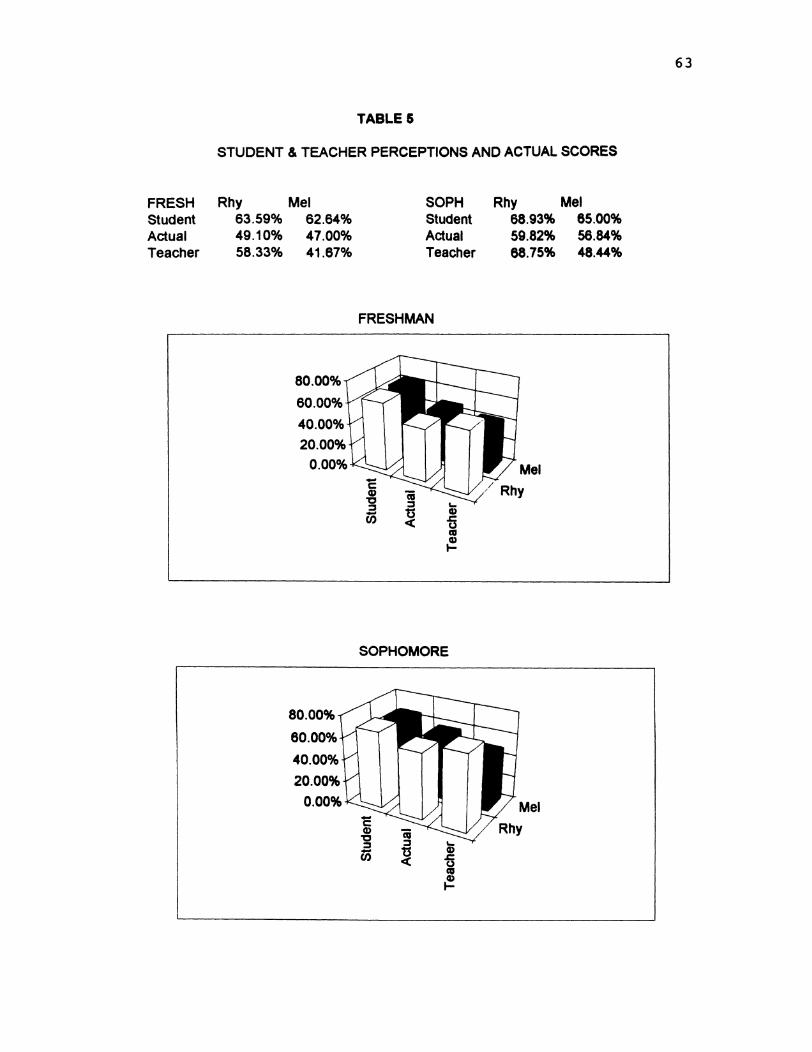
63
TABLE 5
STUDENT & TEACHER PERCEPTIONS AND ACTUAL SCORES
FRESH Rhy Mel Student 63.59% 62.64%Actual 49.10% 47.00%Teacher 58.33% 41.67%
SOPH Rhy Mel Student 68.93% 65.00%Actual 59.82% 56.84%Teacher 68.75% 48.44%
FRESHMAN
80.00%60.00%40.00%20.00%
0.00%
SOPHOMORE
80.00%60.00%40.00%20.00%
0.00%
(0
I

6 4
JUNIORStudentActualTeacher
Rhy Mel 70.31% 66.80%62.02%75.00%
59.12%68.75%
SENIORStudentActualTeacher
Rhy Mel 69.62% 70.89%63.45%81.25%
59.31%78.13%
JUNIOR
80.00%60.00%40.00%20.00%
0.00%
SENIOR
100.00%80.00%60.00%40.00%20.00%
0 .00% Mel

65
Table 6
Correlation of Length of Piano Study and Test Scores
Length of Study
Piano
Aural Scores
Section 1
Piano
Aural Scores Section 1
Mel. & Rhy. Scores Section 2
0.506453794
0.431190139 0.61216294
Se

66
TABLET
CORRELATION OF LENGTH OF STUDY OF A BAND OR ORCHESTRA INSTRUMENT AND TEST SCORES
Length of Inst, study Aurel Scores
instrument Section 1 Section 2
Instrument 1Aural Scores Section 1 0.24117934 1Mel. 4 Rhy. l.D. Scores Section 2 0.417664614 0.61216294 1

67
TABLE 8
CORRELATION OF LENGTH OF STUDY IN BAND OR ORCHESTRA AND TEST SCORES
Band or Orch.
Aural Scores Section 1
Mel. & Rhy. l.D. Scores Section 2
Length of study
Band or Orch.
Aural Scores
Section 1
1
0.215668094
0.382203956
10.61216294
Section 2

68
TABLE 9
CORRELATION OF PRIVATE VOCAL STUDY AND TEST SCORES
Length of Vocal Study Aural Scores
Voice Section 1________ Section 2
Voice 1Aural Scores Section 1 0.148370044 1Mel. * Rhy. l.D. Scores Section 2 0.127944609 0.61216294 1

6 9
TABLE 10
CORRELATION OF CHOIR SIZE AND TEST SCORES
Size of Choir Pt1 Pt2 Pt3e Pt 3b Section 1 Section 2 TotalSize Pt 1 Pt2 Pt3a Pt3b Section 1 Section 2 Total
10.3168320.2849520.2723030.2745850.3294650.2808030.304734
0.6938070.8145560.7811090.96281
0.8172130.888207
10.8413190.7856460.8625770.8321290.864302
10.89714
0.8878790.9683510.966322
10.8435
0.9790030.958516
10.8863
0.9482431
0.987487

70TABLE 11
CORRELATION OF FREQUENCY AND LENGTH OF REHEARSALS AND TEST SCORES
Fmq. ofReh. IfingthofReh Pti Pt2 P tU PtZb Section 1 Section? Tote/Freq. 1Length -0.728117 1P ti 0.49206324 -0.3587094 1R 2 0.4065405 -0.1972674 0.693807 1R 3a 0.44312175 -0 3770831 0.814556 0.841319 1R 3b 0.37781962 -0.3225538 0.781109 0.785646 0.89714 1Section 1 0.49821234 -0.3260264 0.96281 0.862577 0.887879 0.8435 1Section2 0.41794064 -0.3562418 0.817213 0.832129 0.968351 0.979003 0.8863 1Total 0.45621882 -0.355277 0.888207 0.864302 0.966322 0.958516 0.948243 0.987487 1

7 1
TABLE 12
CORRELATION OF AREAS TAUGHT AND TEST SCORES
Tima S.R. Theory wA>iyrica Pti Pt2 Pt3a Pt3b SacHofilTime S R. 1Theory 0.602711 1w/o Lyiice 0.236643 -0.05429 1R1 -0.28297 -0.12191 -0.24859 1R 2 -0.15614 -0.01999 -0.53419 0.693807 1R3a -0.41439 -0.23495 -0.3107 0.814556 0.841319 1R3b -0.15244 0.070907 -0.22452 0.781109 0.785646 0.89714 1Section 1 -0.25737 -0.09315 -0.3664 0.96281 0.862577 0.887879 0.8435 1Sectk>n2 -0.27737 •0.06837 -0.27127 0.817213 0.832129 0.968351 0.979003 0.8863Total -0.27783 -0.0786 -0.31172 0.888207 0.864302 0.966322 0.958516 0.948243
Soc0on2 Total

72
TABLE 13
CORRELATION OF INDIVIDUAL CHORAL EXPERIENCE AND TEST SCORES
Length of Choral Exp. Aurai Scorai
Experience Section 1 Section 2
Experience 1Aurai Scores Section 1 0.146977267 1Mel. & Rhy. 1.0. Scoras Section 2 0.241358803 0.61216294 1

TABLE 14A73
The Influence of The Home Musical Environment;A Comparison of Mean Scores
P arti P a rt2 PartSA P art38 Section 1 Section2 G randir Parents do not listen to music 17.95238 8.33333 13.33333 17.33333 26.28571 30.66667 56.9523; Parents listen to music 17.36579 8.536842 14.97895 18.08947 25.90263 33.06842 58.9710;
60
50
40
30
20
10
0 I— CM GÛ e— CM Q
" H i l l</) Vi Q 0
□ Parents do not listen to music
I Parents listen to music

74TABLE 148
The Influence of The Home Musical Environment:A Comparison of Mean Scores
Parents do not play an inst. Parents play a musical inst.
Part 1 Part 2 Part 3A Part 38 Section 1 Section 2 Grand Tot 15.61111 7.54444 12.56667 15.4 23.15556 27.96667 51.1222218.57078 9.187215 16.71233 20.00913 27.75799 36.72146 64.47945
706050403020100
t - CM < OD OI -g
sî î i l l l(0 (0 2
o
□ Parents do not play an inst.
■ Parents play a musical inst.

75TABLE14C
The Influence of Guitar Playing:A Comparison of Mean Scores
Part 1 Part 2 Part 3A Part 38 Section 1 Section 2 Grand Tot Students who do not play guitar 17.08547 8.287749 14.60399 17 49288 25.37322 32.09687 57 47009Students who play guitar 18.43137 9.490196 16.66667 20.54902 27.92157 37.21569 65.13725
70
605040302010
0^ < SS ^ ÏM «■ e - e 5 c «
« « f i l m (0 (0 2
O
n Students who do not play guitar
■ Students who play guitar

TABLE 14D76
The Influence of The Home Musical Environment:A Comparison of Mean Scores
No piano in student's home Piano in student's home
Part 1 Part 2 Part 3A Part 38 Section 1 Section 2 Grand Tot 15.71779 7.411043 12.76074 14.51534 23.12883 27.27607 50.40491 18.22407 9.120332 16.21577 20.07469 27.3444 36.29046 63.63485
70605040302010
0^ SS «• e - e Ç Ç S
(0 (0 2 O
□ No piano in student's home
■ Piano in student's home

77
TABLE 15
CORRELATION OF OUTSIDE SINGING AND TEST SCORES
Outside singing Aural Scores
Singing Saction 1 Section 2
Singing 1Aural Scores Section 1 0.134098 1Mel. » Rhy. I.D. Scores Section 2 0.161529 0.61216294 1

78
TABLE 16
CORRELATION OF EXPERIENCE LEVEL OF CHOIR AND TEST SCORES
Exp of Ch.______PM______P t2 Pt3a Pt3b Soctioni Section 2 TotalExp. of Ch Pt 1 Pt2 Pt3a R3b Section 1 Section 2 Total
10.54828
0.8154420.827650.84162
0.7094090.8467790.824874
10.7088540.7867620.7453890.9502990.77333
0.852562
10.89758
0.8376980.8932280.8749110.904869
0.9466050.8976910.9824510.981515
0.8448890.9901270.969555
10.8791240.942848 0.987692

79
TABLE 17
CORRELATION OF TEACHER EXPERIENCE AND TEST SCORES
Tkrm in Dist yrs Bxp P t i P t2 Pt3ë Pt 3b Smction 1 Section 2 TotêtColumn Column : Pt 1 Pt 2 Pt 3a Pt 3b Section Section Total
0.4502870.5174460.1004160.2085750.1218880.401180.1651050.24983
10.3389640.242620.2354410.1470270.3291370.1917040.243533
0.6938070.8145560.7811090.962810.8172130.888207
0.8413190.7856460.8625770.8321290.864302
10.897140.8878790.9683510.966322
10.8435
0.9790030.958516
10.8863
0.948243 0.987487
Top Related