


Languages
Pages
Legal


1
Provincial Budgets and Expenditureas at 30 June 2008
(2008/09 Financial Year)[Section 32 of PFMA]
Select Committee on Finance
National Council of Provinces
Presented by:
Intergovernmental RelationsNational Treasury
August 2008

2
Key priorities for 2008 MTEF (1)
• Education– Early Childhood Development (0-4)
– Textbooks for Grades 10-12 to support the NCS
– Expansion of Grade R
– Expansion of Inclusive Education (Learners with disabilities)
– Education Personnel

3
Education Provincial forecasting trends: 2004/05 - 2008/09
Table: Education Provincial forecast trends for 2004/05, 2005/06, 2006/07, 2007/08 and 2008/09 financial years
2004/05 2005/06 2006/07 2007/08 2008/09
Actual expenditure
as % of appro-
priation 1
Pre-audited under/ over(-)
Actual expenditure
as % of appro-
priation 1
Pre-audited under/ over(-)
Actual expenditure
as % of appro-
priation 1
Pre-audited under/ over(-)
Actual expenditure
as % of appro-
priation 1
Pre-audited under/ over(-)
Actual expenditure
as % of appro-
priation 2
Projected under/ over(-)
30-Apr 6.6% -582 312 8.1% -332 096 6.9% 143 538 7.1% 100 337 7.1% -94 034
31-May 14.1% -652 517 16.4% -405 967 14.6% -205 433 15.2% -198 253 15.9% -549 833
30-Jun 22.4% -247 442 24.4% -866 329 22.1% -459 080 21.9% -27 319 23.8% -2 267 575
31-Jul 30.8% -390 095 32.6% -823 412 29.9% -1 019 288 30.5% -131 579
31-Aug 38.6% -637 194 40.6% -1 014 664 38.6% -1 429 070 39.8% -1 556 277
30-Sep 46.7% -1 412 194 49.0% -2 071 199 46.6% -1 534 688 47.9% -1 825 059
31-Oct 56.5% -1 174 102 57.6% -2 393 837 55.0% -1 916 482 56.6% -1 567 431
30-Nov 64.1% -23 703 64.6% -834 119 63.2% -767 407 65.1% -797 050
31-Dec 72.6% 43 403 73.4% -736 917 72.3% -635 579 73.7% -327 985
31-Jan 80.0% 553 141 81.3% -610 405 79.8% 295 403 80.7% 732 561
28-Feb 88.0% 879 400 89.5% -172 736 87.6% 1 227 145 89.6% 1 156 941
31-Mar 98.1% 1 267 515 99.6% 279 177 98.3% 1 350 316 98.6% 1 241 484
R thousand
1. The actual expenditure as at 30 November to 31 March is compared with the adjusted appropriation.
4
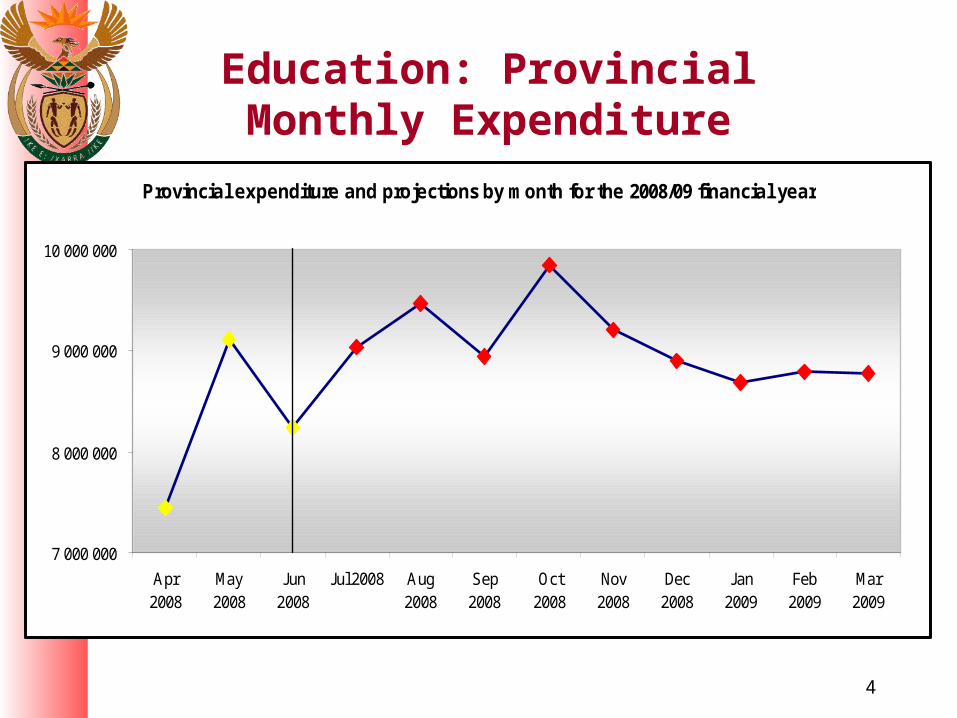
Education: Provincial Monthly Expenditure
Provincial expenditure and projections by month for the 2008/09 financial year
7 000 000
8 000 000
9 000 000
10 000 000
Apr2008
May2008
Jun2008
Jul 2008 Aug2008
Sep2008
Oct2008
Nov2008
Dec2008
Jan2009
Feb2009
Mar2009
5
Provincial Social Services (2)
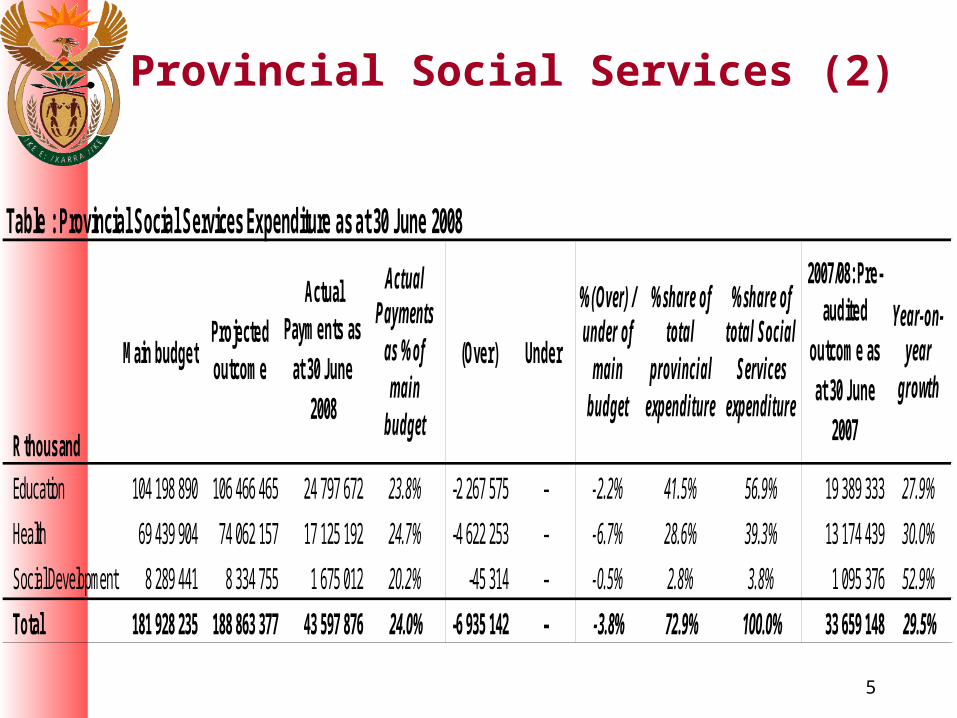
Table : Provincial Social Services Expenditure as at 30 June 2008
Education 104 198 890 106 466 465 24 797 672 23.8% -2 267 575 – -2.2% 41.5% 56.9% 19 389 333 27.9%
Health 69 439 904 74 062 157 17 125 192 24.7% -4 622 253 – -6.7% 28.6% 39.3% 13 174 439 30.0%
Social Development 8 289 441 8 334 755 1 675 012 20.2% -45 314 – -0.5% 2.8% 3.8% 1 095 376 52.9%
Total 181 928 235 188 863 377 43 597 876 24.0% -6 935 142 – -3.8% 72.9% 100.0% 33 659 148 29.5%
% share of total
provincial expenditure
% share of total Social
Services expenditure
2007/08: Pre-audited
outcome as at 30 June
2007
Year-on-year
growth
Actual Payments
as % of main
budget
(Over) Under
% (Over) / under of
main budget
R thousand
Main budgetProjected outcome
Actual Payments as
at 30 June 2008

6
Education (1)
• Spending at R24.8bn or 23.8% against R104.2bn main budget• Projected overspending of R2.3bn (mostly Personnel) in 4
provinces– Increase of R5.4bn or 27.9% compared to the previous year– Low rate of education spending in GP (22.2%) and LP (22.3%) – NC (29.4%) and KZN (25.3%) reflects the highest rate of spending in
education • Education Personnel spending at R19.5bn or 24.6% (R79.3bn main
budget)– Projected overspending of R1.8bn in 8 provinces– Projected underspending of R4.7m in GP
• Goods and services (mostly LSM) at R2bn or 16.2% (R12.1bn main budget) – Projected overspending of R251m
• Capital spending at R684.2m or 14.2% – Represents an increase of R64.3m or 10.4% compared to pre-audited
outcome last year– Low rate of capital spending in GP (2.3%) and WC (9.4%) – NC (48.1%) and MP (27.1%) reflects the highest rate of capital
spending in education

7
Education (2)
Table : Provincial Education Expenditure as at 30 June 2008
Eastern Cape 17 810 197 17 775 843 4 144 624 23.3% – 34 354 0.2% 43.3% 57.2% 2 880 087 43.9%
Free State 6 598 569 7 312 481 1 607 078 24.4% -713 912 – -10.8% 40.1% 55.1% 1 287 128 24.9%
Gauteng 16 629 082 16 629 082 3 691 388 22.2% – – 0.0% 31.3% 52.0% 2 965 273 24.5%
Kw aZulu-Natal 21 389 127 21 964 150 5 417 381 25.3% -575 023 – -2.7% 42.3% 56.4% 4 178 294 29.7%
Limpopo 14 221 050 14 837 503 3 169 951 22.3% -616 453 – -4.3% 49.5% 61.5% 2 662 859 19.0%
Mpumalanga 8 934 232 8 922 289 2 238 959 25.1% – 11 943 0.1% 50.2% 66.8% 1 726 747 29.7%
Northern Cape 2 601 238 2 601 238 766 001 29.4% – – 0.0% 46.0% 60.6% 519 143 47.6%
North West 6 995 482 7 403 966 1 636 688 23.4% -408 484 – -5.8% 42.9% 60.5% 1 418 449 15.4%
Western Cape 9 019 913 9 019 913 2 125 602 23.6% – – 0.0% 40.2% 49.8% 1 751 353 21.4%
Total 104 198 890 106 466 465 24 797 672 23.8% -2 313 872 46 297 -2.2% 41.5% 56.9% 19 389 333 27.9%
% share of Education
to total provincial
expenditure
% share of Education
to total Social serv expenditure
2007/08: Pre-audited
outcome as at 30 June
2007
Year-on-year
growth
Actual Payments
as % of main
budget
(Over) Under
% (Over) / under of
main budget
R thousand
Main budgetProjected outcome
Actual Payments as
at 30 June 2008

8
Education: Public Ordinary Schools
Table : Provincial Public Ordinary School Education Expenditure (Programme 2) as at 30 June 2008
Eastern Cape 15 021 023 15 006 810 3 474 523 23.1% – 14 213 0.1% 36.3% 83.8% 2 554 627 36.0%
Free State 4 864 844 5 387 975 1 221 021 25.1% -523 131 – -10.8% 30.5% 76.0% 1 000 812 22.0%
Gauteng 13 185 378 13 185 378 2 731 847 20.7% – – 0.0% 23.2% 74.0% 2 153 622 26.8%
Kw aZulu-Natal 18 184 148 18 759 171 4 408 729 24.2% -575 023 – -3.2% 34.4% 81.4% 3 524 184 25.1%
Limpopo 12 090 967 12 597 587 2 788 647 23.1% -506 620 – -4.2% 43.6% 88.0% 2 358 431 18.2%
Mpumalanga 7 227 282 7 321 805 1 925 331 26.6% -94 523 – -1.3% 43.2% 86.0% 1 490 146 29.2%
Northern Cape 2 058 858 2 046 541 586 010 28.5% – 12 317 0.6% 35.2% 76.5% 402 405 45.6%
North West 5 854 226 6 242 710 1 379 920 23.6% -388 484 – -6.6% 36.2% 84.3% 1 192 543 15.7%
Western Cape 7 267 732 7 267 732 1 752 483 24.1% – – 0.0% 33.1% 82.4% 1 468 093 19.4%
Total 85 754 458 87 815 709 20 268 511 23.6% -2 087 781 26 530 -2.4% 33.9% 81.7% 16 144 863 25.5%
% share of POSE to
total provincial
expenditure
% share of POSE to
total Education
expenditure
2007/08: Pre-audited
outcome as at 30 June
2007
Year-on-year
growth
Actual Payments
as % of main
budget
(Over) Under
% (Over) / under of
main budget
R thousand
Main budgetProjected outcome
Actual Payments as
at 30 June 2008

9
Education: Personnel
Table : Provincial Personnel Expenditure: Education as at 30 June 2008
Eastern Cape 13 843 318 13 869 991 3 120 680 22.5% -26 673 – -0.2% 58.2% 75.3% 2 756 793 13.2%
Free State 4 910 055 5 460 060 1 273 895 25.9% -550 005 – -11.2% 55.6% 79.3% 1 056 826 20.5%
Gauteng 12 315 991 12 311 254 2 998 831 24.3% – 4 737 0.0% 55.2% 81.2% 2 433 570 23.2%
Kw aZulu-Natal 16 572 749 17 068 058 4 091 480 24.7% -495 309 – -3.0% 56.6% 75.5% 3 371 327 21.4%
Limpopo 10 842 526 11 128 075 2 788 824 25.7% -285 549 – -2.6% 61.1% 88.0% 2 370 997 17.6%
Mpumalanga 6 624 303 6 710 744 1 736 409 26.2% -86 441 – -1.3% 63.6% 77.6% 1 382 090 25.6%
Northern Cape 1 953 794 1 974 336 515 799 26.4% -20 542 – -1.1% 57.2% 67.3% 408 769 26.2%
North West 5 533 677 5 788 359 1 342 417 24.3% -254 682 – -4.6% 57.7% 82.0% 1 143 829 17.4%
Western Cape 6 744 600 6 784 096 1 675 707 24.8% -39 496 – -0.6% 53.0% 78.8% 1 353 240 23.8%
Total 79 341 013 81 094 973 19 544 042 24.6% -1 758 697 4 737 -2.2% 57.5% 78.8% 16 277 441 20.1%
R thousand
Main budgetProjected outcome
Actual Payments as
at 30 June 2008
Actual Payments
as % of main
budget
(Over) Under
% (Over) / under of
main budget
% share of Education Personnel
to total personnel
expenditure
% share of Education personnel
to total Education
expenditure
2007/08: Pre-audited
outcome as at 30 June
2007
Year-on-year
growth
10
Education: Capital
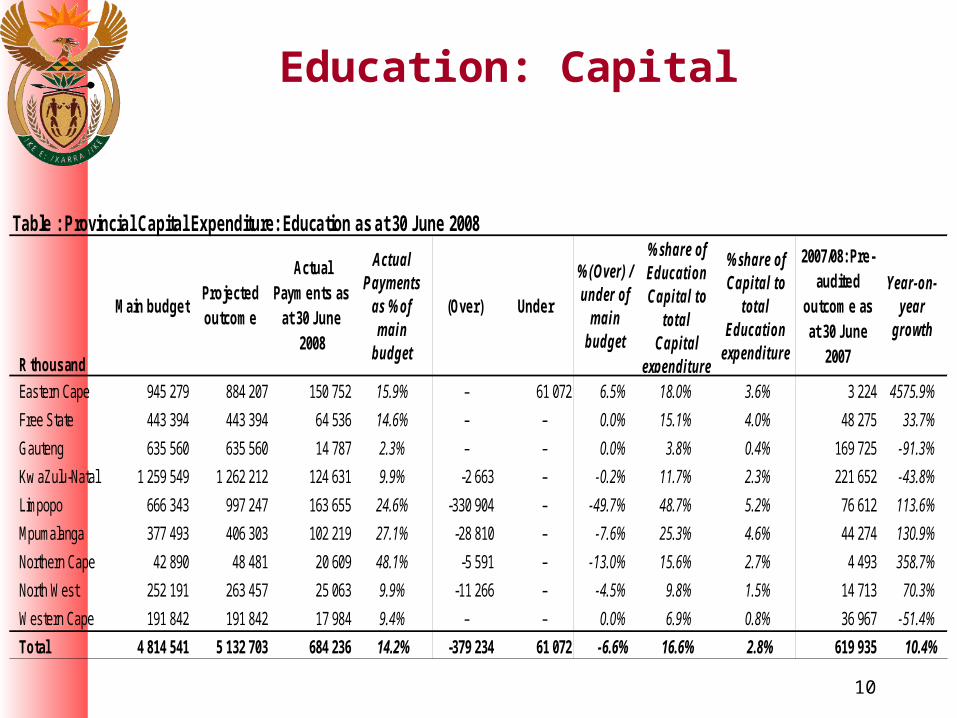
Table : Provincial Capital Expenditure: Education as at 30 June 2008
Eastern Cape 945 279 884 207 150 752 15.9% – 61 072 6.5% 18.0% 3.6% 3 224 4575.9%
Free State 443 394 443 394 64 536 14.6% – – 0.0% 15.1% 4.0% 48 275 33.7%
Gauteng 635 560 635 560 14 787 2.3% – – 0.0% 3.8% 0.4% 169 725 -91.3%
Kw aZulu-Natal 1 259 549 1 262 212 124 631 9.9% -2 663 – -0.2% 11.7% 2.3% 221 652 -43.8%
Limpopo 666 343 997 247 163 655 24.6% -330 904 – -49.7% 48.7% 5.2% 76 612 113.6%
Mpumalanga 377 493 406 303 102 219 27.1% -28 810 – -7.6% 25.3% 4.6% 44 274 130.9%
Northern Cape 42 890 48 481 20 609 48.1% -5 591 – -13.0% 15.6% 2.7% 4 493 358.7%
North West 252 191 263 457 25 063 9.9% -11 266 – -4.5% 9.8% 1.5% 14 713 70.3%
Western Cape 191 842 191 842 17 984 9.4% – – 0.0% 6.9% 0.8% 36 967 -51.4%
Total 4 814 541 5 132 703 684 236 14.2% -379 234 61 072 -6.6% 16.6% 2.8% 619 935 10.4%
% share of Education Capital to
total Capital
expenditure
% share of Capital to
total Education
expenditure
2007/08: Pre-audited
outcome as at 30 June
2007
Year-on-year
growth
Actual Payments
as % of main
budget
(Over) Under
% (Over) / under of
main budget
R thousand
Main budgetProjected outcome
Actual Payments as
at 30 June 2008
11
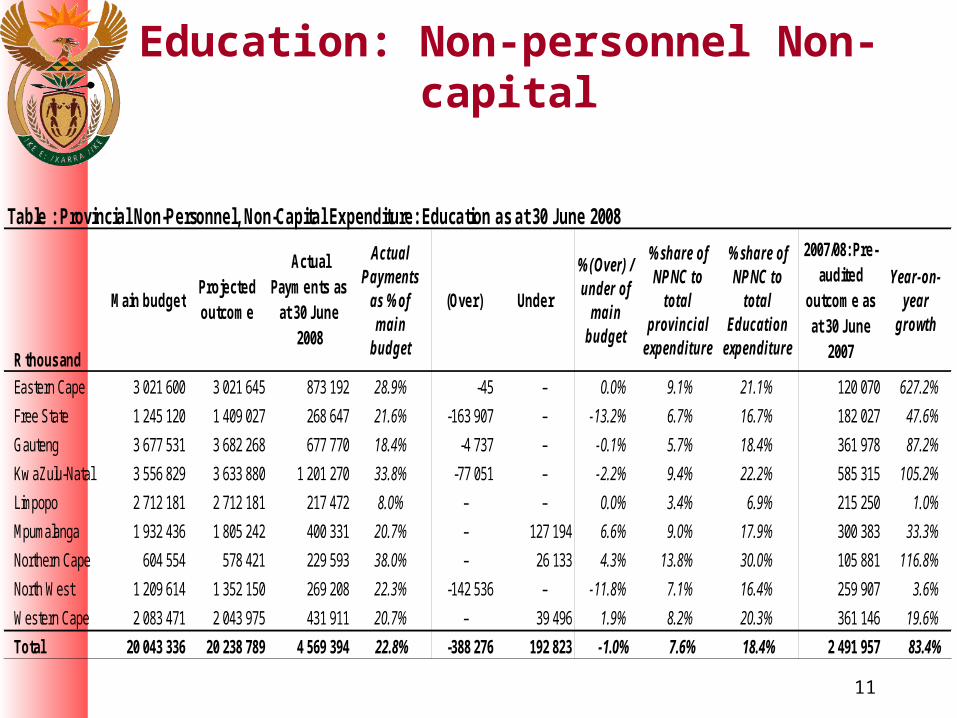
Education: Non-personnel Non-capital
Table : Provincial Non-Personnel, Non-Capital Expenditure: Education as at 30 June 2008
Eastern Cape 3 021 600 3 021 645 873 192 28.9% -45 – 0.0% 9.1% 21.1% 120 070 627.2%
Free State 1 245 120 1 409 027 268 647 21.6% -163 907 – -13.2% 6.7% 16.7% 182 027 47.6%
Gauteng 3 677 531 3 682 268 677 770 18.4% -4 737 – -0.1% 5.7% 18.4% 361 978 87.2%
Kw aZulu-Natal 3 556 829 3 633 880 1 201 270 33.8% -77 051 – -2.2% 9.4% 22.2% 585 315 105.2%
Limpopo 2 712 181 2 712 181 217 472 8.0% – – 0.0% 3.4% 6.9% 215 250 1.0%
Mpumalanga 1 932 436 1 805 242 400 331 20.7% – 127 194 6.6% 9.0% 17.9% 300 383 33.3%
Northern Cape 604 554 578 421 229 593 38.0% – 26 133 4.3% 13.8% 30.0% 105 881 116.8%
North West 1 209 614 1 352 150 269 208 22.3% -142 536 – -11.8% 7.1% 16.4% 259 907 3.6%
Western Cape 2 083 471 2 043 975 431 911 20.7% – 39 496 1.9% 8.2% 20.3% 361 146 19.6%
Total 20 043 336 20 238 789 4 569 394 22.8% -388 276 192 823 -1.0% 7.6% 18.4% 2 491 957 83.4%
% share of NPNC to
total provincial
expenditure
% share of NPNC to
total Education
expenditure
2007/08: Pre-audited
outcome as at 30 June
2007
Year-on-year
growth
Actual Payments
as % of main
budget
(Over) Under
% (Over) / under of
main budget
R thousand
Main budgetProjected outcome
Actual Payments as
at 30 June 2008

12
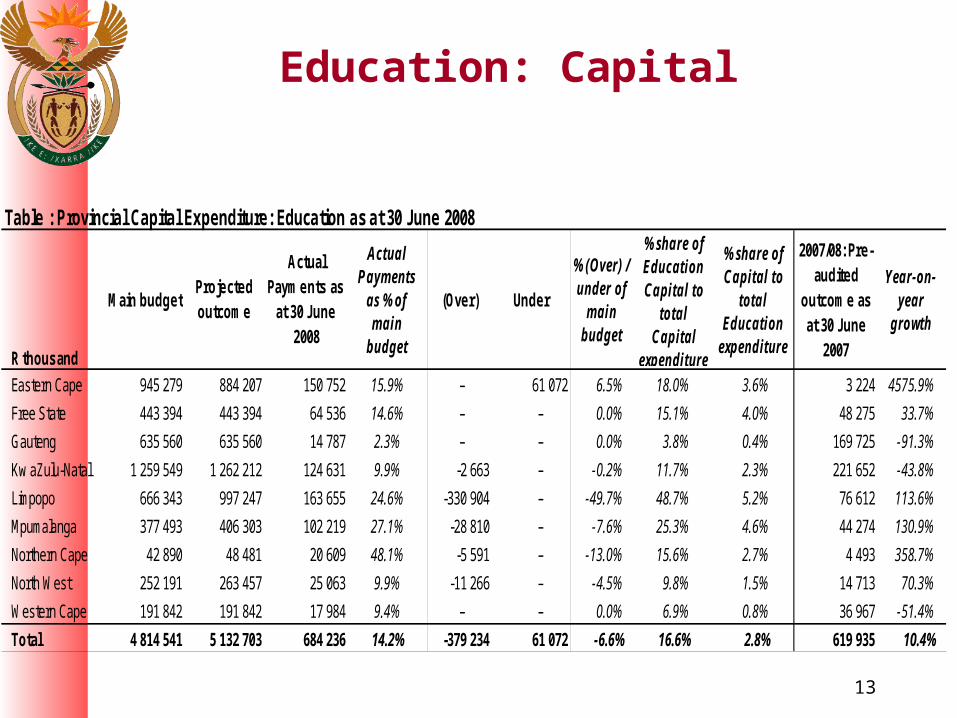
• Education capital spending at R684.2m or 14.2%
– Represents an increase of R64.3m or 10.4% compared to spending last year
– Wide fluctuations compared to last year’s pre-audited outcome
– Low rate of education capital spending in GP (2.3%) and WC (9.4%)
– NC (48.1%) and MP (27.1%) reflects the highest rate of capital spending in education
Payments for Capital Assets (Education and Health)
13
Education: Capital
Table : Provincial Capital Expenditure: Education as at 30 June 2008
Eastern Cape 945 279 884 207 150 752 15.9% – 61 072 6.5% 18.0% 3.6% 3 224 4575.9%
Free State 443 394 443 394 64 536 14.6% – – 0.0% 15.1% 4.0% 48 275 33.7%
Gauteng 635 560 635 560 14 787 2.3% – – 0.0% 3.8% 0.4% 169 725 -91.3%
Kw aZulu-Natal 1 259 549 1 262 212 124 631 9.9% -2 663 – -0.2% 11.7% 2.3% 221 652 -43.8%
Limpopo 666 343 997 247 163 655 24.6% -330 904 – -49.7% 48.7% 5.2% 76 612 113.6%
Mpumalanga 377 493 406 303 102 219 27.1% -28 810 – -7.6% 25.3% 4.6% 44 274 130.9%
Northern Cape 42 890 48 481 20 609 48.1% -5 591 – -13.0% 15.6% 2.7% 4 493 358.7%
North West 252 191 263 457 25 063 9.9% -11 266 – -4.5% 9.8% 1.5% 14 713 70.3%
Western Cape 191 842 191 842 17 984 9.4% – – 0.0% 6.9% 0.8% 36 967 -51.4%
Total 4 814 541 5 132 703 684 236 14.2% -379 234 61 072 -6.6% 16.6% 2.8% 619 935 10.4%
R thousand
Main budget
Actual Payments
as % of main
budget
Under
Actual Payments as
at 30 June 2008
% share of Education Capital to
total Capital
expenditure
Projected outcome
(Over)Year-on-
year growth
2007/08: Pre-audited
outcome as at 30 June
2007
% share of Capital to
total Education
expenditure
% (Over) / under of
main budget

14
Conditional Grants

15
Conditional Grants (2)
• Spending on the Further Education and Training College Sector Recapitalisation grant is at 47.5 % or R378 million and reflects actual transfers from the provincial education departments to the FET colleges
• FET colleges’ expenditure is at 25.3 % or R100.4 million of the R397.5 million received from the provincial education departments
• Expenditure by colleges published in Government Gazette of 30 July 2008
– Information provided by national Department of Education
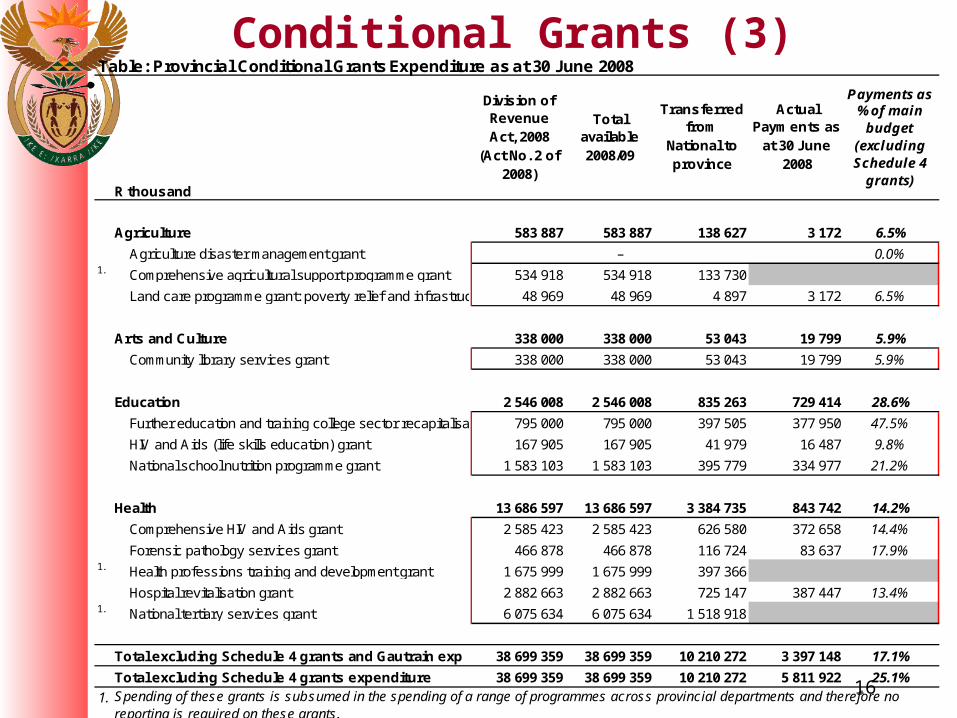
16
Conditional Grants (3)Table: Provincial Conditional Grants Expenditure as at 30 June 2008
Column I - percentages: Remember to change to column F
w hen adjustments estimate has been
Agriculture 583 887 583 887 138 627 3 172 6.5%
Agriculture disaster management grant – 0.0%1. Comprehensive agricultural support programme grant 534 918 534 918 133 730 0.0%
Land care programme grant: poverty relief and infrastructure development48 969 48 969 4 897 3 172 6.5%
Arts and Culture 338 000 338 000 53 043 19 799 5.9%
Community library services grant 338 000 338 000 53 043 19 799 5.9%
Education 2 546 008 2 546 008 835 263 729 414 28.6%
Further education and training college sector recapitalisation grant795 000 795 000 397 505 377 950 47.5%
HIV and Aids (life skills education) grant 167 905 167 905 41 979 16 487 9.8%
National school nutrition programme grant 1 583 103 1 583 103 395 779 334 977 21.2%
Health 13 686 597 13 686 597 3 384 735 843 742 14.2%
Comprehensive HIV and Aids grant 2 585 423 2 585 423 626 580 372 658 14.4%
Forensic pathology services grant 466 878 466 878 116 724 83 637 17.9%1. Health professions training and development grant 1 675 999 1 675 999 397 366 0.0%
Hospital revitalisation grant 2 882 663 2 882 663 725 147 387 447 13.4%1. National tertiary services grant 6 075 634 6 075 634 1 518 918 0.0%
Total excluding Schedule 4 grants and Gautrain exp 38 699 359 38 699 359 10 210 272 3 397 148 17.1%
Total excluding Schedule 4 grants expenditure 38 699 359 38 699 359 10 210 272 5 811 922 25.1%
1. Spending of these grants is subsumed in the spending of a range of programmes across provincial departments and therefore no reporting is required on these grants.
R thousand
Division of Revenue Act, 2008
(Act No. 2 of 2008)
Total available 2008/09
Transferred from
National to province
Actual Payments as
at 30 June 2008
Payments as % of main
budget (excluding Schedule 4
grants)
17
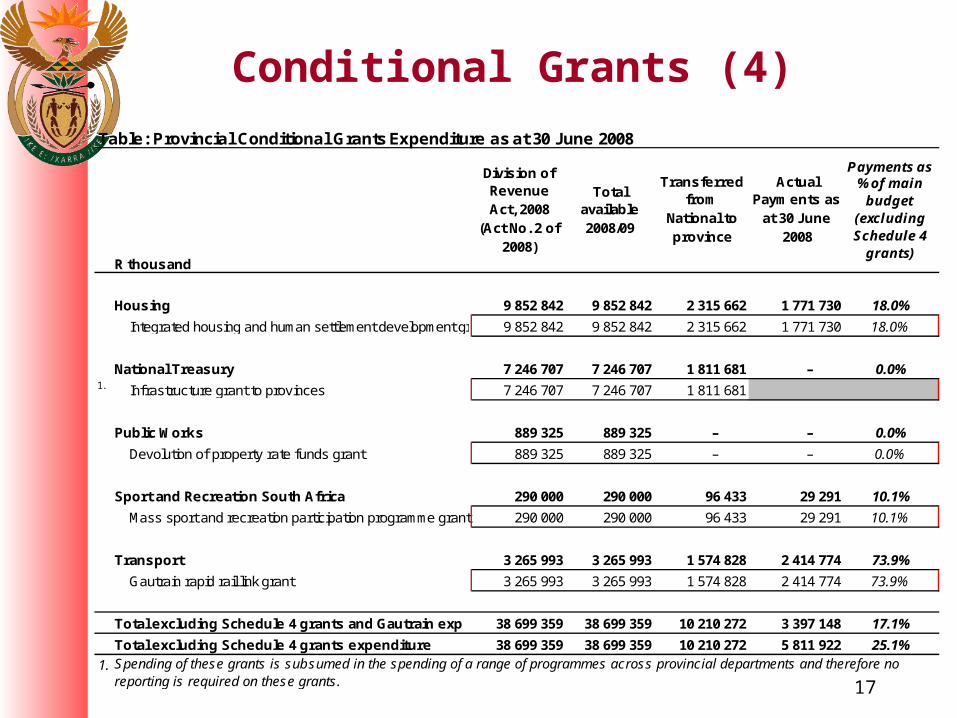
Conditional Grants (4)
Table: Provincial Conditional Grants Expenditure as at 30 June 2008
Column I - percentages: Remember to change to column F
w hen adjustments estimate has been
Housing 9 852 842 9 852 842 2 315 662 1 771 730 18.0%
Integrated housing and human settlement development grant 9 852 842 9 852 842 2 315 662 1 771 730 18.0%
National Treasury 7 246 707 7 246 707 1 811 681 – 0.0%1. Infrastructure grant to provinces 7 246 707 7 246 707 1 811 681 0.0%
Public Works 889 325 889 325 – – 0.0%
Devolution of property rate funds grant 889 325 889 325 – – 0.0%
Sport and Recreation South Africa 290 000 290 000 96 433 29 291 10.1%
Mass sport and recreation participation programme grant 290 000 290 000 96 433 29 291 10.1%
Transport 3 265 993 3 265 993 1 574 828 2 414 774 73.9%
Gautrain rapid rail link grant 3 265 993 3 265 993 1 574 828 2 414 774 73.9%
Total excluding Schedule 4 grants and Gautrain exp 38 699 359 38 699 359 10 210 272 3 397 148 17.1%
Total excluding Schedule 4 grants expenditure 38 699 359 38 699 359 10 210 272 5 811 922 25.1%
1. Spending of these grants is subsumed in the spending of a range of programmes across provincial departments and therefore no reporting is required on these grants.
R thousand
Division of Revenue Act, 2008
(Act No. 2 of 2008)
Total available 2008/09
Transferred from
National to province
Actual Payments as
at 30 June 2008
Payments as % of main
budget (excluding Schedule 4
grants)

18
Conditional Grants – Spending Rates
Table 16: Selected Conditional Grants Spending Rate as at 30 June 2008
Number of provinces spent less than 10%
Number of provinces spent between 10% and 20%
(inclusive)
Number of provinces spent more than 20%
Agriculture
Land Care Programme: Poverty Relief and Infrastructure Development7 EC, GT, LIM, MPU, NC, NW, WC 1 KZN 1 FS
Arts and Culture
Community Library Services Grant 9 All provinces Education
Further Education And Training College Sector Recapitalisation1 MPU 8 EC, FS, GT, KZN, LIM, NC, NW, WC
HIV and Aids (Life Skills Education) 5 EC, GT, KZN, LIM, NW 1 FS 3 MPU, NC, WC
National School Nutrition Programme 1 GT 4 KZN, LIM, NW, WC 4 EC, FS, MPU, NC Health
Comprehensive HIV and Aids 2 GT, KZN 3 FS, MPU, NW 4 EC, LIM, NC, WC
Forensic Pathology Services 5 EC, FS, GT, KZN, MPU 4 LIM, NC, NW, WC
Hospital Revitalisation 3 KZN, LIM, MPU 4 GT, NC, NW, WC 2 EC, FS Housing
Integrated Housing and Human Settlement Development 7 EC, GT, KZN, LIM, NC, NW, WC 2 FS, MPU Sport and Recreation South Africa
Mass Sport and Recreation Participation Programme5 EC, GT, LIM, NC, NW 3 FS, KZN, WC 1 MPU
Transport
Gautrain Rapid Rail Link 1 GT
Percentages represent actual expenditure of main budget as published in the Division of Revenue Act, 2008 (Act No.2 of 2008).

19
THANK YOU
THANK YOU
THANK YOU
Top Related