


Languages
Pages
Legal


Security : HDB Financial
Services Limited
ISIN : INE756I01012
Industry – Banking and Finance
Synopsis Shareholding by
(From the trusted family of HDFC Bank) HDFC Bank Limited
• HDB Financial Services (HDB), incorporated in Ahmedabad, India, is a leading Non-Banking Financial Company (NBFC) that caters to the growing needs of an aspirational India, serving both Retail & Commercial Clients. It is a Systemically Important Non-Deposit taking Non-Banking Financial Company (‘NBFC’).
• Incorporated in 2007, HDB is a well-established business with strong capitalization. They are accredited with CARE AAA & CRISIL AAA ratings for its long-term debt & Bank facilities and an A1+ rating for its short-term debt & commercial papers, making it a strong and reliable financial institution.
• HDB Financial Services Limited is a subsidiary company of HDFC Bank Limited.
• As of March 31, 2021, HDB has 1,319 branches in 959 cities in India. The Company’s data centers are located in Bengaluru and Mumbai with centralised operations based out of Hyderabad, Chennai, and Noida.
• HDB maintains a strong commitment to ethical conduct. Transparency is ingrained in the structure of our Code of Ethics and our compliance policies to ensure that the highest standards of professional conduct are consistently reinforced and embedded in every corner of the organization
• Vision - To Be India’s most Admired NBFC; Through Great Execution, Driving Simplicity & Developing Humility.
• .
95%
5% HDFC
OTHERS
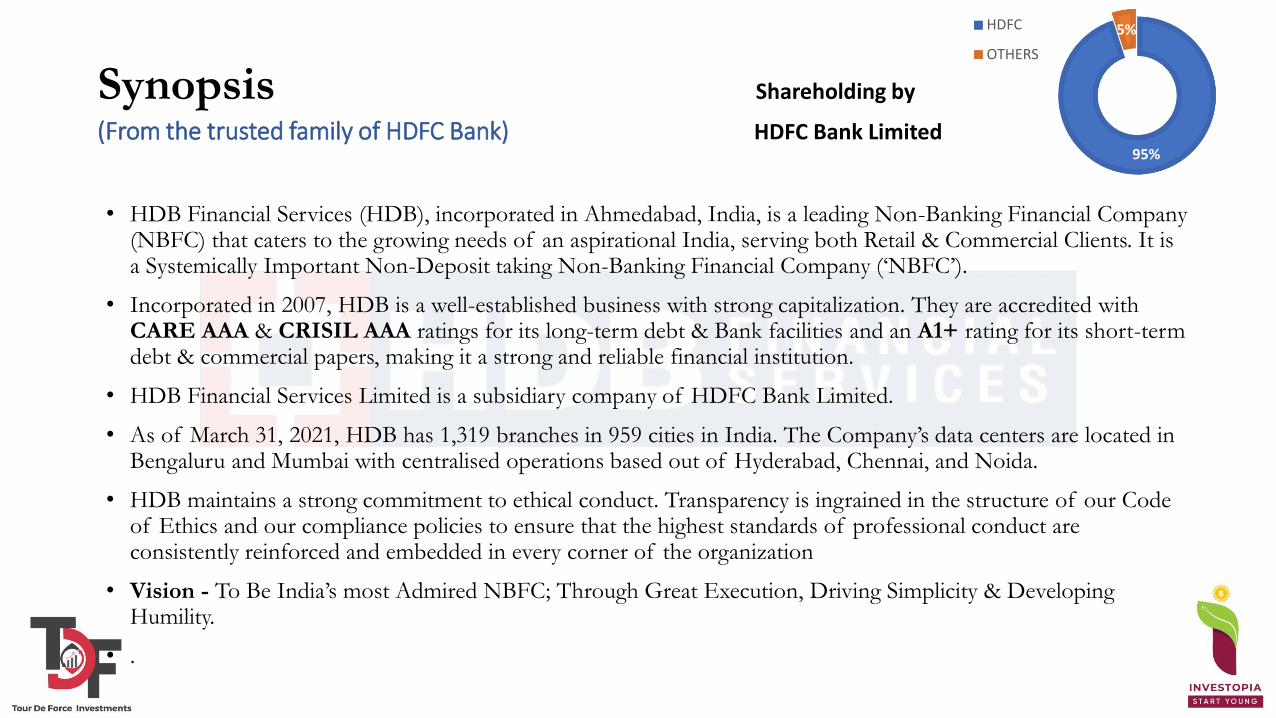
Products Offered to Salaried
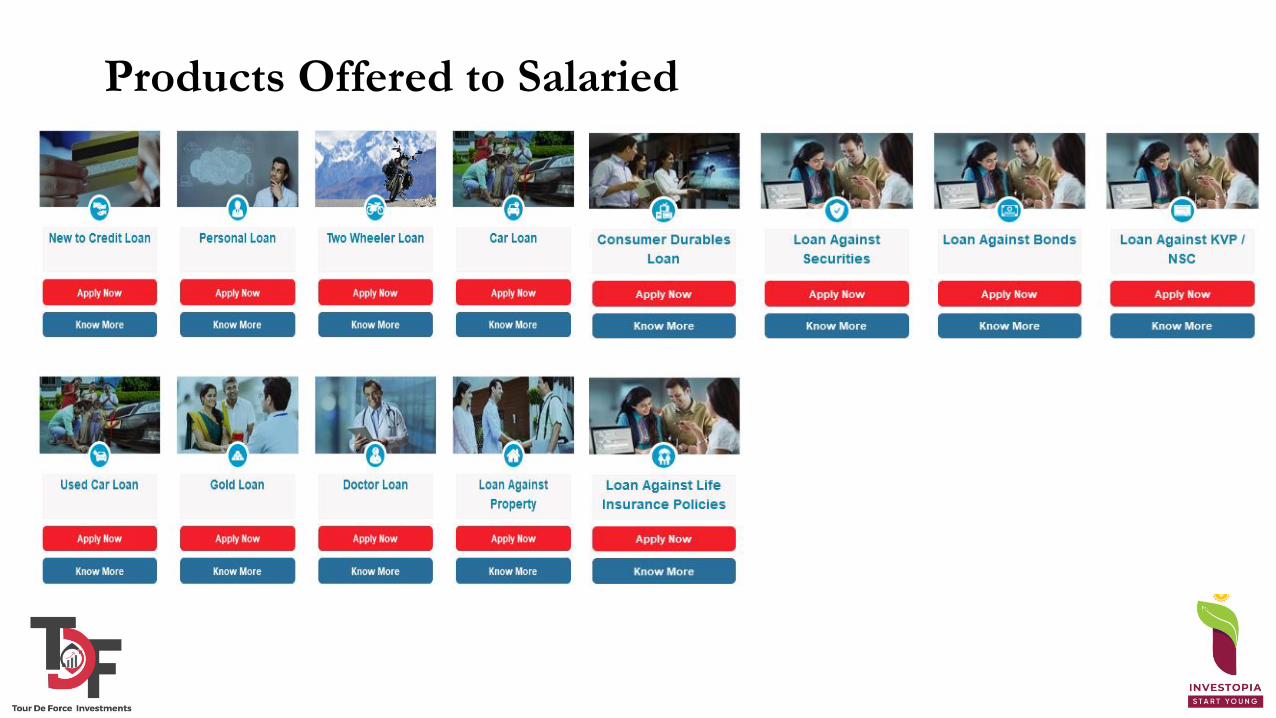
Products Offered to Self Employed
www.hdbfs.com

Products Offered to Business
www.hdbfs.com

Products Offered to Self Employed Professionals
www.hdbfs.com
Promoters and Management
Mr. Adayapalam Viswanathan
Independent Director
Mr. G Ramesh Independent Director
Mr. Venkatraman Srinivasan
Independent Director
Ms. Smita Affinwalla Independent Director
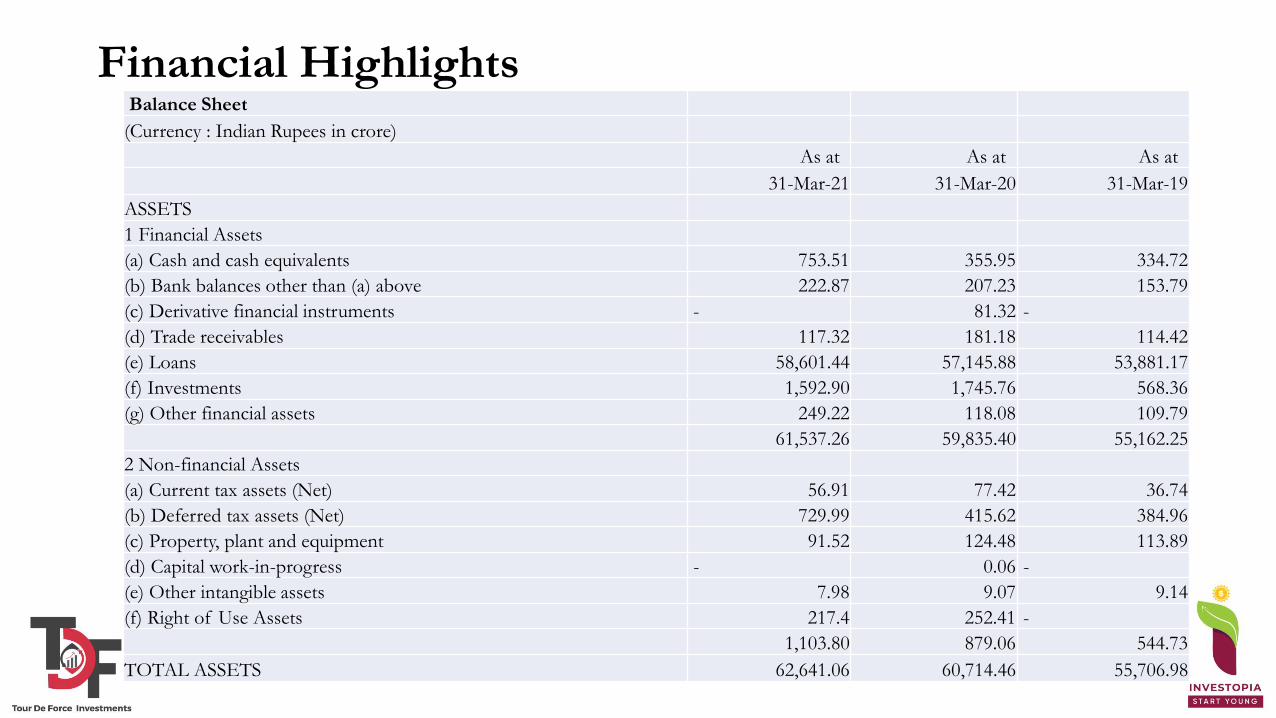
Financial Highlights Balance Sheet
(Currency : Indian Rupees in crore)
As at As at As at
31-Mar-21 31-Mar-20 31-Mar-19
ASSETS
1 Financial Assets
(a) Cash and cash equivalents 753.51 355.95 334.72
(b) Bank balances other than (a) above 222.87 207.23 153.79
(c) Derivative financial instruments - 81.32 -
(d) Trade receivables 117.32 181.18 114.42
(e) Loans 58,601.44 57,145.88 53,881.17
(f) Investments 1,592.90 1,745.76 568.36
(g) Other financial assets 249.22 118.08 109.79
61,537.26 59,835.40 55,162.25
2 Non-financial Assets
(a) Current tax assets (Net) 56.91 77.42 36.74
(b) Deferred tax assets (Net) 729.99 415.62 384.96
(c) Property, plant and equipment 91.52 124.48 113.89
(d) Capital work-in-progress - 0.06 -
(e) Other intangible assets 7.98 9.07 9.14
(f) Right of Use Assets 217.4 252.41 -
1,103.80 879.06 544.73
TOTAL ASSETS 62,641.06 60,714.46 55,706.98
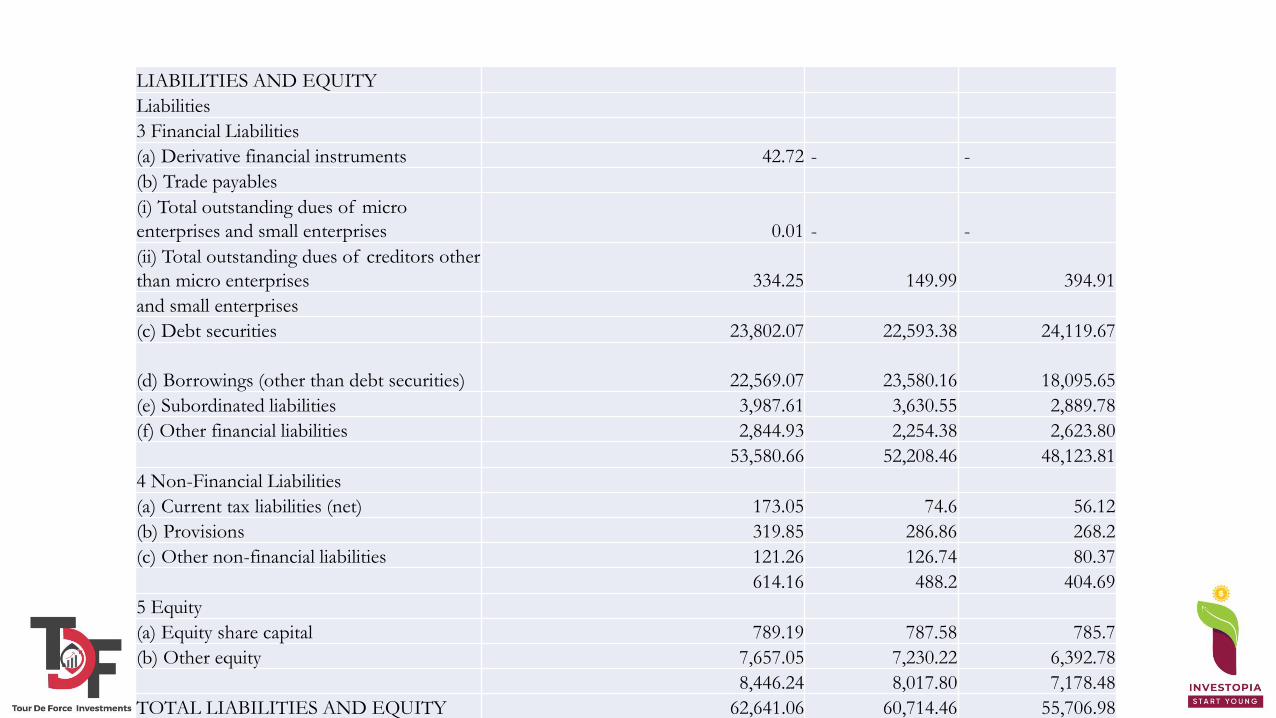
LIABILITIES AND EQUITY
Liabilities
3 Financial Liabilities
(a) Derivative financial instruments 42.72 - -
(b) Trade payables
(i) Total outstanding dues of micro
enterprises and small enterprises 0.01 - -
(ii) Total outstanding dues of creditors other
than micro enterprises 334.25 149.99 394.91
and small enterprises
(c) Debt securities 23,802.07 22,593.38 24,119.67
(d) Borrowings (other than debt securities) 22,569.07 23,580.16 18,095.65
(e) Subordinated liabilities 3,987.61 3,630.55 2,889.78
(f) Other financial liabilities 2,844.93 2,254.38 2,623.80
53,580.66 52,208.46 48,123.81
4 Non-Financial Liabilities
(a) Current tax liabilities (net) 173.05 74.6 56.12
(b) Provisions 319.85 286.86 268.2
(c) Other non-financial liabilities 121.26 126.74 80.37
614.16 488.2 404.69
5 Equity
(a) Equity share capital 789.19 787.58 785.7
(b) Other equity 7,657.05 7,230.22 6,392.78
8,446.24 8,017.80 7,178.48
TOTAL LIABILITIES AND EQUITY 62,641.06 60,714.46 55,706.98
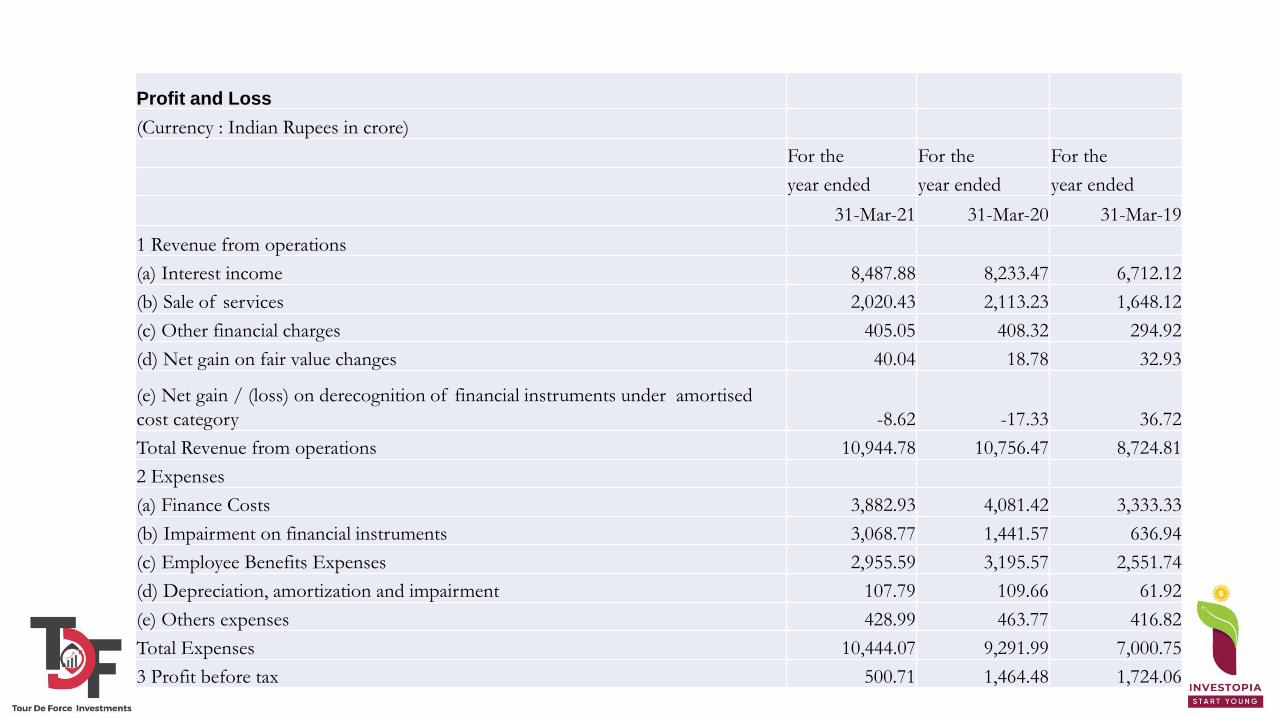
Profit and Loss
(Currency : Indian Rupees in crore)
For the For the For the
year ended year ended year ended
31-Mar-21 31-Mar-20 31-Mar-19
1 Revenue from operations
(a) Interest income 8,487.88 8,233.47 6,712.12
(b) Sale of services 2,020.43 2,113.23 1,648.12
(c) Other financial charges 405.05 408.32 294.92
(d) Net gain on fair value changes 40.04 18.78 32.93
(e) Net gain / (loss) on derecognition of financial instruments under amortised
cost category -8.62 -17.33 36.72
Total Revenue from operations 10,944.78 10,756.47 8,724.81
2 Expenses
(a) Finance Costs 3,882.93 4,081.42 3,333.33
(b) Impairment on financial instruments 3,068.77 1,441.57 636.94
(c) Employee Benefits Expenses 2,955.59 3,195.57 2,551.74
(d) Depreciation, amortization and impairment 107.79 109.66 61.92
(e) Others expenses 428.99 463.77 416.82
Total Expenses 10,444.07 9,291.99 7,000.75
3 Profit before tax 500.71 1,464.48 1,724.06

4 Tax Expense:
(a) Current tax 419.09 471.78 648.99
(b) Deferred tax (credit) -309.85 -12.15 -87.34
(c) Income tax for earlier year - 9.17
Total Tax expense 109.24 459.63 570.82
5 Profit for the year 391.47 1,004.85 1,153.24
6 Other Comprehensive Income
(a) Items that will not be reclassified to profit or loss
- Remeasurement gain/(loss) on defined benefit plan -20.97 -26.59 -5.27
- Income tax relating to items that will not be reclassified to profit or loss 5.28 6.69 1.84
Sub total (a) -15.69 -19.9 -3.43
(b) Items that will be reclassified to profit or loss
- Movement in cash flow hedge reserve 2.99 -46.95 -
- Income tax relating to items that will be reclassified to profit or loss -0.75 11.82 -
Sub total (b) 2.24 -35.13 -
Other Comprehensive Income -13.45 -55.03 -3.43
7 Total Comprehensive Income for the year 378.02 949.82 1,149.81
8 Earnings per equity share (for continuing operations)
Basic (`) 4.97 12.78 14.71
Diluted (`) 4.97 12.77 14.69

Insights • The significant increase in total income in FY21 is due to the significant profits made by bank on the interest
from loans and sale of services through its BPO services & Lending Business.
• Lending business has grown by 3% and BPO services got shrunk by 4% in FY20-21 as compared to last year.
• PAT has reduced from 1005 Crores to 391 Crores in FY20-21 mainly on account of "impairment of financial
instruments" which has increased from 1442 Crores to 3069 Crores i.e., surge of 113% due to COVID-19
pandemic.
• Loan disbursements during the year were ` 24,990 crore as against ` 29,853 crore in the previous year.
• The Assets under Management (AUM) of the Company as at March 31, 2021 increased to ` 61,560.67 crore from
` 58,832.75 crore in the previous year.
• The Company has continued to focus on diversifying its products and expand its distribution to effectively deliver credit solutions to its market.
• HDB’s Credit-lending processes marked a defining trend by going fully digital during the pandemic. With an increased focus on providing its customers with a seamless experience, the Company is pushing the pedal on quicker loan application processes and swift disbursals.

Performance Highlights
1.83
3.87 4.5
1.26
3.19 3.22
2019 2020 2021
G.NPA N.NPA
8725
10756 10945
0
2000
4000
6000
8000
10000
12000
2019 2020 2021
REVENUE (CR)
1724 1464
501
0
500
1000
1500
2000
2019 2020 2021
PBT (CR)
1153 1005
391
0
500
1000
1500
2019 2020 2021
PAT (CR)
13.79
9.71
3.73
2019 2020 2021
NET PROFIT MARGIN (%)

Key Financial Ratios 2019 2020 2021
EPS 14.71 12.78 4.97
P/E 58.29 67.1 172.54
BVPS 91.36 101.8 107.2
P/BVPS 9.39 8.42 8
ROCE (%) 66.69 65.2 48.38
ROE (%) 16.07 12.53 4.63
CAR (%) 17.91 19.36 18.89
PBT MARGIN (%) 19.76 13.61 4.57
INTEREST COVERAGE RATIO(%) 1.51 1.36 1.13
D/E 6.28 6.21 5.96
CURRENT RATIO 1.15 1.15 1.15

HDB In Spotlight
• HDFC Bank Unit HDB Financials Looks To Shake Off Covid After Effects Ahead Of Value Unlocking
https://www.bloombergquint.com/business/hdb-financial-looks-to-shake-off-covid-after-effects-ahead-of-value-unlocking
• HDFC Bank Shelves HDB’s IPO Plans
https://timesofindia.indiatimes.com/business/india-business/hdfc-bk-shelves-hdbs-ipo-plans/articleshow/85082990.cms?utm_source=whatsapp&utm_medium=social&utm_campaign=TOIMobile
• HDFC Bank’s NBFC Arms Hold IPO Plans, To Raise Over Rs 8,600 Cr via Debt
HDFC Bank's NBFC arm holds IPO plans; to raise over Rs 8,600 crore via debt – BusinessToday
• HDB Financial Services plans to raise Rs 7,500 crore through NCDs
HDB Financial Services plans to raise Rs 7,500 crore through NCDs | Business Standard News (business-standard.com)
• Maruti Suzuki ties up with HDB Financial Services for providing car loan
Maruti Suzuki ties up with HDB Financial Services for providing car loan | Business Standard News (business-standard.com)

For more information from
the world of investments,
contact us -
Tour De Force Investments Private Limited
Address : 302, Westend Mall, Janakpuri, New Delhi - 110058
Email : [email protected]
Website : www.theinvestopia.com
Ph. No. : +91 11 46465250
The Utopia is real !
Top Related