


Languages
Pages
Legal


APRIL 30, 2013 FORTHCOMING IN OXFORD HANDBOOK ON INTERNATIONAL ANTITRUST ECONOMICS
EDITORS ROGER D. BLAIR AND D. DANIEL SOKAL
Screening for Collusion as a Problem of Inference
Michael J. Doane Competition Economics LLC, Emeryville, California 94608, [email protected]
Luke M. Froeb1 Owen Graduate School of Management, Vanderbilt University, Nashville, Tennessee 37203,
David S. Sibley Department of Economics, University of Texas, Austin, Texas, 78712, [email protected]
Brijesh P. Pinto
Competition Economics LLC, Emeryville, California 94608, [email protected]
We characterize screening for collusion as a problem of inference whose essential elements
include competitive null hypothesis (H0), a collusive alternative (H1), and an empirical
indicator (X) to differentiate between them. Using this framework, we review the
theoretical and empirical efforts to design screens and find that screens fail for one of three
reasons: (i) the empirical indicator cannot distinguish between H0 and H1; (ii) H0 is not
indicative of competition or H1 is not indicative of collusion; or (iii) the world is neither H0
nor H1. The often under-appreciated, second and third conditions imply that before using a
screen, the practitioners should make sure that the industry in question “fits” the theoretical
model or assumptions on which the screen is based.
Keywords: Collusion, screening, screen, Bayesian hypothesis testing, natural experiments, structural modeling.
JEL Classification: L10, L40
1 Corresponding author. We acknowledge useful comments from Joe Harrington, David Sappington, Danny Sokol, Bart Victor, and seminar participants at Vanderbilt University and the University of Florida.

1. Introduction In 1993, in the course of doing other research, Bill Christie and Paul Schultz noticed
that market makers were avoiding odd-eighth quotes on some of the most heavily traded
NASDAQ stocks. They tested and rejected a number of cost-based explanations for the
practice, and concluded that it was the result of collusion. The obvious benefit of odd-eighth
avoidance is that it raises the bid-ask spread, a measure of the “price” that market makers
charge for selling and buying stocks, to at least $0.25, over the regulatory minimum of
$0.125. At the time, the cost of trading stocks on NASDAQ was about twice the cost of
trading stocks on the NYSE, which used a more competitive auction-like mechanism
(Morgenson, 1993).
When the Los Angeles Times reported on the Christie and Schultz (1994) research,
the NASDAQ market makers suddenly (within a day) stopped avoiding odd-eighth quotes,
and the bid-ask spread on many stocks was cut in half. Professors Christie, Schultz, Harris
(1994) then published a companion piece titled “Why did NASDAQ market makers stop
avoiding odd eighth quotes?” which reached the same conclusion as the original article.
Together, the two papers lead to a raft of private suits and investigations by the US
Department of Justice and the Securities and Exchange Commission. Although not
originally designed as such, their research is arguably one of the most successful collusive
screens ever, and settlements to the antitrust suits have changed the way that NASDAQ
market makers trade stocks.
On October 12, 2012, US Representative Edward Markey wrote a letter to the
Chairman of the U.S. Federal Trade Commision (FTC) asking him to investigate whether oil
companies and refiners were “manipulating” gasoline prices in New England.2 His request
was triggered by the observation that while oil prices had been falling, gasoline prices had
not fallen by as much. Partially in response to these kinds of requests, a decade ago, the
FTC began regularly screening gasoline prices for collusion. Although the screening has yet
to uncover any conspiracies, screening seems to be catching on, as countries like Brazil and
Mexico have started similar programs (Levenstein and Suslow, 2013; Abrantes-Metz and
Bajari, 2010; and Harrington, 2008).
The question motivating this paper is “how well do screens for collusion work?” It is
hard to answer by looking at successful follow-on prosecutions. If a screen finds no
collusion, it could be that the screen is not working or that there is no collusion to be found.
2 See Markey (2012) and FTC (2012).

If a screen does find collusion, one has to look carefully at the resolution of the legal process
to determine exactly what happened. Even the NASDAQ market makers never admitted
colluding, and there is some uncertainty as to how the conspiracy actually worked. Despite
evidence of explicit communication, there were weak incentives for market makers to offer
better quotes (even without colluding) because better quotes did not necessarily capture
more order flow (Morgenson, 1993). Perhaps because of this uncertainty, the Department of
Justice chose to file a civil antitrust suit, which has a lower burden of proof, rather than a
criminal one.
So rather than looking at follow-on prosecutions, we address the issue by modeling
screening as a problem of inference whose essential elements include a competitive null
hypothesis, a collusive alternative, and an empirical indicator to differentiate between them.
For example, Christie, and Schultz (1994) were implicitly using a screen based on a null
hypothesis that costs were determining prices, a collusive alternative that odd-eighth
avoidance was increasing the “price” of trading, and a variety of empirical indicators to rule
out cost-based explanations and to show that odd-eighth avoidance was increasing price.
Likewise, Representative Markey was implicitly using a screen based on the null
hypothesis that competitive behavior results in a higher pass-through rate from wholesale
cost to retail price, the collusive alternative that cartels have a lower pass-through rate, and
estimated pass-through rates from oil prices to retail gasoline prices as an empirical indicator
to differentiate between the two. Broken down into these elements, it becomes easy to
critique his screen. In this case, Congressman Markey’s hypothesis that collusion has
lowered pass-through rates is at odds with simple models of price-setting behavior (Yde and
Vita, 1996; Froeb et al., 2005). If these models characterize behavior in the gasoline
industry, then the screen is likely to be a poor indicator of collusion.
In this paper, we use the taxonomy to better understand the conditions under which
screens are likely to succeed or fail. The first is that the empirical indicator may be too
“weak” to differentiate between H0 and H1, e.g., Kovacic et al. (2011).
The second is that the null hypothesis is not indicative of competition or that the
alternative is not indicative of collusion. For example, Representative Markey’s implicit
screen may work in some theoretical models, or may characterize some actual cases of
collusion. But absent evidence that the collusion or competition take the assumed forms, the
screen’s conclusions will be noisy indicators of collusion, at best. We call this the problem
of “model fit.”
The third reason that a screen may fail is that the world is neither H0 nor H1. In this
case, differentiating between H0 and H1 is not useful if the world is really H2. This third
criticism is similar to the second and stems from the same issue of model fit. Before using a
screen to differentiate between collusion (H0) vs. competition (H1), it is important to try to
rule out the existence of H2. This idea is illustrated by the NASDAQ screen. Christie and
Schultz (1994) and Christie, Harris, and Schultz (1994) rule out several different cost-based
explanations for odd-eighth avoidance, like adverse selection (informed traders are more
likely to trade at favorable quotes) and the cost of holding inventory until an order arrives.
Essentially, they reject a variety of hypotheses in favor of H1.3
In what follows, we formally draw the analogy between screening and Bayesian
hypothesis testing. Next, we review and discuss the theoretical and empirical literature,
breaking down each screen into its essential elements. We conclude by offering advice to
academics designing screens, and practitioners using them: if you know what form
competition (H0) and collusion (H1) are likely to take, and have a strong empirical indicator
to distinguish between the two, then a screen is likely to be successful. If, however, you do
not know the forms that competition and collusion are likely to take, or cannot rule out the
likelihood of alternate behavior (H2), then the screen is more likely to be plagued by type I
or type II errors.
We choose to ignore the problem of strategic behavior on the part of the colluders to
evade a known which can be thought of as a type of deterrence. We do this not because it is
not an important problem (every successful screen has this shortcoming) but rather because
screening is so young. We have to know whether screening is an efficient way to detect
conspiracies before we address the more difficult question of whether screens can also deter
them.
2. Screening as a problem of inference
a. Bayesian Hypothesis Testing
To study screens, we use the metaphor of statistical inference by specifying the
competing hypotheses, competition (H0) vs. collusion (H1), and a variable X that can
differentiate between them. Each hypothesis is related to the variable by a distribution
function,
: ~
3 Alternatively, H0 can be thought of as a composite hypothesis. For example, if H2 is another competitive (non collusive) hypothesis, then the researcher tries to differentiate between H0 or H2 vs. H1.

: ~
and the problem of inference is how to determine which hypothesis generated the observable
data , , … , . Each data point could be an individual observation, e.g., on
price or on margin, or a vector of what Kovacic et al. (2011) call “indicator variables” or
“plus factors.”
Although much of our analysis could be done using the metaphor of classical
hypothesis testing, we choose to work within the Bayesian framework because it can
accommodate both “structural” screening, based on prior beliefs, and “behavioral”
screening, based on data (Harrington, 2006). Our goal is to compute the posterior
probability of collusion given the data
||
| |
To do this, we have to specify prior beliefs, and , which are informed by
structural indicators such as evidence of past collusion or product homogeneity, e.g., Stigler
(1964) or whether the government is the potential conspiracy victim (e.g., Froeb et al.,
1993). A “neutral” or “uninformative” prior would have a prior belief characterized by
0.5.
These assumptions imply a prior belief about the data generating process,
1 ,
where represents our prior assessment that the industry is competitive. After
seeing the data, we construct the likelihoods of the competing hypotheses,
∏ )
∏ ).
They tell us how likely it is that each hypothesis generated the data. As written, the
likelihood equations imply that each piece of data, or each indicator variable, is independent
and drawn from the same continuous distribution (iid) but this is not necessary. The
likelihoods could be constructed from a vector of correlated factors, or from non-iid or
discrete data. We update our prior beliefs using the likelihood ratio or “Bayes Factor,”

,
which says that the posterior odds equals the prior odds times the likelihood ratio. The
posterior belief about the data generating process is
1
where | and 1 | is the posterior probability that H0 and H1 are
true. This represents our beliefs after updating them with data.
The final element to the screen is a way to turn the posterior belief into action. Here
we could imagine that a decision-maker (presumably a competition agency) could decide to
investigate an industry further if
| ,
which says that the probability of collusion is higher than some threshold. Some have
characterized 0.5 as “preponderance of evidence” standard and =0.95 as a “beyond all
reasonable doubt” standard. Alternatively, the decision maker could optimally choose to
minimize an expected loss function based on the costs of enforcement errors ( , as in
Froeb et al. (2006). In this case, investigate further if expected cost of Type I error (failure
to investigate when collusion is present) is greater than the expected cost of Type II error
(investigation when no collusion is present),
| | , or
|
|
Easterbrook (1984) argues that the market will more readily correct false acquittals than
false prosecutions, or that which would imply a higher optimal threshold for
investigation.
Even though few screens are characterized as a problem of inference, implicitly this
is what each is trying to do. Formally classifying them in this way allows us to understand
their elements, and more importantly to understand the conditions under which one would
expect them to succeed or fail.
The first reason for failure is that X is what Kovacic et al. (2011) call a “weak”
indicator. In this case, the likelihood ratio will be near one, and the posterior odds will be
close to the prior odds. In other words, the likelihood does not help us to distinguish
between the two hypotheses. In contrast, a “strong” indicator variable will have a likelihood
ratio away from one, which would shift the posterior odds towards one of the two competing
hypotheses.
The second reason for failure is that the null hypothesis is not indicative of
competition or that the alternative is not indicative of collusion. So even if the data can tell
us whether H0 or H1 is more likely to have generated the data, this doesn’t tell us very much
about whether collusion is present. To see how this leads to errors, imagine that H0 could
be consistent with either competition or collusion, but that H1 is consistent only with
collusion. If the likelihood favors the competitive hypothesis such that | , no
further investigation is taken. In this case, the screen is likely to miss collusive behavior.
Conversely, imagine that H0 is consistent only with competition, but H1 is consistent
with either competition or collusion. If the likelihood favors the collusive hypothesis such
that | , further investigation is taken. In this case, the screen will allocate
prosecutorial resources to an investigation with a low probability of finding collusion.
When both H0 and H1 are consistent with both competition and collusion, the probability
that the screen will commit both types of errors is high.
This mistake occurs when the theoretical models or assumptions on which the
screens are based do not fit the significant features of competition in the industry being
studied. If the theoretical models do not adequately characterize behavior in the industry to
which the screen is being applied, or if the collusive or competitive outcomes depend on
factors that cannot be observed or verified, then the screen is likely to work poorly. We
refer to this problem as one of model “fit.”
Some of the screens are based on instances of past collusion. For example, as
discussed more fully below, Abrantes-Metz, Froeb, Geweke, and Taylor (2006) note that
when a frozen fish conspiracy collapsed, the price went down by over 16%, but the standard
deviation of price (over time) went up by over 200%. Using this empirical analogy, they
construct a screen based on the coefficient of variation of price, and apply it to retail
gasoline. However, unless collusion in the gasoline industry takes a similar form to
collusion in frozen fish sold by auction to the government, then the screen is unlikely to
work very well. This is the same problem of fit, but here the “fit” is to a past instance of
collusion, not a theoretical model.
b. Screening vs. testing

One obvious question is what happens if neither H0 nor H1 generated the data? Our
Bayesian framework can be easily modified to admit a third alternative, which we call H2:
: ~
: ~
: ~
If H2 is known, this becomes what is known as a problem of “model selection” where we
choose between three alternatives. As above, we begin with a prior belief about the data
generating process,
1 ,
which we update with the likelihood in an analogous way.
If we don’t know about the existence of H2, the results of the previous section still
hold, i.e., we can still compute the relative odds of H0 vs. H1, but the computation of the
posterior probabilities will be wrong. In this case, we will mistakenly compute
||
| |
instead of
||
| | |
We find that this is a useful way to think about the difference between what we call testing
and screening. If you are “testing” for collusion, you know that the world is either H0 or H1,
but if you are “screening” for collusion you recognize that there may be other alternatives
like H2.
In other words, when “testing,” all you have to worry about is “sampling
uncertainty.” With enough data, or with good enough indicator variables you can estimate
the posterior probability with precision and take appropriate action. In contrast, when you
are unsure about the possibility of other alternatives (H2), the posterior probability will
reflect “model uncertainty” in addition to sampling uncertainty. This is closely related to the
problem of model fit discussed above. If you know that the world is either H0 or H1 (and
that H0 implies competition and that H1 implies collusion), with a strong enough indicator

variable, you can distinguish collusion from competition. However, if the world can also be
H2, then distinguishing between H0 and H1 is not likely to tell you very much about
collusion or competition.
4. Theoretical Screens The purpose of this section is to review some theoretical models of cartels and collusive
behavior that have been used to construct screens. By reviewing the literature, we highlight
the significant features of competition that each model is designed to capture, in addition to
the maintained assumptions on which the models are built. We elucidate these features and
assumptions for the purpose of highlighting the problem of model fit. Unless the model on
which the screen is based captures the significant features of competition in the industry
being screened, the screen is likely to perform poorly. The literature is summarized in Table
1.
Green and Porter (1984) show that periodic episodes of sharp drops in colluding firms’
prices and profits may be indicative of cartel self-enforcement. Departing from Stigler’s
(1964) notion that these episodes reflect the instability of cartels, Green and Porter show
instead that cartels may use price wars as a self-policing device. In their model, demand is
uncertain, and colluding firms engage in collusive behavior or Cournot behavior depending
on whether or not the market price is above an agreed-upon “trigger” price. The alternative
hypothesis of collusion is that output levels follow a switching process triggered by drops in
the market price. Green and Porter suggest that the American rail freight industry in the
1880s is an example of an industry that satisfies their assumptions on industry structure, and
exhibits the kind of collusion that they model.
Rotemberg and Saloner (1986) analyze an infinite-horizon dynamic model with
observable demand shocks in which firms compete either in Cournot or in Bertrand fashion.
In their model, a colluding firm’s incentive to cheat by undercutting the collusive price is
greater when demand is high. They show that in periods of high demand, colluding firms are
likely to behave more competitively. During these periods, the marginal benefit gained by a
colluding firm from “cheating” on the cartel is greater since the share of market captured is
larger. In response, the cartel reduces the collusive price to reduce the incentive to cheat.
This behavior generates countercyclical price and margin movements, i.e., the collusive
price and margin is lower when demand is high and higher when demand is low (H1). The
competitive hypothesis (H0) of competition is that price and margins are pro-cyclical with
respect to observable demand shocks.

Athey Bagwell, and Sanchirico (2004) develop a theory linking collusion and price
rigidity. They show that if firms are sufficiently patient and the distribution of firms’ costs is
log-concave, then optimal symmetric collusion in equilibrium is characterized both by price
rigidity and the absence of price wars. Athey, Bagwell, and Sanchirico analyze the
equilibrium of an infinite-horizon, repeated game model in which the stage game is one of
Bertrand competition among symmetric firms. Each firm possesses private information
about its marginal cost of production, and cost levels are independently and identically
distributed across firms. As discussed below, several empirical studies cite this paper as
suggesting that price rigidity (H1) can serve as a screen of collusive behavior in an industry
that satisfies their structural assumptions. Under the null hypothesis of competition (H0),
price varies more closely with cost.
Marshall, Marx, and Raiff (2008) analyze price announcements in the vitamins industry,
with a view to detecting collusion in the industry after 1985 They model public price
announcements in an industry with homogenous products and capacity constraints as a
multi-period game and show that in the absence of explicit collusive behavior (H0): (i) there
exist equilibria in which none of the firms makes price announcements; (ii) there exist
equilibria in which the larger firm leads a joint announcement, or makes a singleton
announcement – the larger firm makes an announcement in an earlier period while the
smaller firm does not make an announcement but sets its price in a later period; and (iii) no
equilibria exist in which the smaller firm makes a singleton announcement or leads a joint
announcement. Marshall et al. observe frequent joint price announcements in the collusive
post-1985 period. They also find that, relative to the pre-1985 period, announcements were
made well in advance of effective dates in the collusive period. Furthermore, they observe
that the timing of price announcements in the collusive period is consistent with regularly
scheduled cartel meetings. For these reasons, the authors conclude that the empirical
implications of their model are largely consistent with the absence of explicit collusion in
the vitamins industry prior to 1985, but consistent with the presence of explicit collusion
after 1985. Thus, according to Marshall et al., the model suggests collusive behavior in the
vitamins industry after 1985. We describe their empirical analysis in Section 4.
There is also a literature on optimal cartel pricing when detection is a possibility.
Harrington and Chen (2006) study a dynamic model of oligopoly with stochastic costs, in
which a firm that forms a cartel is detected with some probability. They assume that firms
have a common constant marginal cost of production and, essentially, that a firm’s cost in a
given period equals the sum of its cost in the previous period and a normally distributed cost
shock. Further, “buyers have the maintained hypothesis that price is an affine function of

cost and cost changes are normally distributed but do not know the coefficients to the
pricing function or the moments of the cost distribution.” Their analysis, while admittedly
exploratory and relying on strong maintained assumptions, is an attempt to enrich our
understanding of cartel pricing behavior. Simulating their model produces cartel price paths
with a transition phase followed by a stationary phase in which collusion (H1) reduces price
variation (X). The simulated cartel price paths resemble the price paths of real cartels, and
they take this as an encouraging sign that their model may help develop empirical tests for
cartel detection.
We take away two things from this brief review of theory. First is that these models of
collusive behavior are all somewhat stylized, based on a number of assumptions that may
not comport well with reality. What is important for our purposes is whether these models
can capture the significant features of competition in the industries to which screens based
on them are applied. This is another way of articulating the problem of “model fit.”
Second, there are a variety of ways to collude. The models reviewed illustrate a variety
of ways that firms can fix prices, but firms can also rig bids, allocate customers, agree to
shut down capacity, refrain from advertising or price discriminating, or even collude on
organizational form (Shor and Chen, 2009) as ways to reduce competition. When using a
screen based on one of these models, it is important to first figure out how competition and
collusion work and whether the screen would help you distinguish one from the other.
4. Empirical Screens The empirical literature on collusive screens may be categorized broadly into the
following categories: (1) screens based on the first and second moments of the price
distribution4; (2) screens based on structural modeling; and (3) screens based on various
cartel markers derived from models of firms’ pricing behavior. Table 1 presents a sample of
recent or significant papers that fall into these categories.
We use our earlier distinction between “screens” and “tests” for collusion in that screens
are designed to find unknown episodes of collusion, while tests are designed to test whether
indicator variables (X) can correctly identify known or suspected episodes of collusion.
Sometimes the distinction is not so clear or useful, but it is designed to capture the idea that
if you know the form of the conspiracy (H1) and how it differs from competition (H0), then
it should be easier to find a variable that correctly identifies the conspiracy because you are
4 A variation of this theme include studies that have examined changes in the first and second moments of market shares and price-cost margins. See, for example, Genovese and Mullin (2001).

more confident that your empirical model “fits” the form of the collusion. Screens, on the
other hand, are more exploratory in nature because the form of competition or collusion is
not known, or because there may exist alternate hypotheses (H2) not contemplated by the
screen.
A. Screens Based on First and Second Moments of Price Distribution
Empirical screens for collusive conduct have generally involved the examination of
pricing patterns that might be indicative of collusion. Along these lines, the U.S.
Department of Justice has identified five pricing patterns as possible indicators of explicit
collusion: (1) prices remain identical for long periods of time; (2) prices start to become
identical after being different previously; (3) price increases that appear not to be explained
by exogenous cost increases; (4) elimination of price discounts in a market where discounts
historically were given, and (5) local customers pay higher prices than more distant
customers.5 Empirical screens found in the academic literature have tended to follow this
approach with much research focused on examining changes in the first and second
moments of the price distribution. Below we discuss papers that are representative of this
body of research.
Froeb, Koyak, and Werden (1993) propose a method for estimating the price effects
of bid rigging and price fixing conspiracies based on the level of prices which controls for
cost differences and other factors that may be responsible for observed price differences
between collusive and competitive periods.6 They apply their estimator to a known
conspiracy involving bid rigging in the sale of frozen seafood to the Defense Personnel and
Support Center (“DPSC”) in Philadelphia.7 Based on an inspection of quantity-weighted bid
prices for frozen perch filets in procurements from July 10, 1984 through September 27,
1989, the authors divide their data into three distinct periods: a pre-conspiracy period
characterized by relatively constant prices despite big seasonal swings in fresh fish prices,
9/19/86-7/20/88; a “transition” period during which the conspiracy collapsed characterized 5 See U.S. Department of Justice, Antitrust Division, Price Fixing, Bid Rigging, and Market Allocation Schemes: What They Are and What to Look For, available at http://www.usdoj.gov/atr/public/guidelines/primer-ncu.htm. 6 They note that prior studies finding that profits or prices fell after antitrust enforcement action are unreliable because they ignore cost differences and other factors (see, for example, Erickson (1976) and Parker (1969)). 7 Five companies and associated individuals pleaded guilty to separate felonies and were fined.

by a rapid decline in the price of frozen perch while cost rose, mid July/88 to mid Sept/88;
and a post-conspiracy period, 9/28/88 – 9/27/89. The null hypothesis (competition) is that
the price of frozen perch was not statistically lower (on average) in the post-conspiracy
period than the pre-conspiracy period,8 controlling for cost differences.
To estimate “but-for” conspiracy prices, the authors use weekly time series data in
the post-conspiracy period and fit a regression model of frozen perch log price as a function
of current and lagged costs, as measured by fresh perch log prices. The model is used to
backcast but-for conspiracy price in two earlier periods that preceded the collapse of the bid
rigging scheme. They find the price during the conspiracy period is significantly above the
but-for predicted price in every auction, with an average cartel mark-up in the range of
23.1% to 30.4%, depending on the period chosen to define the conspiratorial conduct.
By examining the first and second moments from the same conspiracy collapse,
Abrantes-Metz, Froeb, Geweke and Taylor (“AFG&T”) (2006), propose a screen based on
the standard deviation of price normalized by its mean, or the coefficient of variation. They
find that while the mean price decreased by 16%, the coefficient of variation increased by
332% following the conspiracy collapse. The mean and standard deviation of the cost is also
higher under competition, but not by nearly enough to account for the increase in price.
Thus, the authors conclude that during the post-conspiracy period, price began to co-vary
more closely with cost, and thus exhibited larger variation (over time).
Based on this finding, the authors hypothesize that other conspiracies would exhibit
similar patterns, and apply their “variance screen” to retail gasoline stations in Louisville,
KY in 1996–2002. The Louisville area is considered a good candidate for collusion because
gasoline in Kentucky at both wholesale and retail is moderately concentrated and uses a
unique formation of gasoline, i.e., reformulated gasoline. They note that while a cartel the
size of a city would be costly to organize and police, there may be a degree of market power
conferred by the elimination of localized competition. The variance screen would identify a
potential cartel as a cluster of gasoline stations located close to one another exhibiting lower
price variation and higher prices relative to other stations in the city. They find no such
clusters and conclude competitive conduct is a more plausible explanation than collusion.
In contrast, Bolotova, Connor, and Miller (2008) find mixed evidence that price
variance during collusion is lower compared to that observed prior to the formation of a
cartel. The study considers two well-documented episodes of collusion: the lysine cartel
8 The authors assume that the gap between the two periods represents a transition from collusion to competition.

(1991-1995) and the citric acid cartel (1992-1995). They hypothesize that the mean price is
higher and the variance of the price is lower during collusive relative to non-collusive
periods. Using monthly average contract citric acid prices and average monthly lysine
prices, their statistical analysis is based on extensions of the traditional autoregressive
conditional heteroskedasticity (“ARCH”) and generalized ARCH models. They find that
mean prices are higher in both cartels during the collusive period. However, they find price
variance is lower during the lysine cartel, but higher during the citric acid conspiracy than it
was during more competitive periods. The authors suggest that foreign competition might
account for this outcome. They conclude that the variance screen may be a useful tool to
detect conspiracies that do not significantly raise price but tend to homogenize business
practices, which may raise profits and also reduce variance.
Abrantes-Metz, Kraten, Metz & Seow (2012) examine manipulation of the US dollar
1-month Libor rate. Their paper is motivated by a May 29, 2008 Wall Street Journal article
suggesting that several global banks were reporting Libor quotes significantly below those
implied by prevailing credit default swap (“CDS”). To test this claim, they compare Libor
with other short-term borrowing rates, analyze individual bank quotes, and compare these
individual quotes to CDS spreads during three periods: 1/1/07–8/8/07 (Period 1), 8/9/07–
4/16/08 (Period 2), and 4/17/08–5/30/08 (Period 3). The three periods are separated by two
dates in which major news events occurred: (1) on August 9, 2007, there were related press
releases on (i) a coordinated intervention by the European Central Bank, the Federal Reserve
Bank, and the Bank of Japan; (ii) AIG’s warning that defaults were spreading beyond the
subprime sector; and (iii) BNP Paribas’ suspension of three mortgage-backed funds; and (2)
on April 17, 2008, the British Banding Association (“BBA”) announced its intent to
investigate its Libor-setting process.
Their screening methodology propose three tests for collusion. First, they examine
the relationship between Libor and other major benchmarks, assuming those to be non-
manipulated at the time they are used as benchmarks. Specifically, they test whether the
Libor rate is manipulated downward during Period 2, relative to Periods 1 or 3. They cannot
reject the null hypothesis that Libor rates are from the same as the predicted rate. Thus, they
conclude that the evidence on the average level of the Libor rate is consistent with the
absence of a material manipulation.
The authors also examine the pattern of individual Libor quotes by 16 participating
banks. In particular, they examine how likely it is it that a large number of banks will
submit identical Libor quotes without coordinating. To that end, they first examine the
intra-day variance of these individual quotes. They also calculate the frequency with which

each bank appears in the “deciding group”9, and identify banks that tend to be in the
deciding group most often. They hypothesize that ‘‘manipulative’’ banks should cluster
together in non-random patterns. To test this, the authors compute pairwise correlations
between all possible bank-pairs and calculate the frequency with which each bank appears in
the deciding group, and identify a group of banks that tend to be in the deciding group very
often. From this analysis, the null hypothesis of nonrandom clustering patterns is rejected,
raising the possibility of manipulation.
The third collusion test follows from an analysis of the relationships between
individual Libor quotes and proxies for individual borrowing costs as determined by CDS
spreads. In particular, they examine whether banks with relatively low CDS spreads are also
banks with relatively low Libor quotes. They detect several banks whose ordinal positions in
Libor quotes are unrelated to their ordinal positions in CDS spreads, and raise the possibility
of manipulation.
Abrantes-Metz and Adanki (2007) propose a variance (over time) screen to detect
manipulation of commodity prices based on an analysis of the Hunt Brothers’ silver
manipulation episode of 1979-80. Their screen is based on the notion that manipulation
provides an informational advantage to manipulators over the rest of the market (i.e., market
participants are fooled). This implies that when market participants form expectations on
the likely levels of future prices, these forecasts are systematically wrong more often than
they would otherwise have been in the absence of manipulation. Thus, the variable of
interest is the variance in the forecasting error of future spot prices. If the collusion is
effective in reducing prices, this will result in more negative forecast errors.
Using daily futures and spot prices for silver from Comex from February 1975
through April 2004, their analysis examines the relationship between the futures contract
price at maturity date T and the realized spot price on that date. They find that the
coefficient of variation of the forecast errors is larger during the manipulation period, and
that this result holds when regression analysis is used to control for changes in
macroeconomic conditions.
Abrantes-Metz and Metz (2012) attempt to determine how far screens can go in
distinguishing explicit from tacit collusion. In doing so, they consider evidence from the
Libor setting. Their purpose is to determine whether movements in Libor rates are best
explained by noncooperative behavior, tacit collusion, or explicit collusion. Their analysis is
based on an inspection of the coefficient of variation (across banks) in daily Libor quotes for 9 Libor is established as the simple average of the middle set of eight quotes that are submitted by the sixteen participating banks. These eight banks comprise the “deciding group.”

a cross section of 16 participating banks. They find that the coefficient of variation is near
zero from early August 2006 through early August 2007, becoming abruptly positive
thereafter. They note that if all banks were submitting unique quotes each day (which
happened to average to the same level day after day), the coefficient of variation would be
larger. On the other hand, if all banks submitted essentially the same quote, the coefficient
of variation would be low, and if the middle eight quotes were identical, it would be zero.
Their test for noncooperative behavior is whether the observed convergence across
Libor quotes from the 16 participating banks is explained by identical borrowing costs. If
so, they note that the triggering of the financial crisis would have affected all banks equally.
Since the banks considered differ significantly in terms of their characteristics and
borrowing costs (i.e., they have asset portfolios of varying risk, varying liability structures,
and participate to different degrees in different market segments), they reject the
noncooperative hypothesis.
To distinguish between tacit and explicit collusion, the hypothesis is that the data
would be more consistent with tacit collusion if banks were “learning” from the strategic
reaction of the other banks. In this setting, a transition period would be observed in which
the variation of intraday quotes would be decreasing towards zero. Since an abrupt
transition to zero is observed, they conclude the data are inconsistent with tacit collusion.
The authors note that the tacit collusion hypothesis is further complicated by the fact that
individual bank quotes are sealed and are made public only after the Libor is computed.
Thus, if the banks submit the same quote day after day, and other banks were learning and
converging toward that common quote, the data may be described as consistent with tacit
collusion. On the other hand, if many banks submit a common sealed quote one day, and a
common but different sealed quote the next day, tacit collusion is a less likely explanation.
Based on an inspection of individual bank quotes, they conclude that the tacit collusion (or
learning theory) hypothesis does not fit the data well, leaving explicit collusion as the
explanation that is most consistent with the observed Libor quotes.
Eruthku and Hildebrand (2010) employ a differences-in-differences approach to
determine whether a public announcement of an antitrust investigation (which trigged the
collapse of a cartel) may be used to detect a price-fixing conspiracy. In May 2006, the
Canadian Competition Bureau publically announced its investigation of retail gasoline
markets in some local markets in Quebec. The authors test for collusion is whether retail
prices fell following the announcement. The study employs weekly retail and wholesale
prices for the period May 31, 2005 – May 22, 2007, providing 52 weeks of data before and
after the announcement. In a difference-in-difference regression analysis, Sherbrook is the

“treatment” city and Montreal and Quebec City are “control” cities. They find that the
announcement decreased the price differential between Sherbrook and Montreal by 1.75
cents per liter. This reduction is statistically significant at the 5 percent level. Interestingly,
the authors find that the variance of retail prices for all cities in their sample increased after
the announcement, but not significantly so.
Jiménez and Perdiguero (2012) apply a price variance (over time) screen to the retail
gasoline market in the Canary Islands, Spain. The Canary Islands were selected because
retail gasoline markets on different islands have different market structures. On some islands
the markets have more than one supplier, while each of the remaining two islands is
monopolized by a single supplier, the DISA company. The authors find that the coefficient
of variation of the companies on oligopolistic islands is between 1.06% and 8% higher in the
oligopolistic islands. From this, they conclude that a monopolistic firm follows a more rigid
price path than do retail outlets on the oligopolistic islands. However, we note that the null
hypothesis that the difference in means between the two groups is zero is not rejected using
a 95% level of significance. The authors conclude that analyzing the results of the variance
screen without comparing them to a benchmark would not enable them to draw any
definitive conclusions. Note also that the use of the monopoly islands as a collusive
benchmark (H1) may not be a good metaphor for kind of price rigidity that might occur
when multiple firms try to coordinate pricing.
The authors also employ a screen to try to find pockets of retailers with higher prices
and lower coefficients of variation, similar to the screen used by AFG&T (2006). Their
competitive benchmark is a retail gasoline supplier that traditionally competes more
aggressively on price: PCAN. The study tests whether PCAN stimulates competition using
two different approaches. The first involved examining prices and the coefficient of
variation for prices in towns with and without PCAN gas stations. They find prices are
always higher and the coefficient of variation smaller if PCAN is not present. The second
test is whether the presence of an independent retailer within a half-mile radius is correlated
to lower and more variable gasoline prices. They find both. Based on the variance screens,
they conclude that the average performance of the gas retail outlets (excluding those run by
PCAN) is very close to that shown on a monopolistic island, and further from CPAN.
Genesove and Mullin (2001) review the rules of the Sugar Institute and
meetings/notes among its members. The trade association was formed in December 1927
following several years of declining margins and excess capacity. The trade association’s
14 members comprised nearly all the cane sugar refining capacity in the U.S. The cartel did
not directly fix output or set prices but instead homogenized business practices, thereby

facilitating members’ ability to detect secret price cuts. The study is based on the average
weekly prices of refined sugar and its primary input cost, raw sugar, in the U.S. from 1914-
1941. Using these data, the authors calculate the yearly price-cost margin for sugar refining
in the U.S. for three periods: before, during, and after the cartel period. The authors use a
Lerner Index equal to 11% as a benchmark for monopoly pricing. This was the margin in
1892 when U.S. domestic refiners share and margin reached their highest level. The authors’
hypothesis is that price-cost margins are higher and the variance of margin lower in
collusive period than competition. The authors find that the conspiracy raised price-cost
margins to about 75% of the monopoly level and the variance in this margin dropped by
nearly 100% while the cartel remained active.
As noted above, the use of variance screens has become rather widespread in
empirical work. For example, Brannon (2003) summarizes research performed for the Joint
Economic Committee, US Congress on the effects of resale price maintenance laws on
petrol prices and station attrition in Wisconsin. The study concluded that, “the State of
Wisconsin enacted a policy that implicitly taxes its citizens for the benefit not just of small
independent stations but also for the large multinational oil companies that operate in
Wisconsin.” The article calculates the average margin and the variance for two markets that
were affected by this legislation, as well as a control group market. The results show that
the average margin was higher in the collusive markets, while the findings as regards to
variance were not particularly conclusive. In another example, Abrantes-Metz and Pereira
(2007) analyzed the mobile phone sector in Portugal before and after the entry of a new
operator, Optimus.10
B. Screens Based on Structural Models
Christie and Schultz (1994) provide evidence to show that in 1991, NASDAQ dealers
avoided odd-eighth quotes for 70 of 100 large, actively traded NASDAQ securities,
including Apple Computer and Lotus development. The avoidance of odd-eighth quotes
ensured an inside spread of at least $0.25 for these securities. The authors compare the dollar
spreads for the NASDAQ and NYSE/AMEX stocks and find a systematic difference in the
frequency of odd-eighth spreads in the two pools. For example, odd-eighth spreads of
$0.125 and $0.375 occur nearly three times as often for NYSE/AMEX securities than for
10 Other papers that discuss or apply the approach include Esposito and Ferroro (2006), Muthusany, McIntosh, Bolotova, and Patterson (2008), Abrantes-Metz (2011), and Abrantes-Metz and Bajari (2011).
NASDAQ securities, where the spreads are mostly in even-eighths, such as $0.25, $0.50,
and $0.75. The authors test which of three hypotheses best explains this odd-eighth
avoidance: (i) coarse pricing increments to lower negotiation costs, (ii) cost determinants of
the spread, and (iii) tacit collusion among dealers.
Finding that, in the data, larger trades are far more likely to occur on odd-eighth spreads
than smaller trades, the authors rule out the first hypothesis of negotiation costs. Next, the
authors use logistic regression analysis to determine that economic determinants such as
volume, volatility, market capitalization, and stock price do not play a role in predicting the
probability that stocks are quoted using odd eighths. By elimination, the authors conclude
that the only remaining hypothesis explaining the absence of odd-eighth spreads for
NASDAQ securities is tacit collusion among market makers.
Bresnahan (1987) attempts to explain a dramatic increase in U.S. automobile production
that occurred in 1955. In 1955, relative to the two surrounding years, automobile production
was higher by 45% and quality-adjusted prices lower. The paper tests the hypothesis that
there was a supply shock of a specific form: a one-year increase in the competitiveness of
conduct in the industry. A structural model of supply and demand is estimated to test the fit
of various firm behavioral hypotheses. Nonnested (Cox) hypothesis tests find that the
collusive outcome fits the data best in 1954 and in 1956, while the competitive outcome fits
the data best in 1955. Bresnahan’s paper is regarded as one of the few empirical studies
finding evidence of tacit collusion.
Rapson (2009) attempts to replicate the findings from Bresnahan’s 1987 study to
determine whether the conclusion of tacit collusion hinged on restrictive assumptions about
demand. In particular, he examines the independence of irrelevant alternatives assumption
(“IIA”) which makes demand a function only of the price and quality of adjacent models on
the quality spectrum, rendering non-adjacent price changes irrelevant to predicted demand.
Rapson notes that the restrictive demand specification could cause intra-firm pricing
strategies consistent with differentiated product Bertrand to be mistakenly interpreted as
collusion. To allow for more realistic demand behavior, he employs a random coefficients
logit model. He finds that for no year can Bertrand competition be rejected in favor of tacit
collusion. However, his results also indicate that firms were not maximizing profit during
this period. He concludes that a firm-competition model is rejected in favor of brand
competition in 1955, and is a better fit (though insignificantly) in 1954 and 1956.
Structural models have also been developed to analyze bidder collusion in auctions. In
an early paper commenting on the paucity (at the time) of economic literature on the subject
of collusion in auctions, Hendricks and Porter (1989) pointed out that the characteristics of a

collusive scheme in an auction depend on the rules of the auction and the nature of
auctioned object. They also expressed surprise that the empirical literature on collusion in
auctions was lacking even as detailed data sets were publicly available.
Porter and Zona (1993) develop an econometric test to detect “phantom bidding” in
procurement auctions, based on the differences in bidding between cartel members and non-
members. Their test exploits information on who was and was not in the cartel, and the form
of the conspiracy (cartel members used phantom bidding). Using procurement auction data
from the New York State Department of Transportation (“DOT”), Porter and Zona apply
their test to Nassau and Suffolk county DOT contract lettings from 1979-1985, and find that
the behavior of the collusive firms – one convicted in federal court of bid rigging and four
unindicted coconspirators – was statistically different from that firms that did not belong to
cartel.
In a related paper, Porter and Zona (1999) develop a test to detect bid rigging in school
milk procurement auctions. They list several characteristics of the school milk procurement
market that facilitate their analysis: an auction design that was well understood, a relatively
homogenous product, a fixed set of potential bidders in the short run, and a straightforward
production process. In 1994, the state of Ohio charged thirteen dairies with bid rigging in
school milk procurement auctions from 1980 to 1990. They compare the bidding behavior of
three defendant firms to that of non-defendant firms and find that each defendant firm’s
bidding function is statistically different from the bidding functions of non-defendant firms.
Porter and Zona also estimate the increase in price resulting from the collusion. They
determine that bid rigging resulted in a 6.5% increase in the price of milk paid by the school
districts.
Bajari and Ye (2003) develop a screen to detect bidder collusion in procurement auctions
where bidders are asymmetric with respect to their ex-ante costs. They posit two conditions
that are necessary and sufficient for competition in their model: conditional independence
and exchangeability. Under conditional independence, bids are independent after controlling
for publicly observable cost information. Exchangeability implies that only costs, not the
identities of other bidders, determine how a firm bids. Thus, Bajari and Ye’s null hypothesis
of competition is that bids satisfy both conditional independence and exchangeability. Bajari
and Ye apply their screen to the market for asphalt contracts in the 1994-1998 period, a
market with a known history of collusion in the 1980’s. They identify two pairs of firms that
fail both the conditional independence and exchangeability tests. Next, they use a Bayesian
framework to choose among three alternative models of industry equilibrium: (1)
competitive bidding by all firms, (2) collusive bidding by the first pair and competitive

bidding by all other firms, and (3) collusive bidding by the second pair and competitive
bidding by all other firms. They find that the posterior probability of the competitive model
is the highest, and conclude that the bidding in the market is competitive.
Marshall, Marx, and Raiff (2008) perform an empirical analysis to determine whether
the timing of price announcements (X) after 1985 in the vitamins industry is the result of
collusion rather than as the result of demand and cost phenomena (H0). They construct a
dataset comprising the dates and number of public price announcements in the United States
during the time period 1970-2001 for ten vitamin products. The authors estimate a logit
model for the probability that firms announce a price change in a given month as a function
of the number of months elapsed since the previous announced price change, and demand
and supply effects. The estimated coefficients of the logit regression show that for the two
time periods prior to 1985, the time elapsed from the previous announcement does not have
a significant effect on the probability of a new price announcement. However, the time
elapsed from the previous announcement has a significant effect on the probability of a new
price announcement for the two periods after 1985. Among demand and supply factors, the
only variable with a significant coefficient for any time period is the exchange-rate, with a
significant coefficient in the first time period after 1985. The authors interpret the results of
the logit regression as implying that after 1985, the timing of public price announcements is
tied to the timing of cartel meetings. Marshall et al. conclude that the probability of new
price announcements provides a potentially valuable tool for the identification of explicit
collusion. The alternative hypothesis of collusion (H1) is that there is a much higher
probability of price announcements (X) relative to a “clean” period.
C. Screens Based on Collusive Markers other than Price Screens
Collusive markers other than price have been have been used to try to detect cartels.
Economic theory predicts that certain industry characteristics manifest differently under the
presence of collusive behavior than under that of competitive behavior. These characteristics
have to do with industry processes such as market clearing, technological innovation, rate of
return, and product innovation among others.11 The outcomes of these processes are
different under competitive and collusive behavior, and, thus, serve as a means to detect
cartels.
11 See Lorenz (2008).

Blanckenberg and Geist (2009) postulate these six markers as a tool for testing the
“workability of markets.” These markers are (i) utilization rate of capacities, (ii) correlation
between the utilization rate of capacities and price changes, (iii) difference between the rate
of return in the industry to a broader comparison rate of return, (iv) correlation between the
rate of return difference and capacity growth rate changes, (v) variance of price changes, and
(vi) variance of capacity growth rate changes. Table 2 shows the null and alternative
hypotheses associated with these markers. While they admit that cartel formation is only one
of many reasons for the non-workability of markets, they suggest that the system of
collusive markers can be used by antitrust authorities as an aid in the detection of long-term
cartels. They also apply their screen as an empirical test using annual time-series data on
five German industries from 1980-2007. Among the five German industries they consider is
the German cement industry which is known to have had a cartel that lasted from 1981 to
2002. The other four industry serve as competitive benchmarks. Blanckenberg and Geist’s
system of markers correctly identifies the cement industry as collusive and the others as
competitive.
5. Conclusion
Collusion screens (and tests) have been used in an informal way to help determine
how to allocate scarce prosecutorial resources. As such, some might object to our formal
characterization of screens by analogy to Bayesian hypothesis testing. But all screens are
designed to help us make better decisions, so understanding exactly how they do this allows
us to reduce a collusion screen to its essential elements. We can compare and contrast the
growing number of screens that have been proposed by academics or used by practitioners.
in Table 3.
Formally modeling screening also allows us to better understand the conditions
under which screens are likely to fail. The first is that the empirical indicator may not be
able to differentiate between competition (H0) and collusion (H1). The second is that the
null hypothesis is not indicative of competition or that the alternative is not indicative of
collusion. The third is that the world is neither H0 nor H1. The second and third, often
under-appreciated reasons for failure, are due to what we call the problem of “model fit”: the
screen is based on assumptions that do not fit the industry to which the screen is being
applied.
This criticism is similar to that leveled against the use of structural oligopoly models for
merger screening (Froeb et al., 2004). Before a structural model is used to predict whether

mergers will raise price, enforcers should make sure that the model is able to characterize
the significant features of observed competition within the industry. The analogy to
criticism of the use of structural models for collusion screening is obvious.
Less obvious is the analogy to screens based on indicator variables chosen from past
episodes of collusion. Here the assumption on which the screen is based is that the industry
being screened exhibits collusive and competitive behavior similar to that of the industry in
which collusion occurred. Before the screen is used, practitioners should make sure that the
industry “fits” this often implicit assumption.
As a final note of caution, it is important to remember that all models, both theoretical
and empirical, are abstractions away from reality. This means that one can always find
some feature of the industry being screened that is at odds with the model assumptions. But
the art of model building is to determine whether this omission is likely to bias the screen’s
predictions, or whether the screen works well despite the omission.

24
Table 1: Collusion Theories
Study Model Issue Assumptions H1: Collusion X: Indicator Variable Green & Porter (1984)
Maintain cartel outputs given imperfect information about demand.
(1) Firms choose outputs; (2) market prices depends on market output and the realization of an unobserved demand shock; (3) firms choose outputs before the realization of the demand shock; infinite time horizon
Firms each choose a set cartel outputs unless market price falls below an agreed “trigger” level; at that point each firms reverts to its Cournot output given its expectations about the demand shock
Output level: Output follows a switching process triggered by a low market price.
Rotemberg & Saloner (1986)
Cartel pricing with observable demand shocks which are iid over time.
(1) Firms can be either Cournot or Bertrand; (2) market demand curve depends on prices (outputs) and the realization of an observable demand shock.
Cartel prices are chosen to make it unprofitable to defect from them, given the known state of demand and expectations about the future.
Price level: Cartel prices are counter-cyclical: when current demand is high relative to expected future demand, the temptation to cheat is greatest, meaning that cartel prices must fall to deter cheating; and vice versa when current demand is low.
Harrington & Chen (2006)
Optimal cartel pricing when detection is a possibility
(1) Firms have identical marginal cost, (2) cost is a specific stochastic process, (3) buyers believe price is a random walk, (4) buyers do not know collusive pricing function
Cartel price paths exhibit a transition phase and a stationary phase. During transition phase, price is independent of cost. During stationary phase, price responds to cost shocks.
Price level: cartel price path exhibits a transition and a stationary phase.
Marshall, Marx & Raiff (2008)
Inferring collusion from the absence or existence of pre-announced price changes.
(1) Predictions generated by a benchmark model of price announcements; (2) the price announcement model assumes fixed capacities and homogeneous products;(2) the subgame perfect equilibrium of this game involves a price leader(the largest firm) announcing price change before smaller firms; (3) under collusion, firms pre-announce price increases to convince strategic buyers that the price increases reflect general cost increases, and that strategic buying will not be profitable; (4) absent collusion, individual sellers do not have this concern, and do not pre-announce price changes.
(1) In cases of known collusion, did the pattern of price announcements differ from in the same industry during non-collusive period? (2) advance announcements of price change under collusion should be public, rather than private; (3) price announcements should come just before existing contracts are renewed, so as to convince a strategic buyer that there is no reason to switch sellers; they should not reflect cost or demand changes, but rather the length of time since the most recent expiration date of a contract between a cartel seller and its customer.
(1) Likelihood of price announcements: The likelihood of price announcements does not depend on costs of demand, but on the length of time since the last set of price announcements. (2) Frequency of price announcements: The frequency of price announcements increases greatly relative to a “clean” period.
Athey, Bagwell & Sanchirrico (2004)
Can a cartel subject to costs shocks display rigid pricing, in accordance with much collusion folklore?
(1) Bertrand stage game, in which the low priced firm(s) get all the business; (2) each firm gets an i.i.d. cost shock each period, which is private information; (3) each firm has identical beliefs about future cost shocks; (4) each firm reports its current period cost value to the cartel, along with the price implied by that cost; (5) each firm can credibly pre-commit to this price mechanism; (6) transfers are possible between cartel members; (7) each firm maximizes expected present value over infinite time horizon; (8) sequential equilibrium concept for cartel.
Result is that cartel pricing will display rigidity if cartel firms are patient enough and if the distribution function of future cost shocks is log-concave. Would need to test for these, which would be difficult. If one could verify these conditions then Ho is that the stage game is Bertrand and H1 is that you would never see sticky prices. If you did, this rules out the stage game, implying collusion.
Price level: Cartel prices will display rigidity.

25
Table 2: Empirical Tests/Screens
Study Screen? H1: Collusion H0: Competition X: Variable Data Conclusion Comments Category 1 Froeb, Koyak, & Werden (1993)
Test DOJ investigation Post-collusion period identified by drop in price
Price level Weekly time series, 1984- 1989. Aggregate weekly bid prices and cost of fresh perch
Collusion raised price by 23% Cost of fresh fish used as regressors (current and lagged) to control for cost
Genovese & Mullin (2001)
Test Profit margins higher and variance of margin lower No change in profit margin or variance in profit margin
Annual profit margins calculated from prices of refined and raw sugar.
Average weekly prices of refined and raw sugar in U.S., 1914-1941; output of Atlantic refiners; imports of refined sugar; and domestic sugar beet production.
Conspiracy raised price cost margin to about 75% of the monopoly level; rivals outside of collusive agreement responded to price increase by increasing output; variance in profit margin dropped by nearly 100% during conspiracy.
Paper review the rules of the Sugar Institute and meetings & communications among members. Conspiracy did not fix prices or output but homogenized business practices to make price cutting more transparent.
Abrantes-Metz, Froeb, Geweke & Taylor (2006)
Test Same as Froeb, Koyak, & Werden (1993) Same as Froeb, Koyak & Werden (1993)
Price coefficient of variation Same as Froeb, Koyak & Werden (1993)
Collusion raised price coefficient of variation by 332%
No control for cost
Screen Geographic clusters of gas stations with significantly lower price variance
No such clusters Price coefficient of variation Daily time series, 1996- 2002. Price data at 279 gas stations in Louisville.
No clusters of significantly lower price variance found.
Imputed missing price data using AR(1) process. No control for cost.
Abrantes-Metz & Adanki (2007)
Test Future spot prices are harder to predict using current spot prices in presence of collusion in spot market.
Future spot prices are easier to predict using current spot prices in presence of competition in spot market.
Forecasting error of future spot prices. Control variables include monthly interest rate, 10-yr T- bill rate, S&P 500 Index, monthly exchange rates for a basket of commodities
Daily data on futures and spot prices for silver from Comex, 2/75- 4/04.
Apply approach to the Hunt Brothers silver manipulation episode of early 1980s, and find that under manipulation the forecasting error is more volatile than under non-manipulation, controlling for market fundamentals
Some evidence that spot prices are more volatile when they are above futures prices, than when they are below.
Bolotova, Connor & Miller (2008)
Test Mean price is higher and variance in price is lower No support for hypothesized changes in first and second moments of price distribution.
Price level and variance. Analysis based on extensions of the autoregressive conditional heteroskedasticity (ARCH) model and generalized ARCH (GARCH).
Monthly average contract citric acid prices (2/90-4/97) and average monthly lysine (1/90-6/96)
mean prices are higher in both citric acid and lysine cartels; price variance during the lysine conspiracy was lower, whereas variance during the citric acid conspiracy was higher than it was during more competitive periods
“...variance is a useful tool for detecting conspiracies that do not significantly raise price but tend to control the price variance by homogenization of business practices, which may raise profits.”
Abrantes-Metz & Metz (2012)
Screen 1-month Libor rate nearly constant from 8/06-8/07. Almost no variation in the middle 8 bank quotes during same period. Tacit collusion: if banks were 'learning” from strategic interaction, there would be a transition towards convergence to an identical rate. Explicit collision: banks sealed bids move simultaneously to same bid from day to day.
Non-cooperative outcome: convergence across Libor quotes due to identical borrowing costs; triggering of financial crisis would affect all banks equally.
Coefficient of variation for individual 1-month Libor quotes for 16 banks. Comparisons of Libor rate to t-bill rate and federal funds effective rate.
Daily 1-month Libor quotes for 16 participating banks surveyed by the British Banking Association, 2006-2008.
Reject non-cooperative hypothesis because banks do not have identical borrowing costs and would be affected by financial crisis in different ways. Reject tacit collusion because convergence was immediate and sealed bids for individual banks moved to same bid from day to day. Explicit collusion is the remaining explanation.
There are particular circumstances under which screens can go one extra step in helping to distinguish explicit from tacit collusion. They correspond to situations in which one can observe the dynamics of collusion; in this case, the quoting patterns in order to identify how the bids/quotes may have become identical.

26
Table 2: Empirical Tests/Screens (cont.)
Study Screen? H1: Collusion H0: Competition X: Variable Data Conclusion Comments Abrantes-Metz, Kraten, Metz & Seow (2012) (cont.)
Screen Manipulated Libor rates are lower 1: Libor rates are higher Spread comparisons of 1-month Libor rate to 1-month T-bill and the Federal Fund effective rate. Comparison of actual and predicted Libor rates in manipulation period based on regression analysis in clean period, Libor rate = f(federal funds rates).
Rates analyzed for 3 periods: 1/1/07-8/8/09 (period 1); 8/9/07-4/16/08 (period 2); and 4/17/08- 5/30/08 (period 3)
Actual Libor rates are not statistically different from predicted rate. Cannot reject null.
Cost control is Federal Funds Rate
Screen Individual Libor quotes of ‘‘manipulative’’ banks are clustered together in non-random patterns.
2: Individual Libor quotes of “manipulative” banks are not clustered in non-random patterns.
Coefficient of variation for individual 1-month Libor quotes for 16 banks
Same as above Individual quotes in Period 1 are more tightly clustered than in other periods. Reject null.
Screen Banks with relatively low (high) collateral debt swap (CDS) spreads are also banks with high (low) Libor quotes
3: No negative correlation between a banks Libor rate and its CDS spread.
Correlations of individual bank Libor quotes and CDS spreads and bank market capitalization.
Same as above
Some outlier banks ordinal position in Libor quotes is unrelated to their ordinal position in CDS spreads.
Jiminez & Perdiguero 2012)
Screen Higher price coefficient of variation relative to a competitive benchmark.
Price variation not different from competitive benchmark.
Price coefficient of variation Prices of petrol 95 and diesel, weekly time series, September 2008 to April 2009 (24 weeks); 420 petrol 95 stations and 391 diesel stations
Gas stations in an oligopoly have a higher coefficient of variation.
Author's note: Missing data filled in using interpolation.
Category 2: Structural Models Bresnahan (1987)
Test Firms set prices to maximize their joint profits. Each firms sets prices to maximize its own profit, taking the prices of other firms’ products as given.
Equilibrium prices and quantities calculated by solving demand systems and firm first-order conditions. Nonnested (Cox) hypothesis tests.
Automobile price, quantities, and characteristics, 1954-1956.
1954 and 1956 generate a superior model fit under collusion hypothesis.
Author notes that findings are robust against alternative specifications.
Porter & Zona (1993)
Test Phantom bidding. No phantom bidding. Log of a firm's bid on a particular job,
Subset of all Nassau and Suffolk county DOT contract lettings from April 1979 through March 1985. 575 bids were submitted on 116 projects.
Cartel firms' bids are statistically different from competitive firms' bids.
Christie and Schultz (1994)
Test Avoidance of odd-eighth quotes is attributable to tacit collusion among bidders.
Avoidance of odd-eighth quotes is attributable to economic determinants of spread such as volume, volatility, market capitalization, and stock price, and collusion is absent.
Equals 1 if a security is quoted in odd-eighths (logistic regression)
Inside quotes for 100 large, actively traded NASDAQ securities and for 100 comparable NYSE/AMEX securities, for the year 1991
Avoidance of odd-eighth quotes is not attributable to economic determinants of spread. Tacit collusion among market makers is the only explanation of avoidance of odd-eighths.
Earlier, the authors rule out that odd-eighth avoidance results from coarse price increments to lower negotiation costs.
Porter & Zona (1999)
Test Bidding behavior is inconsistent with that of control group of nondefendants
Bidding behavior is consistent with that of control group of nondefendants
Equals 1 if bid is submitted in a district (probit regression)
School milk procurement data for 509 districts in Ohio from 1980 through 1990
Collusion raised market prices by about 6.5%

27
Table 2: Empirical Tests/Screens (cont.)
Study Screen? H1: Collusion H0: Competition X: Variable Data Conclusion Comments Bajari & Ye (2003)
Screen Bids are independent after controlling for all information about costs
Bids are not conditionally independent
For a given firm and project, the ratio of the amount bid by the firm on the project to the engineer's cost estimate for the project.
Detailed bidding information for almost all the public and private road construction projects conducted in Minnesota, North Dakota, and South Dakota during the years 1994- 1998. Dataset contains nearly 18,000 procurement auctions.
Among 23 pairs with at least 4 simultaneous bids, the null hypothesis cannot be rejected expect for four pairs of firms. In only one pair did bidders bid against each other more than a handful of times.
Screen Bids are exchangeable: costs alone should determine how firms bid. Holding cost information constant, a firm's bid shouldn't depend on the identities of its competitors.
Bids are not exchangeable. For a given firm and project, the ratio of the amount bid by the firm on the project to the engineer's cost estimate for the project.
Only one pair (different from the four above) fails the exchangeability test. Also, the bidders in the pair bid against each other more than a handful of times.
Screen After identifying pairs of firms whose bidding patterns are not consistent with competitive bidding using conditional independence and exchangeability tests, estimate alternative structural models in which a particular indentified pair colludes and all other firms compete. Calculate posterior probability of collusion using estimated models. Investigate if probability of collusion is large.
Probability of collusion is low
Firm's private cost (estimated), used to calculate marginal likelihood of each model, in turn used to calculate posterior probabilities that equilibrium model is competitive/collusive
Pair 1 failing C.I. and pair 2 failing exch were models 2 and 3, model 1 was competition. Posterior probability of competitive model is highest.
Erutku & Hilderbrand. (2010)
Screen Canadian Competition Bureau investigation of retail gasoline pricing in Sherbrook, Canada.
Post investigation announcement decline in retail gasoline pricing.
Weekly retail gasoline pricing. Difference-in- Difference regression model using prices in 3 cities: Sherbrook, Montreal, and Quebec.
Weekly data in cities during period 5/31/05- 5/22/07. 52 weeks before and after announcement
Announcement of conspiracy triggered a 1.75 cents per litre decline in prices.
Cost control is wholesale gasoline price. Stiglerian theory of collusion leads to ambiguous conclusion regarding likely collusion in Sherbrook.
Category 3: Collusive Market Other Than First and Second Moments of Price Distribution Blanckenburg & Geist. (2009)
Screen (i) Low level of capacity utilization, (ii) slackness of price adjustments to exogenous shocks, (iii) excess rates of return, (iv) nearly constant capacities, (v) lower variance of price changes, and (vi) lower variance of capacity growth rate
(i) No permanent excess capacities, (ii) positive correlation, (iii) no permanent excess rate of return, (iv) positive correlation between rate of return difference and capacity growth rate changes, (v) higher variance of price changes, and (vi) higher variance of capacity growth D15rate changes.
(i) Differenced indicator that measures the difference between supply and demand quantities, (ii) change in nominal price level, (iii) difference between a rate of return representing all firms prevalent in the market under consideration and a broader industry class comparison rate of return, (iv) capacity growth rate.
1980 – 2007 annual time series data for five German industries. German cement industry is the test market for a cartel (lasted for 21 years, 1981-2002). Four competitive German industries were considered - automobile, electrical, chemical, and mechanical industries.
The System of Collusive Markers indicates that the Cement industry was collusive during the relevant time period, and that all other industries were competitive.
Author's note: SCM is more suitable for the detection of long- term cartels.
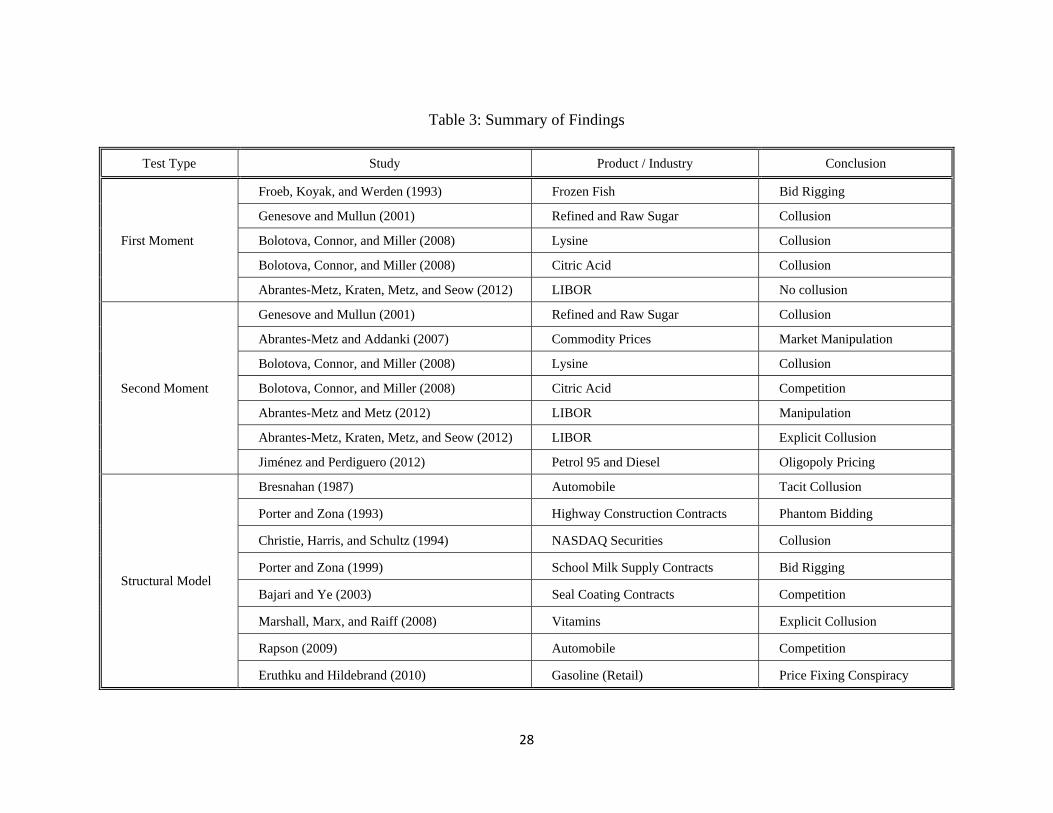
28
Table 3: Summary of Findings
Test Type Study Product / Industry Conclusion
First Moment
Froeb, Koyak, and Werden (1993) Frozen Fish Bid Rigging
Genesove and Mullun (2001) Refined and Raw Sugar Collusion
Bolotova, Connor, and Miller (2008) Lysine Collusion
Bolotova, Connor, and Miller (2008) Citric Acid Collusion
Abrantes-Metz, Kraten, Metz, and Seow (2012) LIBOR No collusion
Second Moment
Genesove and Mullun (2001) Refined and Raw Sugar Collusion
Abrantes-Metz and Addanki (2007) Commodity Prices Market Manipulation
Bolotova, Connor, and Miller (2008) Lysine Collusion
Bolotova, Connor, and Miller (2008) Citric Acid Competition
Abrantes-Metz and Metz (2012) LIBOR Manipulation
Abrantes-Metz, Kraten, Metz, and Seow (2012) LIBOR Explicit Collusion
Jiménez and Perdiguero (2012) Petrol 95 and Diesel Oligopoly Pricing
Structural Model
Bresnahan (1987) Automobile Tacit Collusion
Porter and Zona (1993) Highway Construction Contracts Phantom Bidding
Christie, Harris, and Schultz (1994) NASDAQ Securities Collusion
Porter and Zona (1999) School Milk Supply Contracts Bid Rigging
Bajari and Ye (2003) Seal Coating Contracts Competition
Marshall, Marx, and Raiff (2008) Vitamins Explicit Collusion
Rapson (2009) Automobile Competition
Eruthku and Hildebrand (2010) Gasoline (Retail) Price Fixing Conspiracy
29
References
Abrantes-Metz, R., Froeb, L., Geweke, J. and Taylor, C. (2006), “A Variance Screen for Collusion,” International Journal of Industrial Organization, Vol. 24, pp. 467-486.
Abrantes-Metz, R. and Addanki, S. (2007), “Is the Market Being Fooled? An Error-Based Screen for Manipulation,” Working Paper Series, pp. 1-49.
Abrantes-Metz, R.M. & Perrira, P. (2007), “The impact of entry on prices and costs,” Working Paper.
Abrantes-Metz, R. and Froeb, L. (2008), “The Agencies are Screening for Collusion: What are they Likely to Find?,” ABA Newsletter.
Abrantes-Metz, R. and Bajari, P. (2010), “Screens for Conspiracies and their Multiple Applications,” Competition Policy International,” pp. 129-144.
Abrantes-Metz, R. and Metz, A. (2012), “How Far Can Screens Go in Distinguishing Explicit from Tacit Collusion? New Evidence on the Libor Setting,” Antitrust Chronicle Spring, Vol. 3, pp. 1-9.
Abrantes-Metz, R., Kraten, M., Metz, A. and Seow, G. (2012), “Libor Manipulation?,” Journal of Banking & Finance, Vol. 36, pp. 136-150.
Abrantes-Metz, R. (2012), “Why and How to Use Empirical Screens in Antitrust Compliance?” Competition Policy International Antitrust Chronicle.
Abrantes-Metz, R. (2011), “Design and Implementation of Screens and Their Use by Defendants,” Competition Policy International Antitrust Chronicle.
Abrantes-Metz, R. & Bajari, P. (2010), “Screens for Conspiracies and Their Multiple Applications - Extended,”Competition Policy International Journal, Vol. 6.
Angrist, J. and Pishke, J. (2010), “The Credibility Revolution in Empirical Economics: How Better Research Design is Taking the Con Out of Econometrics,” Journal of Economic Perspectives, Vol.24, pp. 3–30.
Athey, S., Bagwell, K., and Sanchirico, C. (2004), “Collusion and Price Rigidity,” The Review of Economic Studies, Vol. 71, pp. 317-349.
Bajari, P. and Ye, L. (2003), “Deciding Between Competition and Collusion,” The Review of Economics and Statistics, Vol. 85, pp. 971-989.
Baker, J. and B. (1999), “Econometric Analysis in FTC v. Staples,” Journal of Public Policy & Marketing Vol. 18, pp. 11–21.
Blanckenburg, K. and Geist, A. (2009), “How Can a Cartel Be Detected?,” International Advances in Economic Research, Vol. 15, pp. 421-436.
Bolotova, Y., Connor, J., and Miller, D. (2008), “The Impact of Collusion on Price Behavior: Empirical Results from two Recent Cases,” International Journal of Industrial Organization, Vol. 26, pp. 1290-1307.

30
Brannon, I. (2003), “The effects of resale price maintenance laws on petrol prices and station attrition: Empirical evidence from Wisconsin,” Applied Economics, Vol. 35 (3), pp. 343-349.
Bresnahan, T. (1987), “Competition and Collusion in the American Automobile Industry: The 1955 Price War,” The Journal of Industrial Economics, Vol. 35, pp. 457-482.
Carlson, J.A. and McAfee, R.P. (1983), “Discrete equilibrium price dispersion,” Journal of Political Economy, Vol. 91, pp. 480-493.
Carlton, D. W. (1986), “The rigidity of prices. American Economic Review,” Vol. 76 (4), pp. 637-658.
Christie, W.G., Harris, J. H., and Schultz, P. H. (1994), “Why did NASDAQ Market Makers Stop Avoiding Odd-Eighth Quotes?” The Journal of Finance, Vol. 49, No. 5, pp. 1841-1860.
Christie, W.G. and Schultz, P. H. (1994), “Why do NASDAQ Market Makers Avoid Odd-Eighth Quotes?” The Journal of Finance, Vol. 49, No. 5, pp. 1813-1840.
Connor, J. M. (2005), “Collusion and Price Dispersion,” Applied Economics Letters, Vol. 12 (6), pp. 335-338.
Cooper, J., Froeb, L., O’Brien, D and Vita, M. (2005), “Vertical Antitrust Policy as a Problem of Inference,” International Journal of Industrial Organization, Vol. 23, pp. 639–664.
Easterbrook, F. (1984), “The Limits of Antitrust,” Texas Law Review, Vol. 63(1).
Erickson, W.B., (1976), “Price Fixing Conspiracies: Their long-term impact,” Journal of Industrial Economics, Vol. 24, pp. 189-202.
Erutku, C. and Hildebrand, V. (2010), “Conspiracy at the Pump,” Journal of Law and Economics, Vol. 53, pp. 223-237.
Froeb, Luke and Steven Tschantz, and Gregory Werden (2005), Pass-Through Rates and the Price Effects of Mergers, International Journal of Industrial Organization, Vol. 23, pp. 703-715.
Froeb, Luke, Robert Koyak, R. and Gregory Werden (1993), “What is the Effect of Bid-Rigging on Prices?” Economics Letters, Vol. 42, pp. 419-423.
FTC (2012), Jon Leibowitz’s Reply to Letter from Representative Markey, Chairman, US Federal Trade Commission, October 25, 2012.
Genesove, D., & Mullin, W. (2001), “Rules, communication and collusion: Narrative evidence from the sugar institute case,” American Economic Review, Vol. 91(3), pp. 379-398.
Green, E. and Porter, R. (1984), “Noncooperative Collusion under Imperfect Price Information,” Econometrica, Vol. 52, pp. 87-100.

31
Jimenez, J. L. & Perdiguero, J. (2011), “Could transport costs be lower? The use of a variance screen to evaluate competition in the petrol market in Spain,” International Journal of Transport Economics, Vol. 38 (3), pp. 265-284.
Harrington, J. (2006), “Behavioral Screening and the Detection of Cartels,” European Competition Law, pp. 1-17.
Harrington, J. (2008), “Detecting Cartels,” Handbook of Antitrust Economics (P. Buccirossi, ed., 2008).
Harrington, J. and Chen, J. (2006), “Cartel Pricing Dynamics with Cost Variability and Endogenous Buyer Detection,” International Journal of Industrial Organization, Vol. 24, pp. 1185-1212.
Keane, M. (2010), “Structural vs. Atheoretical Approaches to Econometrics,” Journal of Econometrics, Vol. 156, pp. 3–20.
Kovacic, W., Marshall, R., Marx, L., and White, H. (2011), “Plus Factors and Agreement in Antitrust Law,” Working Paper, pp. 1-51.
Levenstein, Margaret C. and Valerie Y. Suslow, “Cartels and Collusion – Empirical Evidence,” Oxford Handbook on International Antitrust Economics, Roger D. Blair and D. Daniel Sokol, editors (Oxford: Oxford University Press, 2013).
Lorenz, C. (2008), “Screening Markets for Cartel Detection: Collusive Markers in the CFD Cartel-Audit,” European Journal of Law and Economics, Vol. 26(2), pp. 213-232.
Markey, Edward J. (2012), Letter to the Hon. Jon Leibowitz, Chairman, US Federal Trade Commission, October 12, 2012.
Marshall, R., Marx, L., and Raiff, M. (2008), “Cartel Price Announcements: The Vitamins Industry,” International Journal of Industrial Organization, Vol. 26, pp. 762-802.
Morgenson, Gretchen (1993), “Fun and Games on NASDAQ,” Forbes (16 August 1993).
Muthusamy, K., McIntosh, C., Bolotova, Y., and Patterson, P. (2008), “Price Volatility of Idaho Fresh Potatoes: 1987-2007,” American Journal of Potato Research, Vol. 86(6), pp. 438-444.
Nevo, A. and Whinston, M. (2010), “Taking the Dogma Out of Econometrics: Structural Modeling and Credible Inference,” Journal of Economic Perspectives, Vol. 24 , pp. 68–92.
Parker, R. (1969), “The banking Industry,” Antitrust Law and Economics Review Vol. 2, pp. 111-122.
Porter, R. and Zona, D. (1993), “Detection of Bid Rigging in Procurement Auctions,” Journal of Political Economy, Vol. 101, pp. 518-538.
Porter, R. and Zona, D. (1999), “Ohio School Milk Markets: An Analysis of Bidding,” The RAND Journal of Economics, Vol. 30, pp. 263-288.
Rotemberg, J. and Saloner, G. (1986), “A Supergame-Theoretic Model of Price Wars during Booms,” The American Economic Review, Vol. 76, pp. 390-407.

32
Stigler, G. (1964), “A Theory of Oligopoly,” The Journal of Political Economy, Volume 72, Issue 1, pp. 44-61.
Rothschild, M. (1973), “Models of market organization with imperfect information; a survey,” Journal of Political Economy, Vol. 81, 1283-308.
Salop, S. (1977), “The noisy monopolist: Imperfect information price dispersion and price discrimination,” Review of Economics Studies, Vol. 44, pp. 393-406.
Shor, Mikhael and Hui Chen (2009), Contemporary Accounting Research, 26(2), pp. 581—604.
U.S. Department of Justice, Antitrust Division, Price Fixing, Bid Rigging, and Market Allocation Schemes: What They Are and What to Look For, available at http://www.usdoj.gov/atr/public/guidelines/primer-ncu.htm.
Werden, G. and Froeb, L. (1994), “The Effects of Mergers in Differentiated Products Industries: Logit Demand and Merger Policy,” Journal of Law, Economics, & Organization, Vol. 10, pp. 407–426.
Werden, G., Froeb, L. and Scheffman, D. (2004), “A Daubert Discipline for Merger Simulation,” Antitrust, Vol. 18:3, pp. 89-95.
Werden, Gregory J., and Luke M. Froeb, “Unilateral Competitive Effects of Horizontal Mergers” (pp. 43–104) in Paolo Buccirossi (Ed.), Handbook of Antitrust Economics (Cambridge, MA: MIT Press, 2008).
Yde, P. and Vita, M. (1996), “Merger Efficiencies: Reconsidering the “Passing-On” Requirement,” Antitrust Law Journal, Vol. 64, pp.735-47.
Top Related