


Languages
Pages
Legal


2 June 2016
Scania AB (publ) SE-151 87 Södertälje Tel. +46 8 553 810 00
Corporate identity number Sweden Fax +46 8 553 810 37
556184-8564 www.scania.com
Scania Interim Report January–March 2016
Summary of the first three months of 2016 • Operating income rose by 2 percent to SEK 2,295 m. (2,245)
• Net sales increased by 3 percent to SEK 23,056 m. (22,321)
• Cash flow amounted to SEK 133 m. (783) in Vehicles and Services
Comments by Henrik Henriksson, President and CEO “Scania’s sales amounted to SEK 23.1 billion and
earnings for the first quarter amounted to SEK
2,295 m. Higher vehicle volume in Europe and
higher service volume were partly offset by negative
currency rate effects and low capacity utilisation in
the production system in Latin America. The high
level of investments is starting to impact earnings.
Scania’s order bookings for trucks in Europe
increased compared to the previous year and
reached the highest level for a first quarter since
2007. Demand in the eastern and southern parts of
Europe increased strongest, while some of Scania’s
traditional major markets were stable at a high
level. Scania’s market share for trucks in Europe
amounted to 17.4 percent compared to 17.2
percent in 2015. Demand in Brazil is still very low
and even though order bookings in Russia rose
somewhat compared to the previous year, there are
no real signs of recovery in Latin America or
Eurasia. In Asia, order bookings rose compared to
the first quarter of the previous year. Order
bookings in Buses and Coaches rose compared to
the year-earlier period and mainly increased in the
Nordic region. In Engines, order bookings fell
compared to the first quarter of 2015 due to
declining demand in Brazil. Scania is continuing its
long-term efforts to boost its market share in
Services. Service revenue amounted to SEK 5.2
billion, an increase of 6 percent in local currency.
Scania was early in investing in connected vehicles
and today nearly 30 percent of Scania’s 10-year
rolling fleet is connected. Connectivity is an
important component, enabling Scania to offer its
customers more efficient services aimed at
improving their profitability. Financial Services
reported operating income of SEK 253 million and
credit losses remain at low levels.”
Financial overview Q1
Trucks and buses, units 2016 2015
Change,
%
Order bookings 21,609 20,224 7
Deliveries 18,440 17,500 5
Net sales and earnings EUR
m.*
Net sales, Scania Group, SEK m. 2,497 23,056 22,321 3
Operating income, Vehicles and Services, SEK m. 221 2,042 1,989 3
Operating income, Financial Services, SEK m. 27 253 256 -1
Operating income, SEK m. 248 2,295 2,245 2
Income before taxes, SEK m. 234 2,166 2,158 0
Net income for the period, SEK m. 167 1,546 1,700 -9
Operating margin, % 10.0 10.1
Return on capital employed,
Vehicles and Services, % 19.4 19.5
Cash flow, Vehicles and Services 14 133 783
* Translated to EUR solely for the convenience of the reader at a closing day rate of SEK 9.2323 = EUR 1.00.
Unless otherwise stated, all comparisons refer to the corresponding period of the preceding year. 1)
The discount rate in calculating the Swedish pension liability has changed to 2.75 percent per 31 March.
This interim report has not been subject to review by the company’s auditors. It is also available on www.scania.com/group/en/
1

Scania Interim Report January-March 2016
Business overview
0
3 000
6 000
9 000
12 000
15 000
18 000
21 000
24 000
27 000
Q1 Q2 Q3 Q4
Number of vehicles delivered
2013 2014 2015 2016
0
5 000
10 000
15 000
20 000
25 000
30 000
Q1 Q2 Q3 Q4
Net sales (SEK m.)
2013 2014 2015 2016
0
400
800
1 200
1 600
2 000
2 400
2 800
Q1 Q2 Q3 Q4
Operating income (SEK m.)
2013 2014 2015 2016
Sales performance
During the first quarter of 2016, total vehicle deliveries increased by 5 percent to 18,440 (17,500) units,
compared to the year-earlier period. Net sales rose by 3 percent to SEK 23,056 m. (22,321). Currency rate
effects had a negative impact of 5 percent on sales.
Order bookings rose by 7 percent to 21,609 (20,224) vehicles, compared to the first quarter of 2015.
Eastern and southern Europe advancing strongly, Latin America and Eurasia remain uncertain
Scania’s order bookings for trucks in Europe rose and reached the highest level for a first quarter since
2007 thanks to continued strong growth in the region. The eastern and southern parts of Europe increased
strongly, while demand in some of Scania’s traditional major markets seems to have stabilised somewhat
at a high level. There is still a replacement need in Europe, financing is available and the oil price is low.
Demand for used vehicles in Europe is still good.
Demand in Latin America fell further compared to the first quarter of 2015 due to low demand mainly in
Argentina. Demand in Brazil remains at a low level and there is considerable uncertainty in the country
regarding the future economic trend.
Through its global production system, Scania is able to balance the industrial system somewhat by shifting
production in Brazil in order to export more to Africa, the Middle East and Asia.
In Russia, demand rose slightly compared to the first quarter of 2015 but the regional outlook remains
uncertain.
Continued high market share in Europe
Scania’s market share for trucks in Europe during the first quarter of 2016 amounted to 17.4 percent
compared to 17.2 percent in 2015. The high level is connected to the early and very successful introduction
of the Euro 6 range and Scania’s broad engine range for alternative fuels. Sales activities in new segments
have also impacted positively on the market share.
The truck market Order bookings
Scania’s order bookings increased during the first quarter of 2016 and totalled 19,363 (18,311) trucks.
Order bookings in Europe increased by 10 percent to 13,708 (12,446) units, compared to the first quarter
of 2015. Demand was good in several major European markets and increased strongly in the eastern and
southern areas, including Poland, France, Italy and Spain. Germany and Great Britain decreased slightly
compared to the previous year but demand remains at a high level. Total European demand rose also
compared to the previous quarter.
Order bookings in Latin America weakened further during the first quarter of 2016. Compared to the first
quarter of 2015, order bookings in Latin America decreased by 29 percent to 1,260 (1,768) trucks, mainly
related to lower demand in Argentina, Chile and Peru. Demand also fell compared to the previous quarter
and no real signs of recovery are visible in Latin America.
2

Scania Interim Report January-March 2016
In Eurasia, total order bookings rose during the first quarter and amounted to 623 (271) trucks, an upturn
that was primarily related to Russia and Ukraine. Order bookings also increased sequentially. However,
there are no real signs of recovery in the region.
In Asia, order bookings rose to 2,671 (2,373) units during the first quarter. The upturn was primarily related
to Iran, Thailand and South Korea. Order bookings also rose compared to the fourth quarter of 2015.
In Africa, order bookings were lower compared to the first quarter of 2015, mainly related to South Africa.
In Oceania, order bookings were somewhat higher in Australia compared to the first quarter of 2015. Total
order bookings in the Africa and Oceania region were 24 percent lower at 1,101 (1,453) units, compared to
the first quarter of 2015. Order bookings were also lower compared to the fourth quarter of 2015.
Deliveries
Scania's total truck deliveries increased by 6 percent to 17,079 (16,160) units during the first quarter
compared to the year-earlier period. In Europe, deliveries rose by 32 percent to 12,799 (9,671) units
compared to the first quarter of 2015. In Eurasia, deliveries fell by 34 percent to 383 (582) trucks. In Latin
America, deliveries fell by 25 percent to 1,272 (1,707) units compared to the first quarter of 2015. In Asia,
deliveries fell compared to the first quarter of 2015 to 1,769 (3,236) trucks. In Africa and Oceania deliveries
fell by 11 percent to 856 (964) trucks.
Sales
Net sales of trucks rose by 8 percent to SEK 15,186 m. (14,106) during the first quarter of 2016.
The total European market for heavy trucks
The total market for heavy trucks in 28 of the European Union member countries (all EU countries except
Bulgaria and Malta) plus Norway and Switzerland increased by 18 percent to about 73,700 (62,500) units
during the first quarter of 2016. Scania truck registrations amounted to some 12,800 units, equivalent to a
market share of about 17.4 (17.2) percent.
Scania trucks Order bookings Deliveries
3 months
2016
3 months
2015
Change,
%
3 months
2016
3 months
2015
Change,
%
Europe 13,708 12,446 10 12,799 9,671 32
Eurasia 623 271 130 383 582 -34
America* 1,260 1,768 -29 1,272 1,707 -25
Asia 2,671 2,373 13 1,769 3,236 -45
Africa and Oceania 1,101 1,453 -24 856 964 -11
Total 19,363 18,311 6 17,079 16,160 6
*Refers to Latin America
The bus and coach market Order bookings
Order bookings for buses and coaches during the first quarter of 2016 rose compared to the previous year
to 2,246 (1,913) units.
Scania’s market share in buses and coaches in Europe was 6.2 percent for the period compared to 6.3
percent during the same period of 2015.
In Europe, order bookings improved and totalled 639 (472) units in the first quarter with increased order
bookings mainly in the Nordic countries.
In Latin America, order bookings rose by 18 percent to 984 (831) units compared to the first quarter of
2015. Order bookings in Eurasia rose to 30 (4) buses and coaches compared to the year-earlier period.
In Asia, order bookings fell to 392 (439) buses and coaches compared to the first quarter of 2015. Order
bookings in Africa and Oceania rose to 201 (167) buses and coaches.
3
Scania Interim Report January-March 2016
Deliveries
Scania’s bus and coach deliveries totalled 1,361 (1,340) units during the first quarter. In Europe, deliveries
increased by 3 percent to 400 (390) units compared to the first quarter of 2015. In Latin America, deliveries
were down by 1 percent to 357 (362) units. In Asia, deliveries fell by 13 percent to 388 (444), while
deliveries of buses and coaches in Africa and Oceania rose during the first quarter to 203 (136) units.
Deliveries to Eurasia increased to 13 (8) units.
Net sales
Net sales of buses and coaches fell by 4 percent during the first quarter to SEK 1,679 m. (1,751).
Scania buses and coaches Order bookings Deliveries
3 months
2016
3 months
2015
Change,
%
3 months
2016
3 months
2015
Change,
%
Europe 639 472 35 400 390 3
Eurasia 30 4 13 8
America* 984 831 18 357 362 -1
Asia 392 439 -11 388 444 -13
Africa and Oceania 201 167 20 203 136 49
Total 2,246 1,913 17 1,361 1,340 2
*Refers to Latin America
Engines Order bookings
Total engine order bookings fell by 23 percent to 1,945 (2,537) units during the first quarter of 2016
compared to the year-earlier period. The downturn was primarily related to Brazil where demand
decreased during the quarter. The decrease was partly offset by increases in South Korea, Turkey and the
Netherlands. Compared to the previous quarter, total order bookings rose slightly.
Deliveries
Engine deliveries fell by 23 percent to 1,790 (2,336) units during the first quarter of 2016.
Net sales
During the first quarter, sales fell by 22 percent to SEK 356 m. (459).
Services Service revenue amounted to SEK 5,152 m. (5,091) during the first quarter of 2016, an increase of
1 percent. Higher volume had a positive impact while currency rate effects impacted negatively. In local
currencies, revenue increased by 6 percent.
In Europe, service revenue rose by 4 percent to SEK 3,683 m. (3,543) compared to the first quarter of
2015. In Latin America, revenue fell by 8 percent to SEK 603 m. (658) and revenue in Asia was 2 percent
higher than the previous year at SEK 439 m. (431). In Africa and Oceania, service revenue fell by 5
percent to SEK 313 m. (331), while in Eurasia it decreased by 11 percent to SEK 114 m. (128) compared
to the first quarter of 2015.
Earnings Vehicles and Services The first quarter
Operating income in Vehicles and Services totalled SEK 2,042 m. (1,989) during the first quarter of 2016.
Compared to the first quarter of 2015, the total currency rate effect was negative and amounted to about
SEK 580 m. Higher vehicle volume in Europe and higher service volume had a positive impact on
earnings. Negative currency rate effects and low capacity utilisation in the production system in Latin
America had a negative effect. The high level of investments is also starting to impact earnings.
4

Scania Interim Report January-March 2016
Scania’s research and development expenditures amounted to SEK 1,753 m. (1,626). After adjusting for
SEK 438 m. (414) in capitalised expenditures and SEK 99 m. (99) in depreciation of previously capitalised
expenditures, recognised expenses increased to SEK 1,414 m. (1,311).
Financial Services Customer finance portfolio
At the end of the first quarter of 2016, the size of Scania’s customer finance portfolio amounted to SEK
58.9 billion, which was SEK 2.4 billion higher than the end of 2015. In local currencies, the portfolio
increased by SEK 2.2 billion, equivalent to 4 percent.
Penetration rate
The penetration rate was 39 (42) percent during the first quarter in those markets where Scania has its
own financing operations. The decreased was related to Great Britain, Germany and France, among other
countries.
Operating income
Operating income in Financial Services decreased to SEK 253 m. (256) during the first quarter of 2016,
compared to the same period in 2015. A larger portfolio had a positive impact on earnings, while lower
margins and negative currency rate effects had an adverse impact.
Scania Group During the first quarter of 2016, Scania’s operating income amounted to SEK 2,295 m. (2,245). Operating
margin amounted to 10.0 (10.1) percent. Scania’s net financial items amounted to SEK -129 m. (-87).
The Scania Group’s tax expense amounted to SEK 620 m. (458), equivalent to 28.6 (21.2) percent of
income before taxes. Net income for the period totalled SEK 1,546 m. (1,700), equivalent to a net margin of
6.7 (7.6) percent.
Cash flow Vehicles and Services Scania’s cash flow in Vehicles and Services amounted to SEK 133 m. (783) during the first quarter of
2016. Tied-up working capital increased by SEK 661 m., due to somewhat higher inventory levels.
Net investments amounted to SEK 1,748 m. (1,585), including SEK 438 m. (414) in capitalisation of
development expenses. At the end of the first quarter of 2016, the net cash position in Vehicles and
Services amounted to SEK 7,484 m. compared to a net cash position of SEK 7,579 m. at the end of 2015.
Scania Group Scania’s cash flow in Financial Services amounted to SEK -1,592 m. (-179) during the first quarter of 2016
due to a growing customer finance portfolio. Despite the positive cash flow in Vehicles and Services, the
Group’s net debt increased by about SEK 1.8 billion compared to the end of 2015.
Parent Company The assets of the Parent Company, Scania AB, consist of shares in Scania CV AB. Scania CV AB is the
Parent Company of the Group that comprises all production and sales and service companies as well as
other companies. Income before taxes of Scania AB totalled SEK 0 m. (0) during the first quarter of 2016.
5

Scania Interim Report January-March 2016
Miscellaneous Number of employees At the end of first quarter of 2016, the number of employees totalled 45,031 compared to 42,475 on the
same date in 2015.
Material risks and uncertainty factors The section entitled “Risks and risk management” in Scania’s Annual and Sustainability Report for 2015
describes Scania’s strategic, operational, legal and financial risks. Note 2 of the same report provides a
detailed account of key judgements and estimates. Note 27 of the same report describes the financial
risks, such as currency risk and interest rate risk. The risks that have the greatest impact on financial
performance and on reporting for the Group and the Parent Company are summarised as follows:
a) Sales with obligations
About 15 percent of the vehicles Scania sells are delivered with residual value obligations or repurchase
obligations. These are recognised as operating lease contracts, with the consequence that recognition of
revenue and earnings is allocated over the life of the obligation (contract). If there are major changes in the
market value of used vehicles, this increases the risk of future losses when selling returned vehicles. When
a residual value obligation is deemed likely to cause a future loss, a provision is made in cases where the
expected loss exceeds the as-yet-unrecognised profit on the vehicle.
b) Credit risks
In its Financial Service operations, Scania has an exposure in the form of contractual future payments.
This exposure is reduced by the collateral Scania has in the form of the right to repossess the underlying
vehicle. In case the market value of the collateral does not cover the exposure to the customer, Scania
runs a credit risk. Reserves for probable losses in Financial Service operations are set aside in the
estimated amounts required.
Accounting principles Scania applies International Financial Reporting Standards (IFRSs) as adopted by the EU. This Interim
Report for the Scania Group has been prepared in accordance with IAS 34, “Interim Financial Reporting”
and the Annual Accounts Act. New and revised standards and interpretations that are being applied from 1
January 2016 have not had any significant impact on Scania’s financial statements. Accounting principles
and calculation methods are unchanged from those applied in the Annual Report and Sustainability Report
for 2015.
The Interim Report for the Parent Company, Scania AB, has been prepared in accordance with the Annual
Accounts Act and recommendation RFR 2, “Accounting for Legal Entities” of the Swedish Financial
Reporting Board.
Contact persons
Susanna Berlin
Investor Relations
Tel. +46 8 553 861 12
Mobil tel. +46 70 086 05 02
Erik Ljungberg
Corporate Relations
Tel. +46 8 553 835 57
Mobile tel. +46 73 988 35 57
6

Consolidated income statements
EUR m.* 2016 2015
Vehicles and ServicesNet sales 2,497 23,056 22,321 3
Cost of goods sold -1,848 -17,064 -16,584 3
Gross income 649 5,992 5,737 4
Research and development expenses -153 -1,414 -1,311 8
Selling expenses -242 -2,230 -2,137 4
Administrative expenses -35 -326 -318 3
Share of income from associated companies and joint
ventures 2 20 18 11
Operating income, Vehicles and Services 221 2,042 1,989 3
Financial ServicesInterest and lease income 150 1,387 1,337 4
Interest and depreciation expenses -99 -914 -854 7
Interest surplus 51 473 483 -2
Other income and expenses 2 23 38 -39
Gross income 53 496 521 -5
Selling and administrative expenses -23 -214 -199 8
Bad debt expenses, realised and anticipated -3 -29 -66 -56
Operating income, Financial Services 27 253 256 -1
Operating income 248 2,295 2,245 2
Interest income and expenses -13 -121 -73 66
Other financial income and expenses -1 -8 -14 -43
Total financial items -14 -129 -87 48
Income before taxes 234 2,166 2,158 0
Taxes -67 -620 -458 35
Net income for the period 167 1,546 1,700 -9
Other comprehensive income
Items that may be reclassified subsequently to
profit or loss
Translation differences 16 144 -78
Cash flow hedges
reclassification to operating income - - 23
Income tax relating to items that may be reclassified 2 14 -15
18 158 -70
Items that will not be reclassified to profit or loss
Re-measurement defined benefit plans1)
-38 -348 -373
Income tax relating to items that will not be reclassified 8 77 82
-30 -271 -291
Other comprehensive income for the period -12 -113 -361
Total comprehensive income for the period 155 1,433 1,339
Net income attributable to:
Scania shareholders 168 1,552 1,702
Non-controlling interest -1 -6 -2
Total comprehensive income attributable to:
Scania shareholders 156 1,440 1,336
Non-controlling interest -1 -7 3
Operating income includes depreciation of -87 -807 -796
Operating margin, percent 10.0 10.11)
The discount rate in calculating the Swedish pension liability has changed to 2.75 percent per 31 March
* Translated solely for the convenience of the reader at a closing exchange rate of SEK 9.2323 = EUR 1.00.
Amounts in SEK m. unless otherwise stated
Change
in %
Q1
7

Net sales and deliveries, Vehicles and Services
Amounts in SEK m. unless otherwise stated EUR m. 2016 2015
Net sales
Trucks 1,645 15,186 14,106 8
Buses* 182 1,679 1,751 -4
Engines 39 356 459 -22
Service-related products 558 5,152 5,091 1
Used vehicles 165 1,521 1,525 0
Miscellaneous 55 510 660 -23
Delivery sales value 2,644 24,404 23,592 3
Revenue deferrals1)
-146 -1,348 -1,271 6
Net sales 2,498 23,056 22,321 3
Net sales2)
Europe 1,793 16,540 13,915 19
Eurasia 46 428 526 -19
America** 211 1,949 2,633 -26
Asia 281 2,598 3,507 -26
Africa and Oceania 167 1,541 1,740 -11
Net sales 2,498 23,056 22,321 3
Total delivery volume, units
Trucks 17,079 16,160 6
Buses* 1,361 1,340 2
Engines 1,790 2,336 -23
1) Refers to the difference between sales value based on deliveries and revenue recognised as income
2) Revenues from external customers by location of customers
* Including body-built buses and coaches
** Refers mainly to Latin America
Q1 Change
in %
8

Consolidated balance sheets Scania Group
EUR m. 31 Mar 31 Dec 31 Mar
Assets
Non-current assets
Intangible assets 784 7,240 6,855 5,543
Tangible assets 2,810 25,944 25,309 23,848
Lease assets 2,302 21,250 20,428 17,773
Shares and participations 57 525 516 591
Interest-bearing receivables 2,947 27,209 26,359 27,021
Other receivables1, 2
532 4,913 4,728 3,191
Current assets
Inventories 2,043 18,863 16,918 18,766
Interest-bearing receivables 1,905 17,588 16,373 17,042
Other receivables3
1,251 11,546 11,270 11,985
Current investments 23 215 213 964
Cash and cash equivalents 956 8,829 12,295 10,636
Total assets 15,610 144,122 141,264 137,360
Total equity and liabilities
Equity
Scania shareholders 4,249 39,230 37,790 43,081
Non-controlling interest 4 40 47 59
Total equity 4,253 39,270 37,837 43,140
Non-current liabilities
Interest-bearing liabilities 3,091 28,541 26,206 24,501
Provisions for pensions 843 7,780 7,339 9,435
Other provisions 325 3,002 2,893 3,017
Other liabilities1, 4
1,305 12,051 11,501 7,265
Current liabilities
Interest-bearing liabilities 2,674 24,689 28,736 21,668
Provisions 269 2,483 2,001 1,971
Other liabilities5
26,306
2016
Amounts in SEK m. unless otherwise stated
2015
Other liabilities5
2,850 26,306 24,751 26,363
Total equity and liabilities 15,610 144,122 141,264 137,360
1 Including deferred tax
2 Including derivatives with positive value for hedging of borrowings 67 618 595 301
3 Including derivatives with positive value for hedging of borrowings 37 345 554 478
4 Including derivatives with negative value for hedging of borrowings 46 423 508 991
5 Including derivatives with negative value for hedging of borrowings 41 382 390 552
Equity/assets ratio, percent 27.2 26.8 31.4
9

Statement of changes in equity
Amounts in SEK m. unless otherwise stated EUR m. 2016 2015
Equity, 1 January 4,098 37,837 41,801
Net income for the period 167 1,546 1,700
Other comprehensive income for the period -12 -113 -361
Total equity at the end of the period 4,253 39,270 43,140
Attributable to:
Scania AB shareholders 4,249 39,230 43,081
Non-controlling interest 4 40 59
Information about Revenue from external customers
Amounts in SEK m. unless otherwise stated EUR m. 2016 2015
Revenue from external customers, Vehicles and
Services 2,497 23,056 22,321
Revenue from external customers, Financial Services 150 1,387 1,337
Elimination refers to lease income on operating
leases -76 -700 -613
Revenue from external customers, Scania Group 2,571 23,743 23,045
Operating income, Vehicles and Services 221 2,042 1,989
Operating income, Financial Services 27 253 256
Operating income, Scania Group 248 2,295 2,245
Q1
Q1
10
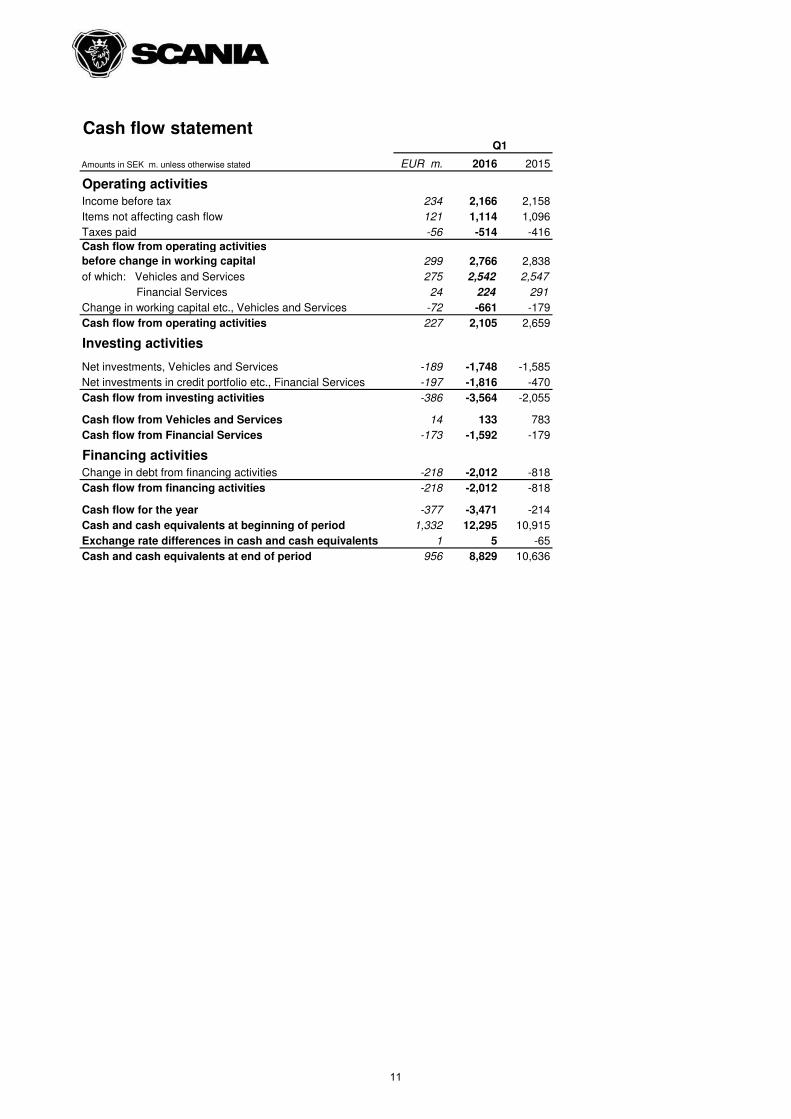
Cash flow statement
EUR m. 2016 2015
Operating activities
Income before tax 234 2,166 2,158
Items not affecting cash flow 121 1,114 1,096
Taxes paid -56 -514 -416
Cash flow from operating activities
before change in working capital 299 2,766 2,838
of which: Vehicles and Services 275 2,542 2,547
Financial Services 24 224 291
Change in working capital etc., Vehicles and Services -72 -661 -179
Cash flow from operating activities 227 2,105 2,659
Investing activities
Net investments, Vehicles and Services -189 -1,748 -1,585
Net investments in credit portfolio etc., Financial Services -197 -1,816 -470
Cash flow from investing activities -386 -3,564 -2,055
Cash flow from Vehicles and Services 14 133 783
Cash flow from Financial Services -173 -1,592 -179
Financing activities
Change in debt from financing activities -218 -2,012 -818
Cash flow from financing activities -218 -2,012 -818
Cash flow for the year -377 -3,471 -214
Cash and cash equivalents at beginning of period 1,332 12,295 10,915
Exchange rate differences in cash and cash equivalents 1 5 -65
Cash and cash equivalents at end of period 956 8,829 10,636
Amounts in SEK m. unless otherwise stated
Q1
11
Fair value of financial instruments
Amounts in SEK m. unless otherwise stated
1) Comparative figure has been adjusted
For further information about financial instruments, see Note 28 Financial instruments in Scania’s Annual
Report for 2015.
In Scania’s balance sheet, items carried at fair value are mainly derivatives and current investments. Fair
value is established according to various levels, defined in IFRS 13, that reflect the extent to which market
values have been utilised. Current investments and cash and cash equivalents are carried according to Level
1, i.e. quoted prices in active markets for identical assets, and amounted to SEK 1,678 m. (1,228)1)
. Other
assets that are carried at fair value refer to derivatives. These assets are carried according to Level 2, which is
based on data other than the quoted prices that are part of Level 1 and refer to directly or indirectly observable
market data, such as discount rate and credit risk. These items are carried under Other non-current
receivables SEK 618 m. (301), Other current receivables SEK 414 m. (478), Other non-current liabilities SEK
423 m. (991) and Other current liabilities SEK m. 382 (568).
For financial assets that are carried at amortised cost, book value amounts to SEK 59,190 (64,250) and fair
value to SEK 59,328 (64,346). For financial liabilities that are carried at amortised cost, book value amounts to
SEK 65,192 (59,497) and fair value to SEK 64,891 (59,776). Fair value of financial instruments such as trade
receivables, trade payables and other non-interest-bearing financial assets and liabilities that are recognised
at amortised cost minus any impairment losses, is regarded as coinciding with the carrying amount.
12

Quarterly data, units by geographic area2016
Q1 Full year Q4 Q3 Q2 Q1
Order bookings, trucks
Europe 13,708 47,692 11,660 10,316 13,270 12,446
Eurasia 623 1,962 340 620 731 271
America ** 1,260 7,438 1,393 1,666 2,611 1,768
Asia 2,671 8,349 2,367 1,450 2,159 2,373
Africa and Oceania 1,101 4,658 1,284 869 1,052 1,453
Total 19,363 70,099 17,044 14,921 19,823 18,311
Trucks delivered
Europe 12,799 43,082 12,462 9,491 11,458 9,671
Eurasia 383 2,583 672 814 515 582
America** 1,272 8,118 2,038 2,217 2,156 1,707
Asia 1,769 11,514 3,003 2,779 2,496 3,236
Africa and Oceania 856 4,465 1,426 1,021 1,054 964
Total 17,079 69,762 19,601 16,322 17,679 16,160
Order bookings, buses*
Europe 639 1,937 691 288 486 472
Eurasia 30 80 3 26 47 4
America ** 984 2,275 525 294 625 831
Asia 392 1,828 616 267 506 439
Africa and Oceania 201 872 320 250 135 167
Total 2,246 6,992 2,155 1,125 1,799 1,913
Buses delivered*
Europe 400 1,917 537 453 537 390
Eurasia 13 94 21 21 44 8
America ** 357 2,123 629 510 622 362
Asia 388 1,806 553 443 366 444
Africa and Oceania 203 859 285 197 241 136
Total 1,361 6,799 2,025 1,624 1,810 1,340
* Including body-built buses and coaches.
** Refers to Latin America
2015
13
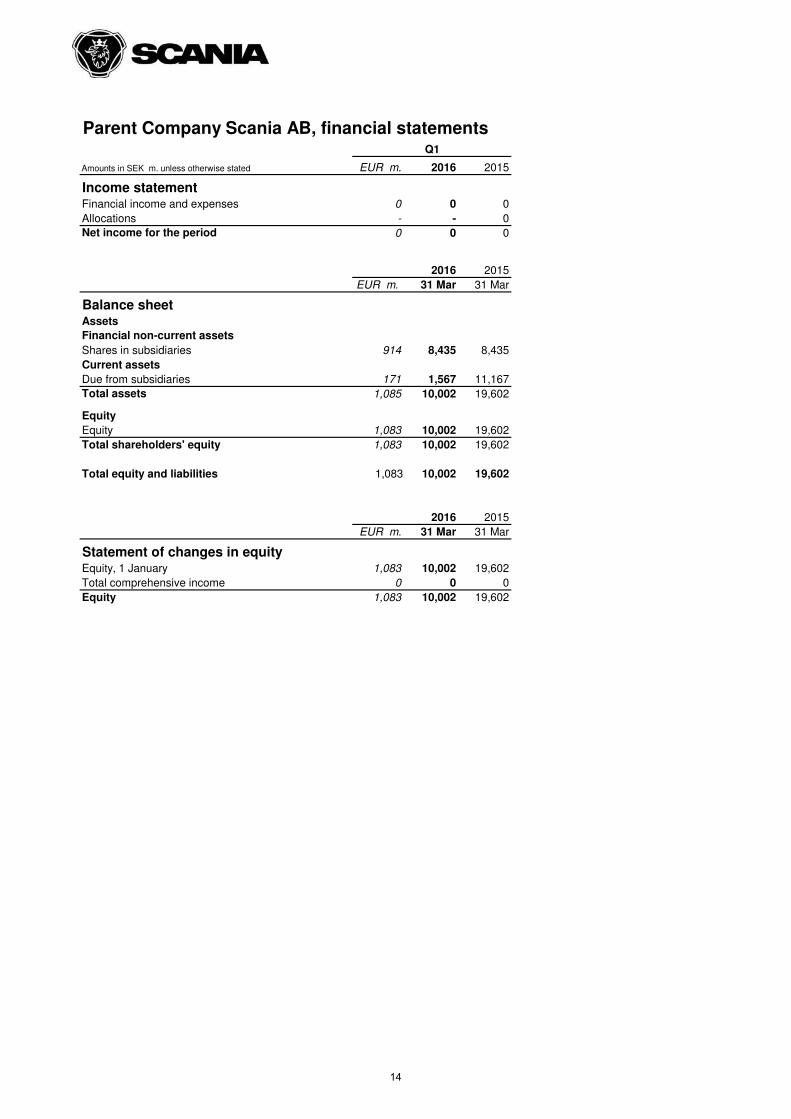
Parent Company Scania AB, financial statements
EUR m. 2016 2015
Income statementFinancial income and expenses 0 0 0
Allocations - - 0
Net income for the period 0 0 0
2016 2015
EUR m. 31 Mar 31 Mar
Balance sheetAssets
Financial non-current assets
Shares in subsidiaries 914 8,435 8,435
Current assets
Due from subsidiaries 171 1,567 11,167
Total assets 1,085 10,002 19,602
Equity
Equity 1,083 10,002 19,602
Total shareholders' equity 1,083 10,002 19,602
Total equity and liabilities 1,083 10,002 19,602
2016 2015
EUR m. 31 Mar 31 Mar
Statement of changes in equityEquity, 1 January 1,083 10,002 19,602
Total comprehensive income 0 0 0
Equity 1,083 10,002 19,602
Amounts in SEK m. unless otherwise stated
Q1
14
Top Related