


Languages
Pages
Legal


Saurashtra University Re – Accredited Grade ‘B’ by NAAC (CGPA 2.93)
Munshi, Nisar M., 2010, A Comparative analysis of Job Satisfaction Level of Management Teachers of MBA Colleges in Gujarat State, thesis PhD, Saurashtra University
http://etheses.saurashtrauniversity.edu/id/eprint/74 Copyright and moral rights for this thesis are retained by the author A copy can be downloaded for personal non-commercial research or study, without prior permission or charge. This thesis cannot be reproduced or quoted extensively from without first obtaining permission in writing from the Author. The content must not be changed in any way or sold commercially in any format or medium without the formal permission of the Author When referring to this work, full bibliographic details including the author, title, awarding institution and date of the thesis must be given.
Saurashtra University Theses Service http://etheses.saurashtrauniversity.edu
© The Author
“A COMPARATIVE ANALYSIS OF JOB SATISFACTION
LEVEL OF MANAGEMENT TEACHERS OF MBA COLLEGES
IN GUJARAT STATE”
A THESIS
SUMITTED TO THE
SAURASHTRA UNIVERSITY
FOR THE DEGREE OF
DOCTOR OF PHILOSOPHY IN MANAGEMENT
(FACULTY OF MANAGEMENT)
SUBMITTED BY
NISAR M. MUNSHI
ASSOCIATE PROFESSOR
N. R. VEKARIA INSTITUTE OF BUSINESS
MANAGEMENT STUDIES
JUNAGADH 362 001
UNDER THE SUPERVISION OF
Dr. PRATAPSINH L. CHAUHAN
PROFESSOR & H.O.D
DEPARTMENT OF BUSINESS MANAGEMENT
(M.B.A. PROGRAMME)
SAURASHTRA UNIVERSITY
RAJKOT 360 005
JANUARY 2007
Date:
CERTIFICATE
It is certified that the thesis entitled“A Comparative Analysis of Job
Satisfaction Level of Management Teachers of MBA Colleges in
Gujarat State” is a record of research work done by Mr. Nisar M.
Munshi during the period of study under my supervision and that the
thesis has not formed the basis for the award of any degree, diploma,
associateship, fellowship or similar title to the candidate and that the
thesis represents independent work on the part of the candidate.
Dr. Pratapsinh L. Chauhan,
Research Supervisor & Guide
Department of Business Management
(M.B.A. Programme)
Dr. Pratapsinh L. Chauhan
M.Com., Ph.D.,
Professor & H.O.D, MBA Department, Saurashtra University, Rajkot.
Saurashtra University Univers i ty Road, Rajkot – 360 005, Gujarat, Ind ia . Phone :(O) 0281–2577461 www.sumba.org. in

NISAR M. MUNSHI (M. B. A.)
Associate Professor,
N. R. Vekaria Institute of Business
Management Studies,
Junagadh 362 001.
Date:
DECLARATION
I declare that the thesis entitled “A Comparative Analysis of Job
Satisfaction Level of Management Teachers of MBA Colleges in
Gujarat State” is a record of independent research work carried out by
me under the supervision and guidance of Dr. Pratapsinh L. Chauhan
Professor & H.O.D, Department of Business Management Studies,
(MBA Programme), Saurashtra University, Rajkot. This has not been
previously submitted for the award of any diploma, degree,
associatesship or other similar title.
Nisar M. Munshi
I
ACKNOWLEDGEMENT
I owe a deep gratitude to Dr. Pratapsinh L. Chauhan Professor &
Head,Department of Business Management, Saurashtra University, Rajkot
for inspiring and providing valuable guidance in my research work.
I am also thankful to Dr. Sanjay J. Bhayani, Associate Professor,
Department of Business Management, Saurashtra University, Rajkot who
has guided me through out my research work.
My sincere thanks to my Parents and to the president of Junagadh
Junior Chamber Education Trust Shri N. R. Vekaria for his valuable support.
For completing the present study, I got assistance, valuable advice and
suggestions, directly or indirectly from many of my teachers, well-wishers,
colleagues, officials and a special indebts of gratitude is due to my friends
and colleagues Dinkar Morvadia and Rajnikant Malviya , who took keen
interest through the work and inspired me.
Date : (NISAR MUNSHI)
Place : Junagadh

II
PREFACE
Job Satisfaction has become a favorite topic of discussion for
businessmen, academicians, political leaders, social reformers and
management students in India.
The study is organized into 6 Chapters. The first chapter gives the
insight to the topic and theories which are related with Job-Satisfaction. The
Second chapter is related with the past and present education system
prevailing in India. The remaining four chapters provide a conceptual frame
work and the statistical education of the different factors of job-Satisfaction.
It is a fond hope of the Researcher that all executives, Academicians,
Researchers, Teachers and Students will appreciate this work and contribute
to the progress of knowledge.
Date: - Nisar Munshi
Place:-
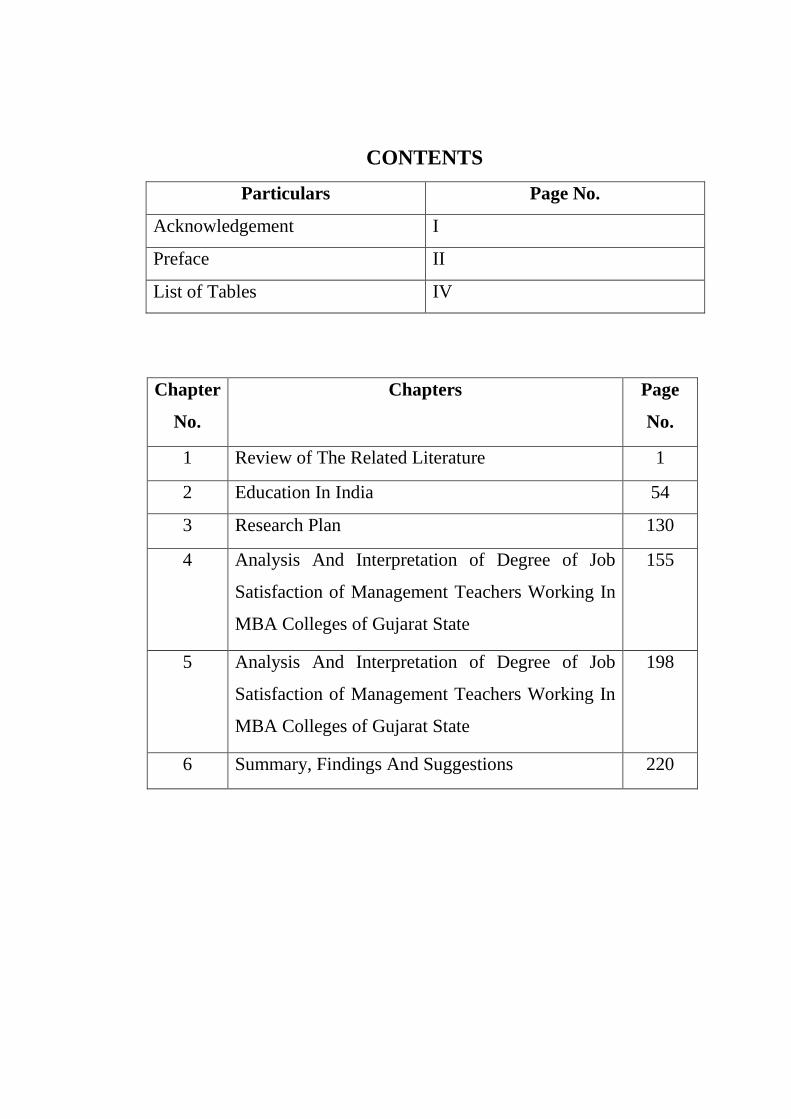
CONTENTS
Particulars Page No.
Acknowledgement I
Preface II
List of Tables IV
Chapter
No.
Chapters Page
No.
1 Review of The Related Literature 1
2 Education In India 54
3 Research Plan 130
4 Analysis And Interpretation of Degree of Job
Satisfaction of Management Teachers Working In
MBA Colleges of Gujarat State
155
5 Analysis And Interpretation of Degree of Job
Satisfaction of Management Teachers Working In
MBA Colleges of Gujarat State
198
6 Summary, Findings And Suggestions 220
III
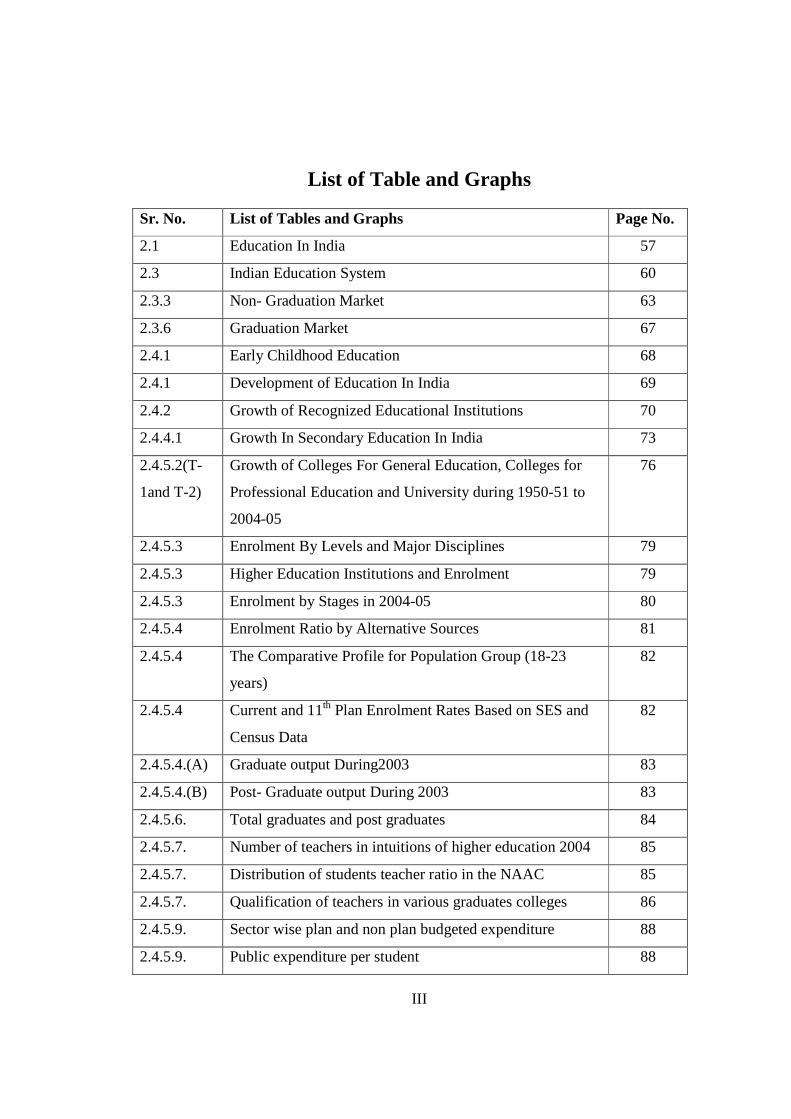
List of Table and Graphs Sr. No. List of Tables and Graphs Page No.
2.1 Education In India 57
2.3 Indian Education System 60
2.3.3 Non- Graduation Market 63
2.3.6 Graduation Market 67
2.4.1 Early Childhood Education 68
2.4.1 Development of Education In India 69
2.4.2 Growth of Recognized Educational Institutions 70
2.4.4.1 Growth In Secondary Education In India 73
2.4.5.2(T-
1and T-2)
Growth of Colleges For General Education, Colleges for
Professional Education and University during 1950-51 to
2004-05
76
2.4.5.3 Enrolment By Levels and Major Disciplines 79
2.4.5.3 Higher Education Institutions and Enrolment 79
2.4.5.3 Enrolment by Stages in 2004-05 80
2.4.5.4 Enrolment Ratio by Alternative Sources 81
2.4.5.4 The Comparative Profile for Population Group (18-23
years)
82
2.4.5.4 Current and 11th Plan Enrolment Rates Based on SES and
Census Data
82
2.4.5.4.(A) Graduate output During2003 83
2.4.5.4.(B) Post- Graduate output During 2003 83
2.4.5.6. Total graduates and post graduates 84
2.4.5.7. Number of teachers in intuitions of higher education 2004 85
2.4.5.7. Distribution of students teacher ratio in the NAAC 85
2.4.5.7. Qualification of teachers in various graduates colleges 86
2.4.5.9. Sector wise plan and non plan budgeted expenditure 88
2.4.5.9. Public expenditure per student 88

IV
2.4.5.9. Plan expenditure on higher education 89
2.4.5.9. Central plan allocation and expenditure 90
2.4.5.9. Distribution of total public expenditure per student 90
2.4.5.10. Expenditure on education by different states 91
2.4.5.10. Higher education 92
2.4.5.10. Total expenditure on education and training under different
level
93
2.4.5.11.(A) Enrolment rate in higher education 94
2.4.5.11.(B) Enrolment ratio under different group of population 95
2.4.5.11.(C-
1)
Current quality status in college of higher education in
India
96
2.4.5.11.(c-
2)
Current quality status of university in India 96
2.4.5.11.(C-
3)
NAAC ranking of colleges 97
2.4.5.11.(C-
4)
Performance quality of selected accelerated colleges 98
2.4.5.11.(F-
1)
Some selected UGC schemes and new initiatives 101
2.4.5.11.(F-
2)
Selected schemes under MHRD/AICTE/ICAR and other
agency
103
2.4.6.1.(A) Indian institute of technology 107
2.16.3 Participating institutes 125
2.16.4. Selection process 129
4.1 [1] Designation of Teachers 157
4.1 [2] Divisional Department 158
4.1 [3] Age of Teachers 159
4.1 [4] Experience of MBA Teachers 159
4.1 [5] Academic Qualification of Management Teachers 161
4.1 [6] Trainings, Seminars, Conferences, Workshops attended 162
V
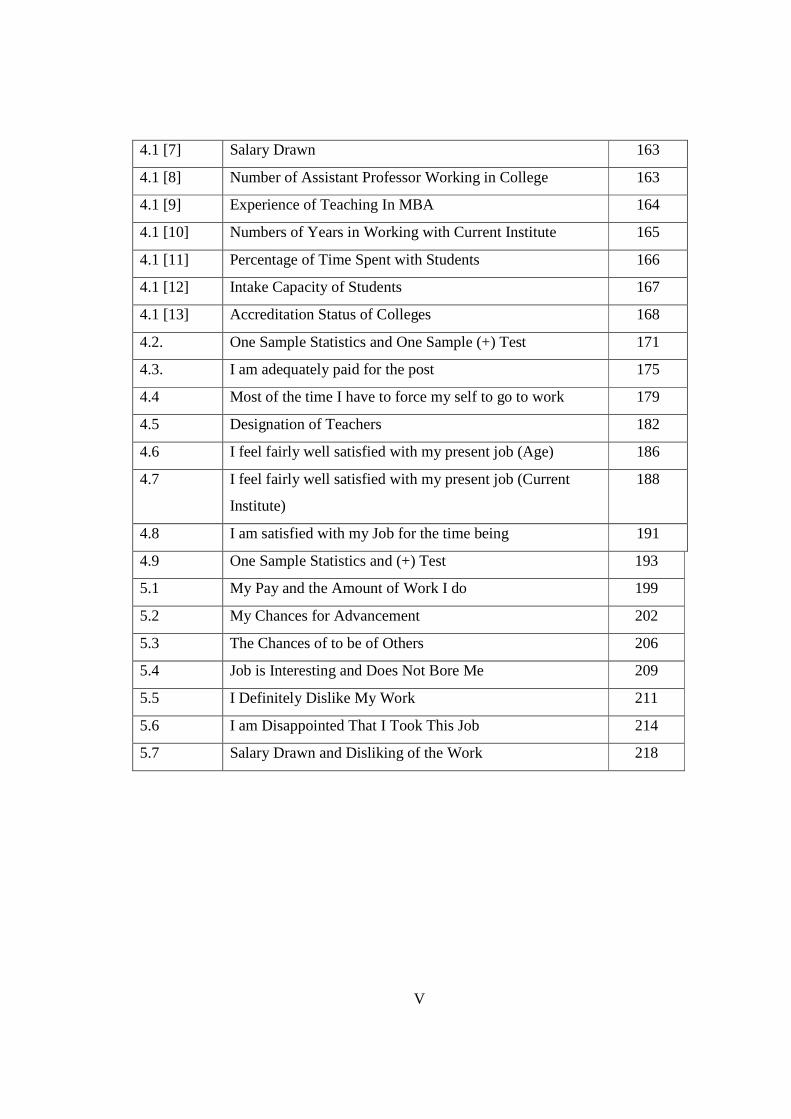
4.1 [7] Salary Drawn 163
4.1 [8] Number of Assistant Professor Working in College 163
4.1 [9] Experience of Teaching In MBA 164
4.1 [10] Numbers of Years in Working with Current Institute 165
4.1 [11] Percentage of Time Spent with Students 166
4.1 [12] Intake Capacity of Students 167
4.1 [13] Accreditation Status of Colleges 168
4.2. One Sample Statistics and One Sample (+) Test 171
4.3. I am adequately paid for the post 175
4.4 Most of the time I have to force my self to go to work 179
4.5 Designation of Teachers 182
4.6 I feel fairly well satisfied with my present job (Age) 186
4.7 I feel fairly well satisfied with my present job (Current
Institute)
188
4.8 I am satisfied with my Job for the time being 191
4.9 One Sample Statistics and (+) Test 193
5.1 My Pay and the Amount of Work I do 199
5.2 My Chances for Advancement 202
5.3 The Chances of to be of Others 206
5.4 Job is Interesting and Does Not Bore Me 209
5.5 I Definitely Dislike My Work 211
5.6 I am Disappointed That I Took This Job 214
5.7 Salary Drawn and Disliking of the Work 218

1
CHAPTER – 1: REVIEW OF THE RELATED LITERATURE
Sr.
No. Particular
Page
No.
1.1 Introduction 4
1.2 History of Job Satisfaction 7
1.3 Meaning and Definition of Job Satisfaction 8
1.4 Importance of Job Satisfaction 11
1.5 Theories of Job Satisfaction 12
(1.5.1) Content Theories 12
(1.5.2) Motivator / Hygiene Theory 13
(1.5.3) Process Theories 14
(1.5.4) Expectations and Equity Theory 14
(1.5.5) Reference Group Theory 15
(1.5.6) Needs/Fulfillment Theory 15
(1.5.7) Work Adjustment Theory 16
(1.5.8) Job Characteristics Model 17
(1.5.9) Dispositional Theory 18
(1.5.10) Affect Theory 18
1.6 Measuring Job Satisfaction 19
1.7 Variables of Job Satisfaction 20
(1.7.1) Age 20
(1.7.2) Tenure 21
(1.7.3) Education experience 22
(1.7.4) Gender 22
(1.7.5) Salary 23
(1.7.6) Institution Size 23
(1.7.7) Number of Teachers 24
(1.7.8) Socio-Economic Position of the Institute 24
(1.7.9) Percent of Time Spent with Students 24
(1.7.10) College Accreditation Status 25
1.8 Dimension of Job Satisfaction 27

2
1.9 Factors Influencing Job Satisfaction 28
(1.9.1) Organizational factor 28
1.9.1.1 Reward 28
1.9.1.2 Physical working Condition 28
1.9.1.3 Co-operation 28
(1.9.2) Personal Factor 28
1.9.2.1 Interest 28
1.9.2.2 Personal Trait 28
1.9.2.3 Status and seniority 29
1.9.2.4 Life Satisfaction 29
1.10 Management Teachers and Job Satisfaction 30
1.11 Management Teachers Roles in Job Satisfaction 35
(1.11.1) Seek Opportunities To Demonstrate Skills And Talent 35
(1.11.2) Develop Excellent Communication Skill 35
(1.11.3) Knows More 35
(1.11.4) Demonstrate Creativity And Initiative 35
(1.11.5) Develop Teamwork And People Skills 35
(1.11.6) Accept The Diversity In People 35
(1.11.7) See The Value In Your Work 35
(1.11.8) Learn To De-Stress 35
1.12 The Relationship of Job Satisfaction with some field of
Organization Behavior 36
(1.12.1) The relationship between leadership and job satisfaction 36
(1.12.2) The relationship between organizational culture and job
satisfaction of employees 36
(1.12.3) The relationship between the operation of learning
organization and job satisfaction of employees 37
(1.12.4) Job satisfaction and emotions 38
1.12.4.1 Emotional dissonance 38
1.12.4.2 Social interaction model 38
1.13 How to get more than Satisfaction at Work 39
1.14 Relationships and Practical Implications of Job 40
3
Satisfaction
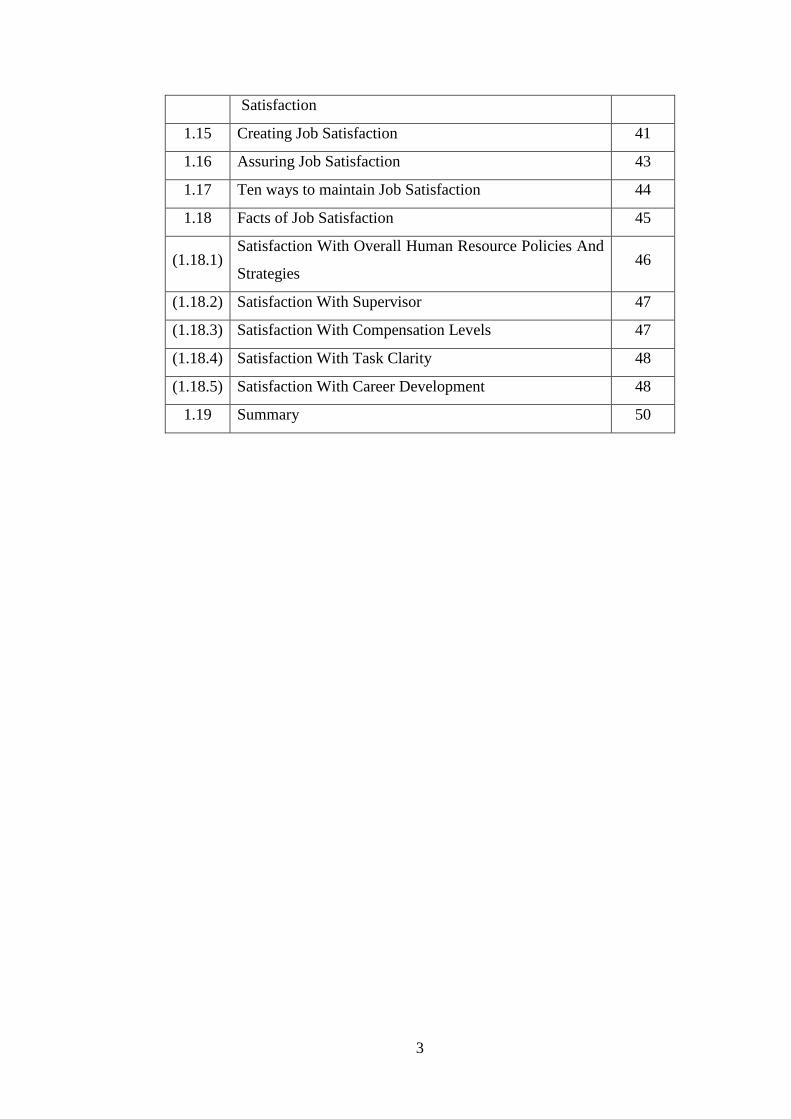
1.15 Creating Job Satisfaction 41
1.16 Assuring Job Satisfaction 43
1.17 Ten ways to maintain Job Satisfaction 44
1.18 Facts of Job Satisfaction 45
(1.18.1) Satisfaction With Overall Human Resource Policies And
Strategies 46
(1.18.2) Satisfaction With Supervisor 47
(1.18.3) Satisfaction With Compensation Levels 47
(1.18.4) Satisfaction With Task Clarity 48
(1.18.5) Satisfaction With Career Development 48
1.19 Summary 50
4
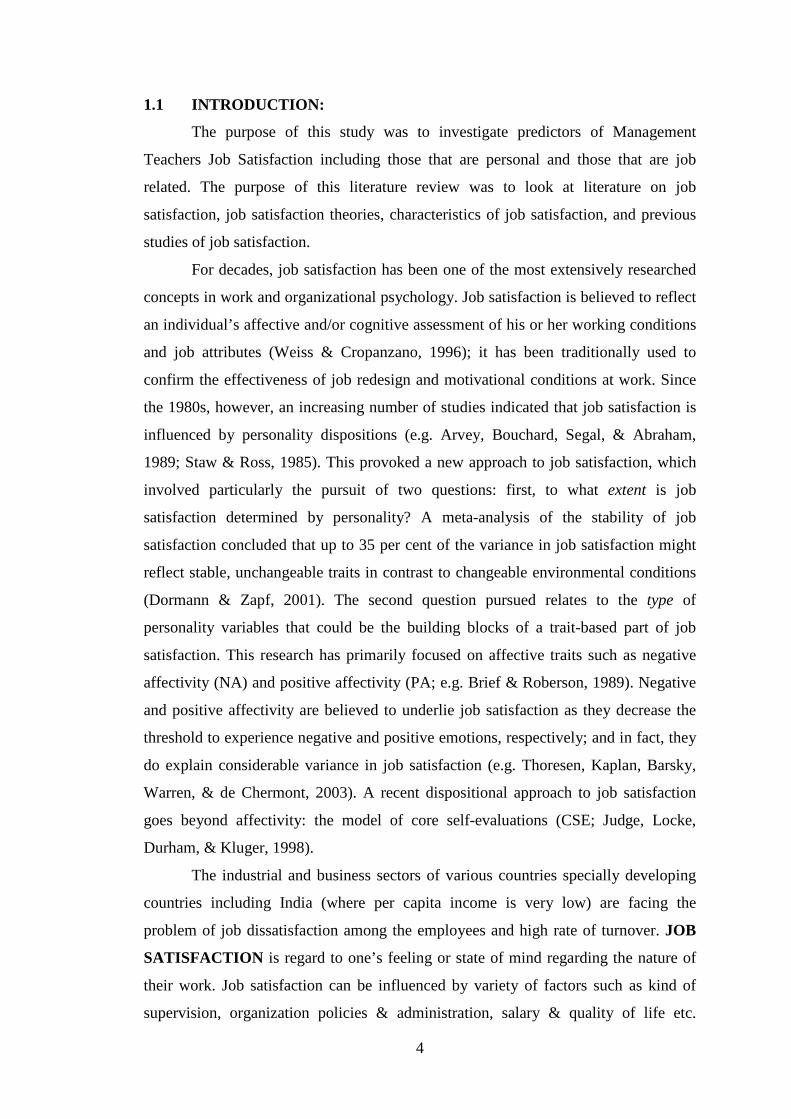
1.1 INTRODUCTION:
The purpose of this study was to investigate predictors of Management
Teachers Job Satisfaction including those that are personal and those that are job
related. The purpose of this literature review was to look at literature on job
satisfaction, job satisfaction theories, characteristics of job satisfaction, and previous
studies of job satisfaction.
For decades, job satisfaction has been one of the most extensively researched
concepts in work and organizational psychology. Job satisfaction is believed to reflect
an individual’s affective and/or cognitive assessment of his or her working conditions
and job attributes (Weiss & Cropanzano, 1996); it has been traditionally used to
confirm the effectiveness of job redesign and motivational conditions at work. Since
the 1980s, however, an increasing number of studies indicated that job satisfaction is
influenced by personality dispositions (e.g. Arvey, Bouchard, Segal, & Abraham,
1989; Staw & Ross, 1985). This provoked a new approach to job satisfaction, which
involved particularly the pursuit of two questions: first, to what extent is job
satisfaction determined by personality? A meta-analysis of the stability of job
satisfaction concluded that up to 35 per cent of the variance in job satisfaction might
reflect stable, unchangeable traits in contrast to changeable environmental conditions
(Dormann & Zapf, 2001). The second question pursued relates to the type of
personality variables that could be the building blocks of a trait-based part of job
satisfaction. This research has primarily focused on affective traits such as negative
affectivity (NA) and positive affectivity (PA; e.g. Brief & Roberson, 1989). Negative
and positive affectivity are believed to underlie job satisfaction as they decrease the
threshold to experience negative and positive emotions, respectively; and in fact, they
do explain considerable variance in job satisfaction (e.g. Thoresen, Kaplan, Barsky,
Warren, & de Chermont, 2003). A recent dispositional approach to job satisfaction
goes beyond affectivity: the model of core self-evaluations (CSE; Judge, Locke,
Durham, & Kluger, 1998).
The industrial and business sectors of various countries specially developing
countries including India (where per capita income is very low) are facing the
problem of job dissatisfaction among the employees and high rate of turnover. JOB
SATISFACTION is regard to one’s feeling or state of mind regarding the nature of
their work. Job satisfaction can be influenced by variety of factors such as kind of
supervision, organization policies & administration, salary & quality of life etc.

5
Employers have a need to keep employee from leaving and going to work for other
organizations. The best way of retaining employees is to provide the job satisfaction
and opportunities to build up their careers. “The good hope is hard to find, is even
truer these days than ever before because the job market in becoming increasingly
tight”. (Eskildesen, Hammer)
Theresa gave the study to examine the job satisfaction and intent to turnover
using the co relational design. He takes the sample (n = 107) consist of direct support
professional who worked for non profit organization located in South Carolina that
served People with disabilities development. Two instruments were utilized that
measure the overall (Specter job satisfaction) and facet job satisfaction and intent to
turnover (Michigan Organizational Assessment Questionnaire). Demographic
information regarding age and tenure were examined. Data analysis includes
descriptive and inferential statistics. The result from the study suggests that there is a
significant and negative correlation between job satisfaction and intent to turnover. It
was demonstrated that tenure is related to job satisfaction and having positive & low
relation.
There was little evidence that suggest that age was significantly related to
either job satisfaction or intent to turnover. Theresa take sample from single
organization which in non profit organization. The non profit organizations are some
extent running by the charity & donation and the remunerations for the employees in
such organizations are low.1 Bhatti & Qureshi collect the information regarding the
Name of organization, Life of organization in years, Number of employee, Employee
participation, Job satisfaction, Employee commitment & Employee Productivity from
the first line managers and their immediate bosses. The Managers were given a
questionnaire and were asked to give the answer at their best knowledge with
reference to working conditions in their organization. Questionnaire was divided in to
two portions. First line manager had to answer the question regarding name of
organization, life of organization, number of employees, employee participation, job
satisfaction and employee commitment. While the immediate bosses was to answer
the question from the portion of employee productivity. The questionnaire consists on
relationship among job satisfaction, employee commitment, and employee
productivity. They used Likard scale questionnaire. They take sample from
communication sector, banking sector and oil & gas sector of Pakistan. 34
organizations were selected for study. They measured job satisfaction by using the

6
variables, employee productivity, employee commitment and employee participation
and their hypothetical research found strong and positive relationship between the job
satisfaction and mentioned variables. The finding suggests that management of
organization should increase the satisfaction among employees with compensation,
policies and working conditions in order to attain high level of employee commitment
and reduce turnover.
The sample size was not enough to reflect image of the organizations
functioning in Pakistan. Data collection method for research is very common. Other
methods could have been used for this research study like group discussion /
discussion forum.
The late 1920s one of the first studies of job satisfaction undertaken by Mayo
& Hawthorne. This study referred to & focused on employee attitude and its impact
on production levels. The study highlighted that employees & workers develop their
own perceptions of the work situation and the social environment, which affects their
attitudes towards their work. The findings of the study provided consistent results
with the observations of Taylor in 1911, that individual workers wants economic
incentives/monetary rewards and are willing to work harder for it. He used the global
approach to measure job satisfaction.
The study found that 88% of the surveyed were classified as being satisfied,
and there was a direct linear relationship between occupational level and job
satisfaction.
7
1.2 HISTORY OF JOB SATISFACTION:
One of the biggest preludes to the study of job satisfaction was the Hawthorne
studies. These studies (1924-1933), primarily credited to Elton Mayo of the Harvard
Business School, sought to find the effects of various conditions (most notably
illumination) on workers’ productivity. These studies ultimately showed that novel
changes in work conditions temporarily increase productivity (called the Hawthorne
Effect). It was later found that this increase resulted, not from the new conditions, but
from the knowledge of being observed. This finding provided strong evidence that
people work for purposes other than pay, which paved the way for researchers to
investigate other factors in job satisfaction.
Scientific management also had a significant impact on the study of job
satisfaction. Frederick Winslow Taylor’s 1911 book, Principles of Scientific
Management, argued that there was a single best way to perform any given work task.
This book contributed to a change in industrial production philosophies, causing a
shift from skilled labor and piecework towards the more modern approach of
assembly lines and hourly wages. The initial use of scientific management by
industries greatly increased productivity because workers were forced to work at a
faster pace. However, workers became exhausted and dissatisfied, thus leaving
researchers with new questions to answer regarding job satisfaction. It should also be
noted that the work of W.L. Bryan, Walter Dill Scott, and Hugo Munsterberg set the
tone for Taylor’s work.
Some argue that Maslow’s hierarchy of needs theory, a motivation theory, laid
the foundation for job satisfaction theory. This theory explains that people seek to
satisfy five specific needs in life – physiological needs, safety needs, social needs,
self-esteem needs, and self-actualization. This model served as a good basis from
which early researchers could develop job satisfaction theories.
8
1.3 MEANING AND DEFINITION OF JOB SATISFACTION:
Hoppock (1935) indicates that job satisfaction means the mental, physical and
environmental satisfaction of employee and the extent of job satisfaction can be
known by inquiring employees about the job satisfaction extents. The academic
definitions of job satisfaction can be divided into three types. Namely:
(1) Integral definition: This definition emphasizes workers’ job attitude toward
environment with focal attention on the mental change for individual job satisfaction
of employee (Locke, 1976; Fogarty, 1994; Robbins, 1996).
(2) Differential definition: It emphasizes job satisfaction and the difference between
the actually deserved reward and the expected reward from employees; the larger
difference means the lower satisfaction (Smith et al., 1969; Hodson, 1991).
(3) Reference structure theory: It emphasizes the fact that the objective
characteristics of organizations or jobs are the important factors to influence
employees’ working attitude and behaviors but the subjective sensibility and
explanation of working employees about these objective characteristics; the said
sensibility and explanation are also affected by self reference structures of individual
employee (Morse, 1953; Homans, 1961).
Within this research, for the dimension of job satisfaction, we adopt the
frequently applied Minnesota Satisfaction Questionnaire and divide the job
satisfaction of employee into the external satisfaction and internal satisfaction for the
subsequent researching investigation.
Although no uniform definition of job satisfaction exists (Siegel & Lane,
1982); job satisfaction is generally considered to be the overall feeling that a worker
has about a job.
Young (1984) defined job satisfaction as “the affective reaction that
employees have about their jobs” (p. 115). According to Young, job satisfaction has
implications for the individual related to physical and mental health, for the
organization related to the acceptance of and good performance on the job, and for
society related to quantity and quality of life.
Job satisfaction was defined by Lofquist and Dawis (1969) as “the
pleasurable emotional state resulting from the appraisal of the extent to which he
work environment fulfills an individual’s requirement” (p. 47).

9
Solly and Hohenshil (1986) stated “Job satisfaction is defined as an attitude
individuals hold about their work consisting of a general or global factor of
satisfaction as well as a collection of specific factors related to sources of work
reinforcement” (p. 119).
According to Hoppock (1977), job satisfaction can be defined as essentially
any combination of psychological, physiological, and environmental circumstances
that cause a person to say, “I am satisfied with my job”.
Business Definition for: Job Satisfaction
The sense of fulfillment and pride felt by people who enjoy their work and do
it well. Various factors influence job satisfaction, and our understanding of the
significance of these stems in part from Frederick Herzberg. He called elements such
as remuneration, working relationships, status, and job security "hygiene factors"
because they concern the context in which somebody works. Hygiene factors do not
in themselves promote job satisfaction, but serve primarily to prevent job
dissatisfaction. Motivators contribute to job satisfaction and include achievement,
recognition, the work itself, responsibility, advancement, and growth. An absence of
job satisfaction can lead to poor motivation, stress, absenteeism, and high labor
turnover.
Some other definitions of job satisfaction
(a)
Job satisfaction has been defined as a pleasurable emotional state resulting
from the appraisal of one’s job; an affective reaction to one’s job; and an attitude
towards one’s job. Weiss (2002) has argued that job satisfaction is an attitude but
points out that researchers should clearly distinguish the objects of cognitive
evaluation which are affect (emotion), beliefs and behaviors. This definition suggests
that we form attitudes towards our jobs by taking into account our feelings, our
beliefs, and our behaviors.
(b)
"Job satisfaction is defined as "the extent to which people like (satisfaction) or
dislike (dissatisfaction) their jobs" (Spector, 1997, p. 2). This definition suggests job
satisfaction is a general or global affective reaction that individuals hold about their
job. While researchers and practitioners most often measure global job satisfaction,
there is also interest in measuring different "facets" or "dimensions" of satisfaction.

10
Examination of these facet conditions is often useful for a more careful examination
of employee satisfaction with critical job factors. Traditional job satisfaction facets
include: co-workers, pay, job conditions, supervision, nature of the work and
benefits." (Williams)
(c)
“Job satisfaction is a positive emotional state that occurs when a person's job
seems to fulfill one's needs”. It is not always related with the money factor-because
some people also work to satisfy their urge to work.
(d)
Following is the exact entry as defined by Dictionary.com.
–noun
1. An act of satisfying; fulfillment; gratification.
2. The state of being satisfied; contentment.
3. The cause or means of being satisfied.
4. Confident acceptance of something as satisfactory, dependable, true, etc.
5. Reparation or compensation, as for a wrong or injury.
6. The opportunity to redress or right a wrong, as by a duel.
7. Payment or discharge, as of a debt or obligation.
8. Ecclesiastical.
(e)
Paul Spector’s refers to job satisfaction as “a cluster of evaluative feelings
about the job” and identifies nine facets of job satisfaction that are measured by the
Job satisfaction:
1. Pay - amount and fairness or equity of salary
2. Promotion - opportunities and fairness of promotions
3. Supervision - fairness and competence at managerial tasks by one’s supervisor
4. Benefits - insurance, vacation, and other fringe benefits
5. Contingent rewards - sense of respect, recognition, and appreciation
6. Operating procedures - policies, procedures, rules, perceived red tape
7. Coworkers - perceived competence and pleasantness of one’s colleagues
8. Nature of work - enjoyment of the actual tasks themselves
9. Communication - sharing of information within the organization.
11
1.4 IMPORTANCE OF JOB SATISFACTION:
After reading about job satisfaction and the factors related to it, you may want
to know that why job satisfaction important is? The importance of job satisfaction
plays a major role in our occupational life. It has relation with many aspects because it
affects a person's
(a) Mental health
(b) Physical health
(c)Increase in output
(a) Mental Health:
If a person remains continuously dissatisfied with the job it affects the mental
health of the individual. The continuous tension leads to much maladjustment in the
behavior.
(b) Physical Health:
Job Satisfaction affects the physical health of the person. If a person is under
continuous stress, he/she will suffer from health problems like headaches, heart and
digestion related diseases etc.
(c) Increase in output:
The output automatically increases with job satisfaction because when a
person is happy with his job situation, he would like to put more effort in his work,
which in turn will increase the output.

12
1.5 THEORIES OF JOB SATISFACTION:
Regardless of the authors, generally it is agreed that job satisfaction involves
the attitudes, emotions, and feelings about a job, and how these attitudes, emotions
and feelings affect the job and the employee’s personal life. Given the many
definitions of job satisfaction, many scholars have proposed various theories of job
satisfaction. These theories have been developed, then either supported or rejected by
others in the field of work motivation and behavioral research. Today the classic
theories of Maslow (1943), Herzberg (1968), and Vroom (1964) on job satisfaction
are the basis for much of the modern day studies. These classic theories have served
as a basis for the evolution of job satisfaction research and have served as a
springboard for research inside and outside the field of education. Because these
classic theories have transcended into the field of education, from a historical
perspective, it is important to look at the classic theories of job satisfaction.
In their book on theories of job satisfaction, Campbell, Dunnettee, Lawler, and
Weik (1970) divide the present-day theories of job satisfaction into two groups,
content theories which give an account of the factors that influence job satisfaction
and process theories that try to give an account of the process by which variables such
as expectations, needs, and values relate to the characteristics of the job to produce
job satisfaction. Maslow’s (1943) Needs Hierarchy Theory and its development by
Herzberg into the two factor theory of job satisfaction are examples of content theory.
Equity, fulfillment and Vroom’s (1964) expectancy theory are examples of process
theory.
1.5.1 Content Theories:
Content theories were concerned with the specific identity of what it is within
an individual or his/her environment that energizes and sustains behavior. In other
words, what specific things motivate people (Campbell et al, 1970)? Maslow (1954)
suggested that people are driven by unsatisfied needs that shape their behavior. He
theorized that after a person has moved from a lower to a higher level of need, the
higher-level needs assume less prominence since they have been adequately met.
Although lower level needs may at times increase in importance as a consequence of
progressing through stages of psychological development, a person tends to develop a
“personality structure” in which his various needs form a hierarchical system. Maslow

13
(1954) and Hoppock (1935) suggested that job satisfaction and dissatisfaction share a
single continuum. They reasoned that both intrinsic and extrinsic factors have the
capacity to create satisfaction and dissatisfaction. Maslow described one end of this
continuum as a “growth” needs and, at the other end of the continuum “deficiency”
needs. Pinder (1998) describes the first set of needs as basic survival needs, which can
be looked at as those needs being concerned with the avoiding of pain and discomfort
and as providing primary needs such as sex, thirst, and hunger. Pinder describes the
second set of growth needs as those that express themselves in attempts by people to
become all that they are capable of becoming.
1.5.2 Motivator/Hygiene Theory (Two-Factor Theory):
Herzberg (Herzberg, Mausner, Patterson, & Capwell, 1957; Herzberg,
Mausner, Patterson, & Capwell, 2002) used Maslow’s needs hierarchy to formulate
the motivator/hygiene theory of employee motivation. In 1968, Herzberg wrote about
the two different needs of man. The first need is the one that comes from human’s
animal nature – or the ingrained drive to avoid pain from the environment or the
learned practices that arise as a response to the basic biological needs. The other set of
needs relates to the unique characteristics of humans, the ability to achieve. It is
through this achievement that a person experiences psychological growth (Gruneberg,
1976).
Herzberg also theorized that growth or motivation factors intrinsic to the job
are: achievement, recognition for achievement, the work itself, responsibility, and
growth for advancement (Gruneberg, 1979). He also theorized that the hygiene factors
or those factors that produce dissatisfaction are: company policy and administration,
supervision, interpersonal relationships, working conditions, salary, status, and
security (Gruneberg).
Herzberg’s two-factor theory was tested by Schmidt (1976), when he
conducted a study using 74 educational administrators in Chicago. Schmidt collected
data using a modification of Herzberg’s interview technique and a questionnaire on
characteristics of the job. Each principal was asked to think of an incident that made
him feel exceptionally good or exceptionally bad about his job as an administrator,
either in his present position or in previous administrative positions. Each participant
was limited to four specific sequences of events: two positive and two negative. The
written responses were then coded by a set of encoders.

14
Using an ANOVA to determine relationships, Schmidt found that
achievement, recognition, and advancement, significant at the .01 level were
perceived to be major determinants of his subjects’ overall satisfaction. The author
also reported that interpersonal relations with subordinates, policy and administration,
interpersonal relations with superiors, and interpersonal relations with peers were
perceived to be major determinants of overall dissatisfaction.
1.5.3 Process Theories:
Process theories try to explain and describe the process of how behavior is
energized, directed, sustained, and stopped. To explain and describe behavior these
theories try to define the major variables that are important for explaining motivated
people (Campbell et al, 1970).
Process theorists see job satisfaction as being determined not only by the
nature of the job and its context within the organization, but also by the needs, values
and expectations that the individuals have in relation to their job (Gruneberg, 1979).
For example some individuals have a greater need for pay and achievement than
others and where a job gives no opportunity for increased pay or achievement; such
individuals are likely to be more frustrated than those whose need for higher pay and
achievement is less. Three sub-theories of process theory have been developed: theory
based on discrepancy between what the job offers and what is expected, theory based
on what an individual needs, and theory based on what the individual values.
1.5.4 Expectations and Equity Theory
Equity theory was most heavily influenced by James Adams and originated
around 1965 (Pinder, 1998). Equity theory was based upon three main assumptions.
First, that people develop beliefs about what constitutes a fair and equitable return for
their contributions to their jobs.
Secondly, equity theory assumes that people tend to compare what they
perceive to be the exchange they have with their employers to that which they
perceive co-workers have with their employers. Thirdly, equity theory holds that
when people believe that their own treatment is not equitable, relative to the exchange
they perceive others to be making, and they will be motivated to do something about
the inequity (Pinder, 1998). For example, one employee believes that another
employee makes twice as much as they do. Whether that belief results in

15
dissatisfaction depends on their beliefs about the value of contributions they make as
compared to their coworker.
People can tolerate seeing others earn more in pay and benefits if they do
believe that others are contributing more in the way of inputs (Pinder, 1998).
One main criticism of equity theory is that issues of fairness and justice can be
a matter of “the eye of the beholder”. There is always the possibility that what one
thinks or believes is not congruent with what is actually happening. Another
limitation to this theory is that it can be hard to compare one organization to another,
thus this theory is localized for the person.
1.5.5 Reference Group Theory:
Reference group theory gave rise to the thought that employees compare their
inputs and outputs from his/her job to others, such as his/her friends, co-workers, and
others in the industry. One can easily see this is prevalent in the field of education as
teachers and administrators often compare salary and benefits between districts and
states. Theorists, such as Hulin and Blood (1968) have argued that the understanding
of the groups to whom the individuals relate is critical to understanding job
satisfaction.
1.5.6 Needs/Fulfillment Theory:
Fulfillment theorists believed that people’s satisfaction is a function of how
much of a reward or outcome they are receiving for their work. Theorists simply
viewed satisfaction depending on how much of a given outcome or group of outcomes
a person receives (Lawler, 1994). The weakness of this theory was that in the
researchers failing to take into account the individual-difference factors of a person.
The individual-difference factor is how people feel about what they receive and what
outcomes they feel they should receive for their work. A person who expects to be
paid more for their work is more likely to be dissatisfied than someone who feels that
he is paid adequately for his work. “Individual-difference factors suggest that the
fulfillment-theory approach to job satisfaction is not valid, since this approach fails to
take into account differences in people’s feelings about what the outcomes they
should receive” (Lawler, p.83).
Theorists believed that satisfaction is determined by the differences between
the actual outcomes a person receives and some other outcome level. They would say
16
that what is received should be compared with another outcome level, and when the
outcome level is below the other outcome level, dissatisfaction results (Lawler, 1994).
This theory is clearly evident in teacher salaries. Teachers who feel their salaries or
benefits are below the state or regional level become dissatisfied with their employer.
Vroom (1964) developed two forms of need fulfillment theory. The first model was
the subtractive model which states that job satisfaction is negatively related to the
degree of discrepancy between what the worker needs and the extent to which the job
meets those needs. His second model is the multiplicative model in which the need for
importance is taken into account by multiplying the perceived amount of need
fulfillment offered by the job by the importance of the individual of that need
(Gruneberg, 1979).
1.5.7 Work Adjustment Theory:
In 1964, the first version of work adjustment theory was published by Dawis,
England, and Lofquist. The theory was revised in 1968, and extended forms of the
theory were published in book form in 1969 (Lofquist & Dawis, 1969). The theory of
work adjustment is based on the concept of correspondence between the individual
and environment (Davis & Lofquist, 1984).
This theory includes a basic assumption that the individual seeks to achieve
and to maintain correspondence with the environment. While many kinds of
environments exist for an individual – home, school, work, church – to which an
individual must relate, achieving and maintaining correspondence with one
environment may affect the correspondence with other environments.
Work then represents one such environment in which one must relate.
Satisfaction then indicates the correspondence between the individual and the work
environment (Davis & Lofquist, 1984).
Davis, England and Lofquist (1964) formulated a theory of vocational
psychology that was based on the idea that the individual is a responding organism.
As individuals respond to their environment, their responding becomes associated
with reinforces in the environment. Davis et al. (1964) summarized the theory of work
adjustment in the following statements:
1. Work is conceptualized as an interaction between an individual and a work
environment.

17
2. The work environment requires that certain tasks be performed, and the individual
brings skills to perform the tasks.
3. In exchange, the individual requires compensation for work performance and
certain preferred conditions, such as a safe and comfortable place to work.
4. The environment and the individual must continue to meet each other’s
requirements for the interaction to be maintained. The degree to which the
requirements of both are met may be called correspondence.
5. Work adjustment is the process of achieving and maintaining correspondence.
Work adjustment is indicated by the satisfaction of the individual with the work
environment and by the satisfaction of the work environment with the individual, by
the individual’s satisfaction.
6. Satisfaction and satisfactoriness result in tenure, the principal indicator of work
adjustment.
7. Work personalities and work environments can be described in terms of structure
and style variables that are measured on the same dimensions (p. 9-10).
Looking at these seven summary statements of work adjustment it is easy to see why
many researchers use this instrument when exploring aspects of job satisfaction
(Chen, 2000; Genzen, 1993; Sutter, 1994; Waskiewicz, 1999). Each of the seven
statements adds to the concept that individuals act, react, and come to terms with their
work environment thus adjusting to the work environment.
1.5.8 Job Characteristics Model:
Hackman & Oldham proposed the Job Characteristics Model, which is widely
used as a framework to study how particular job characteristics impact on job
outcomes, including job satisfaction. The model states that there are five core job
characteristics (skill variety, task identity, task significance, autonomy, and feedback)
which impact three critical psychological states (experienced meaningfulness,
experienced responsibility for outcomes, and knowledge of the actual results), in turn
influencing work outcomes (job satisfaction, absenteeism, work motivation, etc.).The
five core job characteristics can be combined to form a motivating potential score
(MPS) for a job, which can be used as an index of how likely a job is to affect an
employee's attitudes and behaviors----. A meta-analysis of studies that assess the
framework of the model provides some support for the validity of the JCM.
18
1.5.9 Dispositional Theory:
Another well-known job satisfaction theory is the Dispositional Theory. It is a
very general theory that suggests that people have innate dispositions that cause them
to have tendencies toward a certain level of satisfaction, regardless of one’s job. This
approach became a notable explanation of job satisfaction in light of evidence that job
satisfaction tends to be stable over time and across careers and jobs. Research also
indicates that identical twins have similar levels of job satisfaction.
A significant model that narrowed the scope of the Dispositional Theory was
the Core Self-evaluations Model, proposed by Timothy A. Judge in 1998. Judge
argued that there are four Core Self-evaluations that determine one’s disposition
towards job satisfaction: self-esteem, general self-efficacy, locus of control, and
neuroticism. This model states that higher levels of self-esteem (the value one places
on his/her self) and general self-efficacy (the belief in one’s own competence) lead to
higher work satisfaction. Having an internal locus of control (believing one has
control over her\his own life, as opposed to outside forces having control) leads to
higher job satisfaction. Finally, lower levels of neuroticism lead to higher job
satisfaction.
1.5.10 Affect Theory:
Edwin A. Locke’s Range of Affect Theory (1976) is arguably the most famous
job satisfaction model. The main premise of this theory is that satisfaction is
determined by a discrepancy between what one wants in a job and what one has in a
job. Further, the theory states that how much one values a given facet of work (e.g.
the degree of autonomy in a position) moderates how satisfied/dissatisfied one
becomes when expectations are/aren’t met. When a person values a particular facet of
a job, his satisfaction is more greatly impacted both positively (when expectations are
met) and negatively (when expectations are not met), compared to one who doesn’t
value that facet. To illustrate, if Employee A values autonomy in the workplace and
Employee B is indifferent about autonomy, then Employee A would be more satisfied
in a position that offers a high degree of autonomy and less satisfied in a position with
little or no autonomy compared to Employee B. This theory also states that too much
of a particular facet will produce stronger feelings of dissatisfaction the more a
worker values that facet.
19
1.6 MEASURING JOB SATISFACTION:
There are many methods for measuring job satisfaction. By far, the most
common method for collecting data regarding job satisfaction is the Likert Scale
(named after Rensis Likert). Other less common methods of for gauging job
satisfaction include: Yes/No questions, True/False questions, point systems,
checklists, and forced choice answers. This data is typically collected using an
Enterprise Feedback Management (EFM) system.
The Job Descriptive Index (JDI), created by Smith, Kendall, & Hulin (1969),
is a specific questionnaire of job satisfaction that has been widely used. It measures
one’s satisfaction in five facets: pay, promotions and promotion opportunities,
coworkers, supervision, and the work itself. The scale is simple, participants answer
either yes, no, or can’t decide (indicated by ‘?’) in response to whether given
statements accurately describe one’s job.
The Job in General Index is an overall measurement of job satisfaction. It is
an improvement to the Job Descriptive Index because the JDI focuses too much on
individual facets and not enough on work satisfaction in general.
Other job satisfaction questionnaires include: the Minnesota Satisfaction
Questionnaire (MSQ), the Job Satisfaction Survey (JSS), and the Faces Scale. The
MSQ measures job satisfaction in 20 facets and has a long form with 100 questions
(five items from each facet) and a short form with 20 questions (one item from each
facet). The JSS is a 36 item questionnaire that measures nine facets of job satisfaction.
Finally, the Faces Scale of job satisfaction, one of the first scales used widely,
measured overall job satisfaction with just one item which participants respond to by
choosing a face.

20
1.7 VARIABLES OF JOB SATISFACTION:
Some research has been completed on principals’ job satisfaction and the
relationship to specific characteristics. Throughout the research, little consistency is
apparent in the findings. The characteristics most often examined include: age,
gender, salary, number of assistant principals, experience, tenure, school socio-
economic level, school size, and school accreditation status.
In 1966, Klien and Maher use Herzberg’s theories to complete a study of
educational level, pay, and job satisfaction. Using an attitude questionnaire, Klien and
Maher, surveyed 727 first-level managers of an electronics manufacturing population.
Using a simple t test, they found that there was a negative relationship between
education and job satisfaction (M=2.64, SD=.94), p<.001. One of the studies in
education, using Herzberg’s theory, was conducted by Friesen, Holdaway and Rice
(1983). They surveyed 410 principals from Alberta, Canada. The principals were
given a questionnaire that asked them two main questions: (a) what two factors
contribute most to your overall satisfaction with the principalship? And (b) which two
factors contribute most to your overall dissatisfaction with the principalship? They
reported that the major characteristics of satisfaction for the principals they studied
were: (a) interpersonal relationships; (b) achievement; and (c) responsibility/job
autonomy. They also reported that student attitudes and performance, job challenge,
recognition and status, and job importance had secondary significance in terms of
satisfaction. Frisen, Holdaway and Rice also reported the highest characteristics of job
dissatisfaction as: (a) relationships with parents; (b) amount of work; (c) overall
constraints; (d) attitudes of society; and (e) working conditions.
1.7.1 Age:
Age is an important variable because employees of any organization usually
vary in ages thus age is often studied by researchers looking at job satisfaction.
Herzberg et al. (1957) studied age relative to job satisfaction and found that job
satisfaction for a younger worker starts high at the beginning of the career, declines,
and then starts to rise again with increased age. The Unshaped curve result that shows
the relationship between job satisfaction and age starting high, declining, and then
starting to improve again were also found in a study by Kacmar and Ferris (1989) In
1985, Penn studied selected black school administrators in Virginia using Herzberg’s
21
Motivation Hygiene Theory to identify satisfiers and dissatisfies of their job. Penn
also attempted to determine if there was a relationship between age, tenure, size of
pupil enrollment, and other demographic variables and job satisfaction or
dissatisfaction among black administrators. Penn used a taped phone interview to
survey forty-one of the 53 possible black administrators identified for the study. He
found that black school administrators identified achievement, recognition, work
itself, and responsibility as significant motivators and school district policy and
administration as a significant hygiene factor. Penn also found that none of the
demographic factors used in the study were significantly related to the identification
of motivators and hygiene factors of black administrators in Virginia. For example,
salary resulted in a chi square of .188 and to be significant, a chi square of 3.84 was
required. The results were similar for all demographic factors. Other classic studies
have looked at age and job satisfaction (Saleh & Otis, 1964); however more recently,
Lim (1985) studied job satisfaction among educators and found that older, more
experienced school administrators and teachers were more satisfied than younger, less
experienced administrators and teachers. Brush, Moch, and Pooyan (1987) analyzed
19 studies that found a correlation between age and job satisfaction. Their syntheses
indicated that age and job satisfaction are related and that job satisfaction increases
with age.
1.7.2 Tenure:
Tenure and age are often similar from a research perspective. If a principal has
a long tenure in a district they tend to be older. Putting age aside it would be
interesting to see if job satisfaction increases or decreases with length of service in
one district. Very little research has been developed that explores the relationship of
tenure in a school district and job satisfaction. Brady (2001) found in her study of
California principals that the length of years in current position relates to principals
perceived job performance and overall job satisfaction. Brady theorized that
principals who stayed in their current position the longest most likely stayed due to
high job satisfaction and perceived job performance. While Brady’s study did not
prove this theory the study left open the possible discussion of the tenure as it relates
to job satisfaction. It would be an interesting component of the proposed research to
use tenure in the current position as a criterion variable as a predictor of job
satisfaction.

22
1.7.3 Education Experience:
Education experience is interesting as one looks at the job satisfaction of
newer principals versus the job satisfaction of more experienced principals. Sutter
(1994) studied secondary assistant principals, in Ohio, to determine the relationship
between job satisfaction and administrative experience. He found no significant
relationship between job satisfaction and experience. Bridges (1995) conducted a
similar study using assistant principals and also found no relationship between
experience and job satisfaction. Newby (1999) also found no significance between job
satisfaction and experience level in her study of middle school principals in Virginia.
The studies that have shown a significant difference between education level and job
satisfaction have not been done in an education setting (Klien & Maher, 1966; Quinn,
Graham, & McCullough, 1974).
1.7.4 Gender:
Many people take for granted the idea that most people, male and female, will
hold down a job for much of their lives. Gender however has long been a factor in
many aspects of human existence such as child rearing, voting rights, military
participation and in the workforce. Recently, technological and industrial change has
played a major role in what kinds of jobs are available to both men and women.
(Figart, Mutari, and Power, 2002) Gender issues in education administration have
only recently come to the forefront of research due to the increases in females in
administrative positions. Virginia high schools still have a large majority of male
principals at the high school level; still it would be interesting to investigate the
differences between the levels of job satisfaction among male and female principals to
determine which variables contribute to the job satisfaction of male and female
principals. Eckhman (2002) conducted a study that suggests that in order for schools
to recruit and to retain female principals, the schools must give consideration to the
role conflict, role commitment, and job satisfaction of high school female principals.
Looking at this variable in Virginia will give insight to the levels of job satisfaction
among Virginia female high school principals.
There have been a number of studies investigating gender differences and job
satisfaction (Hulin & Smith, 1964; Poole, 1992; Vaughn-Wiles, 1987). While most
studies use gender as a predictor variable, they report little or no significance as
related to job satisfaction (McCann, 2002; Newby, 1999).

23
1.7.5 Salary:
A person’s salary is often linked to one’s level of achievement and success.
Hoppock (1977) suggested that a significant difference exists in the average salaries
of the most satisfied and the least satisfied teachers. Those teachers who earn higher
salaries were more satisfied that those who had low-income earnings. The findings of
Happock were supported by a study conducted by Porter and Lawler (1968). They
concluded that job satisfaction reflects the rewards (salary) the employees get for the
type of work they do. Other classic studies suggest a positive correlation between job
satisfactions and pay (Blanchflower, Oswald, & Warr, 1993; Schwab & Wallace,
1974). More recently Kim & Loadman (1994) conducted a study of 2054 practicing
classroom teachers. They found that job satisfaction and pay satisfaction were
significantly related. Tablature (2002) in his dissertation study found that urban,
suburban, and rural principals were not satisfied with how well they are compensated,
thus salary was determined to be a factor in job satisfaction. Barry (2002) reported
that among 173 Michigan high school principals surveyed during the 2000-2001
school year, those principals who were paid more, were more satisfied with their
work.
1.7.6 Institution Size:
School size refers to the number of students enrolled in the identified school
location. With an increase in school size comes more extra and co-curricular activities
and thus more supervisory responsibilities and more activities to monitor. In his
dissertation, Armstrong (2001) hypothesized that as school size increases, levels of
job satisfaction among principal’s decreases. For his study, Armstrong used a
questionnaire, which he distributed to a random sample of 20 high school principals
from each of four size classifications in Missouri. Bradley found that the principals of
schools with student populations from 188 to 1,026 were the most satisfied with their
jobs and the principals of the schools in the largest class size (1,027 and above), were
the least satisfied. For these reasons, the researcher felt that it would be an interesting
component of the study to look at this topic of school size as a predictor variable for
job satisfaction. Barry (2002) conducted a survey of 173 high school principals in
Michigan during the 2001-2002 school years. He reported that principals in large high
schools (class A) had a higher satisfaction with promotion and overall satisfaction
than those principals in smaller schools (class C).

24
1.7.7 Number of Teachers:
Very little documented research supports the idea that principal job
satisfaction can be attributed to the number of assistant principals at the school.
However, experience would tell that the more help a principal has to run the building
and to assist with the operation of the school, the more likely the principal will have a
higher level of job satisfaction. On the converse side, having more assistant principals
can be a problem in more supervision and training of the assistant principals. In a
study of principals in Virginia, two thirds of the principals who responded to the
survey reported that they had neither sufficient time or personnel (i.e., assistant
principals) to fulfill the mandated expectations of and instructional leader (DiPaola &
Tschannen-Moran, 2003).
1.7.8 Socio-Economic Position of the Institute:
For the most part, studies of job satisfaction among principals avoid the
variable of school location or school socio-economic status. Instead, most studies
choose to focus on issues of age, gender, and degree status. However, in a study
conducted by Derlin and Schneider (1994) they surveyed 326 urban and suburban
principals to determine their level of job satisfaction. They found that job satisfaction
for suburban principals and location was more influential than for urban principals.
Sablatura (2002) investigated how public school principals in Texas view job
satisfaction as it relates to school location. Sablatura’s objective was to examine how
job satisfaction is perceived and the differences of those perceptions among urban,
suburban, and rural principals. He found that there were similar levels of job
satisfaction among the variables of achievement, the work itself, compensation, and
relationships with stakeholders. There were differences in job satisfaction in regards
to advancement opportunities, supervision, recognition, responsibility, social status,
and job security.
1.7.9 Percent of Time Spent with Students:
One variable missing from the research is the idea of interaction with students.
Considering that the foremost focus of any education institution is the students, it is
interesting to note that most of the studies completed leave out the aspect of student
interaction. In a study conducted with high school principals in Texas, principals rated
enjoying contact with students and having an opportunity to impact students as the

25
two highest positive aspects of their jobs (Malone, Sharp, & Walter, 2001). Teaching
has many positive aspects, but probably the greatest aspect is helping students learn,
seeing them achieve, and building lasting relationships that extend beyond the
classroom (Hounshell & Griffin, 1989). Ron Clark, 2001 Disney Teacher of the Year
Award winner offers these four key points in dealing with children: (a) students need
structure; (b) students will work hard for you, if they like who you are as a person; (c)
students like to know what is expected of them, and (d) students like to know they are
cared for (Clark, 2003). If principals are expected to lead the learning and guide
teachers, then it is reasonable to expect principals to help students learn and achieve,
give students structure, care for the students and build relationships with students.
1.7.10 College Accreditation Status:
More than ever in the history of education, schools are being required to meet
standards and levels of accountability for educating students. Principals are being
asked to know the standards, align instructional programs, know the state
assessments, and analyze and disaggregate data to ensure their school meets the
requirements of the state and federal government (Thomas, 2002).
In Virginia, the Virginia Standards of Learning tests and accreditation of
schools as a result of the tests have given rise to a new stress on principals. Principals
must not only lead the learning, but also ensure that their schools maintain test scores
and make Adequate Yearly Progress, a minimum level of improvement on state
assessments from year to year (Ross, 2003).
The Virginia Department of Education’s website offers the following guidelines for
use of time under school reform. According to the website the school principal should
ensure that the following indicators are in place with regards to instructional time:
• Structuring classroom instructional time to maintain an academic focus throughout
the entire lesson,
• Arranging classroom instructional time to allow for a variety of instructional
activities,
• Teachers planning and collaborating on instructional issues,
• Regularly monitoring the use of instructional time in classrooms,
• Using instructional time to implement specific instructional models, in certain
subject areas, as prescribed by model developers,
• Minimal interruption of instructional time, and
26
• Pacing of the curriculum as it is taught reflects the SOL Test Blueprints and guides
teachers in the use of time needed to teach concepts and skills in the SOL. In the era
of accountability principals are called upon to develop school schedules that
maximize instruction. The Virginia Department of Education also offers the following
guidelines for school scheduling under school reform.
• Meeting Standards of Accreditation (SOA) requirements for length of school year,
length of school day, and number of hours of instruction in core areas,
• Allocation of resources to extend learning time beyond the regular school day,
• Utilizing a school schedule that is conducive to providing intervention and
remediation strategies within the school day, and
• Scheduling non-academic events to minimally impact instructional time
(www.pen.k12.va.us/VDOE/Publications/schcnt.htm).
With these recommendations from the Virginia Department of Education, it is
easy to see the newly increased pressure on the principals to insure that school
schedules and instruction are appropriately practiced within the school. Failure to do
either of these two job components most certainly will lead to a principal’s dismissal.
27
1.8 DIMENSION OF JOB SATISFACTION:
Satisfaction is a psychological factor. It cannot be seen and cannot quantify.
But its expression in human mind is understandable. When an employee is satisfied
with his assigned task and can discharge his faction’s satisfactorily, it is called ‘job
satisfaction’ Hoppock has brought the term ‘job satisfaction’ to limelight. After
reviewing 32 studies on job satisfaction prior to 1933, he said, ‘job satisfaction’ is
‘‘(the combination of psychological, physiological and environmental circumstances
that cause a person to truthfully say, “I am satisfied with my job” He has laid
importance on the factors affecting job satisfaction but does not indicate the nature of
job satisfaction. A comprehensive definition of job satisfaction is given by Locke is “a
pleasurable or positive emotional state resulting from the appraisal of one’s job or job
experience)’’. It is the result of employee’s perception of how well their job provides
those things that are viewed as important. Job satisfaction is generally recognized in
the organizational behavior field that it is the most important and frequently studies
attitude. There are three dimensions of job satisfaction —
(a) It is an emotional response to a job situation,
(b) It is often measured by how well outcomes meet or exceed expectations,
(c) It represents several related attitudes.
Smith, Kendall, and Mulin have suggested that there are five job dimensions.
These are
(1) The work itself.
(2) Pay support for work
(3) Promotion opportunities,
(4) Supervision
(5) Coworkers.
There are a number of outcomes of job satisfaction. For example, although
the relationship with productivity is not clear, low job satisfaction tends to lead to
both turnover and absenteeism, while high job satisfaction often results in fewer on
the job accidents and work grievances and less time needed to learn new job related
tasks. Most recently, satisfied workers have been found to exhibit desirable pro social
“Citizenship” behaviors and activities.
28
1.9 FACTORS INFLUENCING JOB SATISFACTION:
There a number of factors that influences one's satisfaction in the job situation.
They can be categorized under two broad headings. (1) Organizational Factors. (2)
Personal Factors.
1.9.1 Organizational Factor:
A major amount of time is spent in the work place by all of us. The place
where we spend such a lot of time should fulfill our needs to some extent. The factors
related to the work place are:
1.9.1.1 Reward:
Reward includes all incentives like raise in pay, perks, facilities and promotion. The
promotion factor is a major factor in job satisfaction. An employee can only achieve
job satisfaction and work better when he knows that he will get his dues and raises in
due time.
1.9.1.2 Physical Working Condition:
The physical working conditions like availability of necessary furniture, lighting
facilities, work hazard* also plays a major role in the factor of job satisfaction.
1.9.1.3 Cooperation:
Cooperation and attitude of the staff members with the person is also an important
factor in the Job satisfaction of the person.
1.9.2 Personal Factors:
The second major factors are the personal factors. These are as follows:
1.9.2.1 Interest:
Whether the nature of the work is of interest to the employee is a question. Answer of
which tells the job satisfaction of the person.
1.9.2.2 Personality Traits:
Some jobs are suitable only to a certain type of personalities. For example a doctor or
a sales person Job is such that they are in regular contact with general public. If they
are shy in nature or cannot talk much they will not be able to be successful in that
setting which will cause dissatisfaction to them. While choosing for a job one should
see that they have those personality traits which are necessary for that job because
matching of the personality traits with the job is very necessary.

29
1.9.2.3 Status and Seniority:
It has been found that the higher a person's position with in the organization the job
satisfaction reported is also high.
1.9.2.4 Life Satisfaction:
Whether the job which a person is doing giving the person life satisfaction too? Life
satisfaction is a term which is referred to Maslow's hierarchy of need of self
actualization. A person wants to establish or reach a goal in his life and it can be
accomplished through the work which one is doing. It is other than the monetary part.
For example taking out publications or conducting researches etc.

30
1.10 MANAGEMENT TEACHERS AND JOB SATISFACTION:
The six job dimensions and ten hygiene factors theorized by Herzberg (1968)
have been commonly used in educational job satisfaction research; however, to this
point little research has been done in the United States specifically on high school
principal job satisfaction. There have been some studies completed at the secondary
level in Canada, England and Australia (Friesen et al, 1983; Gunn & Holdaway,
1986). These studies do not provide much insight to this research since the education
systems, the populations, and roles of the principals are different.
A study conducted by Brian Harvey and Honore France (1997), suggested that
an employee can be both satisfied and unsatisfied within a specific job. They
conducted a study using 53 men and 48 women in graduate-level education
administration courses at the University of Victoria (Canada). Fifty of the subjects
were working exclusively in administration; the others were working in a
teaching/administrative role, but anticipated working full time in administration after
graduate degree completion. The authors used the Manifest Needs Questionnaire
(MNQ) developed by Steers and Braunstein (1976) to measure achievement,
autonomy, affiliation, and dominance that education administrators express on the job
and the current satisfaction that education administrators experience on the job. The
data collected from the MNQ indicates interrelationships among the four need
subscales and a collection of job characteristics (i.e. job performance, work attitudes,
organizational attachment, leadership attributes). Obtaining satisfactory levels of
internal and external consistency have made the MNQ a productive instrument for
both overall personality and specific need expression on the job.
Harvey and France (1997) used correlations to measure interrelationships
between subscale on the MNQ and sex, age, years of teaching experience, years of
administrative experience and 23 characteristics present in the job. Not surprisingly,
the authors found no significant differences (3.15 up to 3.46), .10 < -p < .15, in the
sub-scales of gender, age, years of teaching experience. This study was limited in the
respect that all the subjects surveyed were in a graduate program for educational
leadership. One might expect that these subjects would be satisfied with their jobs, or
they probably would not be in a graduate program.
The interesting part of the survey was that the authors reported that this group
indicated an overall satisfaction was most highly related to security, freedom, and

31
variety on the job, p< .05. This would be a good study to compare to a survey of high
school principals in Virginia.
Since the study as completed was done with a very homogenous group, it
would be interesting to see if a repeat of the study with a diverse group would provide
different results.
Using the Minnesota Satisfaction Questionnaire as her research instrument,
Newby (1999) randomly selected 188 middle school principals in Virginia to answer
the survey on job satisfaction. Newby was attempting to answer three questions: (a)
what was the general level of satisfaction among middle school principals; (b) what is
the satisfaction level for each of the 20 dimensions of the job measured by the
Minnesota Satisfaction Questionnaire; and (c) what is the satisfaction for each
dimension according to the demographic variables: gender, age, degree, years of
experience, school location, and school size.
Newby reported that middle school principals in Virginia were generally satisfied
with their jobs. She reported that the mean satisfaction score was 3.65 on a scale of
1.00 (not satisfied) to 5.00 (extremely satisfied). She also reported similar results for
each of the 20 dimensions measured by the MSQ.
One criticism of the Newby study was the selection method used and the lack
of followup to gain data from no respondents. The author compiled data only on those
surveys that were voluntarily returned. She reported that 70% of the surveys were
returned, which is good for a mailed survey; however, the author gave no indication
of an attempt to get the 30% non-returns. Newby seemed satisfied to draw the
conclusions based on those who responded. The 30 % who failed to return the survey
may have made a difference in the final totals. Newby could have conducted a
random sample and phone follow up to collect data from no respondents. Then the
data for non-respondents could be compared to the other group to see if theirs differed
significantly.
A second criticism of this study was the small numbers distributions in some
areas of demographics. These small numbers may have led to false significance as a
result of unbalanced cells in the running of the ANOVA. For example, Newby
reported that the youngest group of principals surveyed obtained the highest mean and
that general satisfaction began to decline as principals reached the middle age groups.
She further reports that after age 55, satisfaction began to increase again. Upon closer
inspection, the youngest respondents numbered 34, and the oldest respondents

32
numbered 10, while the middle aged group numbered 82. Newby reported this
information as significant without giving any consideration that the significance can
be attributed to artifact error created by unbalanced cells and not actual significance.
Sutter (1994) conducted a study of 632 secondary assistant principals employed in
Ohio during the 1993-1994 school year, using The Minnesota Satisfaction
Questionnaire. Sutter found that assistant principals who believed they were
accomplishing much on the job reported a higher level of satisfaction compared to
assistant principals who believed they were accomplishing less. Sutter also found that
assistant principals who believed there would be opportunities for advancement
within their school system were found to have significantly higher, p=0.01, levels of
job satisfaction compared to those who didn’t believe those opportunities existed.
Also, Job Satisfaction 24 assistant principals who felt their talents and skills were
being utilized on their job had a higher level of job satisfaction than those who did not
hold this belief. Finally, Sutter reported that assistant principals who wanted to
become principals were found to have significantly higher, p=0.01, levels of job
satisfaction compared to those principals who did not aspire to be principals.
In 2000, Kuei-Lung Chen conducted a study using the MSQ in which he
studied 245 assistant principals in Mississippi to determine the degree of general,
intrinsic, and extrinsic job satisfaction among high school assistant principals. Chen
mailed a survey to the subjects and used the results to conduct a series of ANOVA.
His results showed a high degree of general, intrinsic, and extrinsic job satisfaction
among the assistant principals. Compensation and workload were the only factors
receiving a less than 50% satisfaction rating. Chen also reported no significant
relationship in two specific variables examined in the study: (a) length of time worked
as an assistant principal, and (b) school size in terms of student enrollment.
In 1990, Profit conducted a study that tested the relationship between locus of
control and job satisfaction of Appalachian principals of West Virginia, Virginia,
Kentucky, and Tennessee. Profit hypothesized that the Appalachian principals with
predominately internal loci of control will have significantly higher levels of job
satisfaction than those principals with external loci of control. Profit also
hypothesized that these same principals with predominantly internal loci of control
would have significantly higher levels of extrinsic job satisfaction that those same
principals with external loci of control.
33
To test these hypothesizes Profitt (1990) took a random sample (n = 333) of the
population (N = 2,649) and administered the Adult Nowicki-Strickland Internal-
External Scale (ANSIE) to measure locus of control and the Mohrman-Cooke-
Mohramn Job Satisfaction Scale. The author then used an ANOVA to test the two-
directional hypotheses that guided the study.
Profitt set an alpha level of 0.05 as the criterion level of significance for this study.
Profitt (1990) found a statistically significant relationship between internal loci of
control and intrinsic job satisfaction of Appalachian principals in the states of West
Virginia, Virginia, Kentucky, and Tennessee. Profitt also reported that female
principals of the Appalachian counties experienced significantly higher levels of
intrinsic job satisfaction than their male colleagues. He also reported that those same
principals who made in excess of $40,000 annually experience a high level of
extrinsic job satisfaction.
The main limitation of this study is the inherent weakness of using an
Internal/External locus of control (I/E) instrument. Also, Profitt chose only to
correlate gender and salaries with the I/E instrument. He failed to look at age, years
experience or school size. Also, Profitt grouped all principals together. He also made
no differentiation in his results regarding elementary or high school. With a high
concentration of female principals in the elementary school he should have reported
gender as well as school level. This would have given the study a clearer picture on
gender. Another limitation of this study was that the entire study was conducted in a
rural setting. Although this was the design of the study, it is also a limitation since it
limits the inferences that can be drawn from sample to populations other than the rural
population. Smith (1976) studied job satisfaction of Connecticut public senior high
school principals as related to school location and school size. Smith’s purpose for
this study was to determine the level of job satisfaction among current Connecticut
public senior high school principals, to determine if job satisfaction of these principals
differed according to location or size of school, and to see if certain personal
demographic variables could be used as predictors of principals’ job satisfaction. For
his study, Smith used the Minnesota Satisfaction Questionnaire (Long Form,
Adapted) and a demographic data sheet to survey 143 senior high school principals of
which 93% responded (n = 133). Smith found that Connecticut public school senior
high principals could be described as very satisfied with their jobs (M = 77.5, in a

34
range of 0-100). Smith also reported that with regards to school size these same
principals could be described as very satisfied with their overall job situations
regardless of school size (Large school M = 78.088, medium school M = 78.062, and
small school M = 79.147). Smith’s results showed that all groups of principals
unanimously ranked social service, moral values, activity, and achievement at the
high end of the satisfaction continuum.
The main limitation of Smith’s study was in the design itself. By limiting the
study to school size and location relative to job satisfaction, Smith discovered a high
level of job satisfaction and had little left to report. Additionally, when one looks at
the data of 1975, the principals surveyed were a highly homogeneous group; 97%
male, 95 % married, 98% white, 50% age 40 to 49, 57% Catholic. A replication of
this study today probably would reveal drastically different demographic data.
Watson (1991) studied job satisfaction among secondary principals in
California. Watson sent 97 secondary school principals a questionnaire. She reported
that the majority of the principals (87%) were satisfied with their job, 10% were
extremely satisfied with their jobs and 3% were less than satisfied. Watson also
reported no significant difference for job satisfaction as related to nine independent
variables: orientation, age, gender, and ethnicity, and salary, years as a secondary
principal, schools structure, school population, and district size.
The main limitation of the Watson study was the homogeneous group in which she
researched. Her sample was too small and homogeneous making it difficult to draw
conclusive results: 82% male, 92% white, and 61% in the age range of 45 to 54.

35
1.11 MANAGEMENT TEACHERS ROLES IN JOB SA1TISFACTION :
If job satisfaction is for Employee benefit, surely the worker must be able to
contribute to his or her own satisfaction and well-being on the job. The following
suggestions can help an employee find personal job satisfaction.
1.11.1 Seek opportunities to demonstrate skills and talents:
This often leads to more challenging work and greater responsibilities, with attendant
increases in pay and other recognition.
1.11.2 Develop excellent communication skills:
Employer’s value and reward excellent reading, listening, writing, and speaking skills.
1.11.3 Know more.
Acquire new job-related knowledge that helps you to perform tasks more efficiently
and effectively. This will relieve boredom and often gets one noticed.
1.11.4 Demonstrate creativity and initiative.
Qualities like these are valued by most organizations and often result in recognition as
well as in increased responsibilities and rewards.
1.11.5 Develop teamwork and people skills.
A large part of job success is the ability to work well with others to get the job done.
1.11.6 Accept the diversity in people.
Accept people with their differences and their imperfections and learn how to give
and receive criticism constructively.
1.11.7 See the value in your work.
Appreciating the significance of what one does can lead to satisfaction with the work
itself. This helps to give meaning to one's existence, thus playing a vital role in job
satisfaction.
1.11.8 Learn to de-stress.
Plan to avoid burnout by developing healthy stress-management techniques.

36
1.12 THE RELATIONSHIP OF JOB SATISFACTION WITH SOME FIELD
OF ORGANIZATION BEHAVIOR:
1.12.1 The relationship between leadership and job satisfaction:
Robbins (2003) indicates the management function of leadership is mainly
aimed to manage employee behavior and by explaining and predicting employee
productivity, resign rate and job satisfaction in an effort to reach the ultimate goals for
employees’ aggressive job involvement and the commitment to companies.
From developing the models of causality variables to affect job satisfaction,
Seashore and Taber (1975) proposes that the entire internal organization environment
includes organizational climate, leadership types and personnel relationship can affect
the job satisfaction of employee. Robbins (2003) conducts an experiment with the
subject of Fedex. From the research, it indicates that managers adopting the
transformational leadership management style cannot only bring with better work
performance rated by companies but also trigger their superiors to allow them with
more job promotion opportunities. The subordinates under transformational
leadership in less resign rate than that of transactional leadership but higher
productivity and job satisfaction.
Transformational leadership is positively correlated with the improvement of
subordinates’ working environment, the satisfaction of demands and executed
performance (Liu et al., 2003). From above discussions, we can deduce leadership has
a significantly positive effect on job satisfaction of employee.
1.12.2 The relationship between organizational culture and job satisfaction of
employee:
McKinnon et al. (2003) conducts a research with the subjects of diversified
manufacturing company in Taiwan. They find organizational cultural values of
respect for people; innovation, stability and aggressiveness had uniformly strong
association with affective commitment, job satisfaction and information sharing.
Robbins (1996) contends whenever the individual demand is congruent with
cultures, it will result in the highest job satisfaction. For example, the individuals with
high autonomy and high achievement motives will result in higher satisfaction under
the organizational culture with loose supervision and emphasis of achievement
rewarding.
37
Within the research, Huang and Wu (2000) indicate the organizational culture
of public business agencies will cause significant effect on organization commitment
and job satisfaction. Among the cultural dimensions of result orientation, professional
features, severe control and management and practical affairs, the said cultural
dimensions show significantly positive effect on aggressive commitment and job
satisfaction of employee. Also, the closed systems will cause negative effect on every
dimension within aggressive commitment and job satisfaction of employee.
By reviewing aforesaid scientific lectures, we can find most scholars’
confirmation of the significant relationship between organizational culture and job
satisfaction. It means organizational culture can actually affect the extent of job
satisfaction. Thus, if employees show higher identity extent to organizational cultures,
the extent of job satisfaction shall be higher naturally. According to above
discussions, we can deduce organizational culture has a significantly positive effect
on job satisfaction of employee.
1.12.3 The relationship between the operation of learning organization and job
satisfaction of employee:
Gardiner and Whiting (1997) indicate some well-established research results
and the said research results indicate within the altered behaviors conducted by
learning organizations in response to external environment cannot only bring with
beneficial effect on organization performance but also improve the job performance
and satisfaction of employee. Hong (2001) contends the operation efficiency of
learning organization can allow employees to firmly possess the skills about
personnel companionship interaction and correct social manners so that it is available
to boost morale and reduce the absence rate and job alternation rate. We can find from
the practical researches that the promotion of learning organization can help improve
job satisfaction. Under flexible experiment, the encouragement of continuous
learning, extensive learning of culture, and system thinking, it is available to change
employees’ attitude and opinions toward jobs and enhance the internal satisfaction
mentally.
Furthermore, improving employees’ idea about values and authorizing
employees can actually enhance job willing and motives and also intensify the
external satisfaction. Seeing from above literatures, we can find the operation of

38
learning organization has a significantly positive effect on job satisfaction of
employee.
1.12.4 Job satisfaction and emotions:
Mood and emotions while working are the raw materials which cumulate to
form the affective element of job satisfaction. (Weiss and Cropanzano, 1996). Moods
tend to be longer lasting but often weaker states of uncertain origin, while emotions
are often more intense, short-lived and have a clear object or cause.
There is some evidence in the literature that state moods are related to overall
job satisfaction. Positive and negative emotions were also found to be significantly
related to overall job satisfaction.
Frequency of experiencing net positive emotion will be a better predictor of
overall job satisfaction than will intensity of positive emotion when it is experienced.
Emotion regulation and emotion labor are also related to job satisfaction. Emotion
work (or emotion management) refers to various efforts to manage emotional states
and displays. Emotion regulation includes all of the conscious and unconscious efforts
to increase, maintain, or decrease one or more components of an emotion. Although
early studies of the consequences of emotional labor emphasized its harmful effects
on workers, studies of workers in a variety of occupations suggest that the
consequences of emotional labor are not uniformly negative.
It was found that suppression of unpleasant emotions decreases job
satisfaction and the amplification of pleasant emotions increases job satisfaction. The
understanding of how emotion regulation relates to job satisfaction concerns two
models:
1.12.4.1 Emotional dissonance. Emotional dissonance is a state of discrepancy
between public displays of emotions and an internal experience of emotions that
often follows the process of emotion regulation. Emotional dissonance is
associated with high emotional exhaustion, low organizational commitment, and
low job satisfaction.
1.12.4.2 Social interaction model. Taking the social interaction perspective,
workers’ emotion regulation might beget responses from others during
interpersonal encounters that subsequently impact their own job satisfaction. For
example: The accumulation of favorable responses to displays of pleasant
emotions might positively affect job satisfaction.

39
1.13 HOW TO GET MORE THAN SATISFACTION AT WORK:
Find meaning in your work, even if your job is un-challenging, or menial,
finding meaning will make it much more bearable, if indeed that is how you feel.(that
your work is unbearable)
There are three levels of meaning that we as teachers can obtain from our work.
1. No meaning. Work makes no sense to you
2. Work has meaning because it supports you and your family
3. Work has meaning in itself because you are contributing to something great or
you are making the world a better place.
The important thing here is that to some of us, work has no meaning, or that the job
they do has no meaning (to them). The difference is that some people understand the
meaning of their work, and sadly some don't.

40
1.14 RELATIONSHIPS AND PRACTICAL IMPLICATIONS OF JO B
SATISFACTION:
Job Satisfaction can be an important indicator of how employees feel about
their jobs and a predictor of work behaviors such as organizational citizenship,
absenteeism, and turnover. Further, job satisfaction can partially mediate the
relationship of personality variables and deviant work behaviors.
One common research finding is that job satisfaction is correlated with life
satisfaction. This correlation is reciprocal, meaning people who are satisfied with life
tend to be satisfied with their job and people who are satisfied with their job tend to
be satisfied with life. However, some research has found that job satisfaction is not
significantly related to life satisfaction when other variables such as non work
satisfaction and core self-evaluations are taken into account.
An important finding for organizations to note is that job satisfaction has a
rather tenuous correlation to productivity on the job. This is a vital piece of
information to researchers and businesses, as the idea that satisfaction and job
performance are directly related to one another is often cited in the media and in some
non-academic management literature. A recent meta-analysis found an average
uncorrected correlation between job satisfaction and productivity to be r=.18; the
average true correlation, corrected for research artifacts and unreliability, was r=.30.
Further, the meta-analysis found that the relationship between satisfaction and
performance can be moderated by job complexity, such that for high-complexity jobs
the correlation between satisfaction and performance is higher (ρ=.52) than for jobs of
low to moderate complexity (ρ=.29). In short, the relationship of satisfaction to
productivity is not necessarily straightforward and can be influenced by a number of
other work-related constructs, and the notion that "a happy worker is a productive
worker" should not be the foundation of organizational decision-making.
With regard to job performance, employee personality may be more important
than job satisfaction. The link between job satisfaction and performance is thought to
be a spurious relationship; instead, both satisfaction and performance are the result of
personality.

41
1.15 CREATING JOB SATISFACTION:
So, how is job satisfaction created? What are the elements of a job that create
job satisfaction? Organizations can help to create job satisfaction by putting systems
in place that will ensure that workers are challenged and then rewarded for being
successful. Organizations that aspire to creating a work environment that enhances job
satisfaction need to incorporate the following:
• Flexible work arrangements, possibly including telecommuting
• Training and other professional growth opportunities
• Interesting work that offers variety and challenge and allows the worker
opportunities to "put his or her signature" on the finished product
• Opportunities to use one's talents and to be creative
• Opportunities to take responsibility and direct one's own work
• A stable, secure work environment that includes job security/continuity
• An environment in which workers are supported by an accessible supervisor
who provides timely feedback as well as congenial team members
• Flexible benefits, such as child-care and exercise facilities
• Up-to-date technology
• Competitive salary and opportunities for promotion
Probably the most important point to bear in mind when considering job satisfaction
is that there are many factors that affect job satisfaction and that what makes workers
happy with their jobs varies from one worker to another and from day to day. Apart
from the factors mentioned above, job satisfaction is also influenced by the
employee's personal characteristics, the manager's personal characteristics and
management style, and the nature of the work itself. Managers who want to maintain a
high level of job satisfaction in the work force must try to understand the needs of
each member of the work force. For example, when creating work teams, managers
can enhance worker satisfaction by placing people with similar backgrounds,
experiences, or needs in the same workgroup. Also, managers can enhance job
satisfaction by carefully matching workers with the type of work. For example, a
person who does not pay attention to detail would hardly make a good inspector, and
a shy worker is unlikely to be a good salesperson. As much as possible, managers
should match job tasks to employees' personalities.

42
Managers who are serious about the job satisfaction of workers can also take
other deliberate steps to create a stimulating work environment. One such step is job
enrichment. Job enrichment is a deliberate upgrading of responsibility, scope, and
challenge in the work itself. Job enrichment usually includes increased responsibility,
recognition, and opportunities for growth, learning, and achievement. Large
companies that have used job-enrichment programs to increase employee motivation
and job satisfaction include AT&T, IBM, and General Motors (Daft, 1997).
Good management has the potential for creating high morale, high
productivity, and a sense of purpose and meaning for the organization and its
employees. Empirical findings by Ting(1997) show that job characteristics such as
pay, promotional opportunity, task clarity and significance, and skills utilization, as
well as organizational characteristics such as commitment and relationship with
supervisors and co-workers, have significant effects on job satisfaction. These job
characteristics can be carefully managed to enhance job satisfaction.
Of course, a worker who takes some responsibility for his or her job
satisfaction will probably find many more satisfying elements in the work
environment. Everett (1995) suggests that employees ask themselves the following
questions:
• When have I come closest to expressing my full potential in a work situation?
• What did it look like?
• What aspects of the workplace were most supportive?
• What aspects of the work itself were most satisfying?
• What did I learn from that experience that could be applied to the present
situation?
43
1.16 ASSURING JOB SATISFACTION:
Assuring job satisfaction, over the long term, requires careful planning and
effort both by management and by workers. Managers are encouraged to consider
such theories as Herzberg’s (1957) and Maslow's (1943) Creating a good blend of
factors that contribute to a stimulating, challenging, supportive, and rewarding work
environment is vital. Because of the relative prominence of pay in the reward system,
it is very important that salaries be tied to job responsibilities and that pay increases
be tied to performance rather than seniority.
So, in essence, job satisfaction is a product of the events and conditions that
people experience on their jobs. Brief (1998) wrote: "If a person's work is interesting,
her pay is fair, her promotional opportunities are good, her supervisor is supportive,
and her coworkers are friendly, then a situational approach leads one to predict she is
satisfied with her job" (p. 91). Very simply put, if the pleasures associated with one's
job outweigh the pains, there is some level of job satisfaction.

44
1.17 TEN WAYS TO MAINTAIN JOB SATISFACTION:
1. Believe - Believe in what you are doing
2. Be Honest - Trust in yourself and in others
3. Don't be afraid - Fear can and will hold you back - Overcome your fears
4. Be objective - Look at the big picture
5. Respect differences - Be non judgmental
6. Learn from your mistakes - Learning is key
7. Support your co-workers -
8. Be enthusiastic - Enthusiasm is contagious
9. Be results orientated - Performance = potential minus interference
10. Work as part of a team

45
1.18 FACTS OF JOB SATISFACTION:
Several studies on job satisfaction of industrial sales people have followed a
multi attribute approach to define and measure job satisfaction. Churchill, Ford and
walker (1974) in their pioneering study defined job satisfaction in terms of seven
attributes.
These attributes dealt with satisfaction related to the sales person’s: (i) Job (ii)
fellow workers (iii) Supervision (iv) company policy and support (v) pay (vi)
Promotion and advancement and (vii) customers. This classification of job
satisfaction attributes for sales persons was more or less followed in subsequent
studies though in certain studies job satisfaction measures developed in the larger
organization context was modified for measuring job satisfaction of sales persons (eg.
Kohli, 1989; Falhearty and Pappas, 2002).
The multiplicity of approaches necessitates the adoption of context specific
methodologies for identifying different facets of job satisfaction. The present study
was carried out among the sales persons in a pharmaceutical organization in India.
Due to the peculiarities of the task environment and the distinctive cultural
orientation, it became necessary to define job satisfaction in a contextually
meaningful manner. In order to understand the dimensions of job satisfaction, we
conducted a series of depth interviews with sales people as well as sales managers in
the organization. The main objective of this qualitative research was to understand the
structure and components of the job satisfaction construct relevant to the cultural and
organizational context of the sales people. The qualitative research also provided us
with the opportunity to develop context specific items to measure the job satisfaction
construct. The qualitative research led to the identification of five dimensions for
describing job satisfaction. These dimensions comprise of:
(i) Satisfaction with the overall human resources related policies and strategies
(ii) Satisfaction with compensation
(iii) Satisfaction with supervisory behavior
(iv) Satisfaction with the extent of task clarity and
(v) Satisfaction with the career prospects in the organization.
While these dimensions broadly follow the dimensions developed by Churchill, Ford
and Walker (1974), they do differ in certain aspects.

46
1.18.1 Satisfaction with Overall Human resources Policies and Strategies:
Through our discussions and depth interviews with sales person’s one main
dimension of job satisfaction that emerged was the overall satisfaction with the
Human Resources policies and strategies of the organization. This is often verbalized
in terms of such statements like “This company always acts for the well being of its
personnel” or the “I am satisfied with the overall working conditions”. This is a
reflection of the trust in the organization’s inclination in favor of its employees. The
informed sales persons tend to analyze the strategy of their present organization in
terms of its present strategies, policies and programs. Elements of the domain that
emerged out of the survey and which were included in operational sing this construct
include “the extent to which the management is fair in its policies towards personnel”,
“A clear path for the employee’s advancement”. “Confidence in the leadership”, “the
provision for training”. While issues like supervisory behavior and compensation
form part of the micro issues regarding a sales person’s engagement with the
organization, the overall policies and strategies regarding the personnel is associated
with a macro perspective with regard to a sales person’s evaluation of the
organization. For instance, even if the particular supervisor is fair and empathetic, if
the overall policies of the organization with regard to personnel are not up to the
satisfaction level of the sales person, he/she may be inclined to quit.
Being boundary spanners, it is often the sales force who get a first hand
opportunity to compare the personnel related strategies and policies of the company
with that of other companies. It is quite possible that strategies that are perceived as
unfair or that which is comparatively inferior to that of the other organizations might
create sufficient levels of dissatisfaction in the minds of the sales persons so that they
are more inclined to quit. People with high levels of industry experience are better
equipped to both analyze weak strategies on the part of the organization as well as
better positioned to take up other employment. Thus sales persons with high levels of
experience are more inclined to quit in the face of a lower level of satisfaction with
the strategies of the organization. On the other hand, a less experienced person with
higher levels of satisfaction will be more inclined to stay due to both his/her relative
lack of other options as well as because of a sense of optimism with the organization.
47
1.18.2 Satisfaction with Supervisor
The satisfaction with supervision has been widely discussed in the sales person
satisfaction research. Churchill, Ford and Walker (1974) consider this facet as one of
the dimensions of job satisfaction. Later studies have analyzed this variable in terms
of different dimensions like supervisory trust (Mulki, Jramillo and Locander, 2006)
supervisory behavior types (Kohli, 1989) etc. From our interviews with the sales
persons, it became very evident that the behavior and attitude of the supervisor was
one of the main components of job satisfaction. Several sales persons stated very
explicitly their positive (negative) feelings about the supervisor as an important
dimension of their satisfaction with the job. An experienced sales person can be
assumed to be very sensitive about the quality of supervision. At low levels of
satisfaction with the supervision, an experienced sales person can be expected to be
much more inclined to leave than a less experienced sales person who may be willing
to tolerate poor supervision for the sake of several other considerations. Further, in the
case of a highly experienced sales person, high levels of satisfaction with the
supervisor might not necessarily affect the disinclination to leave merely due to the.
1.18.3 Satisfaction with Compensation levels
Churchill, Ford and walker (1974) consider compensation as one among the
dimensions of job satisfaction among sales people. Satisfaction with the compensation
plan would therefore inevitably influence a sales person’s inclination to leave.
However, the extent to which a salesperson who is satisfied with the compensation
package will stay back would also depend on his overall assessment of various factors
like, the compensation package in other organization in relation to the work load, the
possibility of getting better compensation packages etc. These factors are all directly
related to a sales person’s level of industrial experience. Hence, a sales person’s level
of industrial experience in the field can be assumed to moderate the direct relationship
between the two constructs. For instance, an experienced sales person has a much
more well informed assessment about the compensation package and hence with
higher levels of satisfaction, his/her strength of disinclination to quit will be much
more higher than that of a relatively less experienced sales person as he/she is not
sufficiently informed about the industry standards as a comprehensive knowledge
48
about compensation. At the same time a highly experienced sales persons with less
satisfaction with the compensation will be that much more inclined to quit than a less
experienced sales person with the same lower level of satisfaction with the
compensation package.
1.18.4 Satisfaction with task clarity
Based on our qualitative research, an important dimension of job satisfaction that
emerged was the satisfaction with the decision making and reporting system. This
dimension was verbalized in terms of lack of ad hoc decisions, well defined job
responsibilities, uncompromising and transparent application of rules etc. It was felt
that sales persons prefer a system where the rules and roles are well defined and
implemented.
This apparently gives them a fair chance of assessing their career progression
and we label this construct as ‘task clarity’ since the construct effectively implies a
level of satisfaction with how the task is properly defined and implemented. Past
studies have considered such constructs like ‘role ambiguity’ (Behrman and Perreault,
1984; Churchill, Ford and Walker, 1976). The extent to which a sales person is
satisfied with the task clarity influences his/her intention to quit. However, a sales
person’s industrial experience plays an important part in determining the extent to
which the satisfaction with task clarity affects his/her (dis)inclination to quit. For
instance, experienced sales persons are expected to prefer lack of task uncertainly
since it gives them more opportunities to work independently. Here, it should be
understood that this dimension does not deal with the satisfaction with rules and
procedures per se but the extent to which these are followed in a transparent and
uncompromising manner by the management.
1.18.5 Satisfaction with Career Development
This dimension is associated with the perceived satisfaction with the extent to which
the sales person is able to apply him and gets opportunities to grow. The opportunities
and promotion dimension used by Churchill, Ford and walker (1974) comes close to
this construct. But this construct is also related to the extent to which the sales person
feels that his skills are adequately utilized and are given opportunities to grow. While
49
this aspect of job satisfaction is bound to critically affect the intention to leave, the
moderating effect of a sales person’s experience in this context cannot be ruled out.
Experienced people for instance are in a much better position to assess the extent to
which their skills are adequately being used and their opportunities to grow related to
that they would receive in other organizations. Thus, at high levels of satisfaction with
career development opportunities, an experienced sales person would be stronger in
their resolve to stay in the organization. At lower levels of satisfaction with this
attribute, highly experienced sales people would be the first to leave since they have a
good idea about better opportunities.

50
1.19 SUMMARY:
The chapter one review of literature explained several historic theories of job
satisfaction. Among these theories were: (a) fulfillment theory, (b) equity theory, (c)
discrepancy theory, (d) two-factor theory, (e) motivator/hygiene theory, and (f) work
adjustment theory. The literature review also looked at the importance of the
variables: age, tenure, education experience, gender, salary, school size, number of
assistant principals, school socio-economic status, and school accreditation status.
Finally, various studies conducted with regards to principal satisfaction were
analyzed.
• Adams, J.P. (1999). Good Principles, good schools. Thrust for Educational
Leadership, 29(1), 8 – 11.
• Anderson, K (2003, September 12). Few Districts are up to snuff. The free
Lance – star, pp. C1, C4.
• Armstrong, B. C. (2001). School size as a factor in the job satisfaction and
locus of control of high school principals in Missouri. Unpublished doctoral
dissertation, university of Kansas, Lawrence.
• Ary, D., Jacobs, L.C., & Razavieh, A. (2002). Introduction to Research in
education (6th ed.)
• Bayfield A H and Roth H F 1951 “An index of job satisfaction” journal of
applied psychology.
• Barry, D.A (2002). Job satisfaction and leadership style: A study of Michigan
high school principals. Unpublished doctoral dissertation, western Michigan
University, Kalamazoo.
• Belmont, CA: Wadsworth. Association of California School Administrators.
(2001). Recruitment and retention of school leaders: a critical state of need.
Sacramento: ACSA

51
• Best, J.W., & Kahn, J.V. (2003). Research in education (9th edition). Boston:
Pearson.
• Blanchflower, D.G., Oswald, J.V. (1993). Well being overtime in Britain and
USA. Hanover, NJ: Dartmouth College.
• Bowran J, Todd K. Job stressors and job satisfaction in a major metropolitan
public EMS service. Prehospital and Disaster Medicine 1999; 14(4):236-9.
• Brady, D.B. (2001). Correlates of job satisfaction among California principals.
Unpublished doctoral dissertation, university of Southern California, Los
Angeles.
• Brandt, R. (1987). On leadership and student achievement: a conversation
with Richard Andrews. Educational Leadership, 45(9), 12 – 16.
• Brayfield A, rothe HH. An index of job satisfaction. Journal of applied
psychology 1952; 35:307-11.
• Bridges, R.L. (1995). The relationship of job satisfaction with ten independent
variables: A study of Arkansas, Fayetteville.
• Brogan, G.B. (2003). Job satisfaction of Idaho high school principals.
Unpublished doctoral dissertation, Idaho State University, Boise.
• Bruce, W.M., & Blackburn, J.W. (1992). Balancing job satisfaction and
performance. Westport.
• Buchbinder RN , Wilson M, Melick CF, power NR> Primary care physician
job satisfaction and turnover. amer jour of managed care 2001;7(7) :16-21.
52
• Calnan m. wain wright C, forsythe M, wall B, Almond S. Mental health and
stress in the workplace; the case of general practice in the UK. Soc sci MED
2001 ; 52:499-507.
• Chopra G, Singh G. A study of job satisfaction among doctor in ESI
Corporation, Delhi. Hospital Administration 1992:29:30-6.
• Fifth – cozens J. individual and organizational predictor of depression. Br jour
Gen Prac 1999:48:1647 -51.
• Huby G, Gerry M, McKinstry B, Porter M, Shawj , Wrate R.Morale among
general practitioner: qualitative study exploring relations between partnership
arrangement, personal style, and work load. BMJ 2002;325;140
• Kmietowicz K. Quarter of GPs wants to quit, BMA survey shows. BMJ 2001;
323; 887.
• Korad Tr, Williams Es , Linzer M.” Measuring physician job satisfaction in a
changing workplace and a challenging environment.” Medical Care 1999:37
(11):1174-82.
• Pathman DE, Konard TR, William ES, Schlecker WE, linzer M. Physician
job satisfaction, job dissatisfaction, and physician turnover. Jour of FAM prac
2002; 5(7): 16-21.
• Rodriguez MJ, Mira JJ Alwarez J, Vatalla J. satisfaction of health care
providers and quality assurance in Spanish hospital. Work and stress
1922/6(3)/229-38
• Sibbald B, Enzer I, Cooper C, Rout U, Sutherland V. GP job satisfaction in
1987, 1900, and 1998: lessons for the future? Fram Prac 2000; 17:364-71.
53
• Singh p effect of occupational stress and mental health on job satisfaction of
nurses. MA Thesis, Luknow University, 1989.

54
CHAPTER 2: EDUCATION IN INDIA
Sr. No. Particular Page
No.
2.1 Education in India 57
2.2 History of Education in India 59
2.3 Indian Education System 60
2.3.1. Pre-primary education 61
2.3.2. Elementary education 62
2.3.3. Non graduation market 63
2.3.4. Higher education 64
2.3.5. Accreditation 66
2.3.6. Graduation market 67
2.4 Structure, Organization and Progress of Education in India 68
2.4.1. Early childhood education 69
2.4.2 Elementary education 69
(2.4.2.1) Facilities for expanding enrolment 70
(2.4.2.2) Curriculum development for elementary school 71
2.4.2.3 Non formal education 71
2.4.2.4 Secondary education 73
2.4.5 Higher education 74
(2.4.5.1) Current status 74
(2.4.5.2) Growth of higher education 75
(2.4.5.3) Enrolment 79
(2.4.5.4) Enrolment rate 80
(2.4.5.5) Discipline wise output of graduates and post
graduates 82
(2.4.5.6) Total graduates and post graduates 84

55
(2.4.5.7) Teachers in higher education 84
(2.4.5.8) Quality assurance mechanism 86
(2.4.5.9) Financing higher education 87
(2.4.5.10) Expenditure on education as a percentage of GDP 90
(2.4.5.11) Issues 93
(2.4.5.11.A) Excess 93
(2.4.5.11.B) Equity 94
(2.4.5.11.C) Quality 95
(2.4.5.11.D) Excess an equity 99
(2.4.5.11.E) Some public initiatives 99
(2.4.5.11.F) Innovative schemes 100
(2.4.5.11.G) Some recent policy initiatives by the government
for higher education 105
2.4.6 Technical education 107
(2.4.6.1) Important technical education institutions 107
A. Indian institute of technology 107
B. Indian institute of management 107
C. Indian institute of science (Bangalore) 108
D. Regional engineering college. 108
Other Institutes 109
2.4.7 Adult education 109
2.5 Expenditure on Education in India 110
2.6 Contemporary Education Issues 111
2.7 Initiatives 112
2.7.1 Non formal education 112
2.7.2 Bal Bhavan 112
2.7.3 Distance education 112
2.8 Education for Special Sections of Society 113
2.8.1 Woman 113
2.8.2 SC/ST and OBC 113
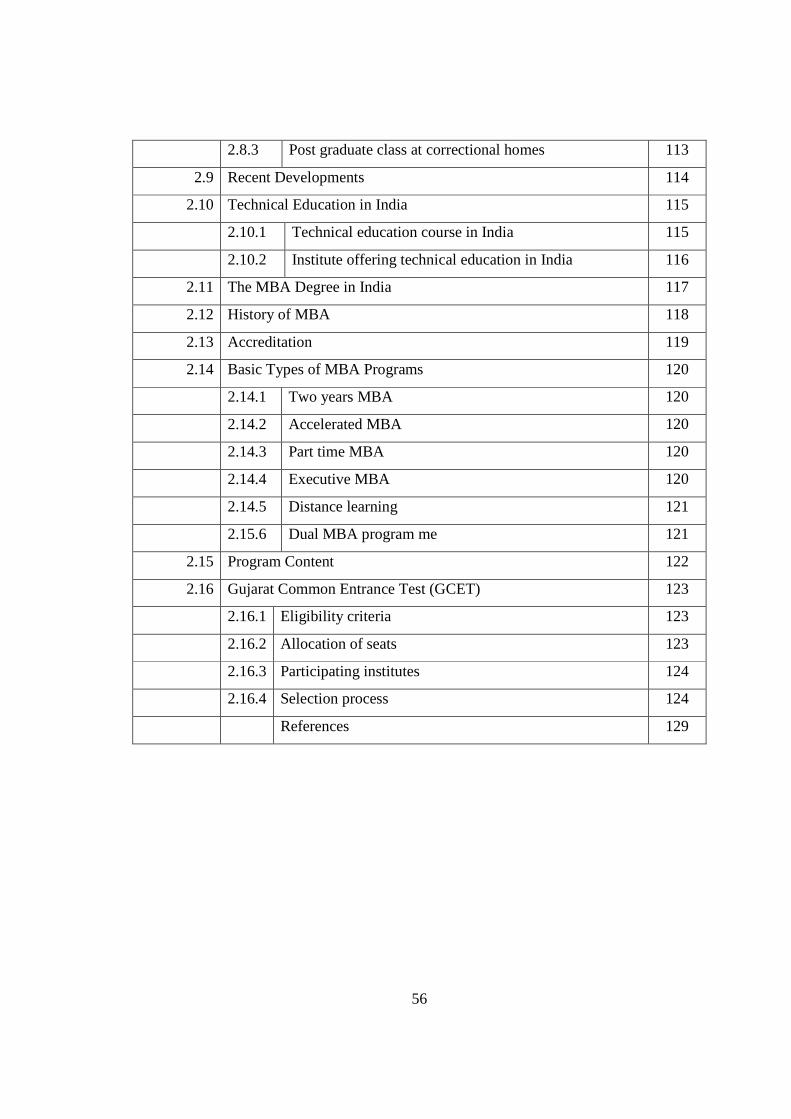
56
2.8.3 Post graduate class at correctional homes 113
2.9 Recent Developments 114
2.10 Technical Education in India 115
2.10.1 Technical education course in India 115
2.10.2 Institute offering technical education in India 116
2.11 The MBA Degree in India 117
2.12 History of MBA 118
2.13 Accreditation 119
2.14 Basic Types of MBA Programs 120
2.14.1 Two years MBA 120
2.14.2 Accelerated MBA 120
2.14.3 Part time MBA 120
2.14.4 Executive MBA 120
2.14.5 Distance learning 121
2.15.6 Dual MBA program me 121
2.15 Program Content 122
2.16 Gujarat Common Entrance Test (GCET) 123
2.16.1 Eligibility criteria 123
2.16.2 Allocation of seats 123
2.16.3 Participating institutes 124
2.16.4 Selection process 124
References 129

57
2.1 EDUCATION IN INDIA :
Education in India
Educational oversight
HRD Minister
Ministry of HRD
Kapil Sibbal
National education budget
• Discretionary
• Mandatory
Rs.24, 115 crore (2006-07)
?
?
Primary language(s) of education Hindi, English and Other regional languages
Literacy (2001)
• Men
• Women
64.8 %
75.3 %
53.7 %
Enrollment1 (2001-02)
• Primary (I-V)
• Mid/Upper Prim.(VI-VIII)
• Higher Secondary (IX-X)
189.2 million
113.9 million
44.8 million
30.5 million
1. doesn't include kindergarten enrollment
India has been a major seat of learning for thousands of years, dating back to
ancient seats of learning like Nalanda. In modern times, Indian educational institutions
(such as the IITs, IISc, IIMs, NITs, AIIMS, ISI, JU, BITS, and ISB) are well known in
the heart.
India, being a developing nation, struggles with challenges in its primary
education and strives to reach 100% literacy. Universal Compulsory Primary Education,
with its challenges of keeping poor children in school and maintaining quality of
education in rural areas, has been difficult to achieve Kerala is the only Indian state to
reach this goal so far.
58
All levels of education in India, from primary to higher education, are overseen by the
Ministry of Human Resource Development (Department of Higher Education (India) and
Department of School Education and Literacy), and heavily subsidized by the Indian
government, though there is a move to make higher education partially self-financing.
The Indian Government is considering allowing 100% foreign direct investment in
Higher Education.
59
2.2 HISTORY OF EDUCATION IN INDIA:
The history of education in India is very rich and interesting. One can trace the
ancient India education to the 3rd century BC. Research shows that in the ancient days,
sages and scholars imparted education orally, but after the development of letters, it took
the form of writing. Palm leaves and barks of trees were used for education, and this in
turn helped spread the written literature. Temples and community centers often took the
role of schools.
When Buddhism spread in India, education became available to everyone and this
led to the establishment of some world famous educational institutions Nalanda,
Vikramshila and Takshashila. These educational institutes in fact arose from the
monasteries. History has taken special care to give Nalanda University, which flourished
from the fifth to 13th century AD, full credit for its excellence. This university had
around 10,000 resident students and teachers on its roll at one time. These students
included Chinese, Sri Lankan, Korean and other international scholars.
It was in the 11th century that the Muslims established elementary and secondary
schools. This led to the forming of few universities too at cities like Delhi, Lucknow and
Allahabad. Medieval period saw excellent interaction between Indian and Islamic
traditions in all fields of knowledge like theology, religion, philosophy, fine arts,
painting, architecture, mathematics, medicine and astronomy.
Later, when the British arrived in India, English education came into being with
the help of the European missionaries. Since then, Western education has made steady
advances in the country. With hundreds of universities and thousands of colleges
affiliated to them, in fact scores of colleges in every discipline, India has positioned itself
comfortably as a country that provides quality higher education to its people in specific
and to the world in general.

60
2.3 INDIAN EDUCATION SYSTEM:
Indian Education System comprises stages called Nursery, Primary, Secondary,
Higher Secondary, Graduation and Post Graduation. Some students go in different stream
after Secondary for 3 Years Technical education called Polytechnics There are broadly
four stages of school education in India, namely primary, upper primary, secondary and
senior secondary.
Overall, schooling lasts 12 years, following the "10+2 pattern". However, there
are considerable differences between the various states in terms of the organizational
patterns years of schooling, mainly due to the existence of various State Education
Boards.
The government is committed to ensuring universal elementary education
(primary and upper primary) education for all children aged 6-14 years of age. Primary
school includes children of ages six to eleven, organized into classes one through five.
Upper Primary and Secondary school pupils aged eleven through fifteen are organized
into classes six through ten, and higher secondary school students ages sixteen through
seventeen are enrolled in classes eleven through twelve. In some places there is a concept
61
called Middle/Upper Primary schools for classes between six to eight. In such cases
class’s nine to twelve are classified under high school category. Higher Education in
India provides an opportunity to specialize in a field and includes Technical Schools.
Some of them are the Indian Institutes of Technology and Indian Institutes of Information
Technology.
In India, the main types of schools are those controlled by:
The state government boards, in which the majority of Indian children are enrolled.
• The Central Board of Secondary Education (CBSE) board.
• The Council for the Indian School Certificate Examinations (CISCE) board.
• National Institute of Open Schooling
• International Schools affiliated to the International Baccalaureate Programme.
According to the latest Government Survey undertaken by NUEPA (DISE, 2005-
6), there are 1,124,033 schools allover the country.
2.3.1 Pre-primary Education:
Pre-primary education in India is not a fundamental right, with a very low
percentage of children receiving preschool educational facilities. The largest source of
provision is the so called Integrated Child Development Services and Anganwadis.
However, the preschool component in the same remains weak.
In the absence of significant government provisions, the private sector is reaching
to the relatively richer sections of society and has opened a large number of schools
throughout the country. Provisions in these kindergartens are divided into two stages -
lower kindergarten (LKG) and upper kindergarten (UKG). Typically, an LKG class
would comprise children 3 to 4 years of age, and the UKG class would comprise children
4 to 5 years of age. After finishing upper kindergarten, a child enters Class 1 of primary
school. Often kindergartens are considered an integral part of regular schools. Though
there is a marked trend towards exclusive prep schools. A special Toddler/Nursery group
62
at the age of 2–2½ is also part of the pre-primary education. It is run as part of the
kindergarten. However, crèches and other early care facilities for the underprivileged
sections of society are extremely limited in number. There are some organized players
with standardized curricula coming of age which covers a very small share of the urban
population. Overall, the percentage enrollment of pre-primary classes to total enrollment
(primary) is 11.22% (DISE, 2005-06).
2.3.2 Elementary Education:
During the eighth five-year plan, the target of "universalizing" elementary
education was divided into three broad parameters: Universal Access, Universal
Retention and Universal Achievement. Which in broad sense of terms means, making
education accessible to children, making sure that they continue education and finally,
achieving the set quality goals. As a result of these education programs, by the end of the
year 2000, 94% of India's rural population had primary schools within one km and 84%
had upper primary schools within 3 km. Special efforts were made to enroll SC/ST and
girls. The enrollment in primary and upper-primary schools has gone up considerably
since the first five-year plan. So has the number of primary and upper-primary schools. In
1950-51, only 3.1 million students had enrolled for primary education. In 1997-98, this
figure was 39.5 million. The number of primary and upper-primary schools was 0.223
million in 1950-51. This figure was 0.775 million in 1996-97.
In 2006-7, an estimated 93% of children in the age group of 6-14 were enrolled in
school. The Government of India aims to increase this to 100% by the end of the decade.
To achieve this Government launched the Sarva Shiksha Abhiyan.
The strategies adopted by the Government to check the notorious drop-out rates are:
• Creating parental awareness
• Community mobilization
• Economic incentives
• Achieving the set Minimum Levels of Learning.
• District Primary Education Programme or the DPEP programme

63
• National Programme of Nutritional Support to Primary Education popularly
known as the Mid-day Meals Scheme.
• The 86th Constitutional Amendment Act was passed by the parliament to make
the Right to Elementary Education a fundamental right and a fundamental duty
(see also right to education).
• National Elementary Education Mission
• A National Committee of State Education Ministers has been set up within the
Ministry of Human Resource Development as the Chairperson of the committee.
• Media publicity and advocacy plans.
2.3.3 Non-graduation market:
This is a chart of non-graduation market of India as per Census 2001.
Educational level Holders
Total 502,994,684
Unclassified 97,756
Non-technical diploma or certificate not equal to degree 386,146
Technical diploma or certificate not equal to degree 3,666,680
Higher Secondary, Intermediate, Pre-university or Senior Secondary 37,816,215
Matriculation or Secondary 7,922,921
While availability of primary and upper primary schools has been augmented to a
considerable extent, access to higher education remains a major issue in rural areas
(especially for girls). Government high schools are usually taught in the regional
language, however urban and suburban schools usually teach in English. These
institutions are heavily subsidized. Study materials (such as textbooks, notebooks and
stationary) are sometime but not always subsidized. Government schools follow the state
curriculum.
There are also a number of private schools providing secondary education. These
schools usually either follow the State or national curriculum. Some top schools provide
64
international qualifications and offer an alternative international qualification, such as the
IB program or A Levels.
In the past decades, there has also been an effort to increase attendance in
vocational high schools and raise standards at the nation's ITIs - Industrial Training
Institutes. In 2008, it is estimated that over a million completed vocational training
through the Craft Training and Apprentice Training Schemes. Annual enrolment for high
school level vocational programs (at vocational high schools, ITIs and private vocational
institutes) is now approaching 3 million.
2.3.4 Higher Education:
Higher education in India has evolved in distinct and divergent streams with each
stream monitored by an apex body, indirectly controlled by the Ministry of Human
Resource Development and funded jointly by the state governments. Most universities
are administered by the States, however, there are 18 important universities called Central
Universities, which are maintained by the Union Government. The increased funding of
the central universities gives them an advantage over their state competitors.
Apart from the several hundred state universities, there is a network of research
institutions that provide opportunities for advanced learning and research leading up to a
PhD in various branches of science, technology and agriculture. Several have won
international recognition. 25 of these institutions come under the umbrella of the CSIR -
Council of Scientific and Industrial Research and over 60 falls under the ICAR - Indian
Council of Agricultural Research. In addition, the DAE - Department of Atomic Energy,
and other ministries support various research laboratories.
The Indian Institutes of Technology were placed 50th in the world and 2nd in the
field of Engineering (next only to MIT) by Times Higher World University Rankings
Earlier; an Asia Week study had ranked them as the best technical universities in Asia.
Indian Institute of Science is the premier research institute in the field of science and
engineering. There are several thousand colleges (affiliated to different universities) that
provide undergraduate science, agriculture, commerce and humanities courses in India.

65
Amongst these, the best also offer post graduate courses while some also offer facilities
for research and PhD studies.
Technical Education has grown rapidly in recent years. With recent capacity
additions, it now appears that the nation has the capability to graduate over 500,000
engineers (with 4-yr undergraduate degrees) annually, and there is also a corresponding
increase in the graduation of computer scientists (roughly 50,000 with post-graduate
degree). In addition, the nation graduates over 1.2 million scientists. Furthermore, each
year, the nation is enrolling at least 350,000 in its engineering diploma programs (with
plans to increase this by about 50,000). Thus, India's annual enrollment of scientists,
engineers and technicians now exceeds 2 million.
2008 data from Maharashtra's Higher Secondary Board reveals that .87 million
passed the school leaving exam and enrolled in college for undergraduate studies. Adding
enrolment in polytechnic programs and graduates from other boards puts Maharashtra's
total at close to a million and its college enrolment ratio at roughly 39%. States like
Tamil Nadu, Haryana and Kerala also have comparably high tertiary enrollment ratios. In
Andhra Pradesh, the tertiary enrolment rate is now approaching 25%.Across the country,
tertiary enrollment rates have been increasing at a rate between 5-10% in the last decade,
which has led to a doubling of the tertiary enrolment rate to near 20%. (However,
outdated government data does not yet capture this trend, which can be seen from
analyzing individual state data.)
International league tables produced in 2006 by the London-based Times Higher
Education Supplement (THES) confirmed Jawaharlal Nehru University (JNU)'s place
among the world's top 200 universities. Likewise, THES 2006 ranked JNU's School of
Social Sciences at the 57th position among the world's top 100 institutes for social
sciences. Calcutta University was the first university of modern India .Other prestigious
research institutes are The Saha Institute of Nuclear Physics, The Asiatic Society, and
The Indian Statistical Institute.
66
The National Law School of India University is highly regarded, with some of its
students being awarded Rhodes Scholarships to Oxford University, and the All India
Institute of Medical Sciences is consistently rated the top medical school in the country.
Indian Institutes of Management (IIMs) are the top management institutes in India.
The private sector is strong in Indian higher education. This has been partly as a
result of the decision by the Government to divert spending to the goal of universalization
of elementary education. Within a decade different state assemblies has passed bills for
private universities, and some of these universities are performing quite well. Some of
these universities include Birla Institute of Technology and Science, Amity University
and Xavier Labor Relations Institute.
2.3.5 Accreditation:
Accreditation for universities in India is required by law unless it was created
through an act of Parliament. Without accreditation, the government notes "these fake
institutions have no legal entity to call themselves as University/Vishwvidyalaya and to
award ‘degree’ which are not treated as valid for academic/employment purposes".
University Grants Commission Act 1956 explains,
“The right of conferring or granting degrees shall be exercised only by a
University established or incorporated by or under a Central Act Carlo bon tempo, or a
State Act, or an Institution deemed to be University or an institution specially empowered
by an Act of the Parliament to confer or grant degrees. Thus, any institution which has
not been created by an enactment of Parliament or a State Legislature or has not been
granted the status of a Deemed to be University is not entitled to award a degree."
Accreditation for higher learning is overseen by autonomous institutions
established by the University Grants Commission:
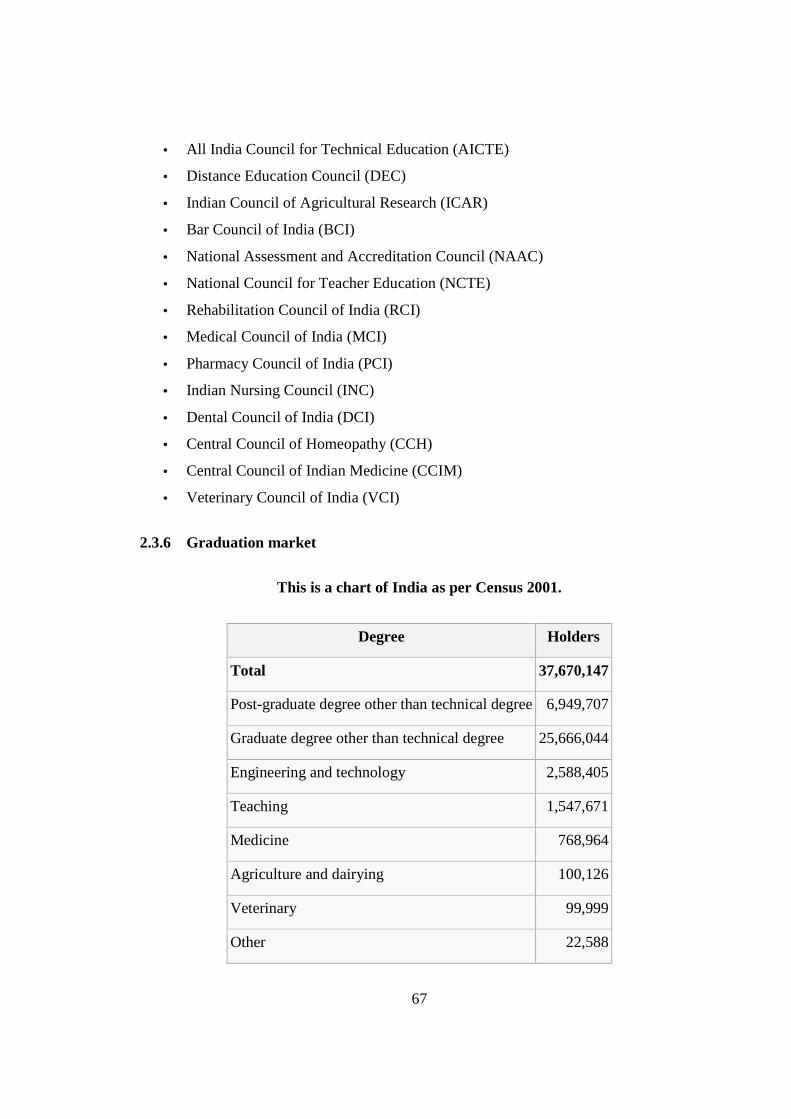
67
• All India Council for Technical Education (AICTE)
• Distance Education Council (DEC)
• Indian Council of Agricultural Research (ICAR)
• Bar Council of India (BCI)
• National Assessment and Accreditation Council (NAAC)
• National Council for Teacher Education (NCTE)
• Rehabilitation Council of India (RCI)
• Medical Council of India (MCI)
• Pharmacy Council of India (PCI)
• Indian Nursing Council (INC)
• Dental Council of India (DCI)
• Central Council of Homeopathy (CCH)
• Central Council of Indian Medicine (CCIM)
• Veterinary Council of India (VCI)
2.3.6 Graduation market
This is a chart of India as per Census 2001.
Degree Holders
Total 37,670,147
Post-graduate degree other than technical degree 6,949,707
Graduate degree other than technical degree 25,666,044
Engineering and technology 2,588,405
Teaching 1,547,671
Medicine 768,964
Agriculture and dairying 100,126
Veterinary 99,999
Other 22,588
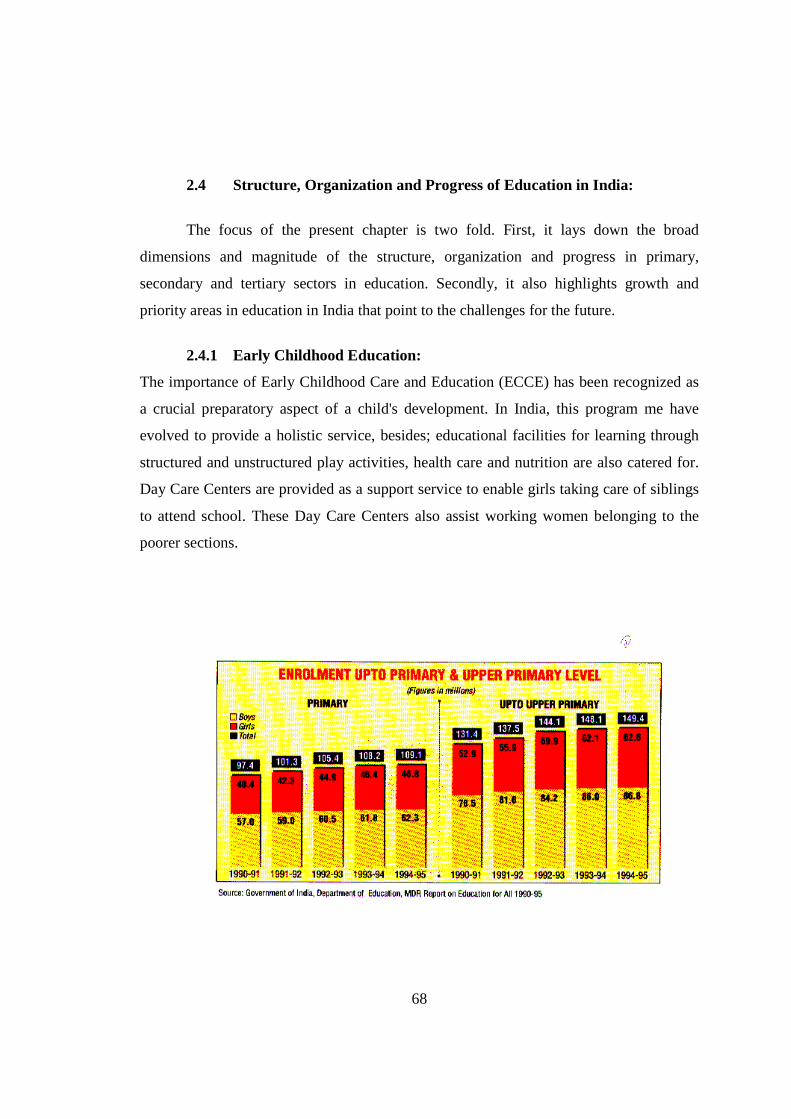
68
2.4 Structure, Organization and Progress of Education in India:
The focus of the present chapter is two fold. First, it lays down the broad
dimensions and magnitude of the structure, organization and progress in primary,
secondary and tertiary sectors in education. Secondly, it also highlights growth and
priority areas in education in India that point to the challenges for the future.
2.4.1 Early Childhood Education:
The importance of Early Childhood Care and Education (ECCE) has been recognized as
a crucial preparatory aspect of a child's development. In India, this program me have
evolved to provide a holistic service, besides; educational facilities for learning through
structured and unstructured play activities, health care and nutrition are also catered for.
Day Care Centers are provided as a support service to enable girls taking care of siblings
to attend school. These Day Care Centers also assist working women belonging to the
poorer sections.

69
Supplementing education at this level, the National TV Network has transmitted a
serial which introduces pre-school children to reading, numbers, geometric shapes, health
care concepts, sanitation and food using songs, animation and puppets. The number of
pre-primary schools has increased from 303 in 1951 to nearly 14 million in 1991-92
while the enrolment in these has gone up from 28,000 to 3.9 million for the
corresponding years.
2.4.2

70
2.4.2 Elementary Education:
The elementary education system in India is the second largest in the world with
149.4 million children of 6-14 years enrolled. This is about 82 per cent of the
children in this age-group. The emphasis, however, is not on enrolment alone,
equal attention is paid to retention and achievement. An estimated 95 per cent of
the rural population now has access to primary schooling facilities within a
walking distance of 1km; 84 per cent of the population is served by middle or
upper primary schools within a distance of 3 kms. The Gross Enrolment Ratio
(GER) for classes I-V is 104.0 and for classes VI-VIII it is 67.2 for the year 1994-
95, There has been a substantial increase in girls' enrolment: from 40.4 million in
1990-91 to 46.8 million in 1994-95 in primary schools and 52.9 million in 1990-
91 to 62.6 million in 1994-95 in upper primary schools.
71
2.4.2.1 Facilities for Expanding Enrolment:
The expanding enrolment has necessitated a growing number of teachers as well
as schools in the country: from 5.6 million primary schools in 1990-91 to 5.8 million in
1994-95 and from 16.6 million in 1990-91 to 17.14 million teachers at the primary level
in 1994-95.
There are four types of schools in the country government managed, government
aided, government recognized but unaided, and unrecognized.
A common structure of education is being followed in most states: i.e., the 10, +
2, + 3 system. Thus a child who joins class I at the age of six goes through five years of
primary school, and three years of upper primary/ middle school to complete eight years
of elementary education. Two years of secondary education and two years of higher
secondary education bring schooling to an end. Three years of further studies enable the
student to obtain his/her first degree.
2.4.2.2 Curriculum Development for Elementary Schools:
The states are free to develop their own curricula and instructional materials
within the framework developed at the national level by the NCERT. To cope with this, a
strategy has been evolved to import MLLs, i.e., the development of competency based
teaching and learning to suit local situations. This approach integrates various
components of curriculum, classroom transaction, and evaluation and teacher orientation.
It is expected to achieve greater relevance and functionality in primary education.
2.4.2.3 Non Formal Education:
Despite enormous strides in school education, 28 million out of 153 million in the
age-group 5-14 are still out of school. Of these, 14 million are working children who
cannot attend school full time. Hence, NFE is seen as a vital aspect of India's current
72
strategy on education as it can reach out to working children, school drop-outs, girls and
those who cannot attend full-time schools due to several socioeconomic factors.
Under the NFE program me there are three types of centers:
• Co-educational centers where the contribution of the union government and state
government is 50:50;
• Girls' centers with the contribution of union and state governments being 90: 10;
and
• NFE centers run by NGOs. In these the assistance from the union government is
100 per cent.
Besides these, a number of innovative experimental projects taken up, by various
organizations (particularly NGOs) get 100 per cent funding from the Ministry of Human
Resource Development. By March 1993, the number of NFE centers functioning in the
country was 279,000.
The life of a centre is generally, two years. These centers are organized for two
hours a day at a time convenient to the learners. Each centre is run by an instructor who
takes care of the various groups of learners learning at various grade levels. Children
learn each unit at their own pace. This is also true of NFE centers at the upper primary
level.
The NFE course is condensed into four semesters of six months each for which
specially developed teaching-learning materials and stationery are provided to children
free of cost. Compatibility with the formal school system is ensured through a focus on
MLLs. There is a provision for testing and certification of children of NFE centers to
facilitate their entry into formal schools.
Implemented through state governments and voluntary organizations, the NFE
program me draws on a high level of community participation and is characterized by
flexibility, relevance and a decentralized administrative structure.
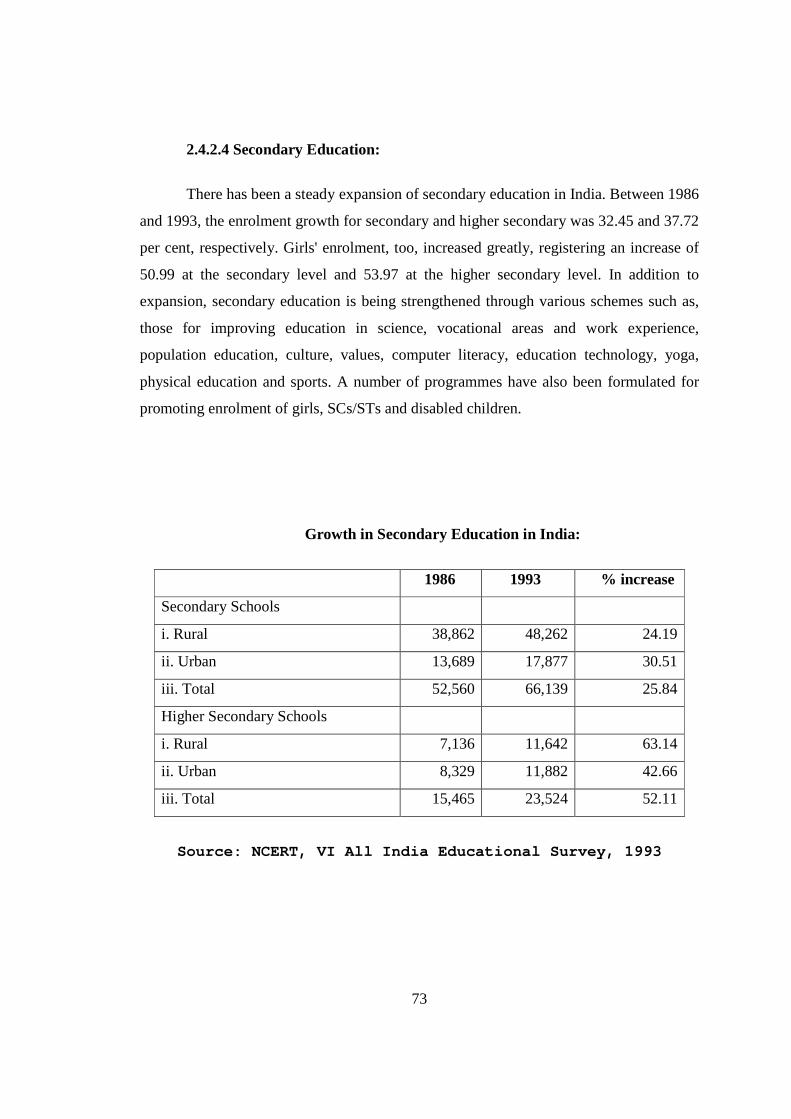
73
2.4.2.4 Secondary Education:
There has been a steady expansion of secondary education in India. Between 1986
and 1993, the enrolment growth for secondary and higher secondary was 32.45 and 37.72
per cent, respectively. Girls' enrolment, too, increased greatly, registering an increase of
50.99 at the secondary level and 53.97 at the higher secondary level. In addition to
expansion, secondary education is being strengthened through various schemes such as,
those for improving education in science, vocational areas and work experience,
population education, culture, values, computer literacy, education technology, yoga,
physical education and sports. A number of programmes have also been formulated for
promoting enrolment of girls, SCs/STs and disabled children.
Growth in Secondary Education in India:
1986 1993 % increase
Secondary Schools
i. Rural 38,862 48,262 24.19
ii. Urban 13,689 17,877 30.51
iii. Total 52,560 66,139 25.84
Higher Secondary Schools
i. Rural 7,136 11,642 63.14
ii. Urban 8,329 11,882 42.66
iii. Total 15,465 23,524 52.11
Source: NCERT, VI All India Educational Survey, 1993
74
2.4.5 Higher Education:
2.4.5.1: Current Status
India possesses a highly developed higher education system which offers facility of
education and training in almost all aspects of human creative and intellectual endeavors:
arts and humanities; natural, mathematical and social sciences, engineering; medicine;
dentistry; agriculture; education; law; commerce and management; music and performing
arts; national and foreign languages; culture; communications etc. The institutional
framework consists of Universities established by an Act of Parliament (Central
Universities) or of a State Legislature (State Universities), Deemed Universities
(institutions which have been accorded the status of a university with authority to award
their own degrees through central government notification), Institutes of National
Importance (prestigious institutions awarded the said status by Parliament), Institutions
established State Legislative Act and colleges affiliated to the University (both
government-aided and –unaided) As on 31.3.2006, there were 367 University level
institutions including 20 Central Universities, 217 State Universities, 104 Deemed
Universities and 5 institutions established under State Legislation, 13 Institutes of
National Importance established under Central legislation and 6 Private Universities..
There were 18,064 degree and post-graduate colleges (including around 1902 women’s
colleges), of which 14,400 came under the purview of the University Grant Commission,
the rest were professional colleges under the purview of the Central Government or other
statutory bodies like the AICTE, ICAR, MCI etc. Of the Colleges under UGC purview
6109 have been recognized by the University Grants Commission (UGC) under Section
2(f) and 5525 under Section 12(B) of the UGC Act, which recognition permits them to
receive grants from the UGC. In 2006-07, an estimated 13.93 million students were
enrolled in the institutions of Higher Education as against 10.48 million in the previous
year and the faculty strength was 0.488 million as compared to 0.472 m in the previous
year. The enrolment of women students at the beginning of the academic year 2006-07
was 4.466 million, constituting 40.40 per cent of the total enrolment. Of the total women

75
enrolment, only 12.35 per cent women have been enrolled in professional courses and the
rest in non-professional courses. The women enrolment is the highest in Kerala (66.00
per cent) and lowest in Bihar (24.52 per cent) in terms of percentage enrolment to total
enrolment. (Annual Report, Ministry of Human Resource Development, 2006-2007).
2.4.5.2.: Growth of Higher Education
In its size and diversity, India has the third largest higher education system in the world,
next only to China and the United States. Before Independence, access to higher
education was very limited and elitist, with enrolment of less than a million students in
500 colleges and 20 universities. Since independence, the growth has been very
impressive; the number of universities (as on31st March 2006) has increased by 18-times,
the number of colleges by 35 times and enrolment more than 10 times (Annual Report,
MHRD 2006-07). The system is now more mass-based and democratized with one third
to 40% of enrolments coming from lower socio-economic strata, and women comprising
of some 35%of the total enrolments (Tilak 2004). It is little more than half a century ever
since the government initiated a planned development of higher education in the country
particularly with the establishment of University Grants Commission in 1953. Thus early
1950’s is an important reference points from which we could look back at our progress of
higher education. Table 1 depicts the growth of institutions from 1950-51 to 2004-05
while Table 2 classifies the Central and State Universities in the type of disciplines
offered by them.

76
Table1: Growth of Colleges for General Education, Colleges for Professional
Education, and Universities during 1950-51 to 2004-2005
Years Colleges for
general
Colleges
profession
for Universities/Deemed Education
Univ./Institutes of
National Importance
1950-51 370 208 27
1955-56 466 218 31
1960-61 967 852 45
1965-66 1536 770 64
1970-71 2285 992 82
1975-76 3667 3276 101
1980-81 3421 3542 110
1985-86 4067 1533 126
1990-91 4862 886 184
1991-92 5058 950 196
1992-93 5334 989 207
1993-94 5639 1125 213
1994-95 6089 1230 219
1995-96 6569 1254 226

77
1997-98 6759 1770 228
1998-99 7199 2075 229
1999-00 7494 2113 237
2000-01 7782 2124 244
2001-02 7929 2223 254
2003-04 8737 2409 272
2004-05 9166 2610 304

78
Type Number % General 126 54 Agricultural 35 15 Technological 14 6 Language 11 5 Medical 9 4 Law 6 2.6 Woman 5 1 Animal & Fishery 4 1.7 Open 11 5 Others 16 5.7 Total 237 100
Source: UGC Annual Report, 2004-05
Among the 104 deemed universities, there is greater diversification. Apart from majority
being in technological discipline, there are universities in specific research areas such as
English and foreign language, yoga, brain research, dairy research, mines, basic science,
neuro science, physical education, fisheries, economics and politics, development
research, armament technology, population science, social science, IT, management,
education, home sciences, rural studies, music, veterinary research, forest research,
drama, planning and architecture, foreign trade, educational planning and administration.

79
2.4.5.3.: Enrolment
Enrolment in Higher education has been rising steadily although the enrolment rate has
continued to remain low compared even to some of the developing countries of Asia and
Latin America. Table 3 shows the growth of enrolment in Tertiary education (at
Doctorate, Post-graduate, Degree and Diploma levels) during the period 1980-81 to
2003—04, where as Table 4 shows the total enrolment growth during 2001-2002 to
2005-2006 under different types of Management under which the colleges and
Universities were functioning. Table 5 displays the actual distribution in enrolment of
Boys and Girls at different levels of education for the year 2004-2005.
Table 3: Enrolment by Levels and Major Disciplines
Year PhD PG
General
Graduate (Art,
Science &
Commerce)
Technical
Graduate
(Engg.,
Medical,
B Ed)
Total Higher
Education
(Degree
(2+3+4+5)
Diploma Total Higher
Education
(Degree,
Diploma)
(6+7)
1 2 3 4 5 6 7 8 1980-81 25417 291341 1886428 239267 2442453 430126 2872579 1990-91 32468 354216 3285776 416828 4089288 796686 4885974 2000-01 45004 647338 7244915 688625 8625882 987279 9613161 2001-02 53119 647016 7139497 790050 8629682 1104594 9734276 2002-03 65357 782590 7633125 1035701 9516773 1199785 10716558 2003-04 65525 806636 8026147 1110840 10009148 1191447 11200595
Source: Selected Educational Statistics, Different years
Table 4: Higher Education Institutions and Enrolment (by Type of Management)
Type (by Universities Colleges Higher Enrolment
2000- 2005- 2000- 2005- 2000- 2005- 2000- 2005-
Government 245 268 4097 4225 4342 4493 3443 3752
Private # 10 5507 5750 5507 5760 3134 3510
Private
Unaided
21 70 3202 7650 3223 7720 1822 3219
Total 266 348 12806 17625 13072 17973 8399 10481
Source: University Grants Commission (India) and Agarwal (2006)
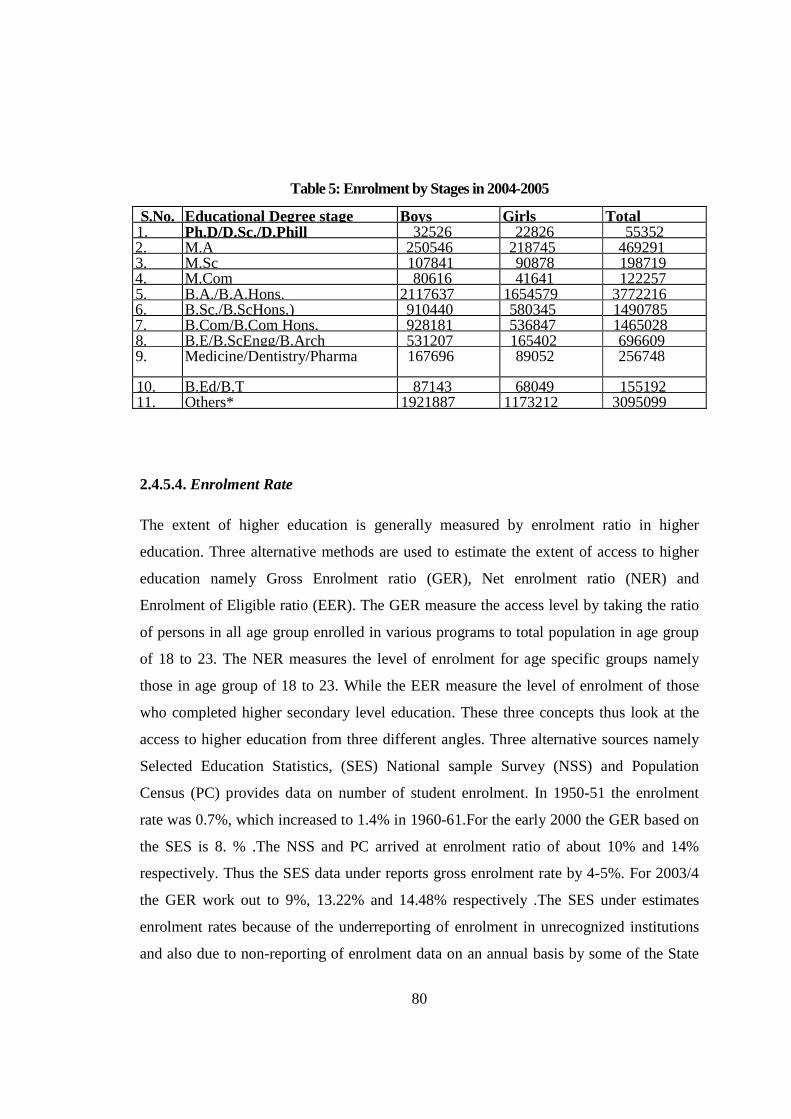
80
Table 5: Enrolment by Stages in 2004-2005
S.No. Educational Degree stage Boys Girls Total 1. Ph.D/D.Sc./D.Phill 32526 22826 55352 2. M.A 250546 218745 469291 3. M.Sc 107841 90878 198719 4. M.Com 80616 41641 122257 5. B.A./B.A.Hons. 2117637 1654579 3772216 6. B.Sc./B.ScHons.) 910440 580345 1490785 7. B.Com/B.Com Hons. 928181 536847 1465028 8. B.E/B.ScEngg/B.Arch 531207 165402 696609 9. Medicine/Dentistry/Pharma
cy
167696 89052 256748
10. B.Ed/B.T 87143 68049 155192 11. Others* 1921887 1173212 3095099
2.4.5.4. Enrolment Rate
The extent of higher education is generally measured by enrolment ratio in higher
education. Three alternative methods are used to estimate the extent of access to higher
education namely Gross Enrolment ratio (GER), Net enrolment ratio (NER) and
Enrolment of Eligible ratio (EER). The GER measure the access level by taking the ratio
of persons in all age group enrolled in various programs to total population in age group
of 18 to 23. The NER measures the level of enrolment for age specific groups namely
those in age group of 18 to 23. While the EER measure the level of enrolment of those
who completed higher secondary level education. These three concepts thus look at the
access to higher education from three different angles. Three alternative sources namely
Selected Education Statistics, (SES) National sample Survey (NSS) and Population
Census (PC) provides data on number of student enrolment. In 1950-51 the enrolment
rate was 0.7%, which increased to 1.4% in 1960-61.For the early 2000 the GER based on
the SES is 8. % .The NSS and PC arrived at enrolment ratio of about 10% and 14%
respectively. Thus the SES data under reports gross enrolment rate by 4-5%. For 2003/4
the GER work out to 9%, 13.22% and 14.48% respectively .The SES under estimates
enrolment rates because of the underreporting of enrolment in unrecognized institutions
and also due to non-reporting of enrolment data on an annual basis by some of the State

81
governments. Extrapolations are used to fill the gaps arising from non-reporting by some
of the States. The problem with the NSS and also census data is that as it is collected
from households, it is likely to over estimate the student enrolment in colleges and
universities as it might include those who are doing diploma or training programmes (e.g.
computer training) in unrecognized institutions also. A further problem with the
population Census data is that it does not distinguish between enrolment in professional
degree and diploma programs. Table 6 shows the GER by alternative sources while Table
7 gives the value of GER/NER/EER for 2003-04 as per National Sample Survey.
Table 6: Enrolment Ratio By alternative sources
Years Total Higher Education Sources SES NSS Census 1983 4.04 7.67 N.A. 1987-88 4.69 8.57 Na 1991 4.63 Na 10.95 1993-94 4.80 8.85 11.74* 1999-00 7.22 10.08 13.19* 2001 7.85 10.00 13.82 2003-04 9.01 13.22 14.48*
Source: SES - UGC
Table 7:The Comparative Profile: GER/NER/EER
as per NSS for Population Group (18 - 23 Years)
GER 13.2 NER 13.2 EER 59.0
The Working Group for Higher Education for the 11th Plan has projected a growth of GER
based on SES from current 10.5 to 15.5 by the end of the Plan period as well as based on
census data from 15.6 (current) to 20.6 by the end of the Plan. Table 8 details the
projection based on enrolment in the base year 2006-07.

82
Table 8: Current and 11th Plan Enrolment Rates based on SES and Census
Data
Year Academi
c Year
Populatio
n n 18-
23 Years
Total
Higher
Education
enrolment
Total GER
based on
SES
Total Higher Education
enrolment Total
based on GER
based Census Data on Base Year 2006 2006-07 132243 13934 10.5 20666 15.6 11th Plan 2007 2007-08 135440 15034 11.1 22212 16.4 2008 2008-09 138318 16460 11.9 23929 17.3 2009 2009-10 141257 18222 12.9 25850 18.3 2010 2010-11 144259 20341 14.1 27986 19.4 2011 2011-12 144287 22365 15.5 29723 20.6
Source: Draft Report of Working Group on Higher Education for 11th Five-year Plan.
2.4.5.5. Discipline wise Output of Graduates and Post-graduates:
The output of the Higher Education Institutions in terms of graduates and Post-graduates
is shown in Tables 9A and 9B respectively for the Year 2003.

83
Table 9A: Graduate Output during 2003.
No. Faculty/Course Pass out
Male
Pass out
Female
Pass out
Total 1. Arts-B.A level courses 547324 425396 972720 2. Science-M.Sc level Courses 196058 131717 327775 3. Commerce-B.Com level Courses 227744 145448 373192 4. Education-B.E 58258 47790 106048 5. Engineering/Technology-B.E level Courses 101143 26467 127610 6. Medicine-Bachelor level courses 22756 16031 38787 7. Agriculture-Bachelor level Courses 6524 1277 7801 8. Vet. Science-Bachelor level Courses 1151 346 1497 9. Law-LL.B level courses 47008 11220 58228 10. Others: Lab’s, Journalism, Phy.Edn., Music, Fine
Arts, Computer Appl., Performing Arts, Mass
Comm, Visual Arts, Theatre, Hospitality Mgt. etc.-
Bachelor level courses
27478 11061 38539
11. Total Graduates 123544 816753 2052197
Table 9B: Post Graduate Output during 2003
No. Faculty/Course Pass out
Male
Pass out
Female
Pass out
Total 1. Arts-M.A level Courses 168036 138383 306419 2. Science-M.Sc. level Courses 42364 31931 74295 3. Commerce-M.Com level courses 59118 35308 94426 4. Education-M.Ed.. Course 3044 1669 4713 5. Engineering/Technology-M.Tech level courses 10205 2165 12370 6. Medicine-M.S, MD, MAMS, MHMS, M.Pharm,
MSc (Nursing), MCH,DM etc.
5834 2385 8219
7. Agriculture, Fisheries, Forestry-M.Sc Level 3009 707 3716 8. Vet.Science-M.Sc, M.V.Sc. 577 123 700 9. Law-LL.M 1414 779 2193 10. Others; Lib.Sc., Journalism etc. Master level 23604 10003 33607 11. Total Post Graduates 317205 223453 540658

84
2.4.5.6. Total Graduates and Post-Graduates
No. Total
Graduates
Total Post
Graduates
Total
1. 123544 317205 440749
2. 816753 223453 1040206
3. 2052197 540658 2592855
Source: SES 2004-05 based on UGC Report
It is seen from the tables above that among the prominent disciplines at the
Bachelor’s level 47.4% of students obtain degrees in arts, 18.2%in commerce, 16% in
science, 6.2% in engineering/technology and 5.2% in education courses while at the
Master’s level arts degree is btained by 56.6%, commerce by 17.5% and science by
13.7%, and engineering by only 2.3% of students. The ratio of Male graduates to
Female graduates is 1.51:1 at the Bachelor’s level and 1.42:1 at the Master’s level.
2.4.5.7. Teachers in Higher education
Of the 472,000 teachers in Higher Education, 77,000 are in University departments
whereas 3, 95,000 are in affiliated colleges. While the student/teacher ratio in
University departments is 18:1 that in affiliated colleges is 23:1.Table 10 gives the
data of enrolment and the teachers employed in 2004-2005 (Source: UGC Annual
Report, 2004-05) while Table 11 gives the ratio in NAAC accredited Colleges. Table
12 gives an idea of the percentage distribution of Teacher’s qualification in Colleges.

85
Table 10: Number of Teachers in Institutions of Higher Education,
2004 (Source: UGC Annual Report 2004-05)
Institution Enrolme
nt (in
Teacher
s (in
Student
teacher
Students per Institute
University Departments
& University Colleges
13,88 77 18
Affiliated Colleges 90,93 3,95 23
Total 104,81 4,72 22 594
Table 11: Distribution of student teacher ratio in the NAAC accredited colleges NAAC
Grades
Indicators A &
Above
B++ &
B+
B only C++,
C+ & C
Non-
Accredite
d
Total
No. of Sample Colleges 110 547 298 233 285 1473 STR (Student Teacher ratio) 20.4 31.8 28.6 28.5 25.2 25.0 STR by Permanent teachers 29.8 31.8 38.1 35.8 35.6 33.5
Source: Analysis of Self Assessment Report of NAAC Accredited Colleges by UGC
(unpublished).
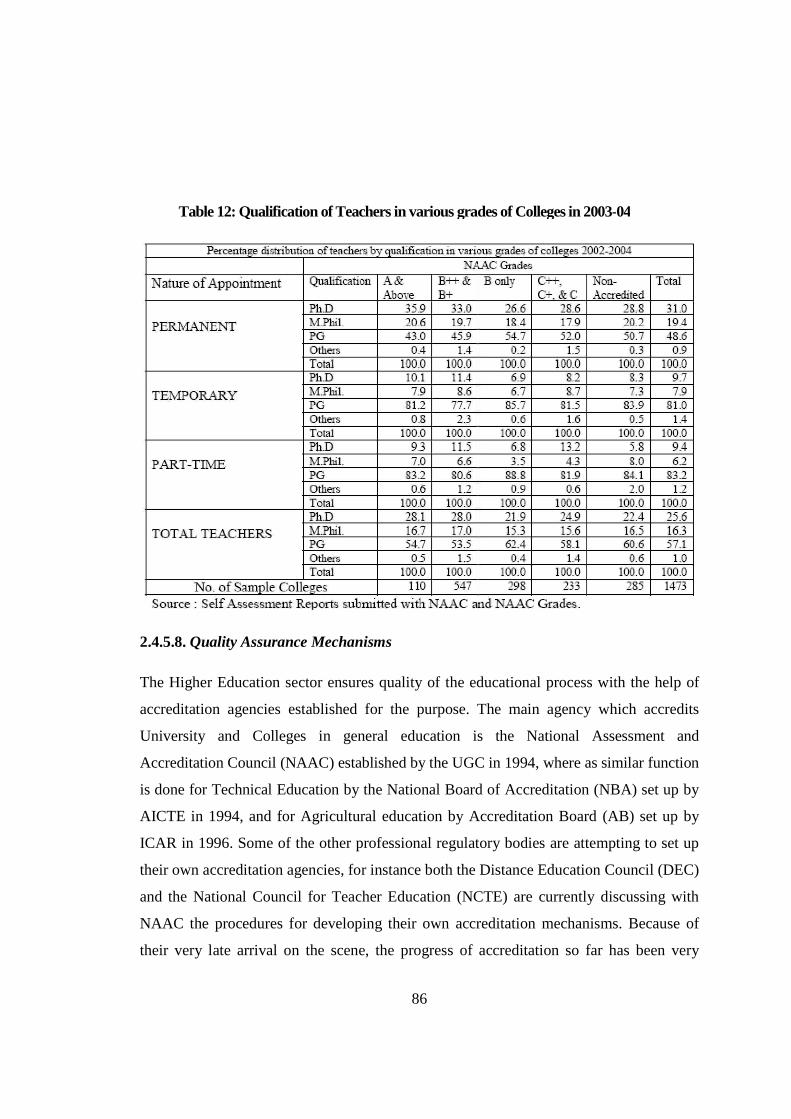
86
2.4.5.8. Quality Assurance Mechanisms
The Higher Education sector ensures quality of the educational process with the help of
accreditation agencies established for the purpose. The main agency which accredits
University and Colleges in general education is the National Assessment and
Accreditation Council (NAAC) established by the UGC in 1994, where as similar function
is done for Technical Education by the National Board of Accreditation (NBA) set up by
AICTE in 1994, and for Agricultural education by Accreditation Board (AB) set up by
ICAR in 1996. Some of the other professional regulatory bodies are attempting to set up
their own accreditation agencies, for instance both the Distance Education Council (DEC)
and the National Council for Teacher Education (NCTE) are currently discussing with
NAAC the procedures for developing their own accreditation mechanisms. Because of
their very late arrival on the scene, the progress of accreditation so far has been very
Table 12: Qualification of Teachers in various grades of Colleges in 2003-04

87
slow. As on May 21, 2006, NAAC has accredited only 128 universities and 2879 colleges
and reaccredited 4 Universities and 43 Colleges (NAAC Website), where as NBA by
June2005 has accredited merely 1232 programs from 325 institutions (NBA Website) as
against a total of 14000 programs in 3589 approved UG and PG and 1608 diploma
institutions. Initially the progress of accreditation was very slow but has picked up speed
in the last few years, and both NAAC and NBA have plans to complete the backlog of
accreditation of eligible institutions during the next few years .In addition to National
accreditation, local quality inspection of affiliated colleges are carried out by the
affiliating University to ensure provision of adequate academic infrastructure and
satisfactory teaching-learning processes. Analysis of examination performance of
students is also used by Universities to assess the quality of educational offerings of
individual colleges.
2.4.5.9. Financing Higher Education
Higher Education in India has received enormous financial support from both the Central
and the State Governments. At the start of the Planning process in 1950, the total
allocation for higher education was only Rs.170 million which has now gone beyond
Rs.90, 000million. This impressive increase is offset to some extent by the rise in prices
(inflation) and rise in number of students entering higher education. An analysis of
government expenditure on higher education shows a real annual growth rate of 7.5% in
the 1950s, 11%in the 1960s, 3.4%, in the 1970s, and 7.3% in the 1980s. (CABE Report
2005) The following Table13 gives details of total expenditure incurred by Centre and
States on Education from 1993-94 to 2004-2005.where as Table 14 gives both nominal
and real expenditure per student in all sectors of education for the same period.

88
Table 13: Sector wise Plan & Non Plan Budgeted Expenditure for Education
Departments of State & Center (Revenue Account)
(Figure in Rs. Thousand Crore)
Year Elementary Secondar Higher Technica Higher + Total 1993-94 10822 7759 3104 1018 4122 23413 1994-95 12639 9050 3525 1189 4714 27232 1995-96 15218 10344 3871 1290 5161 31517 1996-97 17850 11736 4288 1450 5738 36372 1997-98 20392 13262 4859 1623 6482 41109 1998-99 25150 16782 6117 2073 8190 51225 1999-00 27905 20845 8248 2459 10707 61281 2000-01 29758 19743 9195 2528 11723 62498 2001-02 32493 20431 8087 2560 10647 64847 2002-03 33474 22049 8859 2820 11679 68561 2003-04(R) 38260 23983 9380 3138 12518 76387 2004-05 (B) 40586 24990 9562 3387 12949 80286
Table 14: Public Expenditure per Student: Nominal and Real (Base year – 1993-94)
Rs.
Year Elementary Secondary Higher Nominal Real Nominal Real Nominal Real 1993-94 825 825 3748 3748 8961 8961 1994-95 893 793 4040 3588 9821 8722 1995-96 1052 865 4517 3715 9384 7717 1996-97 1220 959 4890 3844 8438 6634 1997-98 1361 1025 5221 3932 9003 6779 1998-99 1654 1175 6285 4467 10238 7276 1999-00 1792 1233 7392 5087 13219 9097 2000-01 1900 1220 7153 4594 13956 8963 2001-02 2047 1269 6699 4153 12099 7501 2002-03 1977 1185 6641 3982 12294 7370 2003-04® 2162 1229 6852 3896 12518 7117
Table 15 shows how the Plan allocation for Higher Education, which went up to 28% in
the Vth Plan period, has been slowly going down in subsequent plans and has reached
only 6% of the total Plan expenditure during the Xth Plan period. Table 16, which gives
the annual Plan allocation during the Xth Plan period and the actual expenditure,
highlights the priority given in allocation to Technical education (10.72%) over Higher

89
Education (9.53%) although Higher education sector overspent the allocation whereas the
Technical education sector had a significant saving. Table 17 shows the distribution of
total public expenditure per student in Higher education.
Table 15: Plan Expenditure on Higher Education as % of Total Plan
Expenditure
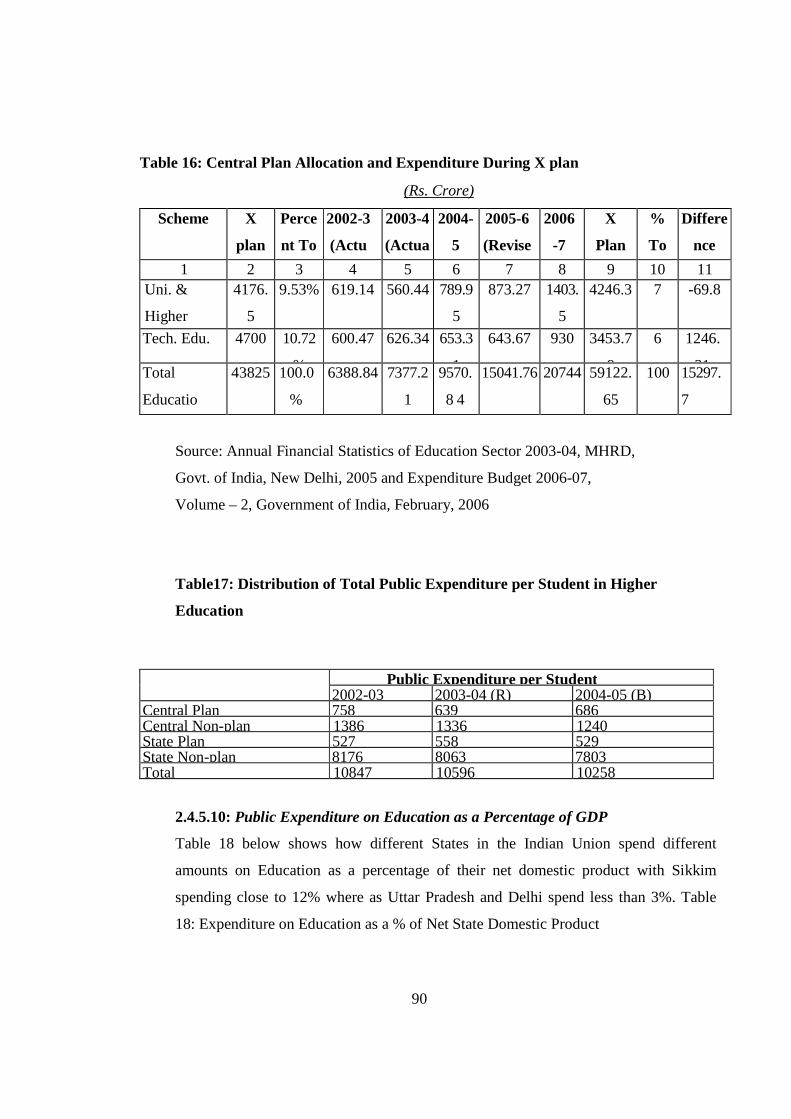
90
Table 16: Central Plan Allocation and Expenditure During X plan
(Rs. Crore)
Scheme X
plan
Perce
nt To
2002-3
(Actu
2003-4
(Actua
2004-
5
2005-6
(Revise
2006
-7
X
Plan
%
To
Differe
nce
1 2 3 4 5 6 7 8 9 10 11 Uni. &
Higher
4176.
5
9.53% 619.14 560.44 789.9
5
873.27 1403.
5
4246.3 7 -69.8
Tech. Edu. 4700 10.72
%
600.47 626.34 653.3
1
643.67 930 3453.7
9
6 1246.
21 Total
Educatio
43825 100.0
%
6388.84 7377.2
1
9570.
8 4
15041.76 20744 59122.
65
100 15297.
7
Source: Annual Financial Statistics of Education Sector 2003-04, MHRD,
Govt. of India, New Delhi, 2005 and Expenditure Budget 2006-07,
Volume – 2, Government of India, February, 2006
Table17: Distribution of Total Public Expenditure per Student in Higher
Education
Public Expenditure per Student 2002-03 2003-04 (R) 2004-05 (B)
Central Plan 758 639 686 Central Non-plan 1386 1336 1240 State Plan 527 558 529 State Non-plan 8176 8063 7803 Total 10847 10596 10258
2.4.5.10: Public Expenditure on Education as a Percentage of GDP
Table 18 below shows how different States in the Indian Union spend different
amounts on Education as a percentage of their net domestic product with Sikkim
spending close to 12% where as Uttar Pradesh and Delhi spend less than 3%. Table
18: Expenditure on Education as a % of Net State Domestic Product

91
Table 18: Expenditure on Education by Different States as % of NSDP
The total expenditure on the Revenue Account at the all India level during 2005-06
formed 28.33% of the total Gross Domestic Product (GDP) and only 3.01% of the GDP
was provided in the budgets of the education departments. When the provision for
education for all departments including education departments is taken into account this
percentage works out to be 3.72% (Source: Analysis of Budget Expenditure on Education
from 2003-2006, Ministry of HRD Planning and Monitoring Unit 2006). So far as
expenditure on Higher education sector is concerned, there is some variation in data
depending on the source. Table 19 is reproduced from the CABE report on financing of
Higher and Technical Education (June 2005) whereas Table 20 is taken from Selected
Educational Statistics 2003-2004 document published by MHRD in 2007.

92
Table 19: Public Expenditure on Higher and
Technical Education as % of
GDP
Source: CABE Report on Financing of Higher and Technical Education, June 2005.
It is seen from the CABE report that public expenditure on Higher Education including
Technical education has varied between 0.45 and 0.6 of the GDP, whereas Table 20 gives
the figure between 0.52 and 0.77 of the GDP. This variation could be due to the inclusion
of expenditure on HRD training by government departments other than Education in both
at the Centre and in the States.
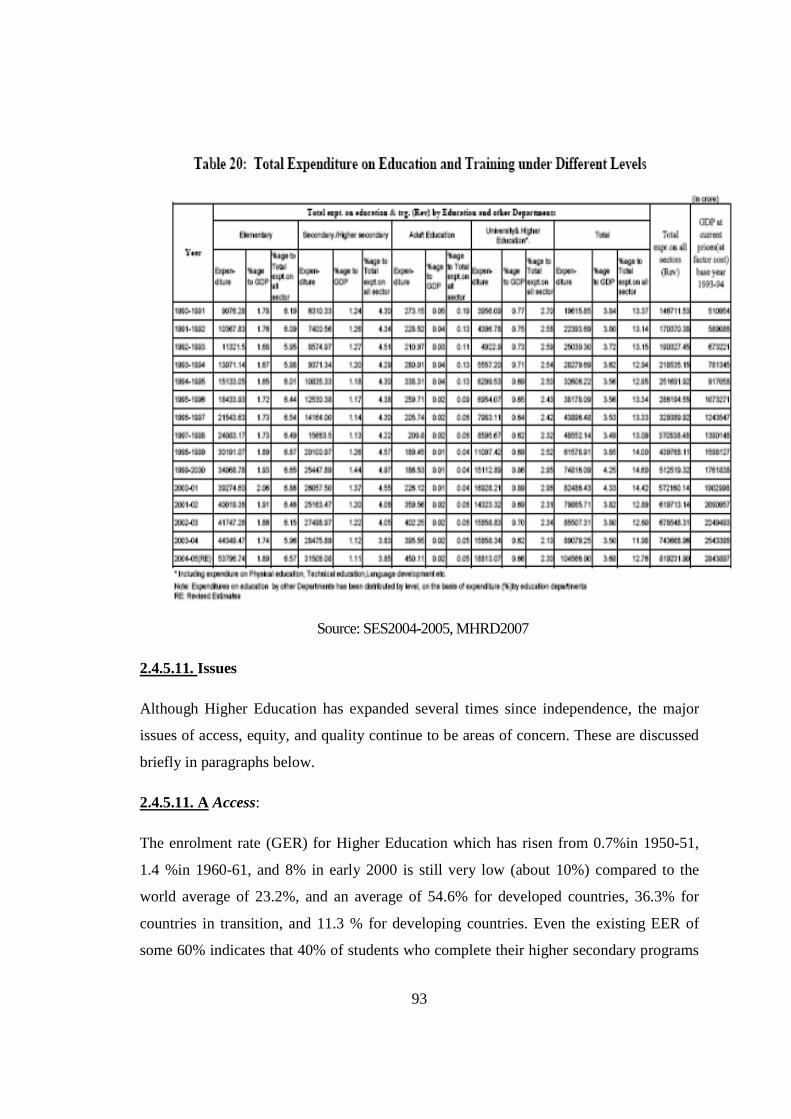
93
Source: SES2004-2005, MHRD2007
2.4.5.11. Issues
Although Higher Education has expanded several times since independence, the major
issues of access, equity, and quality continue to be areas of concern. These are discussed
briefly in paragraphs below.
2.4.5.11. A Access:
The enrolment rate (GER) for Higher Education which has risen from 0.7%in 1950-51,
1.4 %in 1960-61, and 8% in early 2000 is still very low (about 10%) compared to the
world average of 23.2%, and an average of 54.6% for developed countries, 36.3% for
countries in transition, and 11.3 % for developing countries. Even the existing EER of
some 60% indicates that 40% of students who complete their higher secondary programs
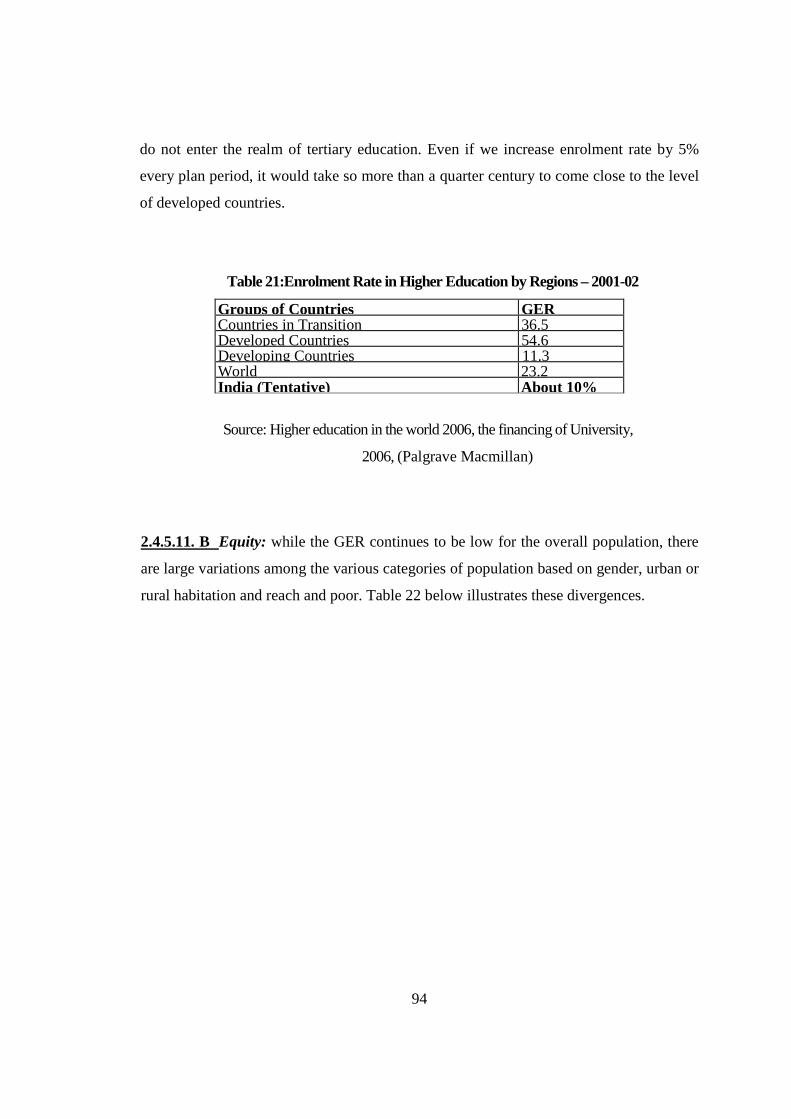
94
do not enter the realm of tertiary education. Even if we increase enrolment rate by 5%
every plan period, it would take so more than a quarter century to come close to the level
of developed countries.
Table 21:Enrolment Rate in Higher Education by Regions – 2001-02
Groups of Countries GER Countries in Transition 36.5 Developed Countries 54.6 Developing Countries 11.3 World 23.2 India (Tentative) About 10%
Source: Higher education in the world 2006, the financing of University,
2006, (Palgrave Macmillan)
2.4.5.11. B Equity: while the GER continues to be low for the overall population, there
are large variations among the various categories of population based on gender, urban or
rural habitation and reach and poor. Table 22 below illustrates these divergences.

95
Table 22: Enrolment Ratio under Different groups of Population
GER NER EER Source/Year SES
2006-07
Census
2001
NSS
2003
NSS
2003
NSS
2003
All 9.7 13.8 13.2 13.2 59.0 Gender
Male 11.1 17.1 15.3 12.3 62.9 Female 7.9 10.2 11.0 S.7 54.1
Caste ST 4.6 7.5 5.0 4.0 57.4
SC 7.0 S.4 7.5 5.9 56.4
OBC 11.34 Others 24.89 Religion Hindu 12.0 9.0 57.0 Muslim 8.2 6.3 58.1 Other
Religio
30.9 24.3 65.8
Rural/
Urban
Rural 9.0 7.8 6.1 51.5 Urban 24.5 27.2 21.9 66.0 Poor 2.43 Non-Poor 12.81
Source: Chairman UGC’s Nehru Memorial Lecture, University of Mumbai, Nov.24, 2006
2.4.5.11. C Quality:
The higher educational institutions suffer from large quality variation in so much so that
a recent Nasscom-Mackinsey Report (2005) has said that not more than 15% of graduates
of general education and 25-30% of Technical Education are fit for employment. Since
only a small number of Universities and colleges are eligible for funding by UGC and
hence monitoring for quality by NAAC for ensuring quality standards set by it, a vast
majority of institutions are under no quality monitoring and control except what is
provided under university regulations and occasional university team visits. Tables 23A
and 23B below give the quality status of colleges (as on 31st March 2005) and
Universities as in 2007.

96
Table 23 A: Current Quality Status in Colleges of Higher Education in
India (As on March 31, 2005)
Details Number Total Number of Colleges 17,625 Number of Colleges under UGC purview 14,000 Number of Colleges recognized under Section 2(f) of UGC Act 5,589 (40%) Number of Colleges recognized under Section 12(B) of UGC 5,273 (38%) Number of Colleges actually funded by the UGC 4,870 (35%) Number of Colleges accredited by the NAAC 2,780 (20%) Number of Colleges accredited by the NAAC and scoring above 2,506 (17.9)
Source: Draft Report of Working Group on Higher Education for 11th Five-year Plan.
Table 23 B: Current Quality Status of Universities in India (As in 2007)
Details Total
NumbeTotal Number of University Level Institutions 367
Total Number of Universities under UGC Purview 317 Number of Universities actually funded by the UGC 164 Number of Universities accredited by the NAAC 128 Number of Universities accredited by the NAAC and scoring above 128
Source: Draft Report of Working Group on Higher Education for 11th Five-year Plan.
As per the University sector is concerned, a total of 317 Universities under the purview of
UGC only about 50% (164) have been assessed for minimum quality under 12(B) while
seeking UGC funding whereas only about 40%(128) have been assessed for more
elaborate criteria of quality as per NAAC. A sample study by UGC of 111 universities
funded by it has shown that 31% of them fall under A grade (High quality), 52% in B
grade (Medium quality) and 16% under C grade (Low quality). It is observed that A
grade Universities generally perform better with respect to number of indicators, which
include faculty strength in number per department and quality (PhD degree), and both
physical and academic facilities. (Based on UGC Chairman’s Nehru Memorial Lecture,
Univ. of Mumbai, November 2006). As per the latest data available NAAC has
completed accreditation of 140 Universities (28 more than the above Table), and 3492

97
colleges (some 700 more than given in table above). An analysis of 2698 colleges
accredited earlier is given in Table 24 below which confirms that even under the small
number of colleges so far accredited, some 24% are of low quality and one does not
know anything about the quality standard of some 80% of colleges under UGC purview.
Table 24: NAAC Ranking of Colleges 2006
An earlier analysis of performance standard of facilities in NAAC accredited Colleges is
given in Table 25 below. It is obvious that performance parameters are better in
institutions with A and B++/B+ grades.
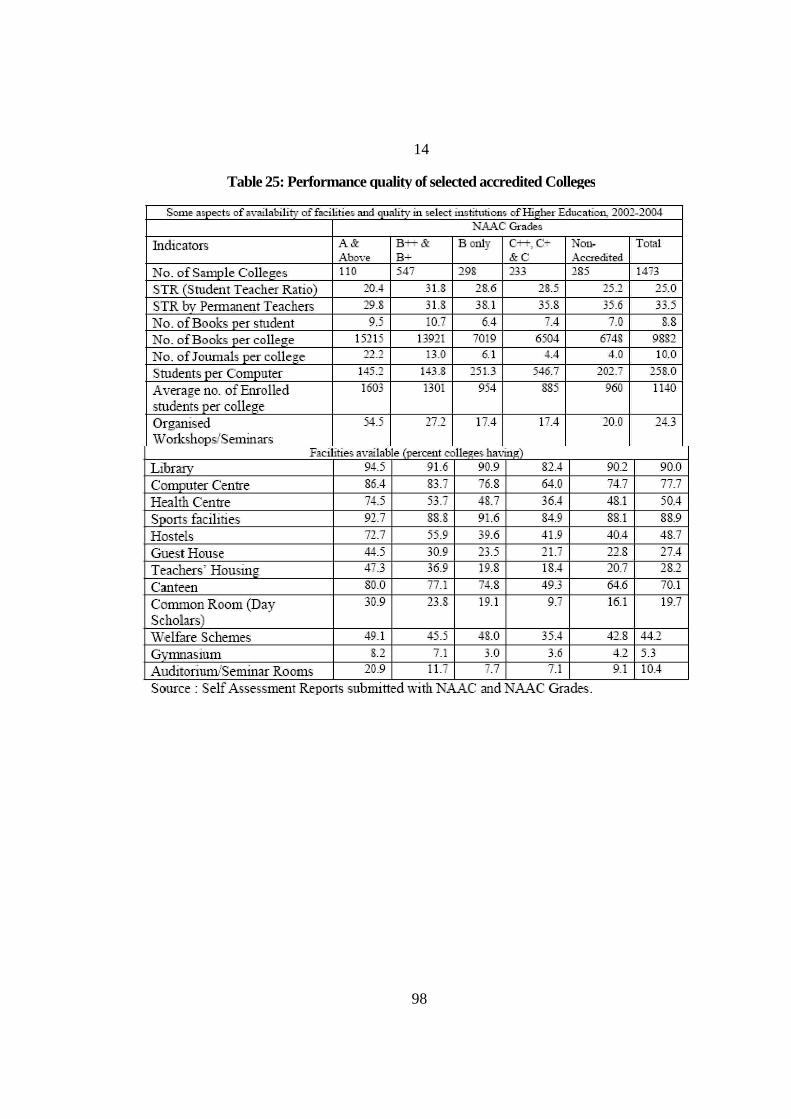
98
14
Table 25: Performance quality of selected accredited Colleges

99
2.4.5.11. D Access and Equity:
The Central Government is conscious of the need to raise both the enrolment rate and
access to higher education to all who deserve irrespective of class, caste, religion, gender
or economic status. In the last plan period enrolment rate has gone up form some 6% to
10%and the 11th Plan it is proposed to raise it 15 percent. 30 new Central Universities, 8
new IITs, 20 new IIITs and 7new IIMs, and several high grade Medical Institutes are
proposed to be established during the next plan period, and one degree college would be
established in each district of the country. The Prime Minister has invited private sector
participation in this venture. Knowledge Commission, which was established at the
suggestion of the present Government, has submitted its first report on Higher Education
and is under scrutiny for implementation by the Government. There are proposals for
improving access to quality higher education to disadvantaged groups in the population
(Moily Committee and Sachar Committee reports). The Indian Prime Minister in his
Independence Day speech on 15th August 2007 said, “We will also ensure that adequate
numbers of colleges are set up across the country, especially in districts where enrolment
levels are low. We will help States set up colleges in 370 such districts. The University
system, which has been relatively neglected in recent years, is now the focus of our
reform and development agenda. We will set up thirty new Central Universities. Every
state that does not have a central university will now have one. In order to promote
science and professional education, we are setting up five new Indian Institutes of
Science Education and Research, eight new Indian Institutes of Technology, seven new
Indian Institutes of Management and twenty new Indian Institutes of Information
Technology. These will generate new educational opportunities for our youth. I am sure
that, working together, we can ensure that at least a fifth of our children go to college as
compared to one-tenth now.”
2.4.5.11.E. Some Public Initiatives: The success stories of the initiatives of the
Government in the field of higher education, which have already received both national
and international recognition, are only a few:
100
• the setting up of Central Universities, with high quality of infrastructure for
teaching and research
• setting up Indian Institutes of Technology and Indian Institutes of
Management, which are leaders in Technical and Management Education in
the country and have earned very high reputation for their graduates
internationally
• Opening up the Professional Education Sector to large scale private
investment and permitting the investors cost recovery from student fees
• establishing Indian Institutes of Information Technology both in the Public
and Private sectors, and crating a new phase of public/ private partnership in
the IT area with the Institutions given Deemed University Status and ensuring
active Industry involvement in Governance.
• implementing the plan for producing the required human resource for the
rapidly growing Information Technology Industry permitting private sector to
establish a world class institution
• permitting private sector to establish a world class institution in Management
(ISB at Hyderabad) with linkages with world class institutions
• permitting some deemed Universities to open campuses both in other states and
abroad
2.4.5.11.F. Innovative Schemes:
A number of innovative schemes have also been in operation in the Higher Education
sector, some promoted by the University Grants Commission, others by the Technical
education division of the Ministry of Human Resource development and All India
Council Of Technical Education, and yet others by Indian Council of Agricultural
research and several other Departments of the Central Government dealing with
Science and Technology and their applications. A brief description of some of these
schemes is listed below in Tables 26A and 26B:

101
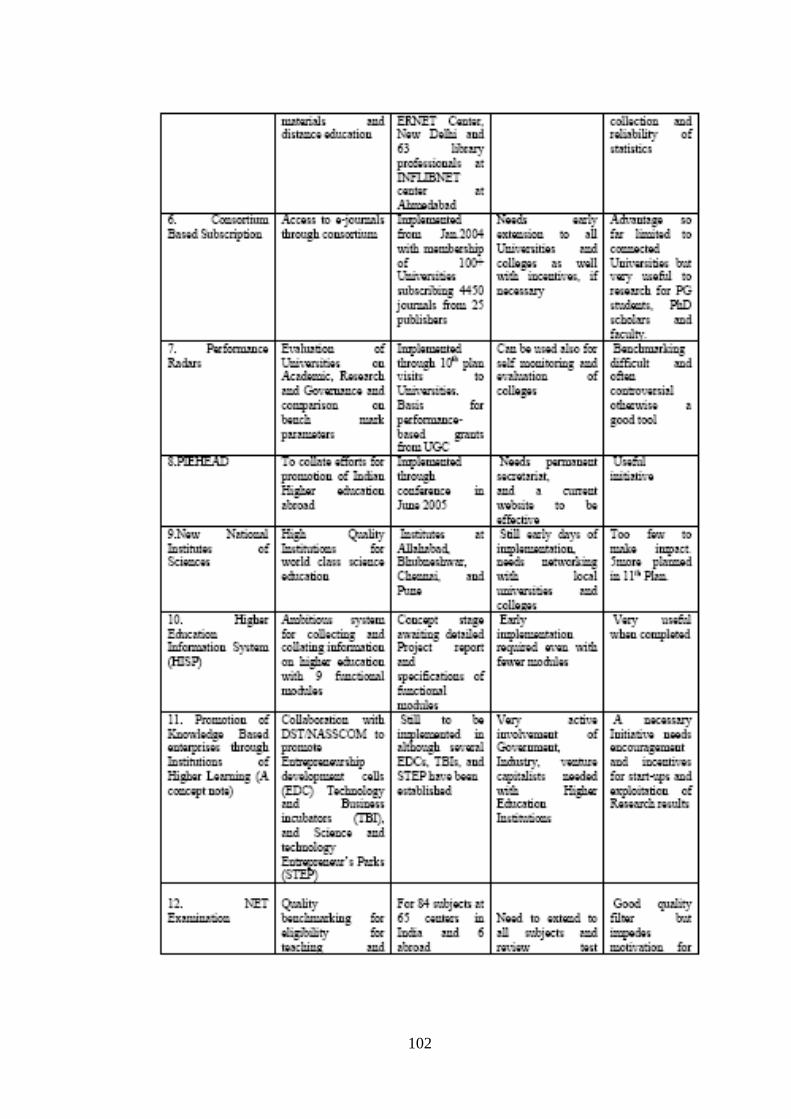
102

103
research procedures Researc
h 13.
Career
Advancement
Promotion on
merit after years
of service in a
Almost
universally
applied
Merit is often
a casualty, only
years of
Satisfaction
of teachers
but serious
Based on author’s experience and Information collected from UGC
Publications and MHRD annual reports.
Table 26B: Selected Schemes under MHRD/ AICTE/ICAR and Other agencies
Name of
Scheme
Purpose/Function Implementatio
n status
Limitations Impact
1. INDEST-
AICTE
Consortium
Subsidized
subscription
to International
E-Journals
Implemented
for IEL-on line,
ASCE, ASME,
Springer Link,
Although
selective it covers
80% of
requirement
Welcomed by
Institutions as
only 4% of
listed price in
2.DELNET For Digital
Electronic Library
Development for
Subsidy
from AICTE
for membership
Not yet extensive
in membership
Will be very
useful
when fully
3.
Internet-
Provision
of subsidized
Many
institutions are
Higher
subsidy may be
Very useful
when 4 Faculty
Developmen
t Scheme
Short term courses
for up gradation
of faculty
competence
Large number
of summer
winter programs
run, all expenses
Programs of
variable
standard,
occasionally
Very useful if
properly
planned
and executed
5.Early
Faculty
Inductio
Financial Incentive
to those wanting
to become teachers
Scheme not
been able to
attract large
Incentives
insufficient
in highly
Good scheme
needs review
to make it
6. Quality
Improvemen
t Program
Deputation of
teachers for
higher
Very useful
for teachers with
no post-graduate
Numbers
of placement
limited against
Has been very
successful in
teacher up 7.TEQIP World bank assisted
project for up
gradation of quality
of 128 engineering
Covers a
small fraction
of all
institutions
Implementatio
n slow
Very
important
project will
have far

104
8.IIT Delhi-
FITT
To help market
research results
Working
satisfactorily
since 1992 with
large clientele
for education,
technology
No inter
institutional
arrangements
for large projects,
but highly
successful in
A good
example for
replication
IPR.
Collaboration
with NIIT for Net
varsity course
in Bioinformatics,
with CII for
upgrading
innovations
9.Industry
interaction
at Other
IITs
Have similar
centers like
FITT/IITD for
interaction
Successful
interaction
and large
consultancy
No attempt so far
to combine
and synergize
resources of all
Very useful
individual
initiatives
10 Industry
interaction
at
other
Universities
and
Many
Universities have
very strong
Research
departments and
also offer
Most of the
central
Universities
which deal with
science and
engineering
Number of places
where high
quality research
and innovation is
done is very
limited perhaps
Needs
special
policies
from UGC,
AICTE and
MHRD to 11.Extensio
n activities
at ICAR
Institutes
Research their
major function
and have
significant
Although
not statutory,
ICAR regulates
research in all
Some rethinking
of roles to bring
in the second
green revolution
Needs
massive input
for
modernization
Source- Information collected from UGC/AICTE/ICAR Publications and Annual
Reports.
105
2.4.5.11. G. Some Recent Policy Initiatives by the Government for Higher
Education
• Prime Minister’s speech on 15th August 2007 announcing Government’s
decision to establish many centrally funded high level institutions and help
states to establish degree colleges in districts having poor enrolment
• National Development Council’s approval to increase XIth Plan allocation
to UGC by four fold compared to the Xth Plan allocation
• Prime Minister Speech inviting active public –private partnership while
dedicating the Bharti School of Telecommunications Technology and
Management at IIT Delhi, and promising liberalizing rules and procedures
to make the partnership effective (March 20,2006)
• Finance Minister’s allotment of an additional INR1000 million each to
Universities of Mumbai, Kolkata, Chennai and the Punjab Agricultural
University to make them world class (Budget Speech 2006)
• Finance Minister’s allotment of an additional INR1000million to Indian
Institute of Science, Bangalore to become a world level university (Budget
speech 2005)
• Setting up of a Knowledge Commission (2005)
• Draft National Biotechnology Plan (2004/05)
• Liberal grant of Autonomy-Deemed University Status to IIITs, NITs (2004)
• Setting up Indian institute of Information Technology, Design and
Manufacturing (IHTDM) at Kancheepuram and Jabalpur in 2003-04. These
institutes are to provide a sustainable competitive advantage to the Indian
industry in the area of design and manufacturing of new products.
• New Science and Technology Policy (2003)
• Setting up an educational Satellite (2003)
• Transforming India into a Knowledge Superpower (2003)
• Ambani Report on “ A Policy Framework for Reforms in Education”
submitted to the then Prime Minister as part of a special subject group on
Policy frame work for private investment in Education, Health and Rural
Development (April 2000)
• National Policy on Education (1986/92/2000)

106
• Information Technology Action Plan (1998)
• Technology Vision Of India 2020(1996)
• Establishment of NAAC, NBA (1994)
• Encouraging Private Investment in Professional Education (Since 1980s)
• Upgrading Technical Education System through World Bank Assistance-
Tech Ed.I, II, III and TEQIP (1987-2008).
• Selecting Universities and Colleges with “Potential for Excellence” started
by UGC during Xth Plan to identify at least 161 colleges during the Plan
period.. So far 9 Universities and 97 colleges have been identified and given
special grants.

107
2.4.6 Technical Education:
There has been a phenomenal growth in the number of institutions in the
sector of technical education during the last four decades. The number of recognized
technical education institutions at the First Degree Level up to 1947-48 was 38,
whereas, the number of approved Degree Level Institutions by 1995-96 has gone up
to 414 and the number for Polytechnics has gone up to 1,026. Similar expansions have
taken place in other sectors of technical education in technical institutions.
2.4.6.1 Important technical education institutions:
• Indian Institutes of Technology:
At present, six IITs have been set up at Bombay, Delhi, Kanpur, Kharagpur,
Madras and Guwahati by the Government of India under an Act of Parliament called
the Institutes of Technology Act, 1961 as the Institutions of National Importance with
the objectives of the advancement of knowledge through quality education and
research in both pure and applied sciences and in Engineering/Technology. These
institutes offer Engineering Education at Graduate and Post Graduate levels and also
provide adequate facilities for advanced research.
• Indian Institutes of Management:
The four Indian Institutes of Management (IIMs) were set up by the
Government of India at Ahmedabad, Calcutta, Bangalore and Lucknow registered
108
under the Societies Registration Act with the objectives of providing education,
training, research and consultancy in management. These institutes are premier
centers in these areas. The IIMs offer postgraduate Programmes, Fellowship
Programmes, Management Development Programmes, Postgraduate Diploma in
Computer Aided Management and Organization-based programmes. The Government
of India has recently approved the establishment of two more IIMs, one at Indore
(Madhya Pradesh) and the other at Calicut (Kerala).
• Indian Institute of Science: Bangalore
The Indian Institute of Science (IISc.), Bangalore having Deemed University
status since 1958, is one of the premier institutes of the country. The institute has
earned recognition as a formidable centre of research in basic and engineering
sciences and allied fields and is an institute of international repute. The institute offers
postgraduate programmes and research facilities.
• Regional Engineering Colleges
Seventeen RECs in the country were established as joint and cooperative
ventures of the Government of India and the concerned State Governments. Most of
these were established during the year 1959-60. The national character is ensured by
each college by admitting students from all States and UTs and further by appointing
the best available faculty on an all India basis. The RECs function as pace setters and
provide academic leader-ship to other technical institutions in the respective regions.
These colleges are autonomous registered under the Societies Registration Act, 1860.
Academically, the colleges are affiliated to the respective universities in the region
where the RECs are located. The Government of India meets the entire non-recurring
expenditure. Fifty per cent of the recurring expenditure on undergraduate programmes
is borne by the respective State Governments. The Government of India also meets
the entire expenditure on postgraduate programmes. The admissions are made on the
basis of entrance examinations conducted by the technical education departments of
the States. Fifty per cent of the seats are filled by the students qualifying from the
States and the remaining 50 per cent are filled by the students coming from the other
States/ UTs based on pre-decided distribution done by the Ministry of Human
Resource Development (MHRD). The total sanctioned strength of the students in all

109
the RECs is 6,703. To empower RECs for achieving excellence in education, R&D
and developing curricula in tune with present day needs and forging closer links with
industry, the MHRD has mounted schemes like UK- India REC Project and making
RECs as Centers of Excellence by providing special funds,
• Other institutes
Apart from the above centre of excellence, the Government of India has set up other
institutions in the specialized fields like Indian Engineering (NIIE), Bombay, National
Institute of Foundry & Forge Technology (NIFFT), Ranchi, School of Planning &
Architecture, New Delhi, etc.
2.4.7 Adult Education:
The 1991 census showed that the current rate of literacy is 52.21 per cent for
the entire country: 39.29 per cent for females and 64.13 per cent for males. The
census also showed that for the first time, the number of literates exceeded the
number of illiterates in India that female literacy increased at a faster pace (10 per
cent) than male literacy (8 per cent) over the period 1981-91. Overall, the literacy rate
recorded an increase from about 19 per cent of the population aged 5 and above in
1951 to 52 per cent of the population aged 7 and above in 1991. The rate of female
literacy also rose noticeably from 9 per cent of the population aged 5 and above in
1954 to 40 per cent aged 7 and above in 1991.
The literacy rate among SCs has increased from 25 per cent in 1981 to 38 per
cent in 1991. Correspondingly, the literacy rate among STs has increased from 17 per
cent in 1981 to 30 per cent in 1991. In spite of these increases, the levels of literacy
among SCs and STs are distinctly lower than that of the population as a whole (52 per
cent). Gender disparity is conspicuous among SCs and STs. The ratio of female
literates to total number of literates improved from 69 in 1981 to 76 in 1991. The
rural-urban differential in male literacy declined from 27 per cent in 1981 to 26 per
cent in 1991. However, the rural- urban difference in female literacy increased.
Female literacy varies from 8 per cent in barer district of Rajasthan to 94 per cent in
the Kottayam district of Kerala.

110
2.5 EXPENDITURE ON EDUCATION IN INDIA:
The Government expenditure on Education has greatly increased since the
First five-year plan. The Government of India has highly subsidized higher education.
Nearly 97% of the Central Government expenditure on elementary education goes
towards the payment of teachers' salaries.
Data based on "Educational Planning and Administration in India :
Retrospect and Prospect", Journal for Education Planning and Administration, Vol.
VII, Number 2, NHIEPA. New Delhi by Dr. R. V. Vaidayantha Ayyar.
Note:
• Expenditure is in millions of Rupees
• Expenditure for Ninth-year plan excludes Rs. 45267.40 million for Mid-Day
Meals

111
2.6 CONTEMPORARY EDUCATION ISSUES:
Modern education in India is often criticized for being based on rote learning.
Emphasis is laid on passing examinations with high percentage. Very few institutes
give importance to developing personality and creativity among students. Recently,
the country has seen a rise in instances of student suicides due to low marks and
failures, especially in metropolitan cities, even though such cases are very rare. The
boards are recently trying to improve quality of education by increasing percentage of
practical and project marks.
Many people also criticize the caste, language and religion-based reservations
in education system. Many allege that very few of the weaker castes get the benefit of
reservations and that forged caste certificates abound. Educational institutions also
can seek religious minority (non-Hindu) or linguistic minority status. In such
institutions, 50% of the seats are reserved for students belonging to a particular
religion or having particular mother-tongue(s). For example, many colleges run by the
Jesuits and Salesians have 50% seats reserved for Roman Catholics. In case of
languages, an institution can declare itself linguistic minority only in states in which
the language is not official language. For example, an engineering college can declare
itself as linguistic-minority (Hindi) institution in the state of Maharashtra (where
official state language is Marathi), but not in Madhya Pradesh or Uttar Pradesh (where
the official state language is Hindi). These reservations are said to be a cause of
heartbreak among many. Many students with poor marks manage to get admissions,
while meritorious students are left out. Critics say that such reservations may
eventually create rifts in the society.
Ragging has been a major problem in colleges and students have died due to
ragging. However, ragging is now a criminal offense, and all universities and colleges
are obliged to publicize the penalties for ragging and monitor hostels to prevent
ragging. Expenditure on education is also an issue which comes under the scanner.
According to the Kothari commission led by Dr Vijay Kothari in 1966, expenditure
on education has to be minimum 6% of the GDP. Whereas in 2004 expenditure on
education stood at 3.52% of the GDP and in the eleventh plan it is estimated to be
around 4%. The "sarva shikshan abhyan" has to receive sufficient funds from the
central government to impart quality education.

112
2.7 INITIATIVES:
2.7.1 Non-Formal Education:
In 1979-80, the Government of India, Department of Education launched a
program of Non-Formal Education (NFE) for children of 6-14 years age group, who
cannot join regular schools. These children include school drop-outs, working
children, children from areas without easy access to schools etc. The initial focus of
the scheme was on ten educationally backward states. Later, it was extended to urban
slums as well as hilly, tribal and desert areas in other states. The program is now
functional in 25 states/UTs. 100% assistance is given to voluntary organizations for
running NFE centers.
2.7.2 Bal Bhavans:
Bal Bhavans centers, which are operational all over India, aim to enhance
creative and sports skills of children in the age group 5-16 years. There are various
State and District Bal Bhavans, which conduct programs in fine-arts, aero modeling,
computer-education, sports, martial arts, performing arts etc. They are also equipped
with libraries with books for children. New Delhi alone has 52 Bal Bhavan centers.
The National Bal Bhavan is an autonomous institution under the Department of
Education. It provides general guidance, training facility and transfer of information
to State and District Bal Bhavans situated all over India.
2.7.3 Distance Education:
India has a large number of Distance education programmes in Undergraduate
and Post-Graduate levels. The trend was started originally by private institutions that
offered distance education at certificate and diploma level. By 1985 many of the
larger Universities recognized the need and potential of distance education in a poor
and populous country like India and launched degree level programs through distance
education. The trend caught up, and today many prestigious Indian Universities offer
distance programs. Indira Gandhi National Open University, one of the largest in
student enrollment, has only distance programs with numerous local centers that offer
supplementary contact classes.

113
2.8 EDUCATION FOR SPECIAL SECTIONS OF SOCIETY:
2.8.1 Women:
Under Non-Formal Education programme, about 40% of the centers in states
and 10% of the centers in UTs are exclusively for girls. As of 2000, about 0.3 million
NFE centers were catering to about 7.42 million children, out of which about 0.12
million were exclusively for girls. In engineering, medical and other colleges, 30% of
the seats have been reserved for women.
2.8.2 SC/STs and OBCs:
The Government has reserved seats for SC/STs in all areas of education.
Special scholarships and other incentives are provided for SC/ST candidates. Many
State Governments have completely waived fees for SC/ST students. The IITs have a
special coaching program for the SC/ST candidates who fail in the entrance exams
marginally. Seats have been reserved for candidates belonging to Other Backward
Classes as well in some states like Tamil Nadu, Karnataka and Andhra Pradesh. The
struggle for reserving seats for students from OBC categories in elite institutions like
IITs, IIMs and AIIMS and Central Universities is still going on. The Supreme Court
of India is obstructing this reservation for the reason that there has been no caste-wise
census since 1931 and the population share of OBCs cannot be based on 1931 census.
The Department for the Welfare of SC/ST/OBC/Minorities introduced the SC/ST
tuition-fee reimbursement scheme in 2003-2004. The scheme applies to SC and ST
students of Delhi who are enrolled in recognized unaided private schools and who
have an annual family income of less than Rs. 1 lakh. It provides a 100%
reimbursement of the tuition fees, sports fee, science fee, lab fee, admission fee and
the co-curricular fee if the student's family income falls below Rs. 48, 000 per annum
and a reimbursement of 75% if the family income is greater than Rs. 48, 000 per
annum but less than Rs. 1 lakh. The subsidy provided by the scheme covers between
85% and 90% of the beneficiary's total running expenses in studying in a private
school.
2.8.3 Post Graduate Classes at Correctional Homes:
The Government of West Bengal has started the Post Graduate teaching
facilities for the convicts at the Correctional Homes in West Bengal.
114
2.9 RECENT DEVELOPMENTS:
NPE 1986 and revised PoA 1992 envisioned that free and compulsory
education should be provided for all children up to 14 years of age before the
commencement of 21st century. Government of India made a commitment that by
2000, 6% of the Gross Domestic Product (GDP) will be spent on education, out of
which half would be spent on the Primary education.
The 86th Amendment of the Indian constitution makes education a
fundamental right for all children aged 6-14 years. The access to preschool education
for children less than 6 years of age was excluded from the provisions, and the
supporting legislation has not yet been passed.
In November 1998, Prime Minister Atal Bihari Vajpayee announced setting up
of Vidya Vahini Network to link up universities, UGC and CSIR.
The Indian Education System is generally marks-based. However, some
experiments have been made to do away with the marks-based system which has led
to cases of depression and suicides among students. In 2005, the Kerala government
introduced a grades-based system in the hope that it will help students to move away
from the cut-throat competition and rote-learning and will be able to focus on creative
aspects and personality development as well. Discovery education started by Alumni
of Harvard, XLRI is a pioneer in this field. This organization has already developed 5
model schools.

115
2.10 TECHNICAL EDUCATION IN INDIA:
The history of imparting formal technical education in India can be traced
back to mid 19th century, although it got momentum in 20th century with the set up
of Constitution of Technical Education Committee of the Central University Board of
Education (CABE) in 1943; Preparation of Sergeant Report in 1944 and Formation of
All India Council of technical Education (AICTE) in 1945. With the country gaining
independence in 1947, the development of technical education had become a major
concern for the government of India to face the new challenges and move the country
forward.
The set up of Indian Institutes of Technology, Indian Institutes of Management
and Indian Institutes of Science was a major step in the development of technical
education in the country. The quality of education of these institutes have managed to
change the outlook of India so much that this ancient country which was earlier
known for yoga and mediation is now known for computer engineers. However, it
does not mean that the challenge of making technical education accessible to the rural
populace and other under developed sections of the society has been overcome.
In order to maintain the standard of technical education, a statutory authority-
The All India Council for Technical Education (AICTE)- was set up in 1945. AICTE
is responsible for planning, formulation and maintenance of norms and standards,
quality assurance through accreditation, funding in priority areas, monitoring and
evaluation, maintaining parity of certification and awards and ensuring coordinated
and integrated development and management of technical education in the country.
2.10.1 Technical Education Courses in India:
The courses, which are known as 'technical' in India and therefore come under
the purview of All India Council of Technical Education are - degree and diploma
courses in Engineering, Master degree Courses in Engineering, Master of Computer
Application (MCA), Master of Business Administration (MBA), Pharmacy Courses,
Courses in Architecture and Applied Arts and Hotel Management and Catering
Technology Courses.
116
2.10.2 Institutes offering Technical Education in India:
As the technical education courses in India are quite diverse, the number of
institutes providing technical courses in India is also huge. The number of AICTE
approved institutes that offer engineering degree courses in India is - 4,39,689. There
are around 1244 institutes in India that offer diploma courses in engineering, 415
institutes offer diploma courses in Pharmacy, 63 institutes offer diploma courses in
Hotel Management and Catering Technology Courses and 25 AICTE approved
institutes that offer diploma courses in Architecture. The number of AICTE approved
institutes that offer master of Computer Application courses in India is 1012.
Likewise the AICTE also approves institutes from time to time institutes that offer
MBA courses, M.E./M.Tech, Architecture and Applied Arts Courses, Hotel
Management and Catering Technology Courses.
Given the importance of technical education in the further development of the
nation, the Government of India is keen on developing some more institutes in the
line of IITs, IIMs and IISCs. The Prime Minister of India has unleashed a plan to
establish 8 IITs, 7 IIMs and 5 IISCs to improve the spread and quality of technical
education in the country. These institutes along with various private institutes and
foreign technical colleges have the potential of making technical education accessible
to all sections of society in India without compromising on the quality of education.
117
2.11 THE MBA DEGREE IN INDIA:
Today, MBA and Doctor of Business Administration (DBA) designations can
be found in many countries and even accessed through on-line, distance learning or e-
learning. Because of the varying standards of MBAs worldwide, many business
schools are accredited by independent bodies.
There are 1600 business schools in India offering two year MBA programs;
predominantly targeting fresh students without any experience. Among those schools,
the Indian Institutes of Management (IIM) are the oldest institutions for management
education in India. Gaining admission to any of the IIM schools requires passing the
Common Admission Test, which qualifies candidates for entrance into other
institutions in India also. The IIM offers a post-graduate diploma in management
which is recognized in India as similar to an MBA degree. Non-government
accredited one-year fast-track MBA programs have grown in India, especially for
candidates with work experience. Such programs are commonly known as Post
Graduate Programme (PGP) in Business Management.
118
2.12 HISTORY OF MBA:
The Master of Business Administration (MBA ) is a master's degree in
business administration, which attracts people from a wide range of academic
disciplines. The MBA designation originated in the United States, emerging from the
late 19th century as the country industrialized and companies sought out scientific
approaches to management. The MBA degree has since achieved worldwide
recognition.
Accreditation bodies exist specifically for MBA programs to ensure
consistency and quality of graduate business education, and business schools in many
countries offer MBA programs tailored to full-time, part-time, executive, and distance
learning students, with specialized concentrations.
The first American Business School, Wharton School of the University of
Pennsylvania, was established in 1881. The Tuck School of Business, part of
Dartmouth College, was the first graduate school of management in the United States.
Founded in 1900, it was the first institution conferring advanced degrees (masters) in
the commercial sciences, the forbearer of the modern MBA. The University of
Chicago, Graduate School of Business first offered working professionals the
Executive MBA (EMBA) program in 1940, and this type of program is offered by
most business schools today.
In 1950 the first MBA degrees were awarded outside the United States by the
University of Western Ontario in Canada, followed in 1951 with the degree awarded
by the University of Pretoria in South Africa. The Institute of Business
Administration, Karachi in Pakistan was established in 1955 as the first Asian
business school by the Wharton School of the University of Pennsylvania. In 1957,
INSEAD became the first European business school to offer an MBA program. The
MBA degree has been adopted by universities worldwide.
119
2.13 ACCREDITATION:
Business schools or MBA programs may be accredited by external bodies
which provide students and employers with an independent view of their quality, and
indicate that the school's educational curriculum meets specific quality standards. The
three major accrediting bodies are The Association to Advance Collegiate Schools of
Business (AACSB) which accredits research universities, the Association of
Collegiate Business Schools and Programs (ACBSP) which accredits junior colleges
and teaching colleges, and the International Assembly for Collegiate Business
Education (IACBE). The AACSB and the ACBSP are recognized accrediting
agencies for business schools in the United States by the Council for Higher
Education Accreditation (CHEA). MBA programs with specializations for students
pursuing careers in healthcare management also eligible for accreditation by the
Commission on the Accreditation of Healthcare Management Education (CAHME).
In the United States, a college or university must be accredited as a whole
before it is eligible to have its MBA program accredited. Accrediting bodies that
accredit institutions as a whole include the Council for Higher Education
Accreditation (CHEA): Middle States Association of Colleges and Schools (MSA),
New England Association of Schools and Colleges (NEASCSC), North Central
Association of Colleges and Schools (NCA), Northwest Commission on Colleges and
Universities (NWCCU), Southern Association of Colleges and Schools (SACS), and
Western Association of Schools and Colleges (WASC).
Accreditation agencies outside the United States include the Association of
MBAs (AMBA), a UK based organization that accredits MBA, DBA and MBM
programs worldwide; the Council on Higher Education (CHE) in South Africa; the
European Quality Improvement System (EQUIS) for mostly European and Asian
schools; and the Foundation for International Business Administration Accreditation
(FIBAA) in Europe.

120
2.14 BASIC TYPES OF MBA PROGRAMS:
2.14.1 Two year MBA:
Two year MBA programs normally take place over two academic years (i.e.
approximately 18 months of term time), in the Northern Hemisphere beginning in late
August/September of year one and continuing until May of year two, with a three to
four month summer break in between years one and two. Students enter with a
reasonable amount of prior real-world work experience and take classes during
weekdays like other university students.
2.14.2 Accelerated MBA:
Accelerated MBA programs are a variation of the two year programs. They
involve a higher course load with more intense class and examination schedules. They
usually have less "down time" during the program and between semesters. For
example, there is no three to four month summer break, and between semesters there
might be seven to ten days off rather than three to five weeks vacation.
2.14.3 Part-time MBA:
Part-time MBA programs normally hold classes on weekday evenings, after
normal working hours. Part-time programs normally last three years or more. The
students in these programs typically consist of working professionals, who take a light
course load for a longer period of time until the graduation requirements are met.
2.14.4 Executive MBA (EMBA):
Executive MBA (EMBA) programs developed to meet the educational needs
of managers and executives, allowing students to earn an MBA or another business-
related graduate degree in two years or less while working full time. Participants
come from every type and size of organization – profit, nonprofit, government —
representing a variety of industries. EMBA students typically have a higher level of
work experience, often 10 years or more, compared to other MBA students. In
response to the increasing number of EMBA programs offered, The Executive MBA
Council was formed in 1981 to advance executive education.

121
2.14.5 Distance learning:
Distance learning MBA programs hold classes off-campus. These programs
can be offered in a number of different formats: correspondence courses by postal
mail or email, non-interactive broadcast video, pre-recorded video, live teleconference
or videoconference, offline or online computer courses. Many respectable schools
offer these programs; however, so do many diploma mills. Potential students should
check the school's accreditation before undertaking distance learning coursework.
2.14.6 Dual MBA programs:
Dual MBA programs combine MBA degree with others (such as an MS or a
J.D., etc) to let students cut costs (dual programs usually cost less than pursuing 2
degrees separately), save time on education and to tailor the business education
courses to their needs. Some business schools offer programs in which students can
earn both a bachelor's degree in business administration and an MBA in four or five
years.

122
2.15 PROGRAM CONTENT:
Most top MBA programs cover similar subjects within their core required
courses. For information about the typical content of an MBA program's core
curriculum.
Breadth:
MBA programs expose students to a variety of subjects, including economics,
organizational behavior, marketing, accounting, finance, strategy, operations
management, international business, information technology management, supply
chain management, and project management. Students traditionally study a wide
breadth of courses in the program's first year, and then pursue a specialized
curriculum in the second year. Full-time students typically seek an internship during
the interim.
Specialization
Many programs allow students to specialize or concentrate in a particular area.
Standard concentrations include accounting, corporate strategy, decision sciences,
property management, economics, entrepreneurship, finance, general management,
human resources, international business, marketing, information systems /
information technology, telecommunication, organizational behavior, project
management, and operations management. Unspecialized MBA programs often focus
second-year studies on strategic management or finance.
In addition, a program may offer more specialized concentrations such as
Asian business, consulting, sports management, or degrees emphasizing real estate or
insurance. Many schools offer unique concentrations available nowhere else.

123
2.16 GUJARAT COMMON ENTRANCE TEST (GCET):
This is the seven year since the inception of the Gujarat Common Entrance
Test (GCET) for MBA There are national level entrance tests for MBA such as CAT,
MAT, XAT etc. However, GCET at the state level has found a form footing and
provided a single platform to the MBA aspirant students. The Education Department,
Government of Gujarat, vide Notification No. GH/SH/13/2008/PVS/102008-1462-S
dated May 29, 2008, has decided that the Gujarat Common Entrance Test for the
MBA program me of all Universities of Gujarat State for the academic ear 2008-09
will be conducted by Sardar Patel University. As per the Notification No.
GH/SH/10/2008/MBA/102008-633-S dated May23, 2008, admission to all seats in
government colleges of institutions and in the aided colleges or institutions and also
the seventy five percent seats of the total sanctioned seats in the unaided
colleges/institutions will be given by the GCET Admission Committee. If private
unaided institutions surrender their sanctioned seats fully of partially, then such seats
will also be filled by the GCET Committee.
2.16.1 Eligibility Criteria:
For the purpose of admission, a candidate shall have appeared in the Gujarat
Common Entrance Test (GCET). To appear in the Gujarat Common Entrance Test
(GCET), a candidate shall have passed the qualifying examination (a degree in any
discipline) with minimum of 50% marks (45% marks in case f Scheduled Caste and
Scheduled Tribe candidates) from:
1) A university situated in the Gujarat State; or
2) A University situated out side the Gujarat State provided the candidate
shall have passed the Higher Secondary School Certificate Examination
(Standard XII,10+2 pattern) or its equivalent examination from:
i) The Gujarat Board; or
ii) The central Board of Secondary Education Board provided that
the school in which the candidate has studied, should have been
located in the State of Gujarat; or
124
iii) The Council of Indian School Certificate Examinations, New
Delhi Board provided that the school in which candidate has
studied should have been located in the State of Gujarat.
A candidate who has appeared in final year of Bachelor’s Degree examination
shall also be eligible to appear in the Gujarat Common Entrance Test (GCET)
provided that he shall have passed the qualifying examination with 50% marks (45%
marks in case of Scheduled Caste and Scheduled Tribe candidates) at the time of
admission.
Explanation: 50% marks (45% marks in case of scheduled Castes or Scheduled
Tribes candidates) shall be computed on the basis of grand total of as he case may be
cumulative grade point average, as shown in fine year mark sheet of the university.
The minimum marks of 50% or 45% given above should be without rounding
off and grace marks. Candidates with such rounding of or grace marks will be
excluded for the purpose. A candidate who has appeared at the final year (Bachelor’s
Degree) examination of any university recognized by the Association of Indian
Universities (Subject to conditions stated above) shall be treated as provisionally
eligible for GCET.
2.16.2 Allocation of Seats:
Admissions to all seats in Government, Grant-in-aid institutions and
Institutions run by universities will be given by the GCET-2008 Committee. In
addition, seventy five percentages of the total sanctioned seats in the unaided colleges
or institutions will also be given by the GCET-2008 Committee. If Private Unaided
Institutes surrender their 25% management seats either fully or partially to BCET-
2008 Committee, then such seats will also be filled by the Committee.
2.16.3 Participating Institutes:
The details of universities and institutes, which are participating in GCET-
2008 for their MBA programmes, are given in the following table. In the given table,
GIA denotes “grant in aid” and SFI denotes “self-financing institute/programme”
Private Unaided Institute/programme).

125
Position of MBA Seats for GCET - 2008
Code
No.
Name and Address of the University/Institute GIA/
SFI
Intake
Bhavnagar University, Bhavnagar
01 Department of Business Admin., Bhavnagar Uni. Old Campus,
Bhavnagar - 364 001.
GIA 30
02 Department of Business Admin., Bhavnagar Uni. Old Campus,
Bhavnagar - 364 001.
SFI 30
Dharmsinh Desai University, Nadiad
03 Centre for Management Studies, College Road Nadiad - 387001 GIA 30
04 Centre for Management Studies, College Road Nadiad - 387001 SFI 30
Ganpat University, Kherva
05 V. M. Patel Institute of Mgt. Ganpat Vidyanagar,
Mehsana Gandhinagar Highway, PO. Kherva-382711,
Dist. Mehsana
SFI 90
Gujarat University, Ahmedabad
06 B. K. School of Business Management
Gujarat University, Ahmedabad – 380009.
GIA 60
07 Indukaka Ipcowala Institute of Management Education Campus,
Changa – 388421.
SFI 60
08 AES Postgraduate Institute of Business Management
Plot N. 16/1, Vikram Sarabhai Marg,
Opp. IIMA Navarangpura, Ahmedabad – 380 009.
SFI 120
09 L. J. Institute of Management Studies, Sanand – Sarkhej Circle,
S. G. Road, Ahmedabad 382 210.
SFI 120
10 L. J. Institute of Computer Applications, MBA Programme,
Sanand-Sarkhej Circle, S. G. Road, Ahmedabad 382 210.
SFI 60
11 Shri Jairambhai Patel Institute of Business Management and
Computer Applications, Near Indroda Circle, andhinagar –
382007 (formally NICM)
SFI 60
12 N. R. Institute of Business Management, GLS Campus, Ellis
Bridge, Ahmedabad – 380006
SFI 120

126
13 Shri Chimanbhai Patel Institute of Management and Research
Opp. Karnavati Club, S. G. Highway, Ahmedabad 380 051
SFI 120
14 Som-Lalit Institute of Business Management, SLIMS Campus,
Navrangpura, Ahmedbad – 9
SFI 90
15 Parul Institute of Engineering And Technology, MBA
Department, Po: Limba – 391760. Tal. Vaghodiya, Dist. Baroda
SFI 60
16 LDRP Institute of Technology and Research, Sector 15 ,
Nr. KH 5 Circle, Gandhinager – 382015
SFI 60
17 R. B. Institute of Management Studies, Mahavir Nagar, Opp.
Thakkarbapa Nagar, Ahmedabad – 382350
SFI 60
18 Indus Institute of Technology and Engineering, Village
Ranchada, Via Thaltej, Ahmedabad – 382481
SFI 60
19 Kalol Institute of Management, National Highway,
Kalol – 382721.
SFI 60
20 K. P. Patel School of Management and Computer Studies,
Jivanshilp Campus Kapadwanj – 387620
SFI 60
Hemchandracharya North Gujarat University Patna
21 S. K. School of Business Management, North Gujarat
University, University Road, Patna – 384265.
GIA 60
22 Nootan Sarva Vidalaya Kelvani Mandal Sanchalit MBA College
Gandhinagar Ambaji Link Road, Visnagar – 384315.
SFI 120
23 S. V. Institute of Management, Sarva Vidyalaya Campus, Kadi –
382715
SFI 60
Kadi Sarva Vishwavidhyalaya, Gandhinagar
24 S. K. Patel Institute of Management and computer Studies, Sarva
Vidyalaya Campus, GH-6 Road, Gandhinagar – 382023
SFI 120
M. S. University, Vadodara
25 M. S Patel Institute of Management Studies, Faculty of
Management, M. S. University of Baroda, Vadodara – 390 002.
GIA 40
Sardar Patel University, Vallabh Vidhyanagar
26 G. H. Patel Postgraduate Institute of Busines Management,
Sardar Patel University, Vallabh Vidyanagar – 388 120.
GIA 40
27 G. H. Patel Postgraduate Institute of Busines Management, SFI 20

127
Sardar Patel University, Vallabh Vidyanagar – 388 120.
28 Anand Institute of Management, Ahri Ramkrishna Seve Mandal,
Near Town Hall, Anand 388 001.
SFI 60
Saurashtra University, Rajkot
29 Smt. R. D. Gardi Department of Business Management,
Saurashta University, Rajkot – 360 005.
GIA 60
30 Smt. R. D. Gardi Department of Business Management,
Saurashta University, Rajkot – 360 005.
SFI 30
31 T. N. Rao College of Management Studies, B/h. MCA Bhavan,
Saurashtra Uni. Campus, Rajkot - 360005
SFI 120
32 J. V. Institute of Management Studies, Shri B. K. Shah
Education Complex, Indira Gandhi Marg, Gokul Nagar,
Jamnagar – 361004.
SFI 60
33 N. R. Vekaria Institute of Business Management Studies,
Commerce College, Bilkha Road, Junagadh – 362001.
SFI 120
34 H. N. Shukla College, Nr. Lalpari Lake B/h. Marketing Yard,
Rajkot
SFI 120
35 Shree Leuva Patel Trust MBA Mahila College, Smt. S. H.
Gajera Shaikshnik Sankul, Amreli – 365601.
SFI 60
36 R. K. College of Business Management, Kasturbbadham,
Rajkot- Bhavnagar Highway, Rajkot – 360020
SFI 120
37 Om Vindhyavasini Institute of Management, Rajkot Highway,
Shanala, Morbi – 363641
SFI 60
38 Atmiya Institute of Technology & Science, Kalawad Road,
Rajkot – 360005
SFI 60
39 K. N. V. Institute of Business Management Kalawad Road,
Metoda, Rajkot – 360003.
SFI 60
40 Kum. M. H. Gardi School of Management, Kalawad Road Vil.
Anandpar – 361162. Dist. Jamnagar
SFI 60
Veer Narmad South Gujarat University, Surat
41 Department of Business and Industrial Management, University
Campus, Udhana Magdalla Road, Surat – 395007.
GIA 30
42 Department of Business and Industrial Management, University SFI 60

128
Campus, Udhana Magdalla Road, Surat – 395007.
43 Hospitality and Tourism Management, Department of Business
and Industrial Management, University Campus, Udhana
Magdalla Road, Surat – 395007.
SFI 30
44 GIDC Rajju Shroff Rofel Institute of Management Studies, Plot
No. 14/5, GIDC, Vapi – 396195
SFI 120
45 Narmada College of Management, Zadeshwar, Bharuch – 392
011.
SFI 60
46 Shrimad Rajchandra Institute of Management and Computer
Application, Gopal Vidyanager, Bardoli Mahua Road, Dist.
Surat – 395007
SFI 60
47 S. R. Luthra Institute of Management MTB College Campus, Nr.
Adarsh Society, Athawalines, Surat - 395001
SFI 60
48 C. K. Pithawala Institute of Management,Nr. Malvn Mandir,
Via: Magdalla Port, Dumas Road, Tal. Choryasi, Dist. Surat –
395 007.
SFI 60
49 Sigma Institute of Management Studies, At Bakrol, Ajwa
Nimeta Road, Vadodara – 390 019.
SFI 60
50 Bhagwan Mahavir College of Management, New City Light
Road, Bhartana – Vesu, Surat – 395 017
SFI 60
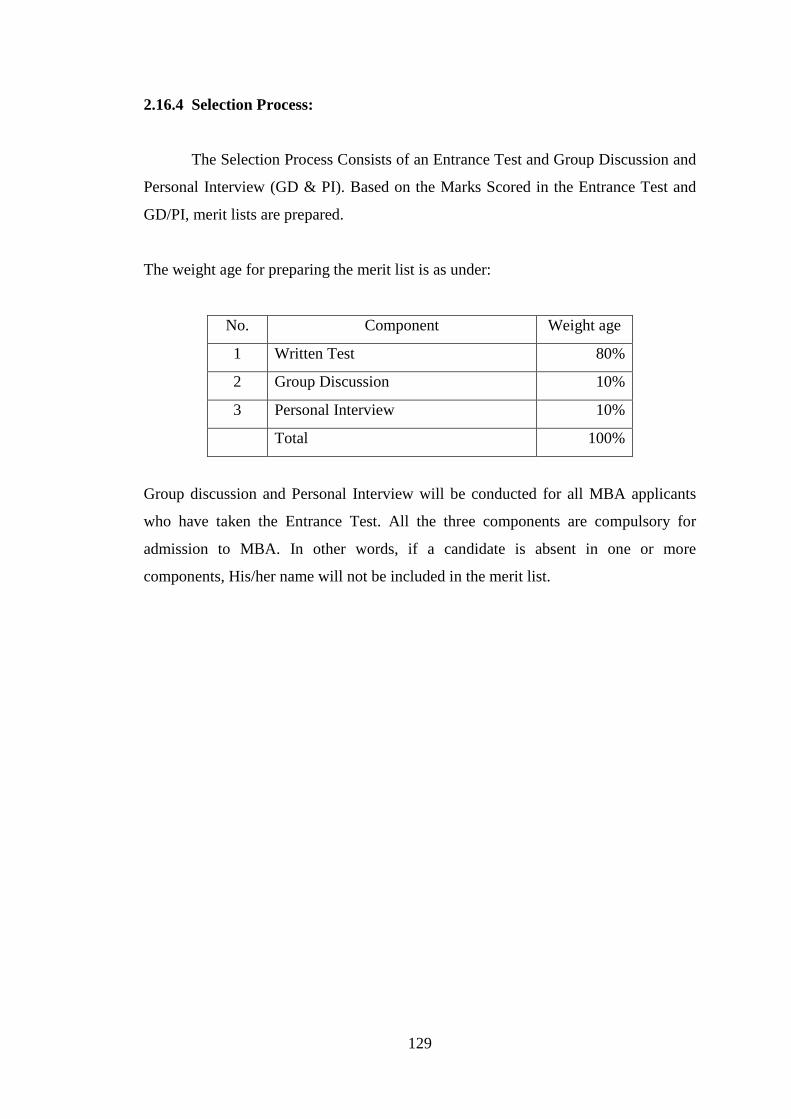
129
2.16.4 Selection Process:
The Selection Process Consists of an Entrance Test and Group Discussion and
Personal Interview (GD & PI). Based on the Marks Scored in the Entrance Test and
GD/PI, merit lists are prepared.
The weight age for preparing the merit list is as under:
No. Component Weight age
1 Written Test 80%
2 Group Discussion 10%
3 Personal Interview 10%
Total 100%
Group discussion and Personal Interview will be conducted for all MBA applicants
who have taken the Entrance Test. All the three components are compulsory for
admission to MBA. In other words, if a candidate is absent in one or more
components, His/her name will not be included in the merit list.

References
(i) Annual Report Ministry of Human Resource Development, Government of
India2006-2007.
(ii) Draft Report of Working Group on Higher Education for the XI Plan,
Planning Commission, Government of India (2007)
(iii) Selected Educational Statistics 2004-2005 (as on September 2004),
Ministry of Human Resource Development Government of India (2007)
(iv) Agarwal, P (2006), Higher education in India: The need for change. New
Delhi, Indian Council for Research on International Economic Relations.
URL:
www.icrier.org/publication/working_papers_180.html.
(v) Jha: Higher Education in India-Restructuring for increased innovation,
Document prepared for the World Bank, June 2006.
(vi) UGC: Chairman’s Nehru Memorial Lecture, University of Mumbai,
Nov.24, 2006 (available on the Web)
(vii) UGC Annual Report 2004-05

130
CHAPTER – 3: RESEARCH PLAN
Sr.
No. Particular
Page
No.
3.1 Introduction 131
3.2 Significance of satisfaction for management teachers 133
3.3 Significance of the study 135
3.4 Research Problem 137
3.5 Literature Survey 138
3.6 Research Methodology 143
3.7 Objective of the Study 144
3.8 Scope of the Study 145
3.9 Hypothesis 146
3.10 The Sampling Design 147
3.11 Method of Data Collection 148
3.12 Data Preparation 149
3.13 Analysis and Interpretation of Data 150
3.14 Limitation of the study 151
3.15 References 152

131
3.1 INTRODUCTION:
“In the immediate aftermath of the MBA the students expectations are
heightened-not only by wanting their return on investment, in terms of fees, salary
and career, but they want exposure to many more ideas and developed skills. That’s
the window the employee and employer have for expectations to be met’. Job
satisfaction survey measures employee’s issues, which include anything from
performance management to perceptions of work place. These types of surveys
measure problems that are organization wide, and may be used for departments or
functions as well. Did you know that your organizations productivity might be
hampered by the attitude of your employees? Did you know that customer satisfaction
is linked to employee satisfaction?
The basic question what we are trying to answer is do you work in
organization that is supportive of you as a person? Or do you work in an environment
that is uncaring, cold, and rigid?
The job satisfaction of an employee is a topic that has received considerable
attention by researchers and management alike. The most important information to
have regarding an employee in an organization is a validated measure of his/her level
of job satisfaction. Behavioral and social science research suggests that job
satisfaction and job performance are positively correlated. A better understanding of
job satisfaction and factors associated with it helps managers to guide employee’s
activities in a desired direction. The morale of employees is a deciding factor in the
organization’s efficiency. Thus, it is fruitful to say that managers, supervisors, human
resource specialists, employee and citizens in general are concerned with ways of
improving job satisfaction.
The motivation to investigate the degree of job satisfaction arises from the fact
that a better understanding of employees satisfaction is desirable to achieve a higher
level of motivation which is directly associated with student achievement. Recently,
the assessment of employee’s attitude such as job satisfaction has become a common
activity in organizations in which management is concerned with the physical and
psychological well being of people.
Employee satisfaction and retention have always been and important issue for MBA
colleges. After all high levels of absentees and staff turnover can affect your bottom
line, as temps, recruitment and re-training take their toll. But few practices (Infect few

132
colleges) have made job satisfaction a top priority, perhaps because they have failed
to understand the significance and importance of job satisfaction, and the
opportunities that lies in front them. Satisfied employees tend to be more productive,
creative and committed to their employers and recent studies have showed a direct
correlation between staff satisfaction and student’s satisfaction. Colleges who can
create work environments that attract, motivate and retain hard-working individuals
will be better placed to succeed in a competitive environment that demands s quality
and class.
Job satisfaction is regarded to one’s feelings or state of mind regarding the
nature of their work. Job satisfaction can be influenced by a variety of factors e.g.
quality of ones relationship with their superiors, quality of physical work
environment, salary, timings of work, etc.
The thesis tries to understand the mind state of the MBA teachers i.e. how they
behave to the different working conditions, what are their perceptions towards their
own superiors, how they react to the physical work settings, who are their coworkers,
etc. The research is totally based on the answers which will be given by the
management teachers and how they view the entire process of job satisfaction and
what measures can be taken to improve the overall scenario of management teachers
and create the work environment which is positive and constructive.

133
3.2 SIGNIFICANCE OF SATISFACTION FOR MANAGEMENT TEA CHERS:
For the purpose of this study it is important to examine the characteristics of
the Management Teachers, and personal characteristics that affect either positively or
negatively the attitudes and feelings of the contemporary Management Teacher’s job
and lead to job satisfaction. With the many difficulties most often identified with the
job of Management Teachers such as:
(A) 60 to 80 hour work weeks,
(b) Complexity of the job,
(c) Unending supervision of other activities,
(d) Minimal pay difference between top teachers and other teachers,
(e) High expectations,
(f) National, state and district mandates,
(g) Increasingly complex society, and
(h) Difficulty in helping teachers
Job Satisfaction becoming more collaborative (Yerkes & Guaglianone, 1998)
it is extremely important to identify the concepts that lead to satisfaction for
Management Teachers of MBA Colleges. When these concepts are known then
practices can be put into place that will enable President and college heads to
maximize job satisfaction for Management Teachers, thus reducing the turnover rate
and making recruitment of new people for such teaching roles easier.
In his study, Schmidt (1976) suggested that school administrators relate job
satisfaction to achievement and recognition and advancement; however, over the
years the view has emerged that salary, good interpersonal relationships, and
supervision were not related to satisfaction. Schmidt’s (1976) findings are similar to a
survey conducted in the corporate world by Industry Week. In the 27th annual
Industry Week CEO Survey, conducted in 1998, 78 CEO’s from the top publicly held
manufacturing firms globally, rated the ability to grow an organization and the ability
to develop people as the top two measures of job satisfaction (Stevens, 1998).
Financial compensation ran a distant third in terms of very important mentions, ahead
of holding a position for power and public recognition. Although Newby drew this
conclusion today’s pressures on Management Teachers of colleges are different from
those of the other streams colleges teachers. Given the climate of high-stakes testing

134
in Gujarat, where students must pass the test in order to enroll in the MBA, Colleges
must gain full accreditation and meet Union guidelines. This dissertation adapted the
Newby study by adding the accreditation status of the colleges as a predictor variable
to explore the attitudes that are associated with job satisfaction among Management
Teachers in MBA Colleges in Gujarat state.

135
3.3 SIGNIFICANCE OF THE STUDY:
In defining job satisfaction as the degree to which people like their jobs
Spector (1997) further stated that some enjoy work and find it to be a central part of
life, while others hate work and do so only because they must. Job satisfaction then
can be important to those who are in an organization and those who study
organizations because it allows the workers and researchers to look at aspects of job
satisfaction in the organization and work to increase those aspects that lead to job
satisfaction. Those who study job satisfaction in organizations do so for two reasons.
1. Job satisfaction is relevant for all those who are interested in the subjective
evaluation of working conditions such as responsibility, task variety, or
communication requirements because job satisfaction is strongly caused by such
conditions.
2. Job satisfaction is also important because it is closely linked to outcome variables
such as absenteeism, inefficiency, counterproductive behavior, or lack of
leadership (Dormann & Zapf, 2001).
The study of job satisfaction among Management Teachers of MBA Colleges
is important because there are aspects of the job that are highly attractive and lead to
satisfaction and aspects of the job that lead to dissatisfaction. Positive aspects include
the opportunity to work with a school faculty and staff to accomplish common goals,
developing school culture and the ability to work with students (Malone, Sharp, &
Walter, 2001). Too often in studies of Management Teachers the study looks at
negative aspects of the lectureship and neglects looking at what reasons make the job
of running a Management College attractive, leading to job satisfaction.
It is important to identify which factors contribute to job satisfaction as well as
those that may lead to job dissatisfaction to assure that the lectureship is attractive to
potential candidates and those already in professional teacher positions. There are
many variables that have been hypothesized to be a result of job satisfaction or
dissatisfaction. These include both those variables of job performance and those of
demographics.
136
The results of this study are helpful to practicing heads in three ways.
1. It further validates or refutes the previous research on job satisfaction among high
school principals. While much of the research on high school principal job
satisfaction has been completed in other countries and states this study will
attempt to draw comparisons to the findings in previous studies.
2. It answers the question of what variables contribute to the overall job satisfaction
of management teachers of MBA colleges in Gujarat state to date no study has
been focused on job satisfaction among management teachers of MBA colleges in
Gujarat state thus this study will be the first to Job Satisfaction study variables that
lead to job satisfaction among this group.
3. It assists current and future Heads in making decisions regarding their working
conditions in attempts to improve job satisfaction. Many teachers each year
complete the requirements to be Management Teacher, but many are unsure of the
benefits of being a lecturer. This study will assist these potential administrative
candidates in determining which variables to consider when looking for a job as a
Management Teacher.
137
3.4 RESEARCH PROBLEM:
The current era of high societal, economic and political accountability as well
as high stakes testing makes the job of leading the Management College as a teacher
extremely complex. The lecturer’s job is influenced by the social and political
pressures of the community and these pressures can lead to job dissatisfaction. The
researcher investigated the overall satisfaction level of Management Teachers of
MBA Colleges in Gujarat as measured by the Minnesota Satisfaction Questionnaire
(MSQ). The MSQ is based on the Theory of Work Adjustment which uses the
correspondence between the work personality and the work environment as the
principal reason or explanation for observed work adjustment satisfaction (Weiss,
Dawis, England, & Lofquist, 1967).
The twenty dimensions of the MSQ will be used individually as a measure of
the principal’s job satisfaction. The researcher looked at the influence of variables:
gender, age, level of education, salary level, years of experience, number of assistant
professors, years in current college district, college socio-economic level, college size,
and accreditation status on the Management Teachers general satisfaction level, and
their satisfaction with the twenty dimensions of the job.
138
3.5 LITERATURE SURVEY:
During the last two decades, a good number of research studies have been
made on various aspects of business-society relationships. An attempt is made here to
present a brief review of some research works that have direct and indirect relation to
the research problem.
Various surveys have established that the managers, particularly of large
corporations, accept a responsibility of establishing social policies for their
corporations.
Teacher Motivation and Job Satisfaction: A Study Employing the
Experience Sampling Method by ANDRE BISHAY
Levels of job satisfaction and motivation were measured by survey in a sample
of 50 teachers. A sample of 12 teachers was then studied using the Experience
Sampling Method (ESM). Teachers were randomly beeped by special pagers 5 times
a day for 5 days and completed surveys on mood and activity for each beep, resulting
in 190 reports of teachers’ daily experiences. Conventional survey data corresponded
with ESM data. Job satisfaction and motivation correlated significantly with
responsibility levels, gender, subject, age, years of teaching experience, and activity.
For this group of teachers who work in a school with a selective student body, overall
motivation and job satisfaction levels were high. Based upon the findings, it appears
that gratification of higher-order needs is most important for job satisfaction.
Teachers are arguably the most important group of professionals for our nation’s
future. Therefore, it is disturbing to find that many of today’s teachers are dissatisfied
with their jobs. “The mean CES-D (depression scale) score of a sample of 75 Los
Angeles teachers was 15.6, a value about twice the mean score obtained in
community surveys” (Beer & Beer, 1992). A CES-D score of 16 or greater is
considered significant because it is associated with increased risk of depression
(Schonfeld, 1989). It is crucial that we determine what increases teacher motivation.
Many factors have been examined in an attempt to find which ones promote teacher
motivation. Pay incentives have been found to be unsuccessful in increasing
motivation. In their study of 167 teachers, Sylvia & Hutchinson (1985) concluded:
“Teacher motivation is based in the freedom to try new ideas, achievement of
appropriate responsibility levels, and intrinsic work elements…. Based upon our
findings, schemes such as merit pay were predicted to be counterproductive.”

139
They explain that true job satisfaction is derived from the gratification of
higher-order needs, “social relations, esteem, and actualization” rather than lower-
order needs. Indeed, Rothman (1981) contrasts the security and financial motives for
entering teaching during the depression years with present-day idealistic and
intellectual convictions, especially because other professions pay equally well or
better. The conclusion of Greenwood & Soars (1973) that less lecturing by teachers
and more classroom discussions relates positively to teacher morale further supports
the importance of higher-order needs. Studies show that improvement in teacher
motivation has benefits for students as well as teachers; however, there is no
consensus about the precise benefits. For example, researchers have had varying
results when examining whether teacher motivation leads to increased levels of
academic achievement. Stevens & White (1987) studied there cords of students in 15
school districts, with 191 teachers as subjects. The standardized test scores from the
California Achievement Test were used as the best estimate of the learned behavior in
each teacher’s classroom. There was no direct relationship between teacher morale
and student achievement. However, Stevens & White surmised that further research
on this topic requires an examination of the achievement levels of students prior to
their involvement with the teachers participating in the study. “If pretest-posttest
scores could be obtained for the time students spent in a teacher’s classroom, the
achievement of those students while in that teacher’s classroom might be more
adequately measured.” The results of another study involving teachers in small
independent school districts demonstrated that high levels of interaction within the
faculty group, as determined by responses to questions on the Halpin & Croft
Observation Climate Description Questionnaire, correlated significantly with higher
pupil reading scores on the California Achievement Test (Jordan, 1986). It is likely
that high levels of teacher social interaction on the job are linked to high motivation
levels; thus, the possibility that enhanced levels of teacher motivation will lead to
superior student achievement cannot be dismissed. While the relationship between
teacher motivation and student achievement has not yet been established, the
correlation between teacher motivation and student self-esteem has been shown by
Peck, Fox, and Morston (1977).
“Teachers with strong positive attitudes about teaching had students whose
self-esteem was high. Students seem to recognize the effectiveness of teachers who
are satisfied with their teaching performance.” Rothman (1981) suggests that this
140
association exists because teachers serve as more than just educators; they are role
models. The benefits of teacher satisfaction for both teachers and pupils points to the
importance of studying how teachers feel about work. This study undertakes an
examination of how teachers feel while doing their daily tasks. The Experience
Sampling Method is used to determine which daily work related activities lead to the
highest levels of motivation and job satisfaction.
The Experience Sampling Method (ESM) makes use of an electronic device to
page the subject several times a day. When beeped, the subject completes a short
survey about what they are doing, which they are with, and how they are feeling.
ESM thus provides a more richly detailed picture of the day-to-day lives and emotions
of participants than conventional surveys. ESM has been used to study how people
feel doing different activities and to determine which daily activities are most
psychologically rewarding (Kubey & Csikszentmihalyi, 1981). Csikszentmihalyi
(1990) has proposed that individuals reach a state of happiness and satisfaction when
they are involved in an activity and are functioning at the peak of their abilities. In
this situation the individual experiences “high levels of concentration, immersion,
strength, and control.” He terms this experience “flow.” In the present study, the
concept of flow will be used to help determine which activities are the most
“psychologically rewarding,” which are more conducive to teacher motivation, and
which contribute to the fulfillment of higher-order needs. Flow may also be applied to
measure job satisfaction. And job satisfaction, in turn, is an index of morale and
motivation (Schonfeld, 1989).
There have been no studies of teacher motivation which have employed the
Experience Sampling Method (or any other research method which attempts to
examine everyday life). ESM allows for a more precise determination of which
activities motivate teachers and lead to their job satisfaction. Conventional survey
data, in conjunction with ESM data, was used to increase the sample size, provide
demographic data and examine teacher attitudes. Findings may prove useful in
determining what increases motivation and job satisfaction levels.
Job satisfaction among teachers
Attracting and retaining high quality teachers is a primary necessity as well as
a challenge for educational institutions. While intrinsic factors play a significant role
in motivating individuals to enter the teaching profession, extrinsic conditions can

141
influence their job satisfaction and desire to remain in teaching. In addition,
demographic factors and teacher specific and school specific characteristics also
affect job satisfaction.
This study is an evaluative and diagnostic attempt to discover empirically the
nature of relationships between job satisfaction and different factors, as well as
independent aspects of job satisfaction. The sample comprised 120 school teachers
working in government and private schools in Jammu city. The questionnaire covered
six aspects of the job: principal's behavior, society and colleagues' behavior, work
itself, pay and rewards, growth opportunities and recognition, and students' behavior
and others. The analysis revealed that each of these aspects played a role in job
satisfaction. The degree of job satisfaction secured by teachers is not high and the
reason lies in insufficient pay. Secondary level teachers are more satisfied than
primary level teachers. Contrary to expectation, private school teachers are more
satisfied than government school teachers despite the poor pay package, due to the
congenial atmosphere in the private schools. Female teachers are more satisfied due to
the nature of the job and the socio-cultural value of the profession. The level of
education inversely affects the pay satisfaction of the employees working at the same
level. Satisfaction with teaching as a career, not merely as a job, is an important
policy issue since it is associated with teacher effectiveness, which ultimately affects
student achievement
Correlates of Job Satisfaction in Medical Officers by LT COL S
CHAUDHURY*, LT COL A BANERJEE, A study was carried out to assess the job
satisfaction of medical officers of the Armed Forces. Medical officers having a
minimum of five years service, stationed in a large cantonment having a tertiary care
service hospital were administered anonymously the scale developed by Brayfield and
Rothe to assess job satisfaction. A total 64 medical officers (22 administrative cadre,
26 specialists and 16 superspecialists), had participated in the study.
Overall there was a low level of job satisfaction among the medical officers.
There was no significant difference in the level of job satisfaction in the three groups.
Only 3 each of administrative cadre and specialist officers were in the higher satisfied
group. The most common factor stated (91.5% of the respondents), as contributing
towards job satisfaction was an opportunity for self-development. Others in
decreasing frequency were job security (51.6%), prestige of organization (38.5%),

142
nature of work (28.8%) and opportunity for promotion (21.6%). Factors for
dissatisfaction were poor utilization of skills (80.8%), poor promotional prospects
(78.4%), inadequate redress of grievances (72.7%), organizational policy (68.7%) and
inadequate pay and allowances (48.7%).
It was concluded that job satisfaction is a multi-dimensional phenomenon
where it is not easy to assign one factor as the sole determinant of satisfaction /
dissatisfaction with the job.
Purani & Sahadev conducted study on “The moderating role of industrial
Experience in the job satisfaction, Intention to leave relationship: an empirical
study among salesmen in India” with an objective to explores the moderating role
of Industrial experience in the relationship between different facets of a sales person’s
satisfaction with the job and his/her intention to quit the job. The study is based on the
data collected from sales persons from a pharmaceutical company in India.
Dimensions of job satisfaction have been specifically developed for this study due to
the cultural specificity of the context. The job satisfaction scale was developed
through a process of qualitative research. The study finds that industry experience
moderates the job satisfaction, disinclination to quit relationship for most of the job
satisfaction dimensions. Specifically it is seen than Industry experience has a
moderating effect when we consider the effect of a salesperson’s satisfaction with the
organizational HR policies, supervisor satisfaction, compensation policies and career
development and disinclination to quit.

143
3.6 THE RESEARCH METHODOLOGY:
“A COMPARATIVE ANALYSIS OF JOB SATISFACTION LEVEL OF
MANAGEMENT TEACHERS OF MBA COLLEGES IN GUJARAT STATE” the
same can be expressed in following questions.
The ongoing debate on management schools and the staff gives rise to the
following question
(1) What is the attitude of the management of the colleges towards their own
staff?
(2) What is the attitude of the Management teachers towards their own
management?
(3) What is the attitude of students towards their own teachers?
(4) What measures are taken from the management side to ensure job
satisfaction among their employees?
Above questions give rise to the some further research. An extensive research
has been undertaken to quantify the research and two set of area have been identified.
First set consists of what management thinks about their staff? And second set
consists of how staff reacts? The ongoing research has provided the base for the
further study. The first Ares has been further analyzed in three major areas namely the
policies implemented by the management, attitude of management towards
development of staff, and approach of the management towards their staff. In the first
Ares all other facilities and services provided by the management like work-
environment, policies, salary, development opportunities and other related areas are
classified. The second major area is further classified into how staff reacts to the
change in the policies, programmed and work-environment and the packages provided
to them. Thus over here the main problem is divided into several major sub problems
and various set of questions related to the sub problems have been furnished and all
these questions to gather furnish a problem statement i.e. “ A COMPARATIVE
ANALYSIS OF JOB SATISFACTION LEVEL OF MANAGEMENT TEACHERS
OF MBA COLLEGES IN GUJARAT STATE”

144
3.7 OBJECTIVES OF THE STUDY:
Objectives of the present study are
(1) Developing systematic analysis of the staff towards the management and their
policies.
(2) To ascertain the attitude of management towards staff.
(3) To know the attitude of the staff towards the implementing of new system of
learning.
(4) The evaluation of the system of working in the MBA colleges in Gujarat.
145
3.8 SCOPE OF THE STUDY:
This study is aimed at understanding the mindset of the staff of the MBA
colleges in Gujarat. It focuses on both the side of the coin. What management thinks
about the staff and what staff thinks about the management and the college? This
overall study seeks to answer the following questions as the scope of the study.
1. Mind set of management towards the staff.
2. Mind set of staff towards the management.
3. What policies and programmers do the management for the development of
the staff implements?
4. How staff insights into this programme and policies implemented by the
management.
5. What social responsibilities does the management towards the staff follow?
6. How staff is looking towards the implementing the social responsibilities
framed by the management.
7. Overall working conditions of the management institutes of MBA in Gujarat.
8. Is there any difference in facilities and work-environment as there is change in
the location?

146
3.9 HYPOTHESIS OF THE STUDY:
(A)
(1) Null hypothesis – There is no significant difference in the attitude
of staff towards management.
(2) Alternate Hypothesis – There is significant difference in the attitude of
staff towards management.
(B)
(1) Null Hypothesis – There is no significance difference in the
working environment of MBA colleges in
Gujarat.
(2) Alternate Hypothesis – There is significance difference in the working
environment of MBA colleges in Gujarat.

147
3.10 THE SAMPLING DESIGN:
The study is aimed at understanding the “A COMPERATIVE ANALYSIS
OF JOB SATISFACTION LEVEL OF MANAGEMENT TEACHERS OF MBA
COLLEGES IN GUJARAT STATE” . The study further focus on the two main
aspects i.e. what management thinks about the staff and what staff thinks about the
management? To complete the whole study there was the need for the generation of
primary data. For the collection of data MBA colleges existing in Gujarat where
selected. The care was taken while selecting the MBA institute was that it should be
approved by AICTE and the concerned university, the staff working in the college is
working on a full-time bases and are qualified enough to hold the position in MBA
colleges. The data will be collected by personally contacting the concern person or by
sending a representative at the college or by mail or email.

148
3.11 METHODS OF DATA COLLECTION:
Since the data needed for this research is primary data, a questionnaire is
prepared and the concern people were contacted in person or through email or mail. In
some places the services of courier were also taken. Even certain concern persons will
be contacted in seminars, conferences, and during their services as a guest lectures.
Mails were sent via both the ways by courier and by email. Majority of the MBA
teachers were approached via their colleges in the Gujarat as majority of the teachers
were either permanent or the temporary teachers in the Gujarat.
To meet the research objective of research Questionnaire was used as an instrument
for collecting primary data. Looking to the nature of study the questionnaire was
structured and mainly contained questions, which are closed ended. The response were
recorded and measured by using Nominal Scale and Likert Scale. The researcher to
collect qualitative information also incorporated few open-ended questions. The data
collected thus was both qualitative and quantitative in nature.
The sample population comprised of 172 management teachers (40% of the
population) working in different MBA colleges of Gujarat. All the institutes are
approved by AICTE, New Delhi. The sample MBA institutes have intake capacity of
varying size ranging from 30 students to 120 students across the state. Out of 172
MBA teachers, 108 (62.8%) are working as lectures, 45 (26.2%) are employed as
Assistant Professors, 7 (4.1%) are employed as Professors and 12 (7.0%) are
employed as Principals/Directors in different institutions. All the teachers are full time
employees in their respective management colleges. The approving body i.e. AICTE
New Delhi in its norms have made it mandatory to maintain teacher student ratio and
also the cadre ratio. More over UGC and AICTE has also prepared detailed guidelines
for MBA teachers in terms of academic qualification and experience to become
eligible to be designated in various cadres of management education.

149
3.12 DATA PREPARATION
Data preparation begins with preliminary check of all the questionnaires for its
completeness. The collected data was edited, coded, tabulated, grouped and organized
according to the requirement of the study and than entered into SPSS (statistical
package for social sciences) for analysis.

150
3.13 ANALYSIS AND INTERPRETATION OF DATA
For analyzing the hypothesis, parametric as well as non-parametric tests have been
used in this research. t test (tests for differences between means, tests for differences
between proportions and testing of means) and Chi-Square test is used to test the
statistical significance of observed association in a cross-tabulation and to analyze the
data because Pearson Chi-Square is the most common test for significance of the
relationships between categorical variables. Along with Chi –Square, Phi Correlation
Coefficient, Cramer’s V, Contingency Coefficient and Eta is used where ever required
for measuring strength of association between the two variables.
151
3.14 LIMITATIONS OF THE STUDY:
1. This evaluation is based on the primary data generated through questionnaire and
collected from the concern person and because of these the finding entirely
depends on the accuracy of such data.
2. It has the element of fear from the side of staff.
3. It is affected by the personal relationships the staff shares with the management.
4. The factor of personal bias can play the part of spoilsport.
5. The personal characteristic of the person can play an important role in answering
the questions.
6. Location factor can play an important role in getting indifferent answers.

152
3.15 REFERENCES
• Adams, J.P. (1999). Good Principles, good schools. Thrust for Educational
Leadership, 29(1), 8 – 11.
• Anderson, K (2003, September 12). Few Districts are up to snuff. The free
Lance – star, pp. C1, C4.
• Armstrong, B. C. (2001). School size as a factor in the job satisfaction and
locus of control of high school principals in Missouri. Unpublished doctoral
dissertation, university of Kansas, Lawrence.
• Ary, D., Jacobs, L.C., & Razavieh, A. (2002). Introduction to Research in
education (6th ed.)
• Bayfield A H and Roth H F 1951 “An index of job satisfaction” journal of
applied psychology.
• Barry, D.A (2002). Job satisfaction and leadership style: A study of Michigan
high school principals. Unpublished doctoral dissertation, western Michigan
University, Kalamazoo.
• Belmont, CA: Wadsworth. Association of California School Administrators.
(2001). Recruitment and retention of school leaders: a critical state of need.
Sacramento: ACSA
• Best, J.W., & Kahn, J.V. (2003). Research in education (9th edition). Boston:
Pearson.
• Blanchflower, D.G., Oswald, J.V. (1993). Well being overtime in Britain and
USA. Hanover, NJ: Dartmouth College.

153
• Bowran J, Todd K. Job stressors and job satisfaction in a major metropolitan
public EMS service. Prehospital and Disaster Medicine 1999; 14(4):236-9.
• Brady, D.B. (2001). Correlates of job satisfaction among California principals.
Unpublished doctoral dissertation, university of Southern California, Los
Angeles.
• Brandt, R. (1987). On leadership and student achievement: a conversation
with Richard Andrews. Educational Leadership, 45(9), 12 – 16.
• Brayfield A, rothe HH. An index of job satisfaction. Journal of applied
psychology 1952; 35:307-11.
• Bridges, R.L. (1995). The relationship of job satisfaction with ten independent
variables: A study of Arkansas, Fayetteville.
• Brogan, G.B. (2003). Job satisfaction of Idaho high school principals.
Unpublished doctoral dissertation, Idaho State University, Boise.
• Bruce, W.M., & Blackburn, J.W. (1992). Balancing job satisfaction and
performance. Westport.
• Buchbinder RN , Wilson M, Melick CF, power NR> Primary care physician
job satisfaction and turnover. amer jour of managed care 2001;7(7) :16-21.
• Calnan m. wain wright C, forsythe M, wall B, Almond S. Mental health and
stress in the workplace; the case of general practice in the UK. Soc sci MED
2001; 52:499-507.
• Chopra G, Singh G. A study of job satisfaction among doctor in ESI
Corporation, Delhi. Hospital Administration 1992:29:30-6.

154
• Fifth – cozens J. individual and organizational predictor of depression. Br jour
Gen Prac 1999:48:1647 -51.
• Huby G, Gerry M, McKinstry B, Porter M, Shawj , Wrate R.Morale among
general practitioner: qualitative study exploring relations between partnership
arrangement, personal style, and work load. BMJ 2002;325;140
• Kmietowicz K. Quarter of GPs wants to quit, BMA survey shows. BMJ 2001;
323; 887.
• Korad TR, Williams Es, Linzer M.” Measuring physician job satisfaction in a
changing workplace and a challenging environment.” Medical Care 1999:37
(11):1174-82.
• Pathman DE, Konard TR, William ES, Schlecker WE, linzer M. Physician
job satisfaction, job dissatisfaction, and physician turnover. Jour of fam prac
2002; 5(7): 16-21.
• Rodriguez MJ, Mira JJ Alwarez J, Vatalla J. satisfaction of health care
providers and quality assurance in Spanish hospital. Work and stress
1922/6(3)/229-38
• Sibbald B, Enzer I, Cooper C, Rout U, Sutherland V. GP job satisfaction in
1987, 1900, and 1998: lessons for the future? Fram Prac 2000; 17:364-71.
• Singh p effect of occupational stress and mental health on job satisfaction of
nurses. MA Thesis, Luknow University, 1989.

155
CHAPTERCHAPTERCHAPTERCHAPTER----4 4 4 4
ANALYSIS AND INTERPRETATION OF DEGREE OF JOB
SATISFACTION OF MANAGEMENT TEACHERS WORKING IN
MBA COLLEGES OF GUJARAT STATE – I
Sr.
No. Particular
Page
No.
4.0 Introduction 156
4.1 General Characteristics of Management Colleges and Teachers in
Gujarat 157
4.2 Satisfaction of Post Graduate Management Teachers & t’ test for
dimensions/factors determining job satisfaction of management
teachers in Gujarat.
169
4.3 Job Satisfaction and Salary Drawn 174
4.4 Degree of job satisfaction and aggregate years of work experience
of management teachers of Gujarat. 178
4.5 Degree of job satisfaction and designation of management teachers
of Gujarat. 182
4.6 Degree of job satisfaction and age of management teachers of
Gujarat 185
4.7 Degree of job satisfaction of management teachers and length of
service with their current college. 188
4.8 Degree of job satisfaction of management teachers and size of
Management College 191
4.9 Degree of job satisfaction measured through other job satisfaction
parameters 194

156
4.0 Introduction:
In this chapter, characteristic of management colleges and teachers working in these
colleges located in different geographical regions of Gujarat is presented. The sample
consists of one hundred and seventy two management teachers working in different
management colleges of Gujarat. The management colleges of Gujarat have different
location, intake capacity of students, conducting different academic courses, etc. The data
related to job satisfaction level of management teachers working in different positions,
with different academic qualifications, tenure of work experience, etc have been
analysized, interpreted and presented in this chapter. The different satisfaction variables,
which have been studied, are broadly grouped into general characteristics of management
colleges and teachers, and various factors affecting satisfaction level of employees are
also presented in this chapter. As specified in Chapter 3 titled “Research Methodology”
that for academic year 2008-2009, there are about fifty MBA institutes approved by
AICTE (All Indian Council for Technical Education, New Delhi) and functioning in the
state of Gujarat. Accordingly, the research instrument of job satisfaction developed on the
basis of the Manual for the ‘Minnesota Job Satisfaction’ had been sent to all the
management teachers working in different MBA institutes of Gujarat for recording their
job satisfaction responses. In all one hundred and seventy two MBA teachers responded
to the questionnaire and sent back completely filled in questionnaires. After checking for
the correctness of the responses, the data had been coded and entered into SPSS 12.0
sheet for analysis. Thus the analysis and interpretation of all the factors affecting job
satisfaction and its level have been presented in this chapter.
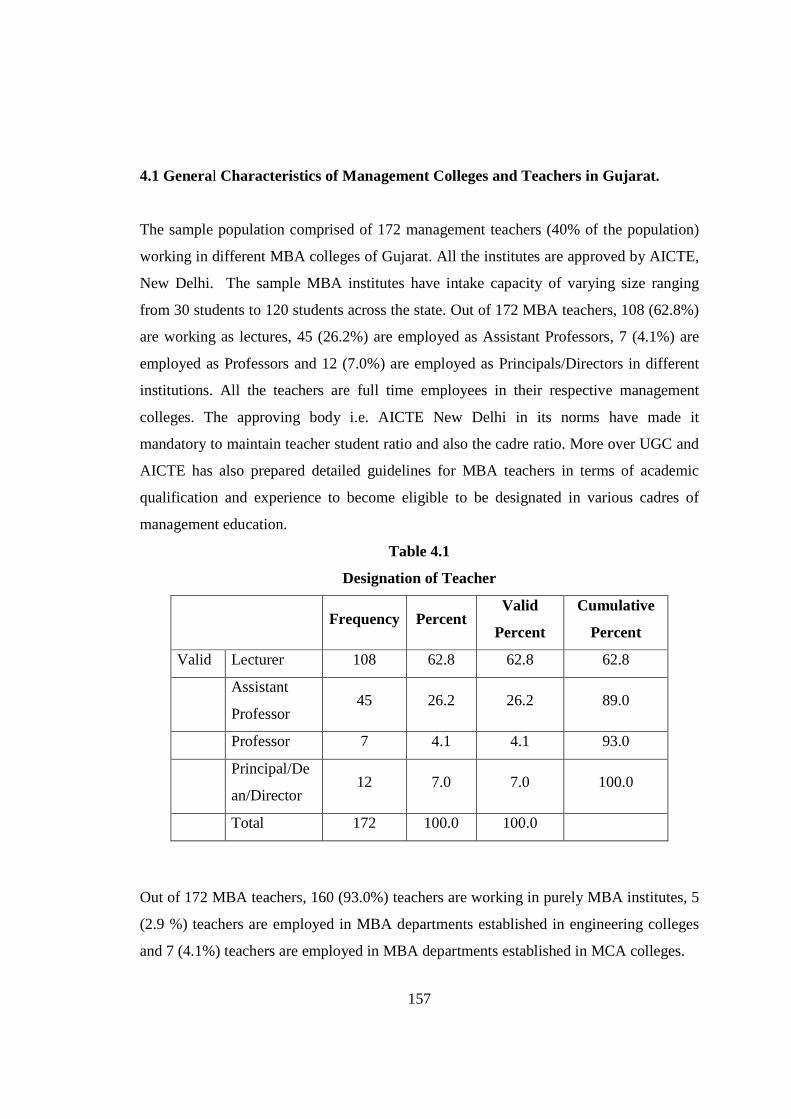
157
4.1 General Characteristics of Management Colleges and Teachers in Gujarat.
The sample population comprised of 172 management teachers (40% of the population)
working in different MBA colleges of Gujarat. All the institutes are approved by AICTE,
New Delhi. The sample MBA institutes have intake capacity of varying size ranging
from 30 students to 120 students across the state. Out of 172 MBA teachers, 108 (62.8%)
are working as lectures, 45 (26.2%) are employed as Assistant Professors, 7 (4.1%) are
employed as Professors and 12 (7.0%) are employed as Principals/Directors in different
institutions. All the teachers are full time employees in their respective management
colleges. The approving body i.e. AICTE New Delhi in its norms have made it
mandatory to maintain teacher student ratio and also the cadre ratio. More over UGC and
AICTE has also prepared detailed guidelines for MBA teachers in terms of academic
qualification and experience to become eligible to be designated in various cadres of
management education.
Table 4.1
Designation of Teacher
Frequency Percent
Valid
Percent
Cumulative
Percent
Valid Lecturer 108 62.8 62.8 62.8
Assistant
Professor 45 26.2 26.2 89.0
Professor 7 4.1 4.1 93.0
Principal/De
an/Director 12 7.0 7.0 100.0
Total 172 100.0 100.0
Out of 172 MBA teachers, 160 (93.0%) teachers are working in purely MBA institutes, 5
(2.9 %) teachers are employed in MBA departments established in engineering colleges
and 7 (4.1%) teachers are employed in MBA departments established in MCA colleges.

158
Table 4.2
Division/Department
Frequency Percent
Valid
Percent
Cumulative
Percent
Valid MBA 160 93.0 93.0 93.0
Engineering 5 2.9 2.9 95.9
MCA 7 4.1 4.1 100.0
Total 172 100.0 100.0
The below table shows the average age of management teachers employed in different
management institutes of Gujarat. The age of an individual affects the job satisfaction
level to a greater extent. People in their early age are more ambitious and thus have more
carrier expectations hence if the job fails to meet their carrier aspirations people tend to
get dissatisfied with their job. Out of 172 MBA teachers, 102 (59.3%) teachers are in the
age group of 24-30 years, 38 (22.1%) teachers are employed in age group of 31-35 years,
11 (6.4%) are in the age group of 36-40 years, 14 (8.1%) are in the age group of 41-45
years and 7 (4.1%) MBA teachers are in the age group of 46 and above years.

159
Table 4.3
Age of Teachers
Frequency Percent Valid Percent
Cumulative
Percent
Valid 24-30 years 102 59.3 59.3
31-35 yrs 38 22.1 22.1
36-40 yrs 11 6.4 6.4
41-45 yrs 14 8.1 8.1
46 years & above 7 4.1 4.1
Total 172 100.0 100.0
The below table shows the average work experience of management teachers employed
in different management institutes of Gujarat. In Gujarat in recent times many new MBA
colleges have been established and as a result, the shortage of trained and experienced
teachers has been felt. As observed from the table below, majority of the teachers have
just entered the academic field and opted teaching as profession. Thus out of 172
management teachers, 102 (59.3%) of teachers has mere work experience ranging from
1-3 years, 51 (29.7%) of teachers have work experience ranging from 4-7 years, 5 (2.9%)
of teachers have work experience of 8-10 years, 7 (4.1%) have experience ranging from
11-15 years and 7 (4.1) of teachers have work experience of above 15 years respectively.
Table 4.4
Experience of MBA Teachers
Frequency Percent Valid Percent
Cumulative
Percent
Valid 1-3 years 102 59.3 59.3
4-7 years 51 29.7 29.7
8-10 years 5 2.9 2.9
11-15 years 7 4.1 4.1
Above 15 years 7 4.1 4.1
Total 172 100.0 100.0

160
AICTE New Delhi is the statutory body created by special act of parliament and
functioning under the Ministry of Human Resources, Govt. of India. It is this body that
monitors and controls the functioning of various management institutions in our country.
AICTE has laid down guidelines in terms of academic qualification and experience
required to work in MBA College as teachers. Only those persons fulfilling requite
technical qualification along with first class at their post graduate are eligible to be
appointed as teachers in MBA colleges. More over post graduate management course is
of two years duration divided into four semesters. Each semester offers variety of
subjects ranging from core subjects like English Communication, Accounting for
Managers, Economics, Quantitative Techniques, and Management Information Systems
etc. and also offers specialization from second year, third semester onwards in the area of
Marketing, Finance, Human Resource Management, Information Technology, Operations
etc. Thus depending upon the core subjects and specializations offered by MBA colleges,
MBA colleges recruit people with varied academic back ground who can teach students
different subjects most effectively.
Thus from the below table it is observed that 14 (8.1%) teachers are possessing academic
qualification of B.Com-M.Com, 83 (48.3%) teachers are B.B.A.-M.B.A, 24 (14%) are
B.E.-M.B.A, 6 (3.5%) are B.Pharm-MBA, 18 (10.5%) are B.Sc-MBA and 4 (2.3%)
teachers are having BCA-MBA academic qualification respectively. More over there are
more than 23 (13.4%) management teachers are having Masters with PhD qualification.

161
Table 4.5
Academic Qualification of Management Teachers
Frequency Percent
Valid
Percent
Cumulative
Percent
Valid B.Com-M.Com 14 8.1 8.1
B.B.A.-M.B.A 83 48.3 48.3
B.E.-M.B.A. 24 14.0 14.0
B.Pharm-M.B.A. 6 3.5 3.5
B.Sc.-M.B.A. 18 10.5 10.5
B.C.A.-M.B.A. 4 2.3 2.3
Masters + PhD 23 13.4 13.4
Total 172 100.0 100.0
The teachers of MBA colleges are expected to upgrade their skills and knowledge on
continuous basis. Business is a dynamic process and thus new methods, systems and
strategies are developed on regular basis by business organization. If the teachers of
management institutions have to keep their self abreast with new developments taking
place in the field of business management, over and above their normal teaching duties,
they are expected to undertake research activities and participate in the development of
case studies. The institutes should also facilitate and encourage teachers in such activities.
Participation of teachers in seminars, conferences, workshops etc gives opportunities to
them to update their subject knowledge and their by enable teachers to improve their
class room deliveries. In fact class room performance is one of the biggest sources of
motivation. Many institutions grant permission and duty leave to their teachers to
participate in conferences, seminars, workshops etc and also bear entire cost of
registration, traveling and accommodation of the teacher.
From the below table it can be observed that 55 (32%) of the management teachers have
not participated in any of the mentioned academic activities. 66 (38.4%) teachers have
participated in 1-5 academic events, 29 (16.9%) teachers have participated in 6-10,
10(5.8%) have participated in 11-15 events, 12 (7%) management teachers have

162
participated in more than 15 workshops, conferences, seminars etc during their course of
work in management colleges.
Table 4.6
Training Seminars Conferences Workshops Attended
Frequency Percent
Valid
Percent
Cumulative
Percent
Valid None 55 32.0 32.0
1-5 66 38.4 38.4
6-10 29 16.9 16.9
11-15 10 5.8 5.8
More than 15 12 7.0 7.0
Total 172 100.0 100.0
It has been written and narrated in much of the management literature that money is one
of the biggest motivator and satisfier. In India human resource policies related to
management teachers are laid down by UGC and AICTE from time to time and
accordingly the salary structures of all the management teachers is decided. Majority of
the MBA institutions pays their teachers as per the norms laid down by these bodies.
More over salaries paid to management teachers are as per their designation and
academic qualification. Broadly speaking there are more or less four major designations
of management teachers namely Assistant Professor, Associate Professor, Professor and
Principal/Director in majority of institutions. From the below table it is observed that out
of 172 management teachers employed in different institutions, 64 (37.2%) teachers
draws salary in the range of Rs.10,000 to Rs. 20,000, 60 (34.9%) teachers gets salary in
the rang of Rs. 20, 000 to Rs. 30,000 and 48 (27.9%) teachers draws salary above Rs.
40,000.

163
Table 4.7
Salary Drawn (Rupees)
Frequency Percent
Valid
Percent
Cumulative
Percent
Valid 10,000-20,000 64 37.2 37.2
20,000-30,000 60 34.9 34.9
More than 40,000 48 27.9 27.9
Total 172 100.0 100.0
AICTE New Delhi in its guidelines for setting up and functioning of MBA colleges has
specified clearly the faculty cadre ratio that is to be maintained by institutions conducting
two years full time MBA course and approved by AICTE. Therefore for every MBA
college, it is mandatory to recruit two assistant professors for intake approval of sixty
students to first year of two years full time MBA course.
From the table below it is observed that out of 172 responding management teachers, 5
(2.9%) management teachers say that they only one assistant professor in their college,
90 (52.3%) teachers say they have two assistant professors, twelve colleges (7%) have
three assistant professors, 60 (34.9%) colleges have four assistant professors and 5
(2.9%) colleges have five or more assistant professors working in the institute
respectively.
Table 4.8
Number of Assistant Professors Working in College
Frequency Percent
Valid
Percent
Cumulative
Percent
Valid 1 5 2.9 2.9 2.9
2 90 52.3 52.3 55.2
3 12 7.0 7.0 62.2
4 60 34.9 34.9 97.1
5 or more 5 2.9 2.9 100.0
Total 172 100.0 100.0

164
Teachers are the building blocks of any academic institution. The colleges to a greater
extent are known by the quality of faculties working in the institute. More over learning
is believed to be a slow process and thus teachers with experience can do more justice to
the subjects that they teach. More over experienced teachers can make learning of
students more meaningful and effective.
From the table below it is observed that out of 172 respondents, 92 (53.5%) have been
working in MBA institutes since 1-3 years only, 36 (20.9%) have been working since 4-6
years, 20 (11.6%) are working since 7-9 years, 11 (6.4%) teachers are working since 10-
15 years in MBA profession and finally 13 (7.6%) management teachers are in MBA
teaching profession since more than 15 years. We can conclude that 74.4 % teachers
possess MBA teaching experience of only 1-6 years. These teachers have just got an
opportunity to work as faculty in MBA College due to rapid up-coming of new colleges
with in last two to three years.
Table 4.9
Experience of Teaching in MBA
Frequency Percent
Valid
Percent
Cumulative
Percent
Valid 1-3 years 92 53.5 53.5 53.5
4-6 years 36 20.9 20.9 74.4
7-9 years 20 11.6 11.6 86.0
10-15 years 11 6.4 6.4 92.4
15 years or more 13 7.6 7.6 100.0
Total 172 100.0 100.0
The concept of self finance colleges in Gujarat just started in the year 1998-1999. Earlier
there was only couple of state government university departments imparting post
graduate management education in the state. The self finance MBA colleges during their
inception in 1999 had to depend on industries or fresh MBA graduates for filling up
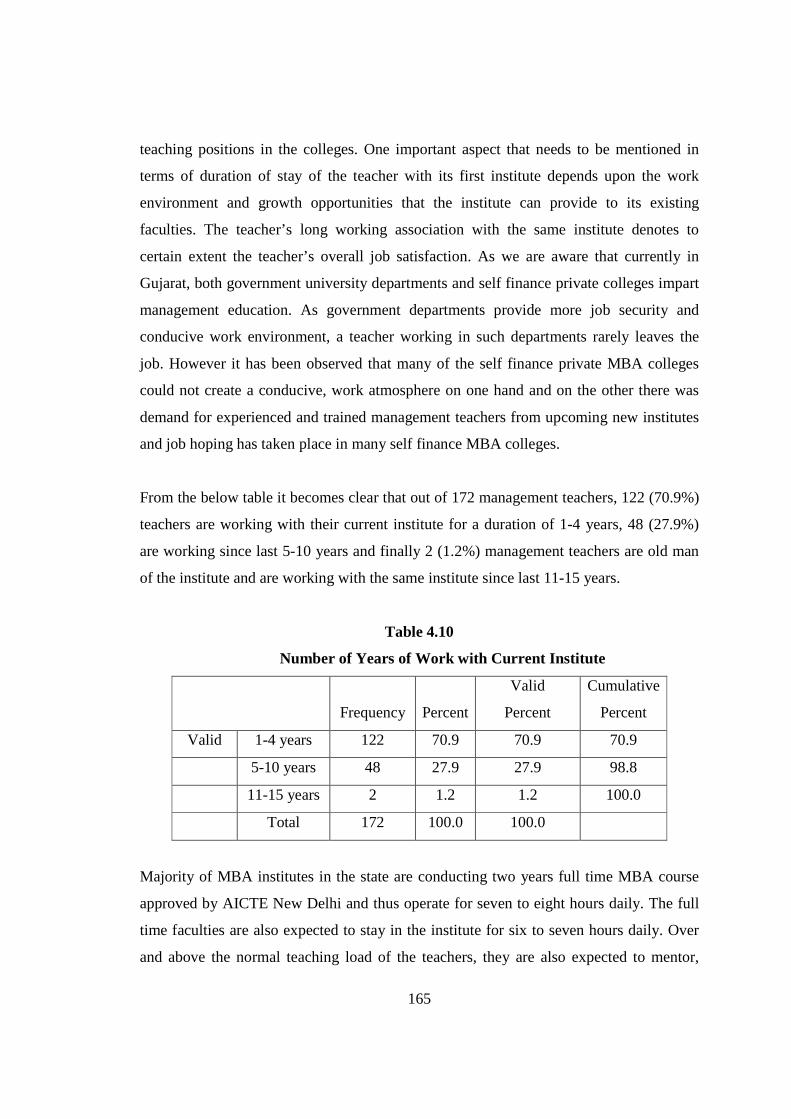
165
teaching positions in the colleges. One important aspect that needs to be mentioned in
terms of duration of stay of the teacher with its first institute depends upon the work
environment and growth opportunities that the institute can provide to its existing
faculties. The teacher’s long working association with the same institute denotes to
certain extent the teacher’s overall job satisfaction. As we are aware that currently in
Gujarat, both government university departments and self finance private colleges impart
management education. As government departments provide more job security and
conducive work environment, a teacher working in such departments rarely leaves the
job. However it has been observed that many of the self finance private MBA colleges
could not create a conducive, work atmosphere on one hand and on the other there was
demand for experienced and trained management teachers from upcoming new institutes
and job hoping has taken place in many self finance MBA colleges.
From the below table it becomes clear that out of 172 management teachers, 122 (70.9%)
teachers are working with their current institute for a duration of 1-4 years, 48 (27.9%)
are working since last 5-10 years and finally 2 (1.2%) management teachers are old man
of the institute and are working with the same institute since last 11-15 years.
Table 4.10
Number of Years of Work with Current Institute
Frequency Percent
Valid
Percent
Cumulative
Percent
Valid 1-4 years 122 70.9 70.9 70.9
5-10 years 48 27.9 27.9 98.8
11-15 years 2 1.2 1.2 100.0
Total 172 100.0 100.0
Majority of MBA institutes in the state are conducting two years full time MBA course
approved by AICTE New Delhi and thus operate for seven to eight hours daily. The full
time faculties are also expected to stay in the institute for six to seven hours daily. Over
and above the normal teaching load of the teachers, they are also expected to mentor,

166
guide and groom the students in their academic and related activities after they have
completed their normal teaching duty of the day.
Thus from the below table it is observed that 36 (20.9%) teachers spent 31-40% of the
time with the students out of the total time the faculty spent in the institute, 80 (46.5%)
teachers spent 41-50% of time with the students and 56 (32.6%) teachers spent more than
50% time with the students.
Table 4.11
Percentage of Time Spent With Students
Frequency Percent
Valid
Percent
Cumulative
Percent
Valid 31-40 % 36 20.9 20.9 20.9
41-50% 80 46.5 46.5 67.4
More than 50% 56 32.6 32.6 100.0
Total 172 100.0 100.0
As per AICTE New Delhi guidelines those educational trust and colleges interested in
starting MBA College has to first get approval from it. The AICTE has laid down
detailed norms for starting an MBA course. The colleges have to fulfill the infrastructure,
faculty, library etc norms. It is only after proper verification of physical and manpower
availability with the institute, AICTE gives approval to the institutes. As per the
conditions laid down by AICTE in its approval process hand book for starting new MBA
College, initially AICTE gives approval for intake of only sixty students in the first year
of MBA. An MBA Institute can only admit that number of students for which AICTE has
given approval. If the operation of the approved institute for sixty students’ intake has
been found satisfactory, AICTE may approve to increase the intake from 60 students in
first year to 120 students.
Thus from the below table it is observed that majority of the institutes in Gujarat has been
approved by AICTE with an intake capacity of sixty students to first year two years full
time MBA. Out of 172 respondents, 90 (52.3%) teachers say that they have intake
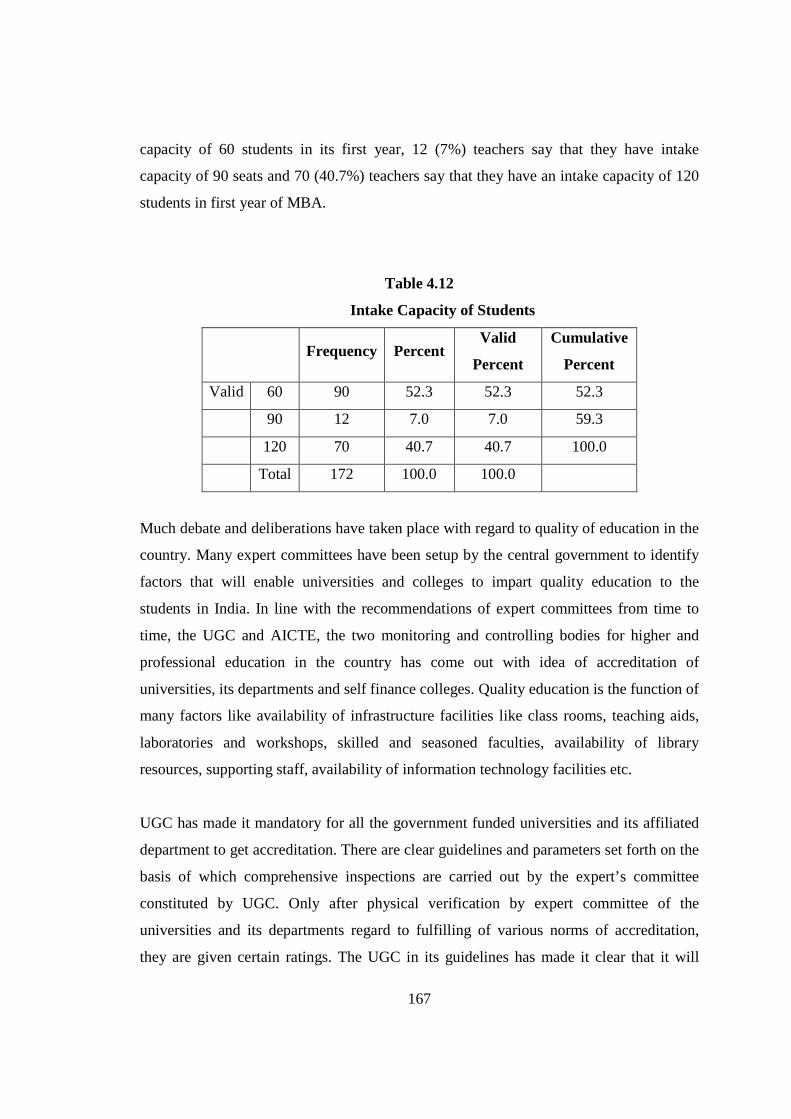
167
capacity of 60 students in its first year, 12 (7%) teachers say that they have intake
capacity of 90 seats and 70 (40.7%) teachers say that they have an intake capacity of 120
students in first year of MBA.
Table 4.12
Intake Capacity of Students
Frequency Percent
Valid
Percent
Cumulative
Percent
Valid 60 90 52.3 52.3 52.3
90 12 7.0 7.0 59.3
120 70 40.7 40.7 100.0
Total 172 100.0 100.0
Much debate and deliberations have taken place with regard to quality of education in the
country. Many expert committees have been setup by the central government to identify
factors that will enable universities and colleges to impart quality education to the
students in India. In line with the recommendations of expert committees from time to
time, the UGC and AICTE, the two monitoring and controlling bodies for higher and
professional education in the country has come out with idea of accreditation of
universities, its departments and self finance colleges. Quality education is the function of
many factors like availability of infrastructure facilities like class rooms, teaching aids,
laboratories and workshops, skilled and seasoned faculties, availability of library
resources, supporting staff, availability of information technology facilities etc.
UGC has made it mandatory for all the government funded universities and its affiliated
department to get accreditation. There are clear guidelines and parameters set forth on the
basis of which comprehensive inspections are carried out by the expert’s committee
constituted by UGC. Only after physical verification by expert committee of the
universities and its departments regard to fulfilling of various norms of accreditation,
they are given certain ratings. The UGC in its guidelines has made it clear that it will
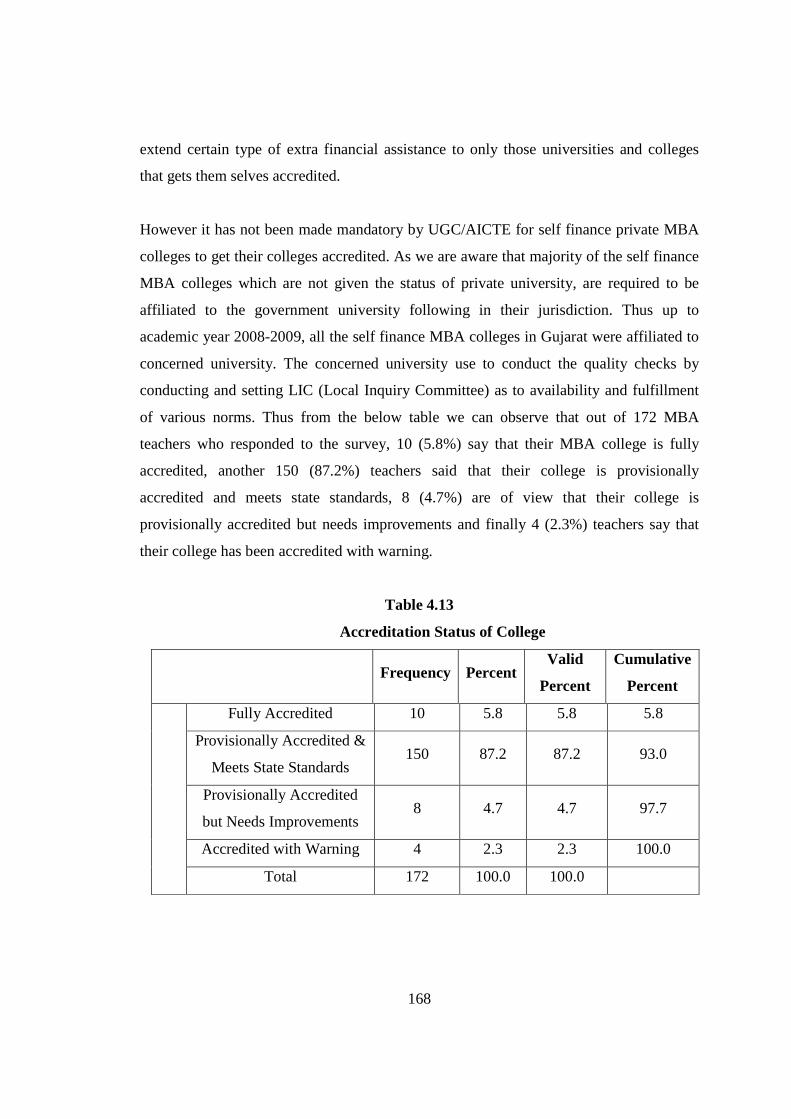
168
extend certain type of extra financial assistance to only those universities and colleges
that gets them selves accredited.
However it has not been made mandatory by UGC/AICTE for self finance private MBA
colleges to get their colleges accredited. As we are aware that majority of the self finance
MBA colleges which are not given the status of private university, are required to be
affiliated to the government university following in their jurisdiction. Thus up to
academic year 2008-2009, all the self finance MBA colleges in Gujarat were affiliated to
concerned university. The concerned university use to conduct the quality checks by
conducting and setting LIC (Local Inquiry Committee) as to availability and fulfillment
of various norms. Thus from the below table we can observe that out of 172 MBA
teachers who responded to the survey, 10 (5.8%) say that their MBA college is fully
accredited, another 150 (87.2%) teachers said that their college is provisionally
accredited and meets state standards, 8 (4.7%) are of view that their college is
provisionally accredited but needs improvements and finally 4 (2.3%) teachers say that
their college has been accredited with warning.
Table 4.13
Accreditation Status of College
Frequency Percent
Valid
Percent
Cumulative
Percent
Fully Accredited 10 5.8 5.8 5.8
Provisionally Accredited &
Meets State Standards 150 87.2 87.2 93.0
Provisionally Accredited
but Needs Improvements 8 4.7 4.7 97.7
Accredited with Warning 4 2.3 2.3 100.0
Total 172 100.0 100.0

169
4.2 Opinions regarding various dimensions of job satisfaction of post graduate
management teachers in Gujarat .
In today’s competitive environment organizations thrive and survive on their human
resources. Values, attitudes, perceptions and behavior, which form these resources,
influence employee performance. It is a key factor in realizing organizational and
individual goals that in turn greatly depends on individual’s self-motivation and job
satisfaction. ‘A happy worker is a productive worker’. The Hawthorne studies conducted
at an electrical plant in Chicago from 1924-1932 revealed that employee morale and
satisfaction increase productivity. Since then, management has pursued the topic of job
satisfaction, as it is believed to enhance performance, reduce absenteeism, retain qualified
workers and establish smooth employment relations.
Since job satisfaction is subjective to individual experience and expectation, personality
often plays an influential role. Stable personality traits could influence satisfaction or
dissatisfaction at work. Type A’ personalities tend to be more aggressive, set high
standards for themselves and therefore are more susceptible to job dissatisfaction. In
contrast, Type B’s seem to be more relaxed and, this may reflect on their attitudes
towards work. Today, there is an increasing interest in the concept of the ‘person –job-
fit’ theory. The managerial implications are that people who get themselves into the right
job that fit their attitudes and personalities seem to be more satisfied. The characteristics
of the job may also influence one’ is attitude towards it. This could include the physical
environment like lighting, temperature and space. Work, when too difficult or easy can
lead to dissatisfaction. Reward is viewed as satisfactory only when it is equitable and is in
line with expectations. A friendly and supportive group at work is conducive to job
satisfaction.
Ideally, research into teacher satisfaction is becoming more important given not only that
growing number of teachers leave the profession but also that dissatisfaction is associated
with decreased productivity. As there is no agreed upon definition of teacher job
satisfaction or of what constitutes teacher satisfaction although there might be some

170
international trends such as, the notion that teachers are most satisfied by matters intrinsic
to the role of teaching: student achievement, helping students, positive relationships with
students and others, self growth and so on as the context seemed to be most powerful
predictor of the job satisfaction. However, there can be argued that teacher satisfaction
refers to a teacher's affective relation to his or her teaching role and is a function of the
perceived relationship between what one wants from teaching and what one perceives it
is offering to a teacher from within level of aspiration in particular area as one factor
looking for job satisfaction among teachers, also strongest desires or highest aspirations
are least happy with their job if the environment does not facilitate satisfaction of their
needs. Aside, several proponents have mention certain factors that subvert teacher's
sense of empowerment and motivation as related to feelings of loss, disillusionment,
negative perceptions of self-worth from within monotony of daily routines, lack of
motivation and discipline from students' part, and lack of support and appreciation from
colleagues and administration as the latter points can lead to a negative perception of job
satisfaction expressed by these teachers.
In today’s competitive world, management of educational institutes needs to continuously
emulate practices that will attract and retain highly qualified and skilled teachers.
Dissatisfied teachers may be forced to work due to unemployment or insecurity, but this
is not in the interests of the long-term success of the academic institutes. Dissatisfaction
may be expressed in other forms like internal conflicts, poor interpersonal relations, low
trust, and stress leading to workplace conflict, violence and low productivity.
Though job satisfaction is difficult to measure and is dependent on a number of factors,
management may reduce levels of dissatisfaction and control workplace conflicts through
common objectives like career development, training, appropriate rewards and
improvements in the quality of working life.

171
Ho 1: The management teacher in Gujarat does not differ significantly in terms of
degree of job satisfaction.
Rule for Interpretation of‘t’ test result using SPSS:
The above table presents the output of t-test performed at 95% confidence level and
taking sample mean as 3 using SPSS. In a ‘t’test for a 95% confidence level, if the
significance level is greater than or equal to 0.05, it signifies that there is no significant
difference between the two variables and if the significance level is less than 0.05, then it
signifies that there is a significant difference between the selected variables. If the ‘p’
value is less than significance level set up for the test, we reject the null hypothesis.
Otherwise, we accept the null hypothesis.
Table 4.14
One-Sample Statistics and one Sample‘t’ test
S.
No
Variable N Mean Std.
Deviation
Std.
Error
Mean
‘t’
Value df
Sig.
(2-tailed)
‘p’
1 Most days I am
enthusiastic
about my work
172 4.4651 0.57629 0.04394 33.342 171 0.000
2 I feel my job is
more interesting
than others job
172 3.9767 1.05937 0.08078 12.092 171 0.000
3 I find real
enjoyment in
work
172 3.8837 1.00779 0.07684 11.500 171 0.000
4 I am happy in
my work
compared to
other people
172 4.3605 .89066 0.06791 20.033 171 0.000
5 Job is interesting 172 3.9767 1.05937 0.08078 12.092 171 0.000

172
and does not
bore me
6 I feel fairly well
satisfied with
my present job
172 4.0756 0.96735 0.07376 14.582 171 .000
7 I am satisfied
with my job for
the time being
172 4.2791 0.71166 0.05426 23.571 171 0.000
8 I like my job
better than the
average worker
does
172 4.3605 0.80804 0.06161 22.081 171 0.000
9 My job is like
hobby to me 172 4.3605 0.80804 0.06161 22.081 171 0.000
10 It seems that my
friends are more
interested in
their job
172 3.9942 0.95205 0.07259 13.695 171 0.000
11 My job has a fair
promotion
policy
172 4.1047 0.93069 0.07096 15.566 171 0.000
12 I enjoy my work
more than my
leisure time
172 4.1047 0.93069 0.07096 15.566 171 0.000
13 Most of the time
I have to force
myself to go to
work.
172 4.2093 0.83233 0.06346 19.055 171 0.000
14 I consider my
job rather
unpleasant
172 4.2093 0.83233 0.06346 19.055 171 0.000
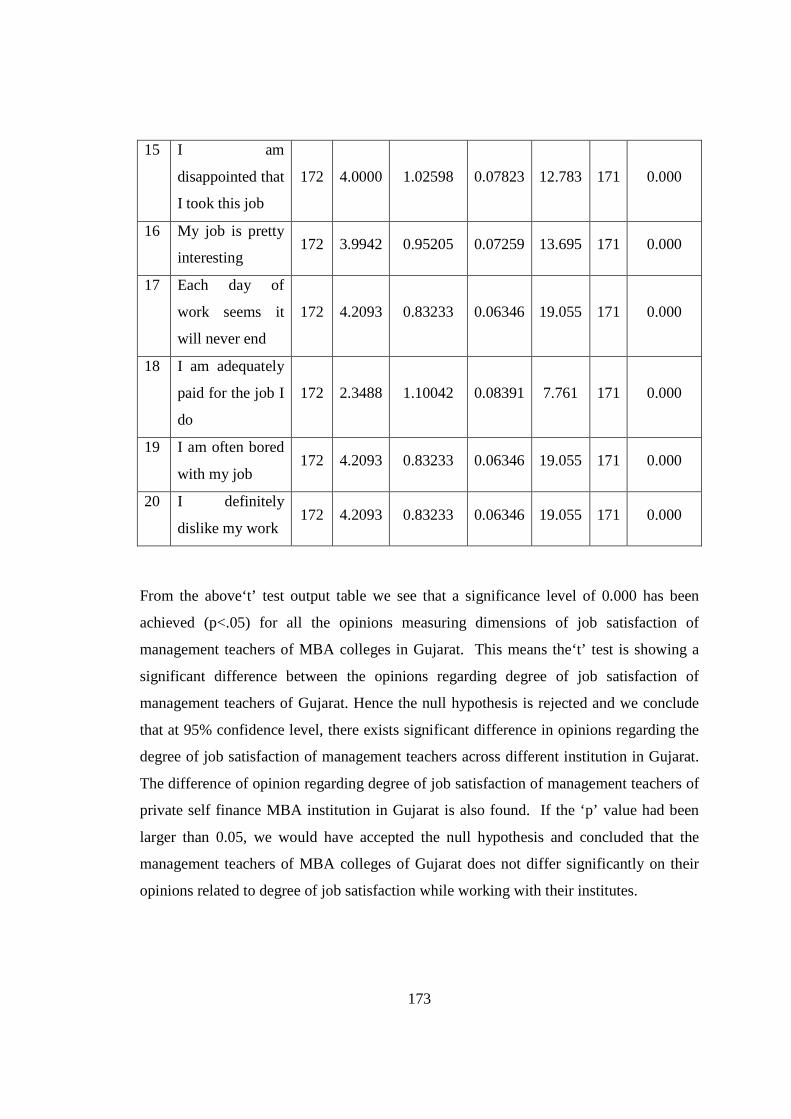
173
15 I am
disappointed that
I took this job
172 4.0000 1.02598 0.07823 12.783 171 0.000
16 My job is pretty
interesting 172 3.9942 0.95205 0.07259 13.695 171 0.000
17 Each day of
work seems it
will never end
172 4.2093 0.83233 0.06346 19.055 171 0.000
18 I am adequately
paid for the job I
do
172 2.3488 1.10042 0.08391 7.761 171 0.000
19 I am often bored
with my job 172 4.2093 0.83233 0.06346 19.055 171 0.000
20 I definitely
dislike my work 172 4.2093 0.83233 0.06346 19.055 171 0.000
From the above‘t’ test output table we see that a significance level of 0.000 has been
achieved (p<.05) for all the opinions measuring dimensions of job satisfaction of
management teachers of MBA colleges in Gujarat. This means the‘t’ test is showing a
significant difference between the opinions regarding degree of job satisfaction of
management teachers of Gujarat. Hence the null hypothesis is rejected and we conclude
that at 95% confidence level, there exists significant difference in opinions regarding the
degree of job satisfaction of management teachers across different institution in Gujarat.
The difference of opinion regarding degree of job satisfaction of management teachers of
private self finance MBA institution in Gujarat is also found. If the ‘p’ value had been
larger than 0.05, we would have accepted the null hypothesis and concluded that the
management teachers of MBA colleges of Gujarat does not differ significantly on their
opinions related to degree of job satisfaction while working with their institutes.
174
4.3 Job Satisfaction and Salary Drawn.
According to Salary.com, there is a relationship between job satisfaction and salary. The
website explains that the higher the salary of an individual the more satisfied they are
likely to be. However, other factors, such as ranking within an organization and an
employee's age, have also been found to influence job satisfaction. Salary.com also
explained that employers often underestimate the percentage of their employees who are
passively or actively looking for a new job. They also overestimate the number of their
employees who are satisfied with their jobs. The 2008/2009 Employee Satisfaction and
Retention Survey determined that employers estimated that 77 percent of their employees
were satisfied. However, only 65% of the employees were actually satisfied. Inadequate
compensation is one of the top reasons that employees leave a job. Other prominent
reasons individuals leave their job are because of insufficient recognition and inadequate
development opportunities.

175
Ho 2: There is no systematic association between salary drawn by management teacher
in Gujarat and their degree of job satisfaction.
The below table shows the degree of job satisfaction and the salary received by a
management teachers in Gujarat. There are 64 teachers who draw salary in the range of
Rs. 10,000 to 20,000. Amongst these teachers, 12 teachers strongly disagreed on the
statement that they are adequately paid. Another 34 teachers disagreed and only 18
teachers felt that they are adequately paid for the job they do. 60 teachers draw salary in
the range of Rs. 20,000 to 30,000 per month. Out of these 64 teachers 12 of them strongly
disagreed, 30 disagreed and 18 said they are adequately paid. Out of 48 teachers whose
salary is more than 40,000, 12 strongly disagreed, 24 disagreed and 12 management
teachers agreed and felt that they are adequately paid for the job that they are doing.
Table 14.15
I am adequately paid for the job I do * Salary Drawn Cross tabulation
Salary Drawn (Rupees) per month
Total 10,000-
20,000
20,000-
30,000
More than
40,000
I am adequately
paid for the job I
do
Strongly
Disagree 12 12 12 36
Disagree 34 30 24 88
Agree 18 18 12 48
Total 64 60 48 172
Rule for Interpreting Chi-Square Result:
In a Chi-Square test, for a 95% confidence level, if the significance level is greater than
or equal to 0.05, it signifies that there is no systematic association between the two
variables in the cross-tabulation and if the significance level is less than 0.05, then it
signifies that there is a systematic association between the selected two variables.
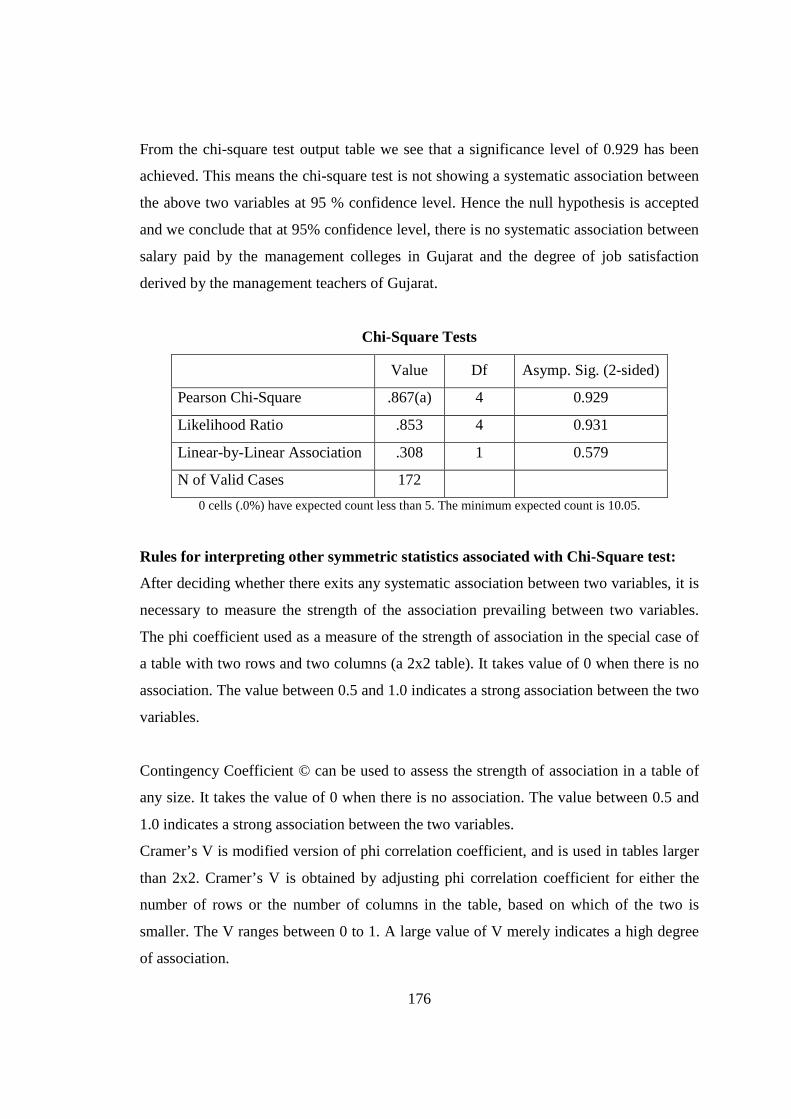
176
From the chi-square test output table we see that a significance level of 0.929 has been
achieved. This means the chi-square test is not showing a systematic association between
the above two variables at 95 % confidence level. Hence the null hypothesis is accepted
and we conclude that at 95% confidence level, there is no systematic association between
salary paid by the management colleges in Gujarat and the degree of job satisfaction
derived by the management teachers of Gujarat.
Chi-Square Tests
Value Df Asymp. Sig. (2-sided)
Pearson Chi-Square .867(a) 4 0.929
Likelihood Ratio .853 4 0.931
Linear-by-Linear Association .308 1 0.579
N of Valid Cases 172
0 cells (.0%) have expected count less than 5. The minimum expected count is 10.05.
Rules for interpreting other symmetric statistics associated with Chi-Square test:
After deciding whether there exits any systematic association between two variables, it is
necessary to measure the strength of the association prevailing between two variables.
The phi coefficient used as a measure of the strength of association in the special case of
a table with two rows and two columns (a 2x2 table). It takes value of 0 when there is no
association. The value between 0.5 and 1.0 indicates a strong association between the two
variables.
Contingency Coefficient © can be used to assess the strength of association in a table of
any size. It takes the value of 0 when there is no association. The value between 0.5 and
1.0 indicates a strong association between the two variables.
Cramer’s V is modified version of phi correlation coefficient, and is used in tables larger
than 2x2. Cramer’s V is obtained by adjusting phi correlation coefficient for either the
number of rows or the number of columns in the table, based on which of the two is
smaller. The V ranges between 0 to 1. A large value of V merely indicates a high degree
of association.

177
From the obtained value of directional measure, phi correlation coefficient (3X5 table),
Cramer’s V and Contingency Coefficient, it can be inferred that there is weak association
between the dependent and independent variable, as the value of 0.057 (directional
measure), 0.071 (phi correlation coefficient), 0.050 (Cramer’s V) and 0.071
(contingency coefficient) are closer to 0 than 1. This leads us to conclude that the degree
of job satisfaction to management teachers of Gujarat is independent irrespective of
amount of salary that they draw from their institute.
Directional Measures
Value
Nominal by
Interval
Eta I am adequately paid for the job I do
Dependent 0.057
Salary Drawn Dependent .060
Symmetric Measures
Value Approx. Sig.
Nominal by
Nominal
Phi .071 0.929
Cramer's V .050 .929
Contingency Coefficient .071 .929
N of Valid Cases 172
A Not assuming the null hypothesis.
B Using the asymptotic standard error assuming the null hypothesis.

178
4.4 Degree of job satisfaction and experience of management teachers.
Job satisfaction is the state of contentment in both the mind and feelings of an individual
regarding their current work. Job satisfaction can have an impact on various factors such
as the relationship of the employee to his/her colleagues and supervisor, the quality of the
environment in which the employee is currently working, the level of fulfilment with the
job, or even the relationship of the individual to its family members can influence the
satisfaction in the workplace.
Here the researcher is trying to study whether any association exits between total years of
experience as management teacher in MBA institute and the degree of job satisfaction. In
other words the researcher felt that experience teachers are more satisfied as compared to
MBA teachers with lesser job experience.

179
Ho 3: There is no systematic association between total years of experience of
management teacher in Gujarat and their degree of job satisfaction.
From the cross table below out of 172 management teachers of Gujarat, 5 teachers with
work experience ranging between 11-15 years and more say that most of the time they
have to force themselves to go to work. This situation expresses the degree of job
dissatisfaction. Another 5 teachers with work experience of 15 years and above also feels
that they are not happy with their current institute. More over 163 management teachers
with work experience ranging from 1-15 years and 1-7 years have disagreed or strongly
disagreed on the statement that most of the time they have to go for work forcefully.
Meaning teachers having work experience ranging from 1-7 years tend to be more
satisfied. Small numbers of teachers with work experience of 10 or more years are found
to be unhappy with their job.
Table 14.16
Most of the time I have to force myself to go to work * Experience Cross tab
Degree of Job Satisfaction
Experience
Total
1-3
years
4-7
years
8-10
years
11-15
years
15
years &
above
Most of the
time I have to
force myself
to go to work
Strongly
Agree 0 0 0 3 2 5
Agree 0 0 0 0 5 5
Disagree 61 31 5 4 0 101
Strongly
Disagree 41 20 0 0 0 61
Total 102 51 5 7 7 172
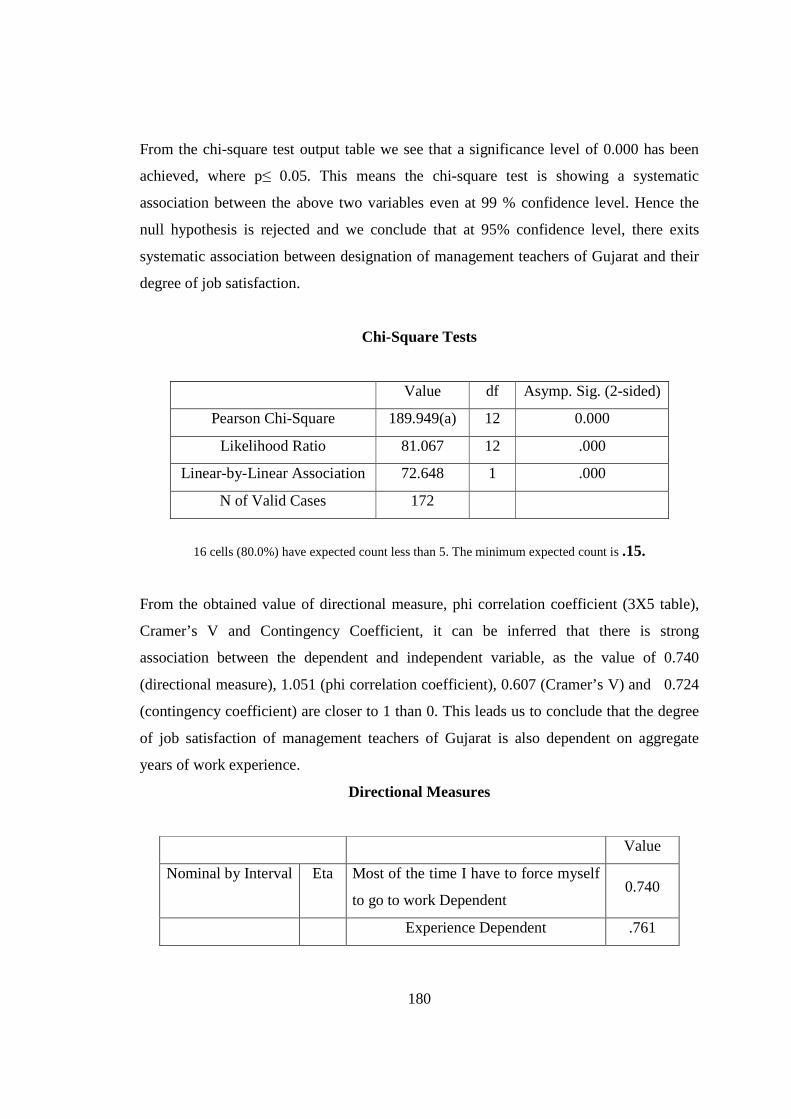
180
From the chi-square test output table we see that a significance level of 0.000 has been
achieved, where p≤ 0.05. This means the chi-square test is showing a systematic
association between the above two variables even at 99 % confidence level. Hence the
null hypothesis is rejected and we conclude that at 95% confidence level, there exits
systematic association between designation of management teachers of Gujarat and their
degree of job satisfaction.
Chi-Square Tests
Value df Asymp. Sig. (2-sided)
Pearson Chi-Square 189.949(a) 12 0.000
Likelihood Ratio 81.067 12 .000
Linear-by-Linear Association 72.648 1 .000
N of Valid Cases 172
16 cells (80.0%) have expected count less than 5. The minimum expected count is .15.
From the obtained value of directional measure, phi correlation coefficient (3X5 table),
Cramer’s V and Contingency Coefficient, it can be inferred that there is strong
association between the dependent and independent variable, as the value of 0.740
(directional measure), 1.051 (phi correlation coefficient), 0.607 (Cramer’s V) and 0.724
(contingency coefficient) are closer to 1 than 0. This leads us to conclude that the degree
of job satisfaction of management teachers of Gujarat is also dependent on aggregate
years of work experience.
Directional Measures
Value
Nominal by Interval Eta Most of the time I have to force myself
to go to work Dependent 0.740
Experience Dependent .761
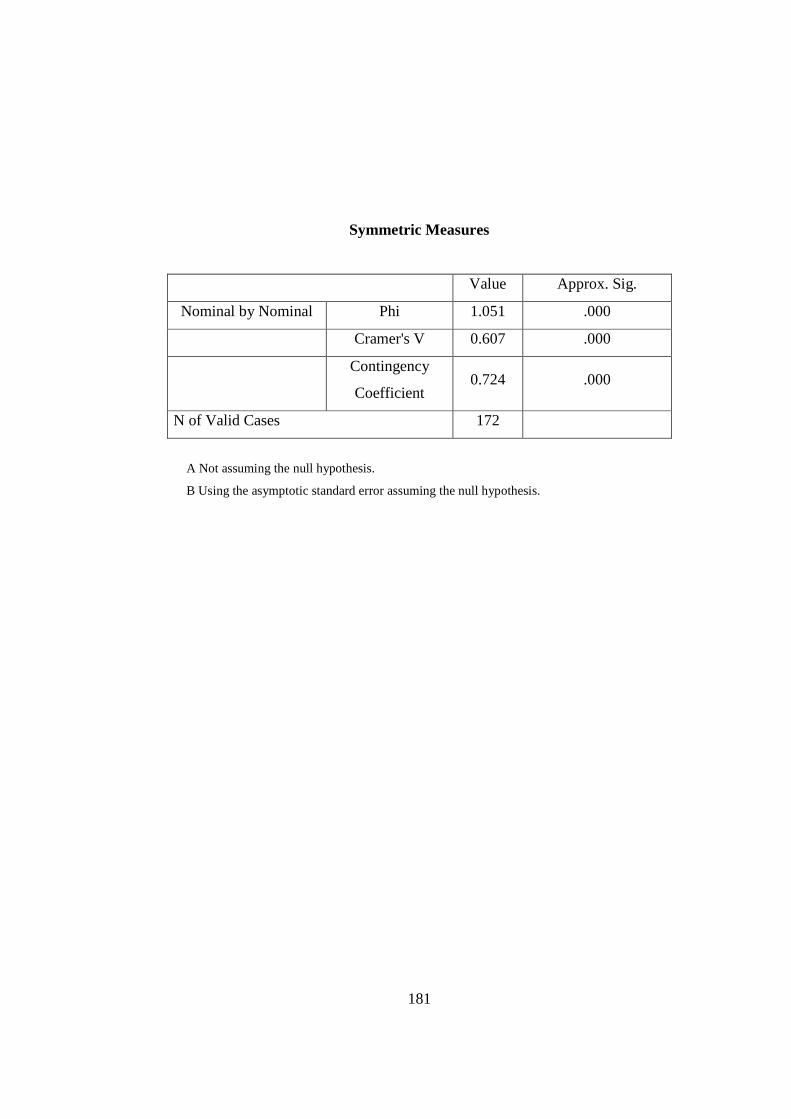
181
Symmetric Measures
Value Approx. Sig.
Nominal by Nominal Phi 1.051 .000
Cramer's V 0.607 .000
Contingency
Coefficient 0.724 .000
N of Valid Cases 172
A Not assuming the null hypothesis.
B Using the asymptotic standard error assuming the null hypothesis.

182
4.5 Degree of job satisfaction and designation of management teachers of Gujarat.
Here the researcher wants to find out whether any association exits between designation
of management teachers and degree of job satisfaction. In other words are junior teachers
more satisfied as compared to senior teachers or vice-versa.
Ho: There is no systematic association between designation of management teacher
of Gujarat and their degree of job satisfaction.
From the below table it becomes visible that out of 108 lecturers, 69 and 39 of them
respectively have disagreed and strongly disagreed on the statement related to disliking of
their job as management teachers. Similarly out of 45 Assistant Professors 26 and 19 of
them has disagreed and strongly disagreed as to liking of their job. However some
deviation in responses has been observed in senior positions of management teachers.
Out of 7 Professors and out of 12 Principal/Director, 10 of these senior people seem to
have low degree of job satisfaction.
Table 14.17
Designation of Teacher * I definitely dislike my work Cross tab
Designation of
Teacher
I definitely dislike my work Total
Strongl
y Agree
Agree Disagree Strongly
Disagree
Lecturer 0 0 69 39 108
Assistant
Professor 0 0 26 19 45
Professor 2 0 4 1 7
Principal/Dean/
Director 3 5 2 2 12
Total 5 5 101 61 172

183
From the chi-square test output table we see that a significance level of 0.000 has been
achieved, where p≤ 0.05. This means the chi-square test is showing a systematic
association between the above two variables even at 99 % confidence level. Hence the
null hypothesis is rejected and we conclude that at 95% confidence level, there is
systematic association between aggregate work experience of management teachers of
Gujarat and the degree of job satisfaction.
Chi-Square Tests
Value df Asymp. Sig. (2-sided)
Pearson Chi-Square 113.912(a) 9 0.000
Likelihood Ratio 57.416 9 .000
Linear-by-Linear Association 48.193 1 .000
N of Valid Cases 172
A 11 cells (68.8%) have expected count less than 5. The minimum expected count is .20.
From the obtained value of directional measure, phi correlation coefficient (3X5 table),
Cramer’s V and Contingency Coefficient, it can be inferred that there is strong
association between the dependent and independent variable, as the value of 0.695
(directional measure), 0.814 (phi correlation coefficient), 0.470 (Cramer’s V) and 0.631
(contingency coefficient) are closer to 0 than 1. This leads us to conclude that the degree
of job satisfaction of management teachers of Gujarat is strongly to moderately associate
with the designation.
Directional Measures
Value
Nominal by Interval Eta Designation of Teacher Dependent 0.695
I definitely dislike my work Dependent .597
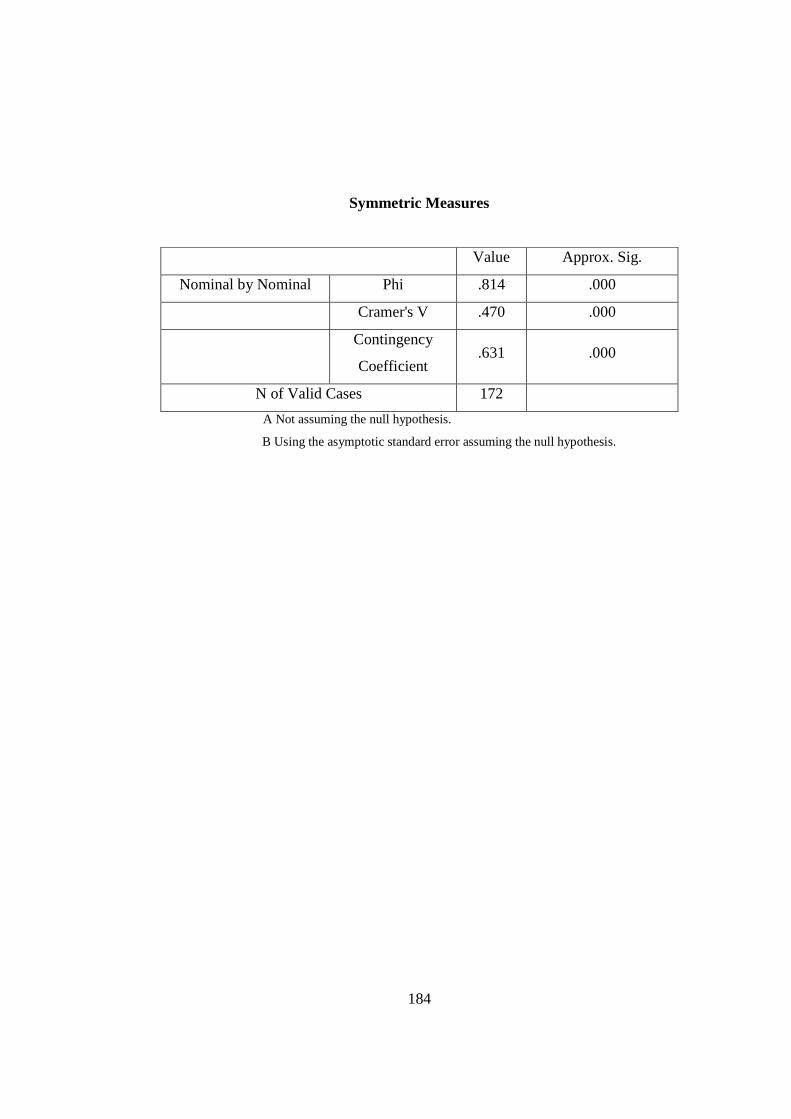
184
Symmetric Measures
Value Approx. Sig.
Nominal by Nominal Phi .814 .000
Cramer's V .470 .000
Contingency
Coefficient .631 .000
N of Valid Cases 172
A Not assuming the null hypothesis.
B Using the asymptotic standard error assuming the null hypothesis.

185
4.6 Degree of job satisfaction and age of management teachers of Gujarat.
Numerous studies in India and abroad shows that employee satisfaction at work is
decreasing significantly since past twenty years and researchers and social scientist
predict that employee satisfaction will get worse in the next few coming years. A
combination of events is creating a perfect storm affecting employee satisfaction. A
generation of employees who feel entitled to employee satisfaction has entered the
workforce and several generations of employees for whom work never quite fulfilled
their dreams, are leaving. And, they are leaving in the worst of economic times which
will affect their satisfaction with the rest of the quality of life they experience. This
downward trend in job satisfaction raises concerns about the overall engagement of
employees and ultimately employee productivity, retention, creativity, risk-taking,
mentoring, and in overall employee motivation and interest in work.
Through this hypothesis the researcher is trying to find out whether age affects the degree
of job satisfaction of employees in general and management teachers in particular.
Ho: There is systematic association between age of management teacher of Gujarat
and degree of job satisfaction.
From the table below it can be inferred that only one teacher in the age group of 46 years
and above has expressed opinion as strongly disagree as to satisfaction on present job.
However 22 teachers across age group ranging from 31-35 years, 41-45 years and above
46 years have disagreed on the above statement. Two teachers could not express their
state of job satisfaction. More over 147 teachers across various age group feels that they
are satisfies with their present job and thus ranked either agree or strongly agree in terms
of their degree of job satisfaction.
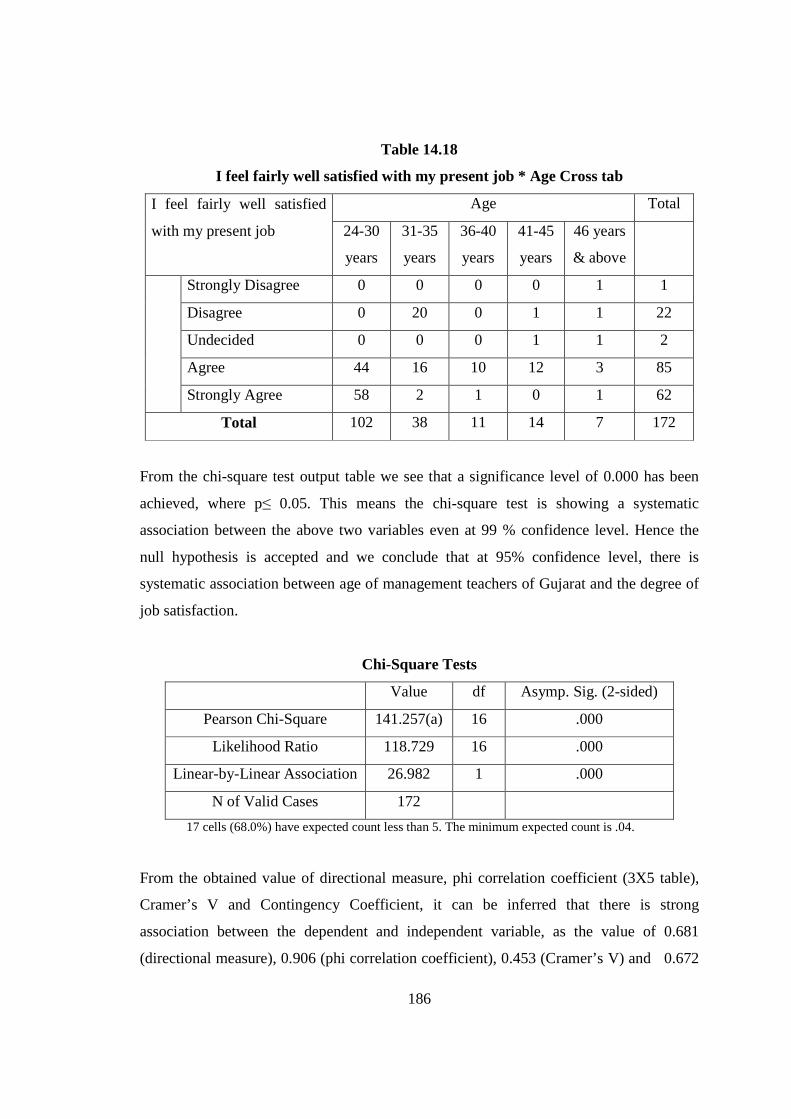
186
Table 14.18
I feel fairly well satisfied with my present job * Age Cross tab
I feel fairly well satisfied
with my present job
Age Total
24-30
years
31-35
years
36-40
years
41-45
years
46 years
& above
Strongly Disagree 0 0 0 0 1 1
Disagree 0 20 0 1 1 22
Undecided 0 0 0 1 1 2
Agree 44 16 10 12 3 85
Strongly Agree 58 2 1 0 1 62
Total 102 38 11 14 7 172
From the chi-square test output table we see that a significance level of 0.000 has been
achieved, where p≤ 0.05. This means the chi-square test is showing a systematic
association between the above two variables even at 99 % confidence level. Hence the
null hypothesis is accepted and we conclude that at 95% confidence level, there is
systematic association between age of management teachers of Gujarat and the degree of
job satisfaction.
Chi-Square Tests
Value df Asymp. Sig. (2-sided)
Pearson Chi-Square 141.257(a) 16 .000
Likelihood Ratio 118.729 16 .000
Linear-by-Linear Association 26.982 1 .000
N of Valid Cases 172
17 cells (68.0%) have expected count less than 5. The minimum expected count is .04.
From the obtained value of directional measure, phi correlation coefficient (3X5 table),
Cramer’s V and Contingency Coefficient, it can be inferred that there is strong
association between the dependent and independent variable, as the value of 0.681
(directional measure), 0.906 (phi correlation coefficient), 0.453 (Cramer’s V) and 0.672

187
(contingency coefficient) are closer to 0 than 1. This leads us to conclude that the degree
of job satisfaction of management teachers of Gujarat is strongly associated with the age
of teachers.
Directional Measures
Value
Nominal by Interval Eta I feel fairly well satisfied with
my present job Dependent 0.681
Age Dependent .518
Symmetric Measures
Value Approx. Sig.
Nominal by Nominal Phi .906 .000
Cramer's V .453 .000
Contingency
Coefficient .672 .000
N of Valid Cases 172
A Not assuming the null hypothesis.
B Using the asymptotic standard error assuming the null hypothesis.

188
4.7 Degree of job satisfaction of management teachers and length of service with
their current college.
Through this hypothesis the researcher wants to find that whether satisfied teachers work
with the same college for long years or any other reason can be cited.
Ho: There is no systematic association between length of service of management
teachers of Gujarat with their current college and degree of job satisfaction.
From the table below it can be inferred that 23 management teachers strongly disagree
and disagree on the above statement. This shows these teachers are dissatisfied with their
current job. Two teachers are not sure of their situation. More over 147 management
teachers has expressed their opinion positively in terms of their degree of job satisfaction.
85 teachers have agreed and 62 teachers have strongly agreed on the statement of job
satisfaction.
Table 14.19
I feel fairly well satisfied with my present job * No. of years of work with current
institute cross tab
Number of Years of Work
With Current Institute
Total
1-4
years
5-10
years
11-15
years
I feel fairly well
satisfied with my
present job
Strongly
Disagree 1 0 0 1
Disagree 12 10 0 22
Undecided 1 1 0 2
Agree 59 26 0 85
Strongly Agree 49 11 2 62
Total 122 48 2 172
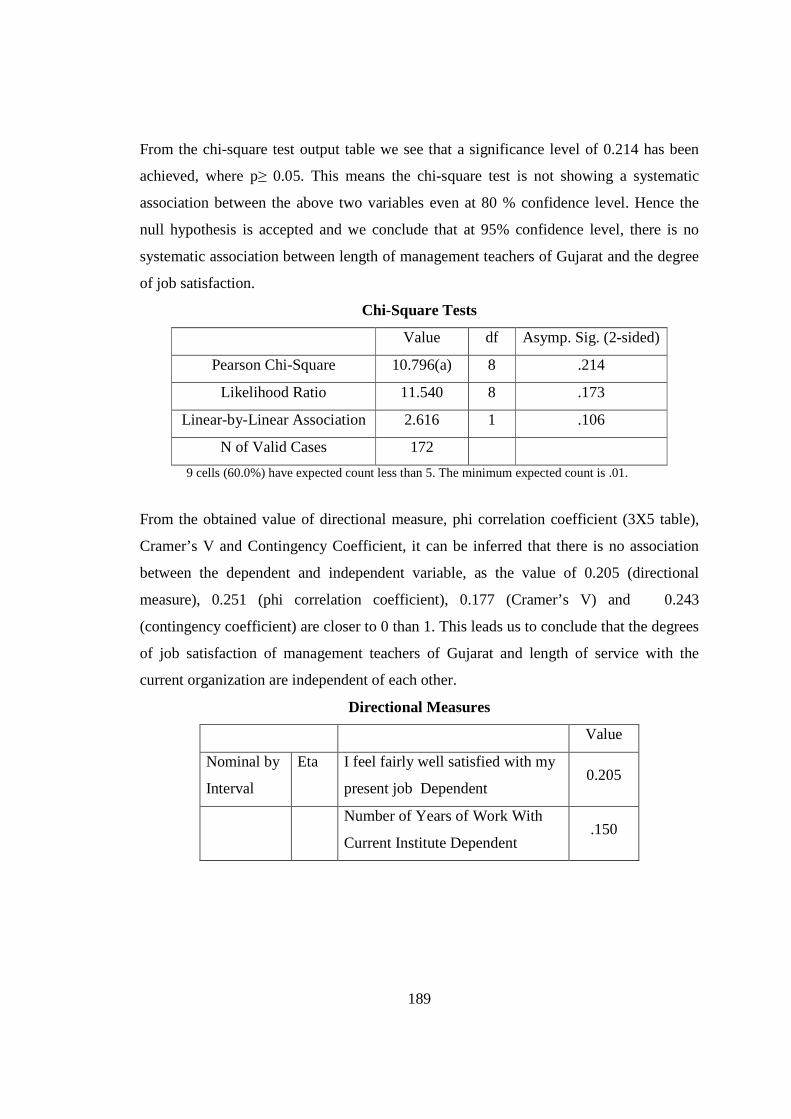
189
From the chi-square test output table we see that a significance level of 0.214 has been
achieved, where p≥ 0.05. This means the chi-square test is not showing a systematic
association between the above two variables even at 80 % confidence level. Hence the
null hypothesis is accepted and we conclude that at 95% confidence level, there is no
systematic association between length of management teachers of Gujarat and the degree
of job satisfaction.
Chi-Square Tests
Value df Asymp. Sig. (2-sided)
Pearson Chi-Square 10.796(a) 8 .214
Likelihood Ratio 11.540 8 .173
Linear-by-Linear Association 2.616 1 .106
N of Valid Cases 172
9 cells (60.0%) have expected count less than 5. The minimum expected count is .01.
From the obtained value of directional measure, phi correlation coefficient (3X5 table),
Cramer’s V and Contingency Coefficient, it can be inferred that there is no association
between the dependent and independent variable, as the value of 0.205 (directional
measure), 0.251 (phi correlation coefficient), 0.177 (Cramer’s V) and 0.243
(contingency coefficient) are closer to 0 than 1. This leads us to conclude that the degrees
of job satisfaction of management teachers of Gujarat and length of service with the
current organization are independent of each other.
Directional Measures
Value
Nominal by
Interval
Eta I feel fairly well satisfied with my
present job Dependent 0.205
Number of Years of Work With
Current Institute Dependent .150

190
Symmetric Measures
Value Approx. Sig.
Nominal by
Nominal
Phi .251 0.214
Cramer's V .177 .214
Contingency Coefficient .243 .214
N of Valid Cases 172
A Not assuming the null hypothesis.
B Using the asymptotic standard error assuming the null hypothesis.
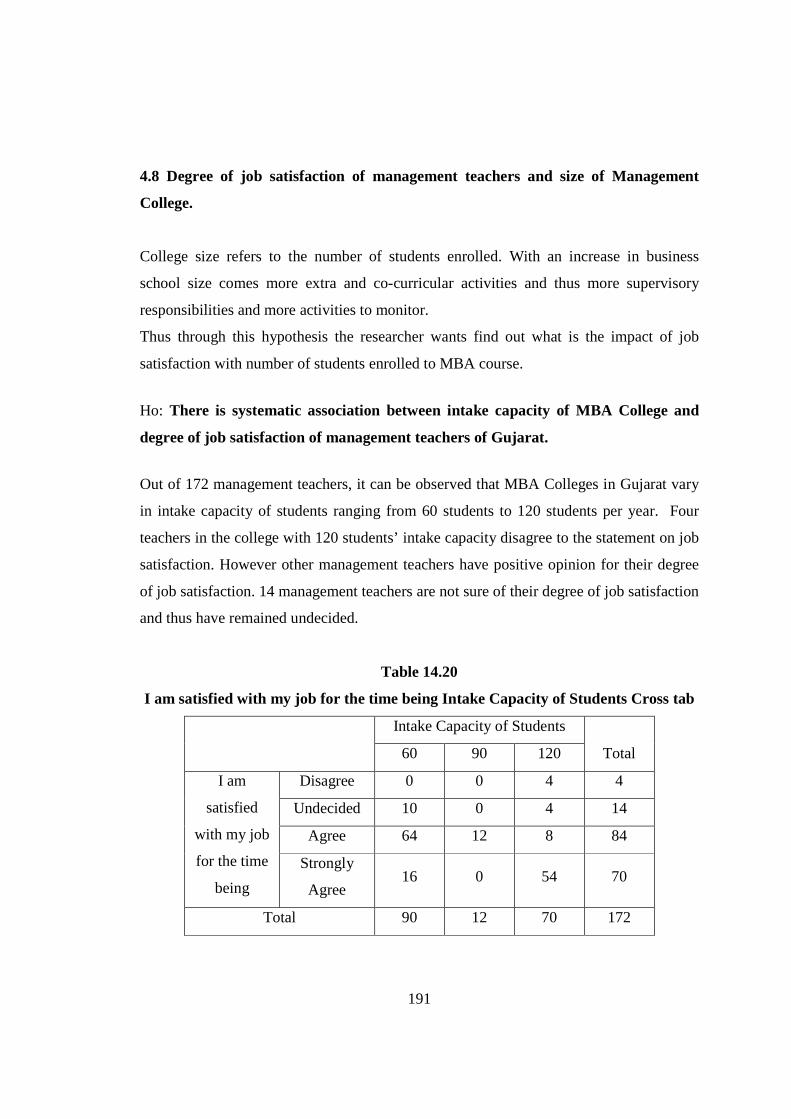
191
4.8 Degree of job satisfaction of management teachers and size of Management
College.
College size refers to the number of students enrolled. With an increase in business
school size comes more extra and co-curricular activities and thus more supervisory
responsibilities and more activities to monitor.
Thus through this hypothesis the researcher wants find out what is the impact of job
satisfaction with number of students enrolled to MBA course.
Ho: There is systematic association between intake capacity of MBA College and
degree of job satisfaction of management teachers of Gujarat.
Out of 172 management teachers, it can be observed that MBA Colleges in Gujarat vary
in intake capacity of students ranging from 60 students to 120 students per year. Four
teachers in the college with 120 students’ intake capacity disagree to the statement on job
satisfaction. However other management teachers have positive opinion for their degree
of job satisfaction. 14 management teachers are not sure of their degree of job satisfaction
and thus have remained undecided.
Table 14.20
I am satisfied with my job for the time being Intake Capacity of Students Cross tab
Intake Capacity of Students
Total 60 90 120
I am
satisfied
with my job
for the time
being
Disagree 0 0 4 4
Undecided 10 0 4 14
Agree 64 12 8 84
Strongly
Agree 16 0 54 70
Total 90 12 70 172

192
From the chi-square test output table we see that a significance level of 0.000 has been
achieved, where p≤ 0.05. This means the chi-square test is showing a systematic
association between the above two variables even at 99 % confidence level. Hence the
null hypothesis is rejected and we conclude that at 95% confidence level, there is
systematic association between intake capacity of students and the degree of job
satisfaction.
Chi-Square Tests
Value df Asymp. Sig. (2-sided)
Pearson Chi-Square 83.267(a) 6 0.000
Likelihood Ratio 95.206 6 .000
Linear-by-Linear Association 21.652 1 .000
N of Valid Cases 172
5 cells (41.7%) have expected count less than 5. The minimum expected count is .28.
From the obtained value of directional measure, phi correlation coefficient (3X5 table),
Cramer’s V and Contingency Coefficient, it can be inferred that there is strong
association between the dependent and independent variable, as the value of 0.375
(directional measure), 0.696 (phi correlation coefficient), 0.492 (Cramer’s V) and 0.571
(contingency coefficient) are closer to 1 than 0. This leads us to conclude that the degrees
of job satisfaction of management teachers of Gujarat and intake capacity of students
have strong association.
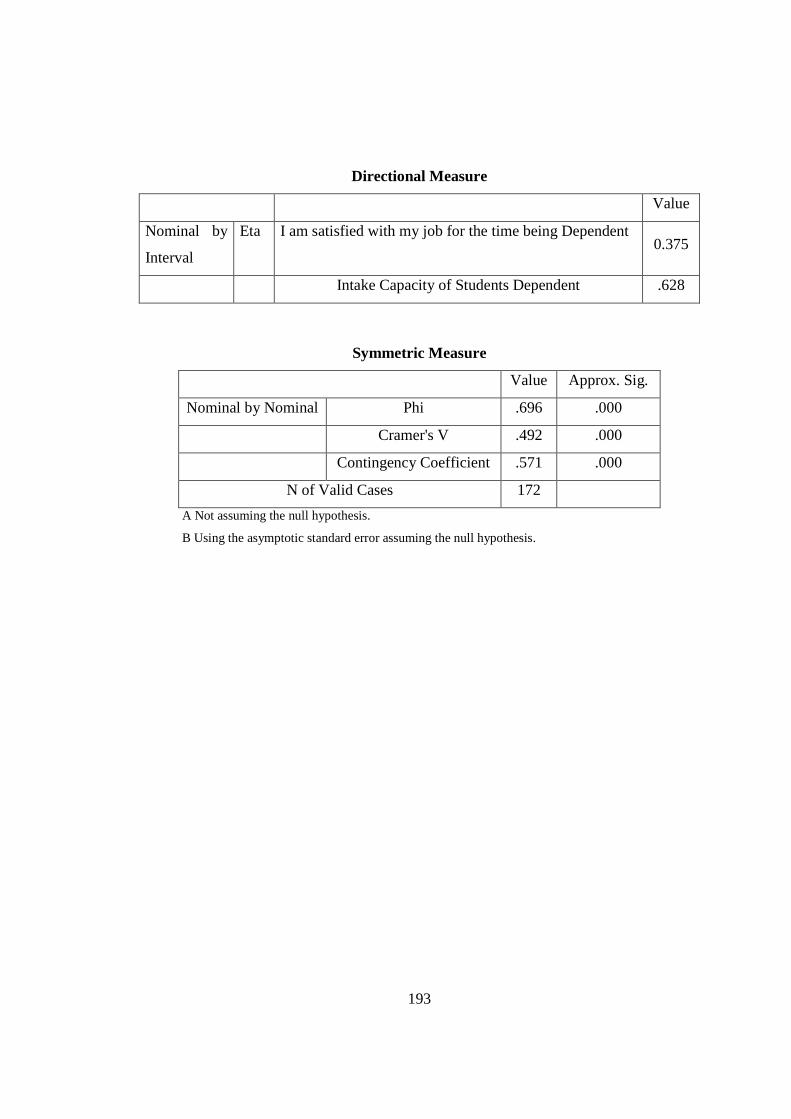
193
Directional Measure
Value
Nominal by
Interval
Eta I am satisfied with my job for the time being Dependent 0.375
Intake Capacity of Students Dependent .628
Symmetric Measure
Value Approx. Sig.
Nominal by Nominal Phi .696 .000
Cramer's V .492 .000
Contingency Coefficient .571 .000
N of Valid Cases 172
A Not assuming the null hypothesis.
B Using the asymptotic standard error assuming the null hypothesis.

194
4.9 Degree of job satisfaction measured through various job satisfaction parameters.
The concept of job satisfaction traditionally has been of great interest to social scientists
concerned with the problems of work in an industrial society. A number of consequences
have been shown to result from job satisfaction/dissatisfaction. Despite the large number
of studies that have dealt with these issues, however, there has been little cumulation of
knowledge. Much of this difficulty stems from problems in comparing studies and
estimating trends due to difference in measurement of job satisfaction, sampled
populations and time periods. Of these, differences in measurement techniques are
especially problematic since a multitude of indicators have been developed and it is
questionable whether they all measure the same thing.
Ho: The management teachers of Gujarat do not significantly differ on various
degree of job satisfaction.
Table 14.21
One-Sample Statistics and t test
S.
No
Variable N Mean Std.
Deviation
Std.
Error
Mean
‘t’
Value df
Sig.
(2-tailed)
‘p’
1 The chance to
be of service of
others
172 3.4419 1.18079 .09003 4.908 171 .000
2 The variety in
my work 172 3.4419 1.18079 .09003 4.908 171 .000
3 The way my
supervisor and I
understand each
other
172 3.4419 1.18079 .09003 4.908 171 .000
4 The technical
know how of 172 2.5581 1.39006 .10599 -4.169 171 .000

195
my supervisor
5 The chance to
be active much
of the time
172 3.4419 1.18079 .09003 4.908 171 .000
6 The chance to
do different
things from
time to time
172 3.4419 1.18079 .09003 4.908 171 .000
7 The way my
boss handles
his/her
employees
172 3.4419 1.18079 .09003 4.908 171 .000
8 The chance to
develop close
friendship with
my co-workers
172 3.4419 1.18079 .09003 4.908 171 .000
9 Being able to do
things that don't
go against my
conscience
172 3.4419 1.18079 .09003 4.908 171 .000
10 The way my
boss backs up
his/her
employees
w/top
management
172 3.4419 1.18079 .09003 4.908 171 .000
11 The way my
boss delegates
work to others.
172 3.4419 1.18079 .09003 4.908 171 .000
12 Being able to
stay busy 172 3.4419 1.18079 .09003 4.908 171 .000
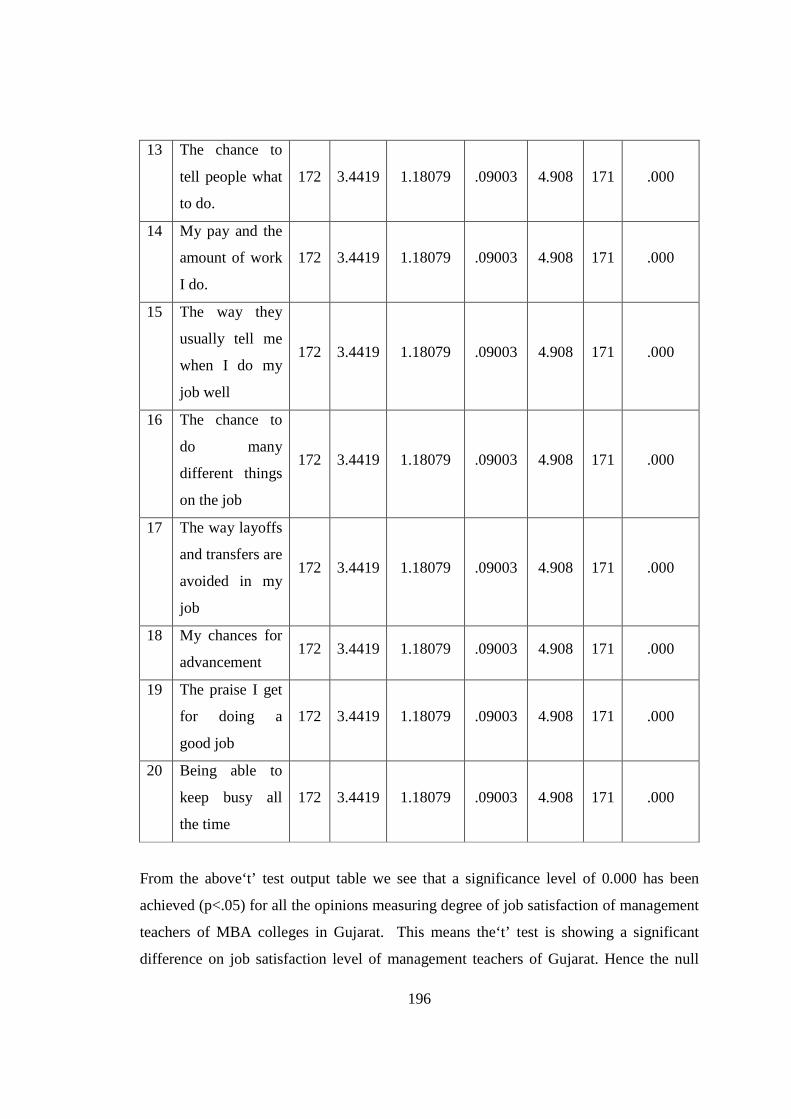
196
13 The chance to
tell people what
to do.
172 3.4419 1.18079 .09003 4.908 171 .000
14 My pay and the
amount of work
I do.
172 3.4419 1.18079 .09003 4.908 171 .000
15 The way they
usually tell me
when I do my
job well
172 3.4419 1.18079 .09003 4.908 171 .000
16 The chance to
do many
different things
on the job
172 3.4419 1.18079 .09003 4.908 171 .000
17 The way layoffs
and transfers are
avoided in my
job
172 3.4419 1.18079 .09003 4.908 171 .000
18 My chances for
advancement 172 3.4419 1.18079 .09003 4.908 171 .000
19 The praise I get
for doing a
good job
172 3.4419 1.18079 .09003 4.908 171 .000
20 Being able to
keep busy all
the time
172 3.4419 1.18079 .09003 4.908 171 .000
From the above‘t’ test output table we see that a significance level of 0.000 has been
achieved (p<.05) for all the opinions measuring degree of job satisfaction of management
teachers of MBA colleges in Gujarat. This means the‘t’ test is showing a significant
difference on job satisfaction level of management teachers of Gujarat. Hence the null
197
hypothesis is rejected and we conclude that at 95% confidence level, there exists
significant difference in job satisfaction level of management teachers across different
institution in Gujarat. If the ‘p’ value had been larger than 0.05, we would have accepted
the null hypothesis and concluded that the management teachers of MBA colleges of
Gujarat does not differ significantly on degree of job satisfaction.

198
CHAPTER-5
ANALYSIS AND INTERPRETATION OF DEGREE OF JOB
SATISFACTION OF MANAGEMENT TEACHERS WORKING IN
MBA COLLEGES OF GUJARAT STATE - II
Sr.
No. Particular
Page
No.
5.1 Pay and Amount of Work done by MBA teachers 199
5.2 Tenure of employment with current college and chances for
advancement 202
5.3 Age of Teachers and Sense of Nobility 205
5.4 Variety in Work and Making Job Interesting 208
5.5 Age and Liking of Academic Work 211
5.6 Age and Disappointment with the Job 214
5.7 Salary Drawn and Disliking for the Work 217

199
5.1 Pay and Amount of Work done by MBA teachers.
Here the researcher wants to check the degree of job satisfaction of management teachers
of Gujarat in accordance with the expectations in terms of pay that they receive and the
work they do. In other words the researcher wants to know whether there exits any form
of association between the amount of work they perform and amount of pay they receive.
Ho: There is no systematic association between satisfaction level of management
teachers of Gujarat in terms of amount of work they do and the pay they receive.
From the below table it can be inferred that 16 teachers in different salary range are not
satisfied, another 16 teachers are on slightly satisfied, 50 teachers say that they are
satisfied with their current pay and work they do. Finally 56 and 34 teachers respectively
are very satisfied and extremely satisfied with their work and the pay.
Table 5.1
My pay and the amount of work I do. * Salary Drawn Cross tab
My pay and the amount of work
I do.
Salary Drawn Total
10,000-
20,000
20,000-
30,000
More
than
40,000
Not Satisfied 8 8 0 16
Only Slightly Satisfied 7 6 3 16
Satisfied 13 15 22 50
Very Satisfied 26 21 9 56
Extremely Satisfied 10 10 14 34
Total 64 60 48 172
From the chi-square test output table we see that a significance level of 0.008 has been
achieved, where p≤ 0.05. This means the chi-square test is showing a systematic

200
association between the above two variables even at 99 % confidence level. Hence the
null hypothesis is rejected and we conclude that at 95% confidence level, there is
systematic association between amount of work done and the pay they receive.
Chi-Square Tests
Value Df Asymp. Sig. (2-sided)
Pearson Chi-Square 20.776(a) 8 .008
Likelihood Ratio 24.816 8 .002
Linear-by-Linear
Association 2.119 1 .145
N of Valid Cases 172
2 cells (13.3%) have expected count less than 5. The minimum expected count is 4.47.
From the obtained value of directional measure, phi correlation coefficient (3X5 table),
Cramer’s V and Contingency Coefficient, it can be inferred that there is weak association
between the dependent and independent variable, as the value of 0.142 and 0.312
(directional measure), 0.348 (phi correlation coefficient), 0.246 (Cramer’s V) and 0.328
(contingency coefficient) are closer to 0 than 1. This leads us to conclude that the degrees
of job satisfaction of management teachers of Gujarat and length of service with the
current organization are independent of each other.
Directional Measures
Value
Nominal by Interval Eta My pay and the amount
of work I do. Dependent .142
Salary Drawn Dependent .312
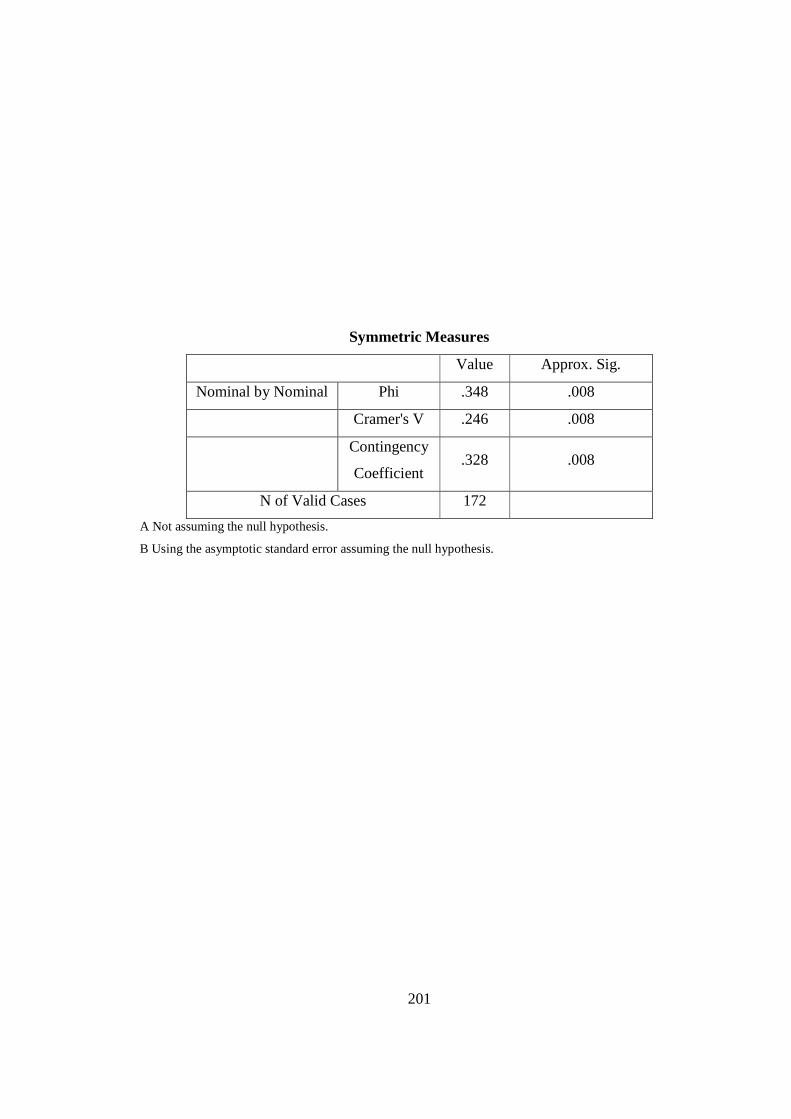
201
Symmetric Measures
Value Approx. Sig.
Nominal by Nominal Phi .348 .008
Cramer's V .246 .008
Contingency
Coefficient .328 .008
N of Valid Cases 172
A Not assuming the null hypothesis.
B Using the asymptotic standard error assuming the null hypothesis.
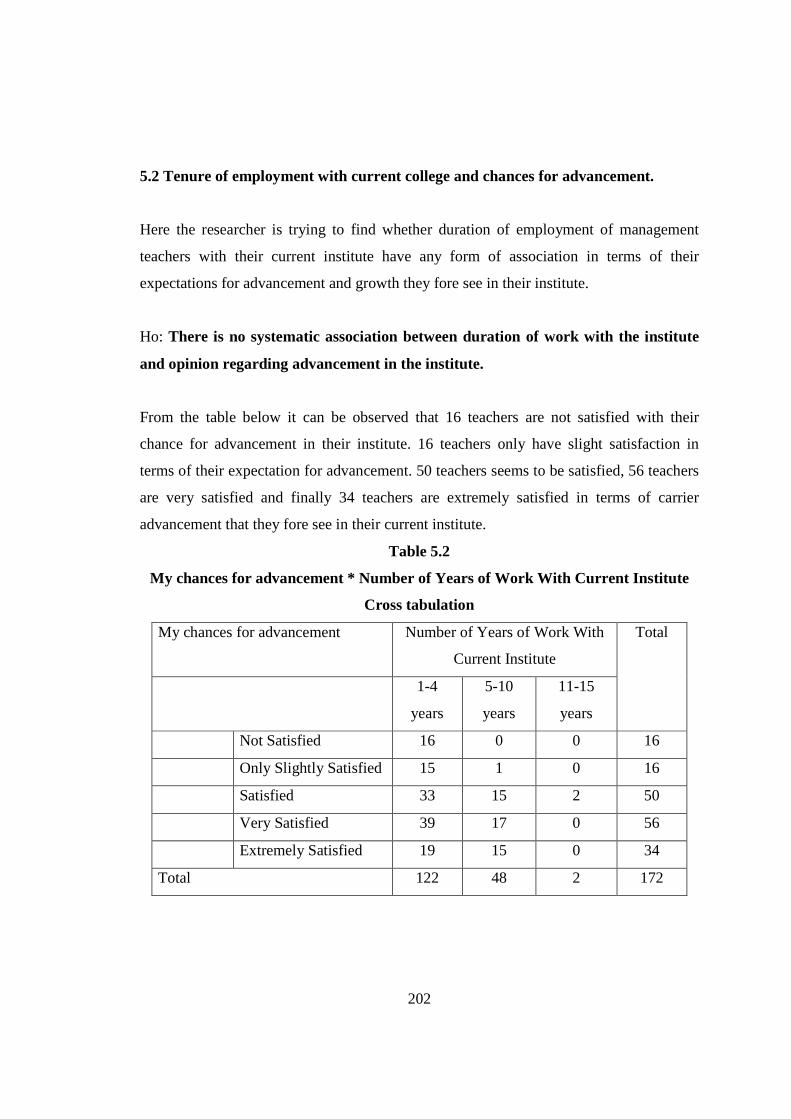
202
5.2 Tenure of employment with current college and chances for advancement.
Here the researcher is trying to find whether duration of employment of management
teachers with their current institute have any form of association in terms of their
expectations for advancement and growth they fore see in their institute.
Ho: There is no systematic association between duration of work with the institute
and opinion regarding advancement in the institute.
From the table below it can be observed that 16 teachers are not satisfied with their
chance for advancement in their institute. 16 teachers only have slight satisfaction in
terms of their expectation for advancement. 50 teachers seems to be satisfied, 56 teachers
are very satisfied and finally 34 teachers are extremely satisfied in terms of carrier
advancement that they fore see in their current institute.
Table 5.2
My chances for advancement * Number of Years of Work With Current Institute
Cross tabulation
My chances for advancement Number of Years of Work With
Current Institute
Total
1-4
years
5-10
years
11-15
years
Not Satisfied 16 0 0 16
Only Slightly Satisfied 15 1 0 16
Satisfied 33 15 2 50
Very Satisfied 39 17 0 56
Extremely Satisfied 19 15 0 34
Total 122 48 2 172
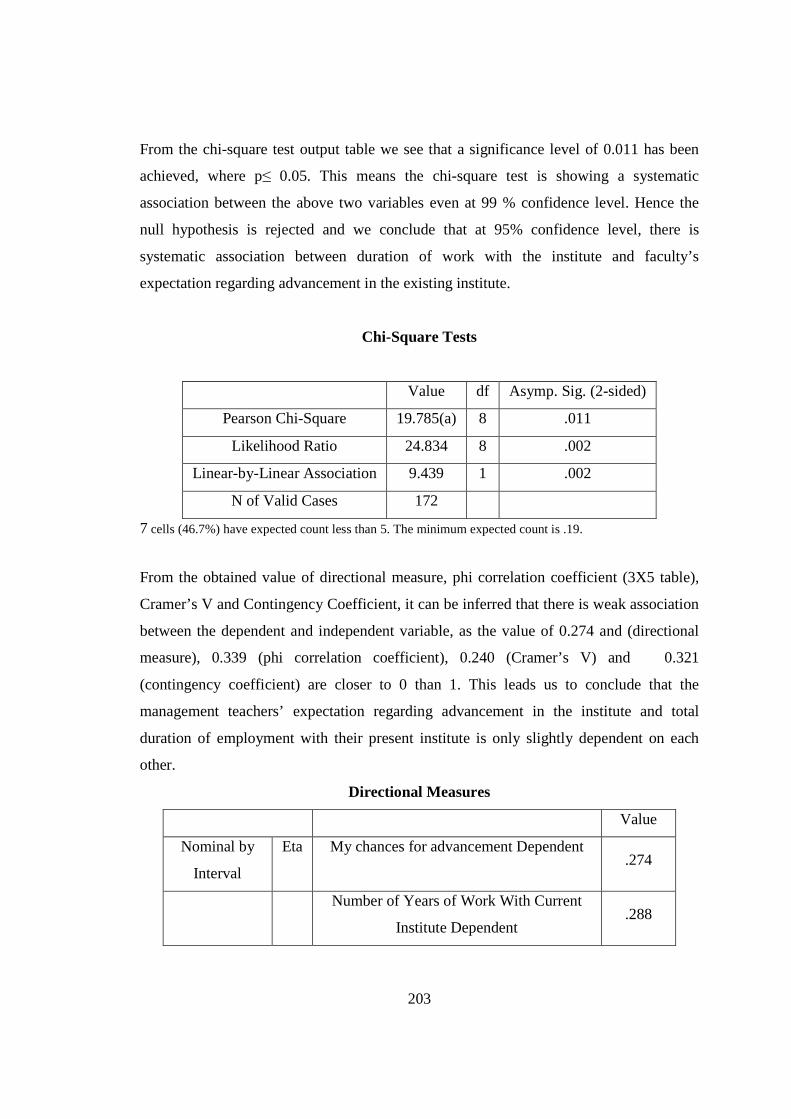
203
From the chi-square test output table we see that a significance level of 0.011 has been
achieved, where p≤ 0.05. This means the chi-square test is showing a systematic
association between the above two variables even at 99 % confidence level. Hence the
null hypothesis is rejected and we conclude that at 95% confidence level, there is
systematic association between duration of work with the institute and faculty’s
expectation regarding advancement in the existing institute.
Chi-Square Tests
Value df Asymp. Sig. (2-sided)
Pearson Chi-Square 19.785(a) 8 .011
Likelihood Ratio 24.834 8 .002
Linear-by-Linear Association 9.439 1 .002
N of Valid Cases 172
7 cells (46.7%) have expected count less than 5. The minimum expected count is .19.
From the obtained value of directional measure, phi correlation coefficient (3X5 table),
Cramer’s V and Contingency Coefficient, it can be inferred that there is weak association
between the dependent and independent variable, as the value of 0.274 and (directional
measure), 0.339 (phi correlation coefficient), 0.240 (Cramer’s V) and 0.321
(contingency coefficient) are closer to 0 than 1. This leads us to conclude that the
management teachers’ expectation regarding advancement in the institute and total
duration of employment with their present institute is only slightly dependent on each
other.
Directional Measures
Value
Nominal by
Interval
Eta My chances for advancement Dependent .274
Number of Years of Work With Current
Institute Dependent .288

204
Symmetric Measures
Value Approx. Sig.
Nominal by
Nominal
Phi .339 .011
Cramer's V .240 .011
Contingency Coefficient .321 .011
N of Valid Cases 172
A Not assuming the null hypothesis.
B Using the asymptotic standard error assuming the null hypothesis.

205
5.3 Age of Teachers and Sense of Nobility.
The profession of a teacher is perceived to be a noble profession, where in one gets a
chance to be of service to others, however this state of feeling is surly an individual.
Many persons join this profession for doing service to the society by imparting
knowledge and able to also earn a decent living for the self and the family. More over in
the initial years of an individual, the person have many needs of self and the family to be
fulfilled thus one thinks of being more commercial rather than service oriented. Many
people perceive profession of academic as non lucrative with low salary and wage
structure and thus bright and talented people are less attracted to this profession. Many
enter because they could not place themselves appropriately in the industry. Those people
who enter the profession willingly tends to get more job satisfaction as they get sense of
accomplishing social or noble service. Thus here the researcher is tying to find out
whether there exits any association between age and sense of nobility.
Ho: There is no systematic association between the age of management teacher and
sense of feeling of being of service to others.
From the below table it becomes visible that 16 teachers in the age group of 24-30yrs and
31-35 yrs are not satisfied. Similarly 16 teachers in the age group of 24-30 yrs, 31-35 yrs
and 41-45 yrs are only slightly satisfied. However 50 teachers across all the age groups
are satisfied. More over 56 and 34 teachers across different age groups feels that they are
very satisfied and extremely satisfied respectively.
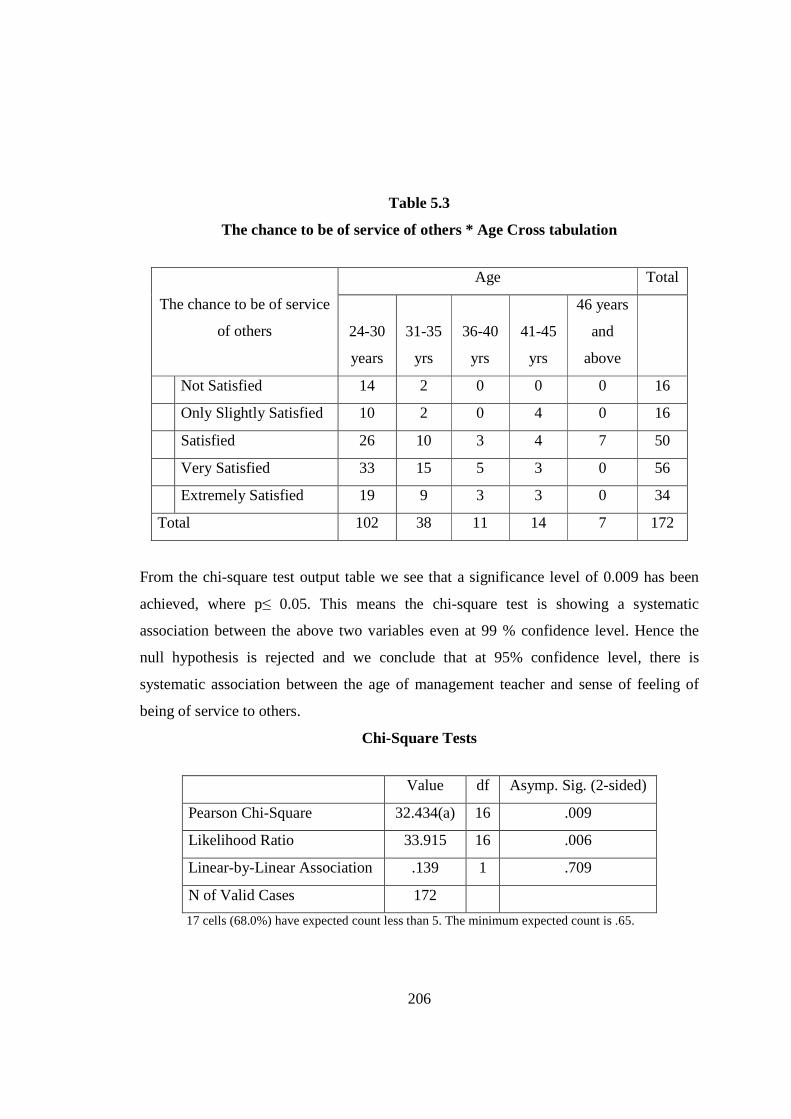
206
Table 5.3
The chance to be of service of others * Age Cross tabulation
The chance to be of service
of others
Age Total
24-30
years
31-35
yrs
36-40
yrs
41-45
yrs
46 years
and
above
Not Satisfied 14 2 0 0 0 16
Only Slightly Satisfied 10 2 0 4 0 16
Satisfied 26 10 3 4 7 50
Very Satisfied 33 15 5 3 0 56
Extremely Satisfied 19 9 3 3 0 34
Total 102 38 11 14 7 172
From the chi-square test output table we see that a significance level of 0.009 has been
achieved, where p≤ 0.05. This means the chi-square test is showing a systematic
association between the above two variables even at 99 % confidence level. Hence the
null hypothesis is rejected and we conclude that at 95% confidence level, there is
systematic association between the age of management teacher and sense of feeling of
being of service to others.
Chi-Square Tests
Value df Asymp. Sig. (2-sided)
Pearson Chi-Square 32.434(a) 16 .009
Likelihood Ratio 33.915 16 .006
Linear-by-Linear Association .139 1 .709
N of Valid Cases 172
17 cells (68.0%) have expected count less than 5. The minimum expected count is .65.
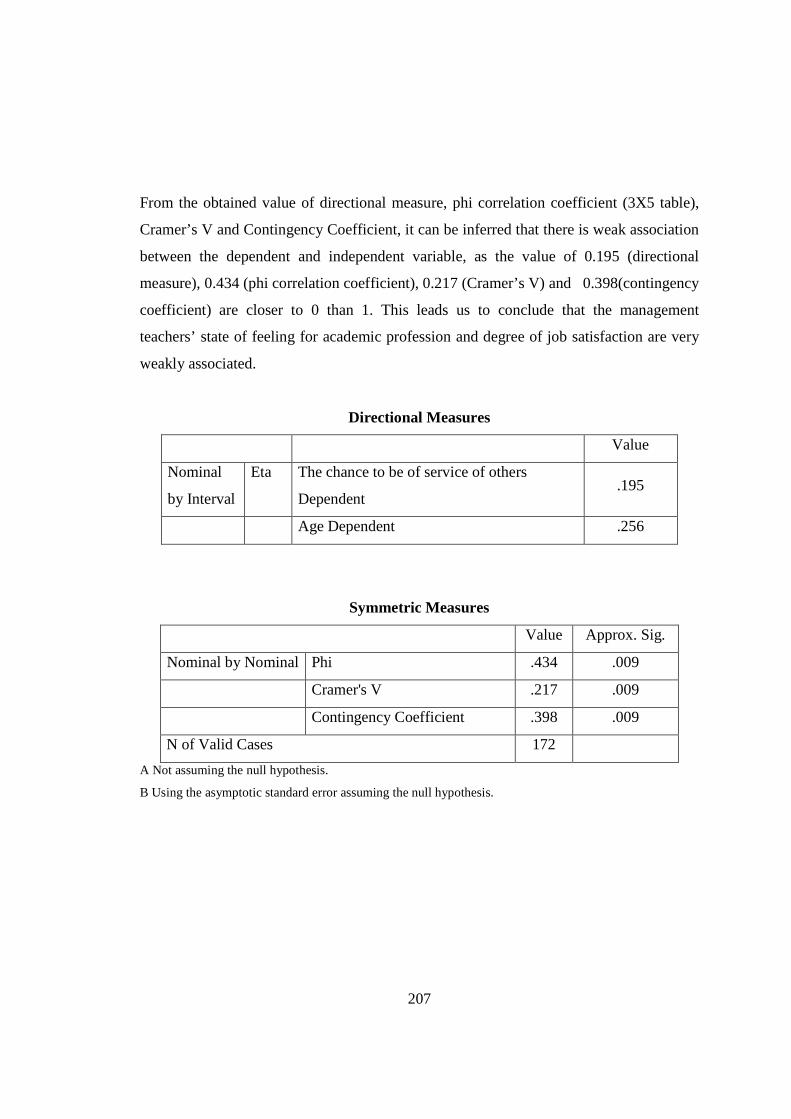
207
From the obtained value of directional measure, phi correlation coefficient (3X5 table),
Cramer’s V and Contingency Coefficient, it can be inferred that there is weak association
between the dependent and independent variable, as the value of 0.195 (directional
measure), 0.434 (phi correlation coefficient), 0.217 (Cramer’s V) and 0.398(contingency
coefficient) are closer to 0 than 1. This leads us to conclude that the management
teachers’ state of feeling for academic profession and degree of job satisfaction are very
weakly associated.
Directional Measures
Value
Nominal
by Interval
Eta The chance to be of service of others
Dependent .195
Age Dependent .256
Symmetric Measures
Value Approx. Sig.
Nominal by Nominal Phi .434 .009
Cramer's V .217 .009
Contingency Coefficient .398 .009
N of Valid Cases 172
A Not assuming the null hypothesis.
B Using the asymptotic standard error assuming the null hypothesis.
208
5.4 Variety in Work and Making Job Interesting.
Many social scientist and HR practitioners have come across numerous researches that
prove the above point. When a person tends to continue doing the same job regularly and
repetitively, the individual gets bored of doing the job thereby losing the interest in the
job and may also act as dissatisfier. Therefore in modern days HR people design jobs that
contain variety in doing the job. Academic is a profession where an individual gets to
learn and teach different subjects and topics amongst different students thereby bringing
about variety in the nature of job and the content of the job. Here the researcher is trying
to find degree of job satisfaction and state of feelings about a particular variable of job
satisfaction.
Ho: There is no systematic association between feelings about variety in work and
making job interesting
From the table below it can be observed that 30 teachers having different views about
variety of work disagree about their job being enriched and made interesting, 8 teachers
are undecided in terms of their job being interesting, 70 and 64 teachers respectively feel
that their job is interesting and does not bore them and thus they have agreed and strongly
agreed on the statement regarding their job being interesting.

209
Table 5.4
Job is Interesting and Does not Bore Me * the variety in my work Cross tabulation
Job is Interesting and
Does not Bore Me
The Variety in My Work Total
Not
Satisfied
Only
Slightly
Satisfied
Satisfied Very
Satisfied
Extremely
Satisfied
Disagree 4 2 5 12 7 30
Undecided 1 1 3 3 0 8
Agree 11 9 17 21 12 70
Strongly Agree 0 4 25 20 15 64
Total 16 16 50 56 34 172
From the chi-square test output table we see that a significance level of 0.082 has been
achieved, where p≥ 0.05. This means the chi-square test is not showing a systematic
association between the above two variables even at 90 % confidence level. Hence the
null hypothesis is accepted and we conclude that at 95% confidence level, there is no
systematic association between the variety of work and making ones job interesting
Chi-Square Tests
Value df Asymp. Sig. (2-sided)
Pearson Chi-Square 19.295(a) 12 .082
Likelihood Ratio 26.256 12 .010
Linear-by-Linear Association .929 1 .335
N of Valid Cases 172
7 cells (35.0%) have expected count less than 5. The minimum expected count is .74.
From the obtained value of phi correlation coefficient (3X5 table), Cramer’s V and
Contingency Coefficient, it can be inferred that there is weak association between the
dependent and independent variable, as the value of 0.335 (phi correlation coefficient),
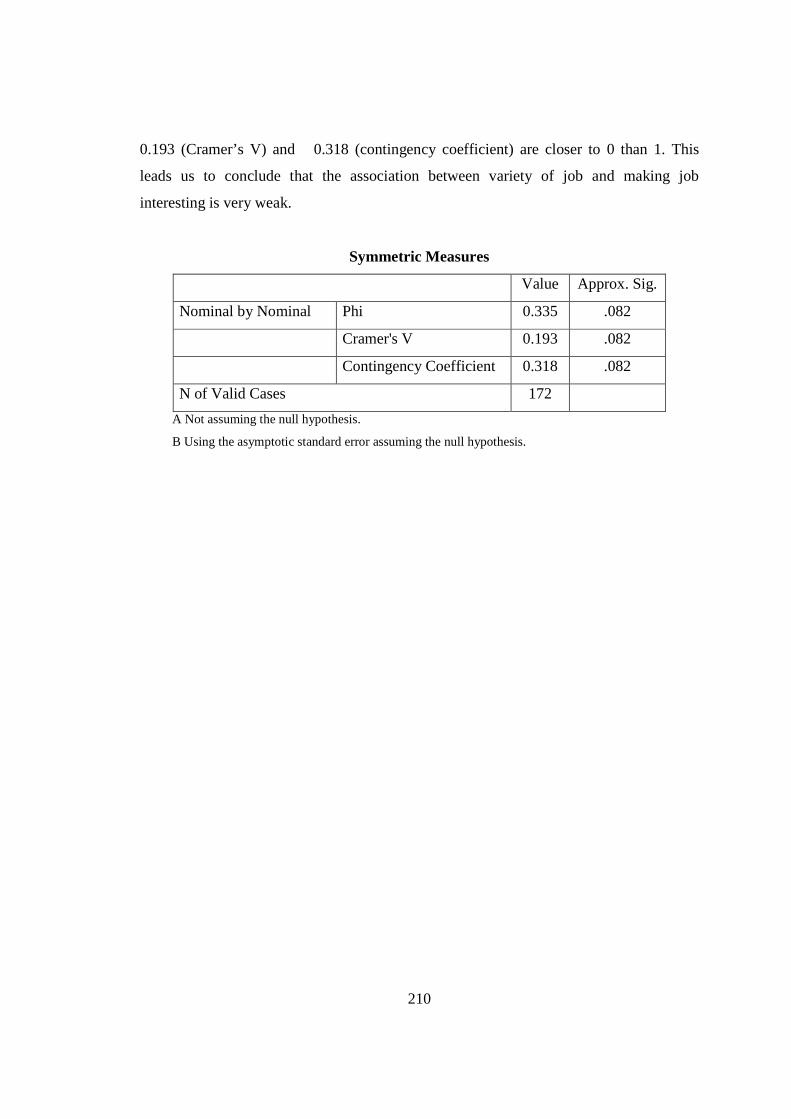
210
0.193 (Cramer’s V) and 0.318 (contingency coefficient) are closer to 0 than 1. This
leads us to conclude that the association between variety of job and making job
interesting is very weak.
Symmetric Measures
Value Approx. Sig.
Nominal by Nominal Phi 0.335 .082
Cramer's V 0.193 .082
Contingency Coefficient 0.318 .082
N of Valid Cases 172
A Not assuming the null hypothesis.
B Using the asymptotic standard error assuming the null hypothesis.

211
5.5 Age and Liking of Academic Work.
It has been said that one should take up those jobs that one likes to do. If a person does
what he loves to do, the individual gets more satisfaction and will also be more effective
and happy with his/her job. Even ‘Theories of Personality’ talks of personality job fit.
The teaching profession demands many aspects of intellectual and cognitive capabilities
over and above basic personality fit for the job. Thus through this hypothesis the
researcher wants to find out whether like of a particular job/work have any association
with the age.
Ho: There is no systematic association between age of management teachers and
liking of work
From the table below, it can be inferred that out of 172 management teachers, only five
teachers in age group of 41-45 yrs and 46 yrs and above seems to dislike their work.
Again 5 teachers in age group of 46 yrs and above dislike work. However 162 teachers
across various age groups seem to like their work. This can be inferred as 101 and 61
teachers respectively have rated disagree and strongly agreed to the statement specifying
that they definitely dislike their work.
Table 5.5
I definitely dislike my work * Age Cross tabulation
I definitely dislike
my work
Age Total
24-30
years
31-35
yrs
36-40
yrs
41-45
yrs
46 years
& above
Strongly Agree 0 0 0 3 2 5
Agree 0 0 0 0 5 5
Disagree 61 28 2 10 0 101
Strongly Disagree 41 10 9 1 0 61
Total 102 38 11 14 7 172
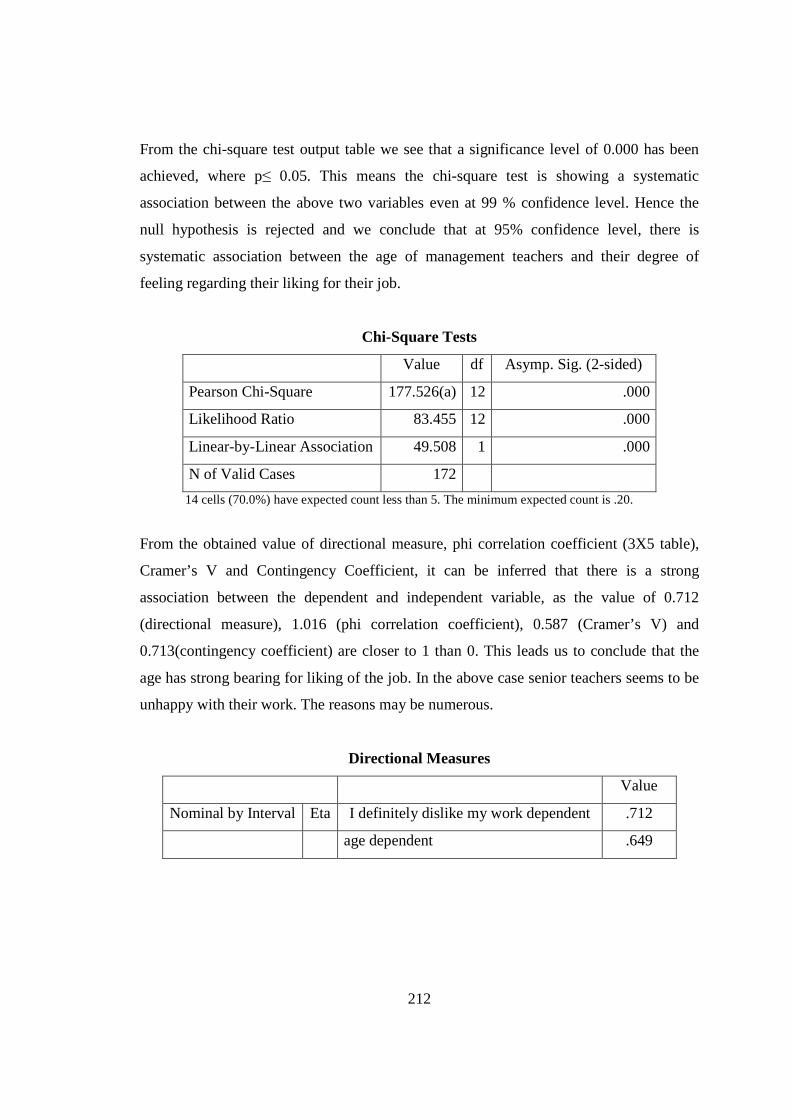
212
From the chi-square test output table we see that a significance level of 0.000 has been
achieved, where p≤ 0.05. This means the chi-square test is showing a systematic
association between the above two variables even at 99 % confidence level. Hence the
null hypothesis is rejected and we conclude that at 95% confidence level, there is
systematic association between the age of management teachers and their degree of
feeling regarding their liking for their job.
Chi-Square Tests
Value df Asymp. Sig. (2-sided)
Pearson Chi-Square 177.526(a) 12 .000
Likelihood Ratio 83.455 12 .000
Linear-by-Linear Association 49.508 1 .000
N of Valid Cases 172
14 cells (70.0%) have expected count less than 5. The minimum expected count is .20.
From the obtained value of directional measure, phi correlation coefficient (3X5 table),
Cramer’s V and Contingency Coefficient, it can be inferred that there is a strong
association between the dependent and independent variable, as the value of 0.712
(directional measure), 1.016 (phi correlation coefficient), 0.587 (Cramer’s V) and
0.713(contingency coefficient) are closer to 1 than 0. This leads us to conclude that the
age has strong bearing for liking of the job. In the above case senior teachers seems to be
unhappy with their work. The reasons may be numerous.
Directional Measures
Value
Nominal by Interval Eta I definitely dislike my work dependent .712
age dependent .649

213
Symmetric Measures
Value Approx. Sig.
Nominal by Nominal Phi 1.016 .000
Cramer's V .587 .000
Contingency Coefficient .713 .000
N of Valid Cases 172
A Not assuming the null hypothesis.
B Using the asymptotic standard error assuming the null hypothesis.

214
5.6 Age and Disappointment with the Job.
Here the researcher wants to find out whether variable age and variable disappointment
for work have any form of association.
Ho: There is no systematic association between age of management teachers and
disappointment regarding taking up academic job.
From the below table it can be observed that only 20 teachers across various age group
are disappointed with their job. However all other teachers i.e. 152 teachers are satisfied
and thus disagree and strongly disagree as to disappointment with their academic job
respectively.
Table 5.6
I am disappointed that I took this job * Age Cross tabulation
I am disappointed
that I took this job
Age Total
24-30
years
31-35
yrs
36-40
yrs
41-45
yrs
46 years
& above
Strongly Agree 0 0 5 3 2 10
.0% .0% 50.0% 30.0% 20.0% 100.0%
Agree 0 0 1 4 5 10
.0% .0% 10.0% 40.0% 50.0% 100.0%
Disagree 68 22 5 7 0 102
66.7% 21.6% 4.9% 6.9% .0% 100.0%
Strongly Disagree 34 16 0 0 0 50
68.0% 32.0% .0% .0% .0% 100.0%
Total 102 38 11 14 7 172
59.3% 22.1% 6.4% 8.1% 4.1% 100.0%

215
From the chi-square test output table we see that a significance level of 0.000 has been
achieved, where p≤ 0.05. This means the chi-square test is showing a systematic
association between the above two variables even at 99 % confidence level. Hence the
null hypothesis is rejected and we conclude that at 95% confidence level, there is
systematic association between the age of management teachers and their degree of
feeling regarding disappointment related to their job.
Chi-Square Tests
Value df Asymp. Sig. (2-sided)
Pearson Chi-Square 140.444(a) 12 .000
Likelihood Ratio 104.452 12 .000
Linear-by-Linear Association 75.783 1 .000
N of Valid Cases 172
12 cells (60.0%) have expected count less than 5. The minimum expected count is .41.
From the obtained value of directional measure, phi correlation coefficient (3X5 table),
Cramer’s V and Contingency Coefficient, it can be inferred that there is a strong
association between the dependent and independent variable, as the value of 0.751
(directional measure), .904 (phi correlation coefficient), 0.522 (Cramer’s V) and 0.670
(contingency coefficient) are closer to 1 than 0. This leads us to conclude that the age has
strong bearing for job related disappointment.
Directional Measures
Value
Nominal by
Interval
Eta I am disappointed that I took this job Dependent .751
Age Dependent .744

216
Symmetric Measures
Value Approx. Sig.
Nominal by Nominal Phi .904 .000
Cramer's V .522 .000
Contingency Coefficient .670 .000
N of Valid Cases 172
A Not assuming the null hypothesis.
B Using the asymptotic standard error assuming the null hypothesis.
217
5.7 Salary Drawn and Disliking for the Work.
The ‘Theories of Motivation’ tends to justify that money acts as motivating factor for
individuals to work and also give certain degree of satisfaction. However motivation
theories speak of fair wages and equality in wages. In academics salary and wage
structures are based on the qualification, designation and experience of individuals. We
come across numerous examples in many MBA institutes of Gujarat where a senior
person by age has lower designation as compared to other young colleagues. This may be
because the senior faculties may not be promoted to higher designation due to lack of
requisite educational qualification and thus pay of such teachers would naturally be lower
than their younger colleagues. Here the researcher wants to find out whether likings or
disliking for their current job is due to salary and monetary benefits.
Ho: There is no systematic association between salary drawn by management
teachers and disliking for the job.
From the below table it becomes visible that 152 teachers drawing salary in different
range seems to be happy with their work and like their work as these teachers have
disagreed and strongly disagreed to the statement regarding disappointment related to
their teaching job. However 20 teachers drawing salary in different range are
disappointed by taking up academic jobs. Specifically teachers in the salary bracket of
Rs.20, 000-30,000 and more than Rs. 40.000 seems to be more disappointed as is visible
from the below table.
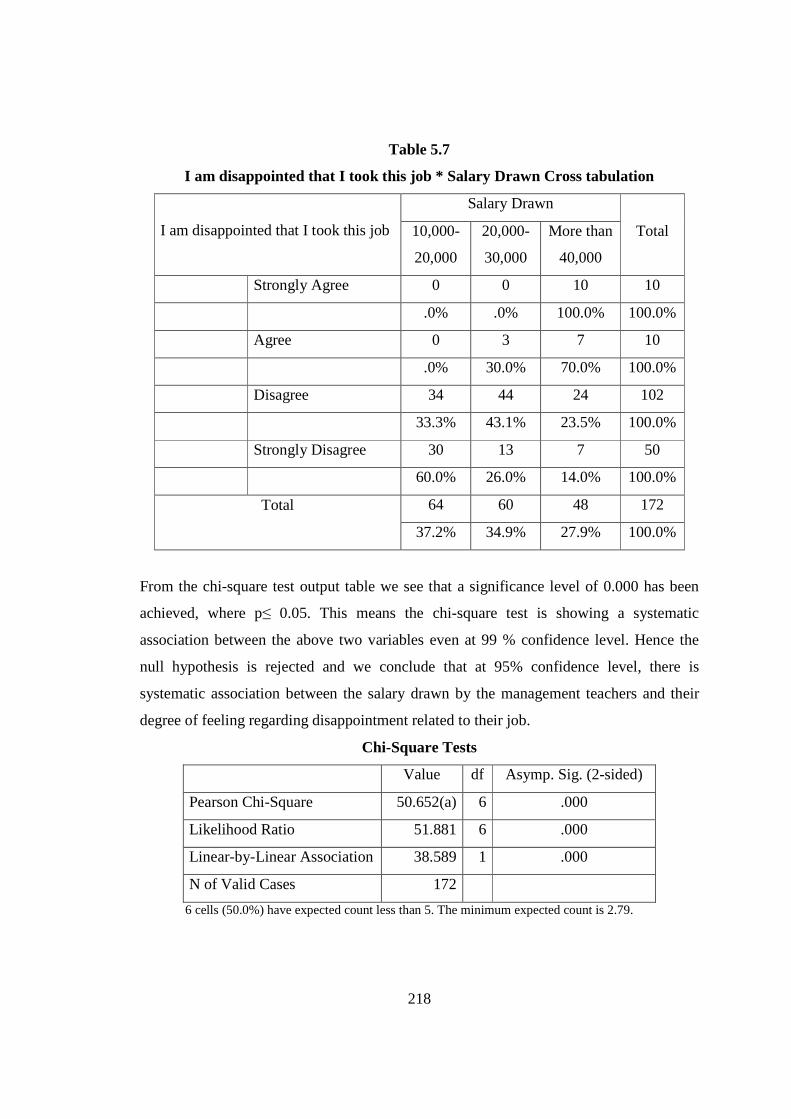
218
Table 5.7
I am disappointed that I took this job * Salary Drawn Cross tabulation
I am disappointed that I took this job
Salary Drawn
Total
10,000-
20,000
20,000-
30,000
More than
40,000
Strongly Agree 0 0 10 10
.0% .0% 100.0% 100.0%
Agree 0 3 7 10
.0% 30.0% 70.0% 100.0%
Disagree 34 44 24 102
33.3% 43.1% 23.5% 100.0%
Strongly Disagree 30 13 7 50
60.0% 26.0% 14.0% 100.0%
Total
64 60 48 172
37.2% 34.9% 27.9% 100.0%
From the chi-square test output table we see that a significance level of 0.000 has been
achieved, where p≤ 0.05. This means the chi-square test is showing a systematic
association between the above two variables even at 99 % confidence level. Hence the
null hypothesis is rejected and we conclude that at 95% confidence level, there is
systematic association between the salary drawn by the management teachers and their
degree of feeling regarding disappointment related to their job.
Chi-Square Tests
Value df Asymp. Sig. (2-sided)
Pearson Chi-Square 50.652(a) 6 .000
Likelihood Ratio 51.881 6 .000
Linear-by-Linear Association 38.589 1 .000
N of Valid Cases 172
6 cells (50.0%) have expected count less than 5. The minimum expected count is 2.79.

219
From the obtained value of directional measure, phi correlation coefficient (3X5 table),
Cramer’s V and Contingency Coefficient, it can be inferred that there is a strong
association between the dependent and independent variable, as the value of 0.491
(directional measure), 0 .543 (phi correlation coefficient), 0.384 (Cramer’s V) and 0.477
(contingency coefficient) are closer to 0 than 1. This leads us to conclude that the
association between above two variables is weak.
Directional Measures
Value
Nominal by
Interval
Eta I am disappointed that I took this
job dependent .491
Salary Drawn Dependent .475
Symmetric Measures
Value Approx. Sig.
Nominal by
Nominal
Phi .543 .000
Cramer's V .384 .000
Contingency Coefficient .477 .000
N of Valid Cases 172
A Not assuming the null hypothesis.
B Using the asymptotic standard error assuming the null hypothesis.
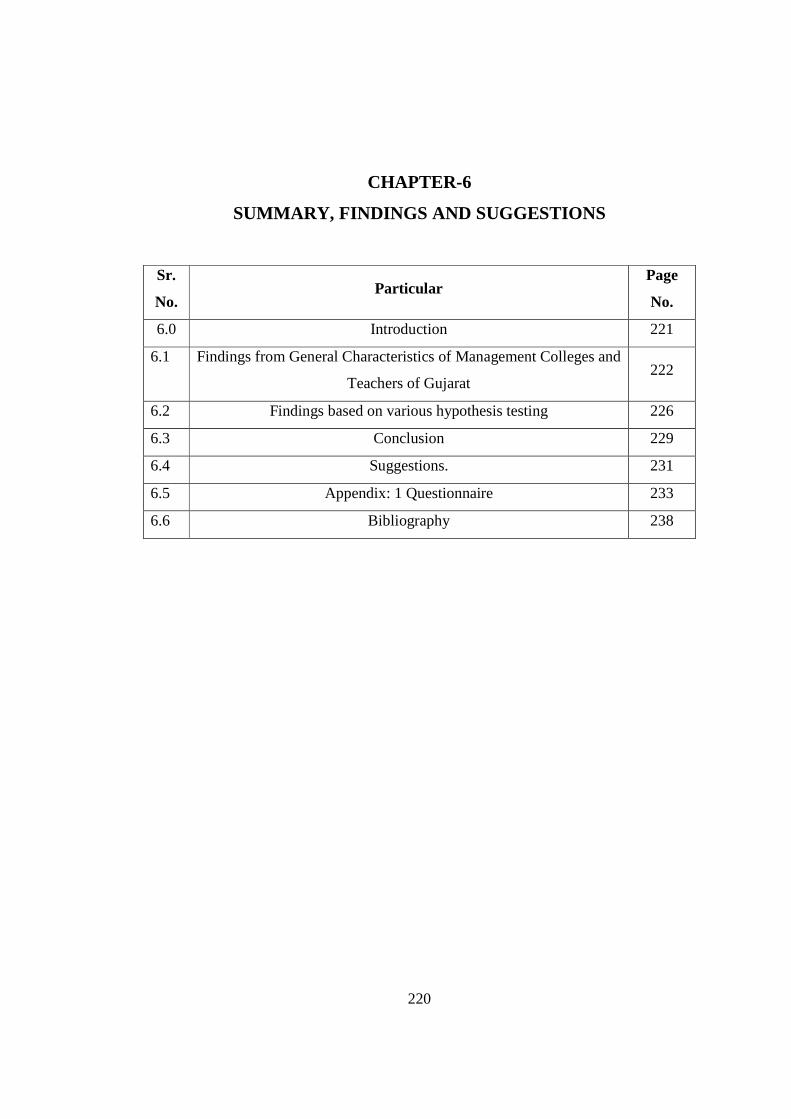
220
CHAPTER-6
SUMMARY, FINDINGS AND SUGGESTIONS
Sr.
No. Particular
Page
No.
6.0 Introduction 221
6.1 Findings from General Characteristics of Management Colleges and
Teachers of Gujarat 222
6.2 Findings based on various hypothesis testing 226
6.3 Conclusion 229
6.4 Suggestions. 231
6.5 Appendix: 1 Questionnaire 233
6.6 Bibliography 238
221
6.0 Introduction.
Like a traveller, who after completing his journey, reaches to destination and looks back
to see the distance that he has covered for identifying the important landmarks he came
across. Review of the important aspects of the study and summing up of the key
observations are presented in this chapter.
Regardless of the authors, generally it is agreed that job satisfaction involves the
attitudes, emotions, and feelings about a job, and how these attitudes, emotions and
feelings affect the job and the employee’s personal life. Given the many definitions of
job satisfaction, many scholars have proposed various theories of job satisfaction. These
theories have been developed, then either supported or rejected by others in the field of
work motivation and behavioural research. Satisfaction is a psychological factor. It
cannot be seen and cannot quantify. But its expression in human mind is
understandable. When an employee is satisfied with his assigned task and can discharge
his faction’s satisfactorily, it is called ‘job satisfaction’. Job Satisfaction can be an
important indicator of how employees feel about their jobs and a predictor of work
behaviors such as organizational citizenship, absenteeism, and turnover. Further, job
satisfaction can partially mediate the relationship of personality variables and deviant
work behaviors. One common research finding is that job satisfaction is correlated with
life satisfaction. This correlation is reciprocal, meaning people who are satisfied with
life tend to be satisfied with their job and people who are satisfied with their job tend to
be satisfied with life.
Hence through this study various dimensions of job satisfaction and various degree of
job satisfaction of management teachers of Gujarat are studied and the important
findings of the study are presented below.
222
6.1 Findings from General Characteristics of Management Colleges and Teachers
of Gujarat.
� All the MBA institutes of sample respondents are approved by AICTE, New
Delhi. (point 4.1)
� The sample MBA institutes have intake capacity of varying size ranging from 30
students to 120 students across the state. (point 4.1)
� Out of 172 MBA teachers, 108 (62.8%) are working as lectures, 45 (26.2%) are
employed as Assistant Professors, 7 (4.1%) are employed as Professors and 12
(7.0%) are employed as Principals/Directors in different institutions. (point 4.1)
� All the sample respondent management teachers are full time employees in their
respective MBA colleges. (point 4.1)
� Out of 172 MBA teachers, 160 (93.0%) teachers are working in purely MBA
institutes, 5 (2.9 %) teachers are employed in MBA departments established in
engineering colleges and 7 (4.1%) teachers are employed in MBA departments
established in MCA colleges. (point 4.1)
� The analysis of data shows that 102 (59.3%) teachers are in the age group of 24-
30 years, 38 (22.1%) teachers are employed in age group of 31-35 years, 11
(6.4%) are in the age group of 36-40 years, 14 (8.1%) are in the age group of 41-
45 years and 7 (4.1%) MBA teachers are in the age group of 46 and above years.
(point 4.1)
� It has also been observed that 102 (59.3%) of teachers has mere work experience
ranging from 1-3 years, 51 (29.7%) of teachers have work experience ranging

223
from 4-7 years, 5 (2.9%) of teachers have work experience of 8-10 years, 7
(4.1%) have experience ranging from 11-15 years and 7 (4.1) of teachers have
work experience of above 15 years respectively. (point 4.1)
� I t is also observed that 14 (8.1%) teachers are possessing academic qualification
of B.Com-M.Com, 83 (48.3%) teachers are B.B.A.-M.B.A, 24 (14%) are B.E.-
M.B.A, 6 (3.5%) are B.Pharm-MBA, 18 (10.5%) are B.Sc-MBA and 4 (2.3%)
teachers are having BCA-MBA academic qualification respectively. More over
there are more than 23 (13.4%) management teachers having Masters with PhD
qualification. (point 4.1)
� It has also been observed that 55 (32%) of the management teachers have not
participated in any of the mentioned academic activities like seminars,
conferences, workshops etc. 66 (38.4%) teachers have participated in 1-5
academic events, 29 (16.9%) teachers have participated in 6-10, 10(5.8%) have
participated in 11-15 events, 12 (7%) management teachers have participated in
more than 15 workshops, conferences, seminars etc during their course of work
in management colleges. (point 4.1)
� The analysis of data revealed that out of 172 management teachers employed in
different MBA institutions, 64 (37.2%) teachers draws salary in the range of
Rs.10,000 to Rs. 20,000 per month, 60 (34.9%) teachers gets salary in the rang
of Rs. 20, 000 to Rs. 30,000 per month and 48 (27.9%) teachers draws salary
above Rs. 40,000 per month. (point 4.1)
� It is also observed that only 5 (2.9%) management colleges have one assistant
professor , 90 (52.3%) teachers say they have two assistant professors, twelve
colleges (7%) have three assistant professors, 60 (34.9%) colleges have four
assistant professors and 5 (2.9%) colleges have five or more assistant professors
working in the institute respectively. (point 4.1)
224
� In terms of academic experience of management teachers, the researcher
observed that 92 (53.5%) have been working in MBA institutes since 1-3 years
only, 36 (20.9%) have been working since 4-6 years, 20 (11.6%) are working
since 7-9 years, 11 (6.4%) teachers are working since 10-15 years in MBA
profession and finally 13 (7.6%) management teachers are in MBA teaching
profession since more than 15 years. (point 4.1)
� On the basis of experience data, the researcher concluded that 74.4 % teachers
possess MBA teaching experience of only 1-6 years. These teachers have just
got an opportunity to work as faculty in MBA College due to rapid
mushrooming of new MBA colleges within last two to three years. (point 4.1)
� It has been observed by researcher that 122 (70.9%) teachers are working with
their current institute since last 1-4 years, 48 (27.9%) are working since last 5-10
years and finally 2 (1.2%) management teachers are old man of the institute and
are working with the same institute since last 11-15 years. (point 4.1)
� It is also observed that 36 (20.9%) teachers spent 31-40% of the time with the
students out of the total time the faculty spent in the institute, 80 (46.5%)
teachers spent 41-50% of time with the students and 56 (32.6%) teachers spent
more than 50% time with the students. (point 4.1)
� 90 (52.3%) teachers say that they have intake capacity of 60 students in its first
year, 12 (7%) teachers say that they have intake capacity of 90 seats and 70
(40.7%) teachers say that they have an intake capacity of 120 students in first
year of MBA. (point 4.1)

225
� 10 (5.8%) teachers say that their MBA college is fully accredited, another 150
(87.2%) teachers said that their college is provisionally accredited and meets
state standards, 8 (4.7%) are of view that their college is provisionally accredited
but needs improvements and finally 4 (2.3%) teachers say that their college has
been accredited with warning. (point 4.1)
226
6.2 Findings based on hypothesis testing.
� One sample‘t’ was conducted to know whether management teachers of Gujarat
had different degree of opinions for different dimensions of job satisfaction. On
the basis of‘t’ test it has been inferred that degree of opinions for various
dimensions of job satisfaction of management teachers of Gujarat significantly
differed for each other. (point 4.2)
� The Chi Square test did not reveal systematic association between salary paid
by the management colleges in Gujarat and the degree of job satisfaction
derived by the management teachers of Gujarat. The Phi test, Cramer’s V and
Contingency Coefficient also witnessed this phenomenon as their statistical
value showed very weak association. (point 4.3)
� A strong and systematic association between total years of experience of
management teachers of Gujarat and their degree of job satisfaction has been
observed. (point 4.4)
� Even Chi Square test revealed very strong and systematic association between
aggregate work experience of management teachers of Gujarat and the degree
of job satisfaction. (point 4.5)
� The Chi Square test, Phi, Cramer’s V and Contingency Coefficient test showed
very strong and systematic association between age of management teachers of
Gujarat and the degree of job satisfaction. (point 4.6)
� However no systematic association was found between the length of service of
management teachers of Gujarat and the degree of job satisfaction. The

227
directional measure and symmetric measures also supports this finding. (point
4.7)
� A strong and systematic association between intake capacity of students and
the degree of job satisfaction of management teachers of Gujarat has been
found. (point 4.8)
� A one sample‘t’ test was conducted to find out the degree/level of job
satisfaction of management teachers of Gujarat through different statements
related to degree of job satisfaction. The test revealed that there exist
significant differences in job satisfaction level of management teachers across
different institution in Gujarat. The ‘p’ value was found to be 0.00, for all the
statements measuring degree of job satisfaction supporting the finding. (Point
4.9).
� The Chi Square test, Phi, Cramer’s and Contingency Coefficient test revealed
that there is systematic association between amount of work done and the pay
they receive. (point 4.10)
� The research also shows that there is systematic association between duration
of work with the institute and faculty’s expectation regarding advancement
in the existing institute. (point 4.11)
� Chi Square test revealed weak but systematic association between the age of
management teacher and sense of feeling of being of service to others has
been observed. The directional measure and symmetric measures also supports
the point. (point 4.12)
� The Chi Square test did not reveal any systematic association between the
variety of work and making ones job interesting. (point 4.13)

228
� The researcher also observed that systematic association between the age of
management teachers and their degree of feeling regarding their liking for
their job is prevailing. More over this association is very strong as symmetric
measures value of all the three tests is closer to 1 and than 0. (point 4.14)
� A strong and systematic association was observed between the age of
management teachers and their degree of feeling regarding disappointment
related to their job. (point 4.15)
� More over there exist moderate but systematic association between the salary
drawn by the management teachers and their degree of feeling regarding
disappointment related to their job. (point 4.16)

229
6.3 Conclusion.
The purpose of this study was to investigate predictors of Management Teachers Job
Satisfaction including those that are personal and those that are job related in the state
of Gujarat. For decades, job satisfaction has been one of the most extensively
researched concepts in work and organizational psychology. Job satisfaction is believed
to reflect an individual’s affective and/or cognitive assessment of his or her working
conditions and job attributes. It has been traditionally used to confirm the effectiveness
of job redesign and motivational conditions at work.
Management education in our country has come of ages and also houses some of the
best and world class management schools like IIM’s in our country. With rapid
industrialization of the country, the demand for skilled and talented managers is
increasing. The central and state governments also have made see changes in the higher
and technical education in our country. Availability of quality and competent teachers
in required number is the biggest challenge for all the management institution across the
country in general and Gujarat in particular. Thus retaining the faculty members has
become vital to the sustainable growth and development of management institutions.
There is plenty of research on job satisfaction of employees across different industry in
the world. The researcher thus made a humble attempt to study the job satisfaction level
of management teachers in Gujarat.
The dimensions and degree of job satisfaction of management teachers of Gujarat is not
uniform. The detailed findings of this research have already been appended in the
previous section of this report. However after introspecting several of parameters and
dimensions, it becomes clear that no single dimension or factor can please human being
totally. More over satisfaction is a state of mind.

230
However management of MBA institutes in Gujarat will have to understand very clearly
that faculty members are building blocks of every type of academic institutes and thus
they management should aim to create and maintain cordial learning and teaching
environment Management of self finance management institutes in Gujarat should
understand the importance of providing hygienic factors to its teachers like fair salary,
good working, learning environment, carrier growth, challenging work etc.

231
6.4 Suggestions:
� Many of the private self finance MBA institutes violets the quality standard
norms and also attempts to exploit the faculty members by paying low salary.
The concerned government regulators should immediately intervene and take
strict actions against such institutes.
� The working environment of institutes needs to be made more cordial and
friendly.
� The heads of institutes are expected to play an active role in the development
and grooming of students and the faculty members in a friendlier manner. This
will reduce the unwanted stress levels of both students and teachers.
� The curriculum of management colleges in Gujarat needs to be made more
rational and learning oriented. Instead of simply dumping the unwanted
knowledge, curriculum development should take place in light of latest
development in the concerned field. This will enable the student and teacher to
learn and work more efficiently there by creating an environment learning
oriented.
� Management sciences are more applied sciences and thus the curriculum should
have sufficient space for practical exposure to both students and teachers. This
will enrich the job of teachers also that will tend to give job satisfaction.
� There is an emergent need for sound and practical HR policies for all the
management institutes of Gujarat. Many of the institutes are running very
unprofessionally creating unwanted confusion and stress for teachers. This
situation decreases the satisfaction of the management teachers.

232
� The salary structure of private as well as government management institution
should be same and equitable. Most of the self finance MBA institutes have not
implemented the 6th pay recommendations as of now. There is mass scale
dissatisfaction and frustration of management teachers of Gujarat. Government
should immediately intervene and ensure that management teachers of private
self finances MBA colleges should be paid the scales as per 6th pay commission
recommendations.
� The management of MBA institutes should give sufficient scope for carrier
growth and personnel development of its teachers.
� The work of management teachers should be made more pleasant by enriching
the job and removing the monotony.
� The salary and wage structure needs to be made fair and equitable.
� Last but not the least I feel that entire education system in our country to a
greater extent have become defunct, corrupted, and politicalized. The entire
system should be revamped and vibrant if the country has to fulfill its human
resource needs for the development scheduled in the coming days.

233
A COMPARATIVE ANALYSIS OF JOB SATISFACTION LEVEL OF
MANAGEMENT TEACHERS OF MBA COLLEGES IN GUJARAT STAT E
Dear Sir/Madam
Please find attached here a set of Performa to measure the degree of job satisfaction of the
management teachers. Kindly make it convents to fill the Performa within a week of receipt.
This is purely an academic exercise intended to evaluate the factors affecting the level of job
satisfaction of an employee in a typical organizational climate. The confidentiality of the
responses will be strictly maintained and this will be used for academic purpose only.
INDIVIDUAL DATA SHEET
Name of the Teacher:
Designation:
Division /department:
Age:
Experience:
Academic qualification:
Degree:
Masters degree:
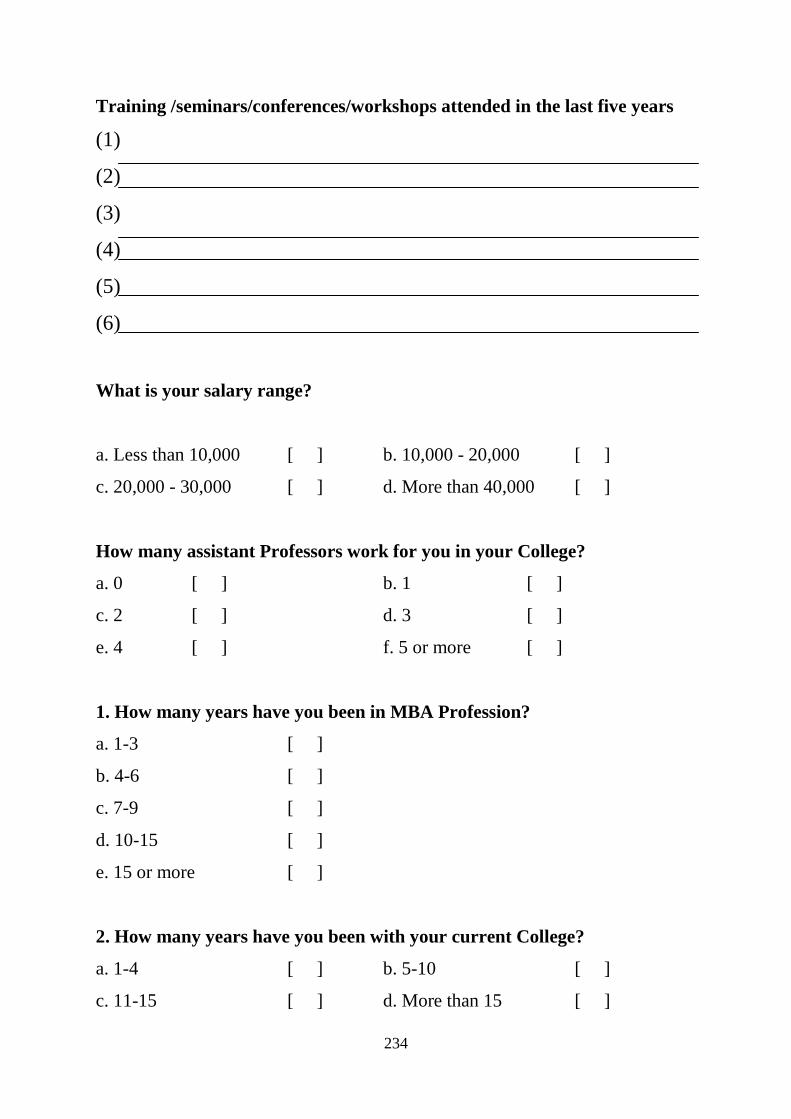
234
Training /seminars/conferences/workshops attended in the last five years
(1)
(2)
(3)
(4)
(5)
(6)
What is your salary range?
a. Less than 10,000 [ ] b. 10,000 - 20,000 [ ]
c. 20,000 - 30,000 [ ] d. More than 40,000 [ ]
How many assistant Professors work for you in your College?
a. 0 [ ] b. 1 [ ]
c. 2 [ ] d. 3 [ ]
e. 4 [ ] f. 5 or more [ ]
1. How many years have you been in MBA Profession?
a. 1-3 [ ]
b. 4-6 [ ]
c. 7-9 [ ]
d. 10-15 [ ]
e. 15 or more [ ]
2. How many years have you been with your current College?
a. 1-4 [ ] b. 5-10 [ ]
c. 11-15 [ ] d. More than 15 [ ]

235
3. What percentage of time spent do you spend directly with students?
a. Less then 10% [ ] b. 11-20% [ ]
c. 21-30% [ ] d. 31-40% [ ]
e. 41-50% [ ] f. More than 50% [ ]
4. What is the size of your college?
a. 60 student or less [ ] b. 61-120 students [ ]
c. 121-180 students [ ] d. 181-240 students [ ]
e. Over 240 students [ ]
5. What is your College’s accreditation status?
a. Fully accredited [ ]
b. Provisionally accredited meets state standards [ ]
c. Provisionally accredited needs improvement [ ]
d. Accredited with warning [ ]
6. Did your College make Adequate Yearly Progress under No Student Left
Behind?
a. Yes [ ] b. No [ ]

236
7. Given below is a table containing twenty statements to reflect the degree
of job satisfaction of an employee. Kindly read these carefully and tick
marks your response against the appropriate category.
Job satisfaction item Strongly
Agree Agree Undecided Disagree
Strongly
Disagree
1. My job is usually interesting
enough to keep me from
getting bored
2. Most days I am enthusiastic
about my work.
3. I feel my job is more
interesting than others I could
get
4. I find real enjoyment in
work
5. I feel that I am happier in
my work than most other
people.
6. I feel fairly well satisfied
with my present job.
7. I am satisfied with my job
for the time being.
8. I like my job better than the
average worker does.
9. My job is like a hobby to
me.
10. It seems that my friends are
more interested in their jobs.
11. My job has a fair

237
(impartial) promotion policy.
12. I enjoy my work more than
my leisure time.
13. Most of the time I have to
force myself to go to work.
14. I consider my job rather
unpleasant.
15. I am disappointed that I
took this job.
16. My job is pretty
interesting.
17. Each day of work seems it
will never end.
18. I am adequately paid for
the job I do.
19. I am often bored with my
job.
20. I definitely dislike my
work.
8. Any Suggestion

238
BIBLIOGRAPHY
• Adams, J.P. (1999). Good Principles, good schools. Thrust for Educational
Leadership, 29(1), 8 – 11.
• Anderson, K (2003, September 12). Few Districts are up to snuff. The free Lance –
star, pp. C1, C4.
• Armstrong, B. C. (2001). School size as a factor in the job satisfaction and locus of
control of high school principals in Missouri. Unpublished doctoral dissertation,
university of Kansas, Lawrence.
• Ary, D., Jacobs, L.C., & Razavieh, A. (2002). Introduction to Research in education
(6th ed.)
• Bayfield A H and Roth H F 1951 “An index of job satisfaction” journal of applied
psychology.
• Barry, D.A (2002). Job satisfaction and leadership style: A study of Michigan high
school principals. Unpublished doctoral dissertation, western Michigan University,
Kalamazoo.
• Belmont, CA: Wadsworth. Association of California School Administrators. (2001).
Recruitment and retention of school leaders: a critical state of need. Sacramento:
ACSA
• Best, J.W., & Kahn, J.V. (2003). Research in education (9th edition). Boston: Pearson.
• Blanchflower, D.G., Oswald, J.V. (1993). Well being overtime in Britain and USA.
Hanover, NJ: Dartmouth College.

239
• Bowran J, Todd K. Job stressors and job satisfaction in a major metropolitan public
EMS service. Prehospital and Disaster Medicine 1999; 14(4):236-9.
• Brady, D.B. (2001). Correlates of job satisfaction among California principals.
Unpublished doctoral dissertation, university of Southern California, Los Angeles.
• Brandt, R. (1987). On leadership and student achievement: a conversation with
Richard Andrews. Educational Leadership, 45(9), 12 – 16.
• Brayfield A, rothe HH. An index of job satisfaction. Journal of applied psychology
1952; 35:307-11.
• Bridges, R.L. (1995). The relationship of job satisfaction with ten independent
variables: A study of Arkansas, Fayetteville.
• Brogan, G.B. (2003). Job satisfaction of Idaho high school principals. Unpublished
doctoral dissertation, Idaho State University, Boise.
• Bruce, W.M., & Blackburn, J.W. (1992). Balancing job satisfaction and performance.
Westport.
• Buchbinder RN , Wilson M, Melick CF, power NR> Primary care physician job
satisfaction and turnover. amer jour of managed care 2001;7(7) :16-21.
• Calnan m. wain wright C, forsythe M, wall B, Almond S. Mental health and stress in
the workplace; the case of general practice in the UK. Soc sci MED 2001 ; 52:499-
507.
• Chopra G, Singh G. A study of job satisfaction among doctor in ESI Corporation,
Delhi. Hospital Administration 1992:29:30-6.
240
• Fifth – cozens J. individual and organizational predictor of depression. Br jour Gen
Prac 1999:48:1647 -51.
• Huby G, Gerry M, McKinstry B, Porter M, Shawj , Wrate R.Morale among general
practitioner: qualitative study exploring relations between partnership arrangement,
personal style, and work load. BMJ 2002;325;140
• Kmietowicz K. Quarter of GPs wants to quit, BMA survey shows. BMJ 2001; 323;
887.
• Korad Tr, Williams Es , Linzer M.” Measuring physician job satisfaction in a
changing workplace and a challenging environment.” Medical Care 1999:37
(11):1174-82.
• Pathman DE, Konard TR, William ES, Schlecker WE, linzer M. Physician job
satisfaction, job dissatisfaction, and physician turnover. Jour of FAM prac 2002; 5(7):
16-21.
• Rodriguez MJ, Mira JJ Alwarez J, Vatalla J. satisfaction of health care providers and
quality assurance in Spanish hospital. Work and stress 1922/6(3)/229-38
• Sibbald B, Enzer I, Cooper C, Rout U, Sutherland V. GP job satisfaction in 1987,
1900, and 1998: lessons for the future? Fram Prac 2000; 17:364-71.
• Singh p effect of occupational stress and mental health on job satisfaction of nurses.
MA Thesis, Luknow University, 1989.
• Annual Report Ministry of Human Resource Development, Government of India2006-2007.
• Draft Report of Working Group on Higher Education for the XI Plan, Planning Commission,
Government of India (2007)

241
• Selected Educational Statistics 2004-2005 (as on September 2004), Ministry of Human
Resource Development Government of India (2007)
• Agarwal, P (2006), Higher education in India: The need for change. New Delhi, Indian
Council for Research on International Economic Relations. URL:
www.icrier.org/publication/working_papers_180.html.
• Jha: Higher Education in India-Restructuring for increased innovation, Document prepared for
the World Bank, June 2006.
• UGC: Chairman’s Nehru Memorial Lecture, University of Mumbai, Nov.24, 2006 (available
on the Web) UGC Annual Report 2004-05.
• Adams, J.P. (1999). Good Principles, good schools. Thrust for Educational
Leadership, 29(1), 8 – 11.
• Anderson, K (2003, September 12). Few Districts are up to snuff. The free Lance –
star, pp. C1, C4.
• Armstrong, B. C. (2001). School size as a factor in the job satisfaction and locus of
control of high school principals in Missouri. Unpublished doctoral dissertation,
university of Kansas, Lawrence.
• Ary, D., Jacobs, L.C., & Razavieh, A. (2002). Introduction to Research in education
(6th ed.)
• Bayfield A H and Roth H F 1951 “An index of job satisfaction” journal of applied
psychology.
• Barry, D.A (2002). Job satisfaction and leadership style: A study of Michigan high
school principals. Unpublished doctoral dissertation, western Michigan University,
Kalamazoo.

242
• Belmont, CA: Wadsworth. Association of California School Administrators. (2001).
Recruitment and retention of school leaders: a critical state of need. Sacramento:
ACSA
• Best, J.W., & Kahn, J.V. (2003). Research in education (9th edition). Boston: Pearson.
• Blanchflower, D.G., Oswald, J.V. (1993). Well being overtime in Britain and USA.
Hanover, NJ: Dartmouth College.
• Bowran J, Todd K. Job stressors and job satisfaction in a major metropolitan public
EMS service. Prehospital and Disaster Medicine 1999; 14(4):236-9.
• Brady, D.B. (2001). Correlates of job satisfaction among California principals.
Unpublished doctoral dissertation, university of Southern California, Los Angeles.
• Brandt, R. (1987). On leadership and student achievement: a conversation with
Richard Andrews. Educational Leadership, 45(9), 12 – 16.
• Brayfield A, rothe HH. An index of job satisfaction. Journal of applied psychology
1952; 35:307-11.
• Bridges, R.L. (1995). The relationship of job satisfaction with ten independent
variables: A study of Arkansas, Fayetteville.
• Brogan, G.B. (2003). Job satisfaction of Idaho high school principals. Unpublished
doctoral dissertation, Idaho State University, Boise.
• Bruce, W.M., & Blackburn, J.W. (1992). Balancing job satisfaction and performance.
Westport.
• Buchbinder RN , Wilson M, Melick CF, power NR> Primary care physician job
satisfaction and turnover. amer jour of managed care 2001;7(7) :16-21.

243
• Calnan m. wain wright C, forsythe M, wall B, Almond S. Mental health and stress in
the workplace; the case of general practice in the UK. Soc sci MED 2001; 52:499-
507.
• Chopra G, Singh G. A study of job satisfaction among doctor in ESI Corporation,
Delhi. Hospital Administration 1992:29:30-6.
• Fifth – cozens J. individual and organizational predictor of depression. Br jour Gen
Prac 1999:48:1647 -51.
• Huby G, Gerry M, McKinstry B, Porter M, Shawj , Wrate R.Morale among general
practitioner: qualitative study exploring relations between partnership arrangement,
personal style, and work load. BMJ 2002;325;140
• Kmietowicz K. Quarter of GPs wants to quit, BMA survey shows. BMJ 2001; 323;
887.
• Korad TR, Williams Es, Linzer M.” Measuring physician job satisfaction in a
changing workplace and a challenging environment.” Medical Care 1999:37
(11):1174-82.
• Pathman DE, Konard TR, William ES, Schlecker WE, linzer M. Physician job
satisfaction, job dissatisfaction, and physician turnover. Jour of fam prac 2002; 5(7):
16-21.
• Rodriguez MJ, Mira JJ Alwarez J, Vatalla J. satisfaction of health care providers and
quality assurance in Spanish hospital. Work and stress 1922/6(3)/229-38
• Sibbald B, Enzer I, Cooper C, Rout U, Sutherland V. GP job satisfaction in 1987,
1900, and 1998: lessons for the future? Fram Prac 2000; 17:364-71.
244
• Singh p effect of occupational stress and mental health on job satisfaction of nurses.
MA Thesis, Luknow University, 1989.
Top Related