


Languages
Pages
Legal

Utah Department of Environmental Quality
Sampling and Analysis Plan
Statewide PFAS Monitoring Phase I: Drinking Water Systems
October 2020
Version 1.0
Utah Department of Environmental Quality
195 N 1950 W
Salt Lake City, UT 84116
PFAS Phase II SAP - DRAFT Version 9.0.9
i
Table of Contents
List of Tables .................................................................................................................................. iii
List of Figures ................................................................................................................................ iii
Acronyms/Abbreviations ............................................................................................................... iv
1.0 Introduction .......................................................................................................................... 1
2.0 Objectives and Design of Investigation ............................................................................... 2
2.1 Data Quality Objectives .................................................................................................... 5
2.1.1 Problem Statement ................................................................................................... 5
2.1.2 Project Goals ............................................................................................................. 5
2.1.3 Project Boundaries .................................................................................................... 6
2.1.4 Analytic Approach....................................................................................................10
2.1.5 Decision Criteria ...................................................................................................... 12
3.0 Special Precautions and Safety Plan for PFAS ................................................................... 12
3.1 Health and Safety ............................................................................................................ 12
4.0 Field Sampling Methods and Documentation .................................................................... 13
4.1 Special Training Requirements ....................................................................................... 13
4.2 General Sample Collection Considerations ..................................................................... 13
4.2.1 Minimize Background PFAS Contamination .......................................................... 13
4.3 Field Collection Protocols by Sample Type ..................................................................... 16
4.3.1 Finished Drinking Water ......................................................................................... 17
4.3.2 Groundwater ............................................................................................................ 17
4.4 Equipment Decontamination .......................................................................................... 18
4.5 Field QC samples ............................................................................................................. 18
4.6 Field Sampling Documentation ...................................................................................... 19
4.6.1 Data Reporting Elements ....................................................................................... 20
4.6.2 Sample Bottle Labeling ............................................................................................ 21
4.7 Field Sampling work flow............................................................................................... 22
4.8 Sampling Complications and Corrective Actions........................................................... 22
5.0 Project Team and Responsibilities .................................................................................... 23
6.0 Data Management .............................................................................................................. 23
7.0 Laboratory Sample Handling Procedures ......................................................................... 24
7.1 Sample Shipping ............................................................................................................ 24
8.0 Analytical Methods and Laboratory Documentation ........................................................ 25
8.1.1 Identification and Control of Sample Matrix Effects ............................................. 26
9.0 Project Quality Control Requirements .............................................................................. 27
PFAS Phase II SAP - DRAFT Version 9.0.9
ii
9.1 Field QC Activities .......................................................................................................... 28
9.1.1 Field Replicates ....................................................................................................... 28
9.1.2 Field Blanks ............................................................................................................ 29
9.1.3 Equipment Blanks .................................................................................................. 29
9.2 Laboratory QC Activities ................................................................................................ 29
9.2.1 Field Quality Control Samples ................................................................................ 30
9.2.2 Laboratory Quality Control Samples ...................................................................... 30
9.3 Data Qualifiers ............................................................................................................... 32
9.4 Data Quality Indicators .................................................................................................. 33
10.0 Data Analysis, Record Keeping, and Reporting Requirements ......................................... 35
10.1 Project Record Keeping .................................................................................................. 35
11.0 Schedule and Budget ......................................................................................................... 35
11.1 Schedule ......................................................................................................................... 35
11.2 Estimated Costs .............................................................................................................. 36
12.0 Site List .............................................................................................................................. 37
13.0 Works Cited ....................................................................................................................... 39
Field Sampling SOP .................................................................. Error! Bookmark not defined.
Final Sampling Location List (Drinking Water Provider and Sampling Locations) ............ Error!
Bookmark not defined.
14.0 Quality Assurance Project Plan for Division of Water Quality Monitoring Activities
Error! Bookmark not defined.
PFAS Phase II SAP - DRAFT Version 9.0.9
iii
List of Tables
Table 1. Summary of Data Quality Objectives ........................................................................................ 2
Table 2. UCMR3 (Six Perfluorinated Compounds) ............................................................................... 5
Table 3. Drinking water sampling scenarios. Scenario 4 is the targeted sample population. ........ 9
Table 4. Allowable and Prohibited Materials for Sampling Equipment .......................................... 14
Table 5. Allowable and Prohibited Personal Field Gear .................................................................... 14
Table 6. Allowable and Prohibited Personal-care and Decontamination Products ....................... 15
Table 7. Minimum Data Reporting Elements from Field Records ................................................... 21
Table 8. Sample Container Requirements ........................................................................................... 24
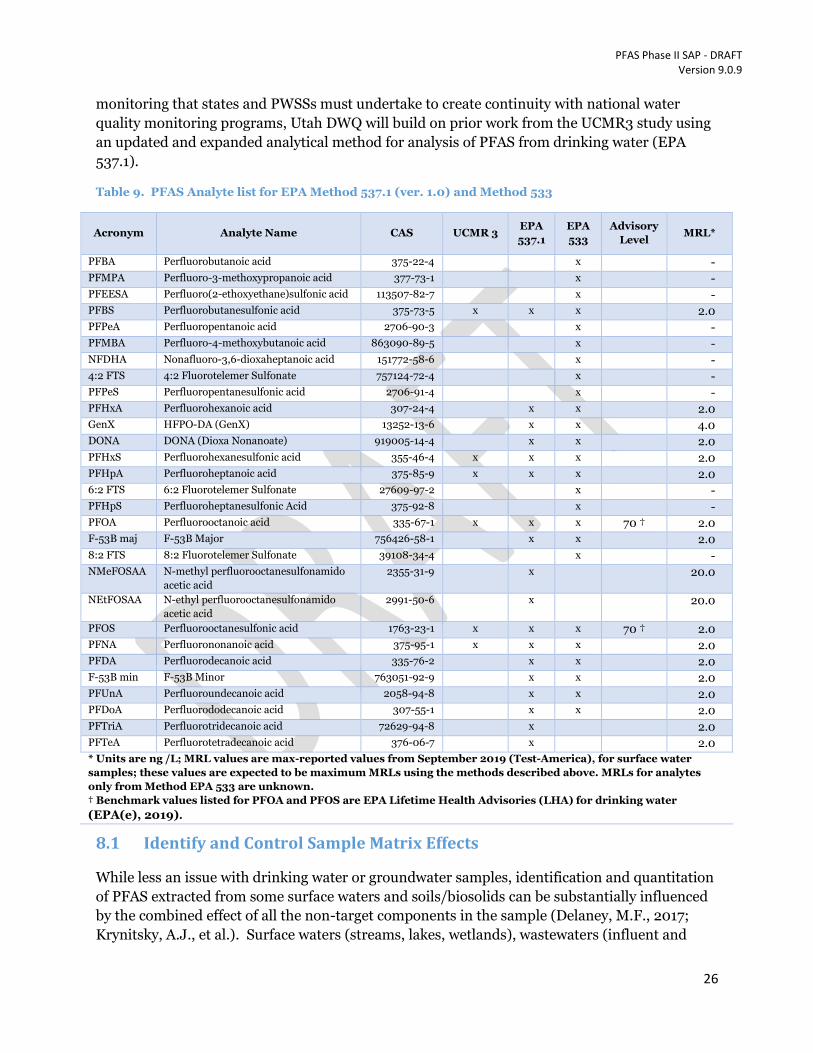
Table 9. PFAS Analyte list for EPA Method 537.1 (ver. 1.0) and Method 533 ................................ 26
Table 10. Data Review Qualifiers .......................................................................................................... 32
Table 11. Data Quality Indicators: Definitions, Criteria and Goals .................................................. 33
Table 12. Phase 1 Schedule ..................................................................................................................... 36
Table 13. Summary of Estimated Costs ................................................................................................ 37
List of Figures
Figure 1. Locations of known or potential commercial use of PFAS ..............................................7
Figure 2. Variability in benchmark values for PFOA and PFOS for safe drinking water ............. 11
Figure 3. Decision flowchart for evaluating PFAS sample results………………………..……...………..38

PFAS Phase II SAP - DRAFT Version 9.0.9
iv
Acronyms/Abbreviations
µg Microgram
AFFF Aqueous Fire-Fighting Foam
ASTM American Society for Testing and Materials
ATSDR Agency for Toxic Substances and Disease Registry
CERCLA Comprehensive Environmental Response, Compensation, and Liability Act
CWA Clean Water Act
COC Chain of Custody
DDW Division of Drinking Water
DEQ Department of Environmental Quality
DERR Division of Environmental Response and Remediation
DOD Department of Defense
DOH Department of Health
DPM Designated Project Manager
DQO Data Quality Objectives
DWQ Division of Water Quality
EDD Electronic Data Deliverable
EPA Environmental Protection Agency
EQBK Equipment blank
ETFE Ethylene Tetrafluoroethylene
FB Field blank
FEP Fluorinated Ethylene Propylene
FRB Field Reagent Blanks
HA Health Advisory
HAFB Hill Air Force Base
HDPE High density polyethylene
ITRC Interstate Technology and Regulation Council
LC-MS/MS Liquid Chromatography Tandem-Mass Spectrometry
LCS Laboratory Control Sample
LCSD Laboratory Control Sample Duplicate
LDPE Low Density Polyethylene
LFB Laboratory Fortified Blank
LFSM Laboratory Fortified Sample Matrix
LHA Lifetime Health Advisory
LRB Laboratory Reagent Blank
LS Laboratory Spike
MB Method Blank
MDL Minimum Detection Limit
MRL Minimum Reporting Limit
MRM Multiple Reaction Monitoring
MS Matrix Spike
MSD Matrix Spike Duplicate
NAICS North American Industry Classification System
PFAAs Perfluoroalkyl acids, as carboxylates
PFAS Phase II SAP - DRAFT Version 9.0.9
v
PFAS Per- and Polyfluoroalkyl Substances
PFBS Perfluorobutane Sulfonate
PFCAs Perfluoroalkyl Carboxylates
PFHpA Perfluoroheptanoic acid
PFHxS Perfluorohexanesulfonic acid
PFNA Perfluorononanoic Acid
PFOA Perfluorooctanoic Acid
PFOS Perfluorooctane sulfonic acid
PDF Portable Document Format
PPE Personal Protective Equipment
PPE Polypropylene containers
ppt Parts per trillion
PTFE Teflon, Polytetrafluoroethylene
PVC Ployvinyl chloride
PVDF Polyvinylidene Fluoride
PWSS Public Water Supply System
QA Quality Assurance
QAPP Quality Assurance Project Plan
QC Quality Control
RCRA Resource Conservation and Recovery Act
RPD Relative Percent Difference
RV Result Values
SAP Sampling Analysis Plan
SOP Standard Operating Procedures
SDWA Safe Drinking Water Act
SPE Solid-Phase Extraction
SURR Surrogate Recovery
TB Trip Blank
TSCA Toxic Substances Control Act
U.S. United States of America
UCMR Unregulated Contaminant Monitoring Rule
UCMR3 Third Unregulated Contaminant Monitoring Rule
UPCC Utah Poison Control Center
UTANG Utah Air National Guard
WMRC Division of Waste Management and Radiation Control
XLSX File extension for Microsoft Excel spreadsheet format
PFAS Phase II SAP - DRAFT Version 9.0.9
1
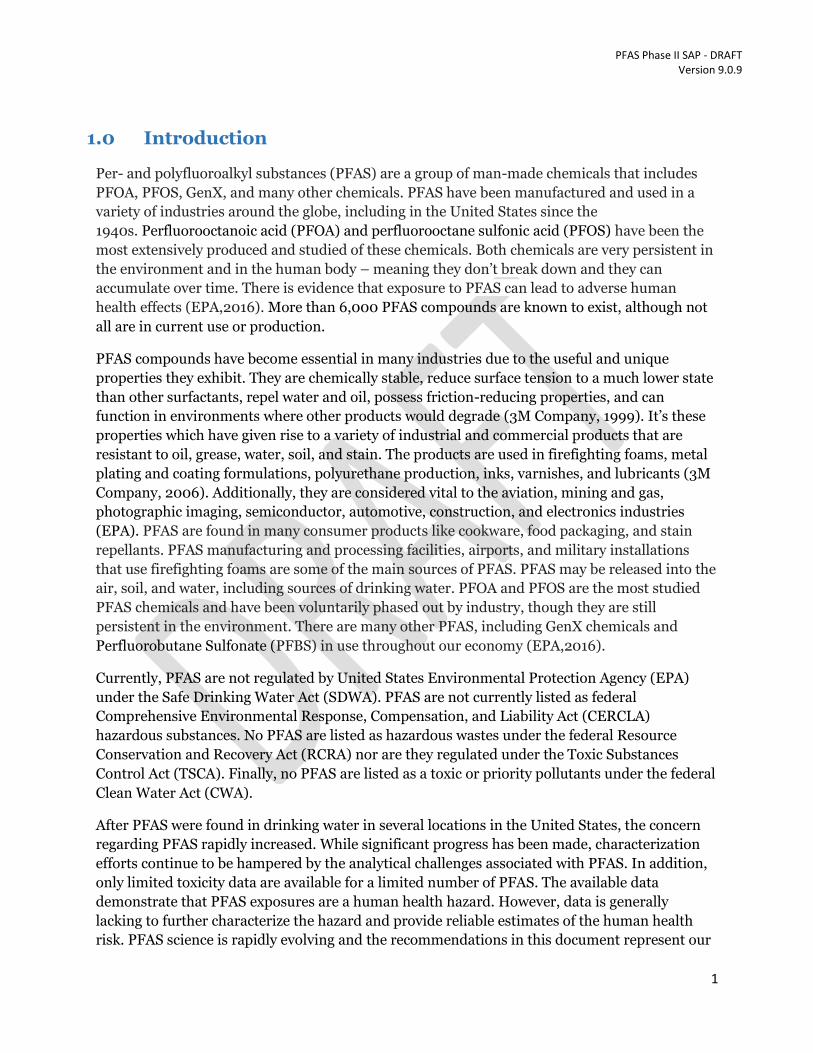
1.0 Introduction
Per- and polyfluoroalkyl substances (PFAS) are a group of man-made chemicals that includes
PFOA, PFOS, GenX, and many other chemicals. PFAS have been manufactured and used in a
variety of industries around the globe, including in the United States since the
1940s. Perfluorooctanoic acid (PFOA) and perfluorooctane sulfonic acid (PFOS) have been the
most extensively produced and studied of these chemicals. Both chemicals are very persistent in
the environment and in the human body – meaning they don’t break down and they can
accumulate over time. There is evidence that exposure to PFAS can lead to adverse human
health effects (EPA,2016). More than 6,000 PFAS compounds are known to exist, although not
all are in current use or production.
PFAS compounds have become essential in many industries due to the useful and unique
properties they exhibit. They are chemically stable, reduce surface tension to a much lower state
than other surfactants, repel water and oil, possess friction-reducing properties, and can
function in environments where other products would degrade (3M Company, 1999). It’s these
properties which have given rise to a variety of industrial and commercial products that are
resistant to oil, grease, water, soil, and stain. The products are used in firefighting foams, metal
plating and coating formulations, polyurethane production, inks, varnishes, and lubricants (3M
Company, 2006). Additionally, they are considered vital to the aviation, mining and gas,
photographic imaging, semiconductor, automotive, construction, and electronics industries
(EPA). PFAS are found in many consumer products like cookware, food packaging, and stain
repellants. PFAS manufacturing and processing facilities, airports, and military installations
that use firefighting foams are some of the main sources of PFAS. PFAS may be released into the
air, soil, and water, including sources of drinking water. PFOA and PFOS are the most studied
PFAS chemicals and have been voluntarily phased out by industry, though they are still
persistent in the environment. There are many other PFAS, including GenX chemicals and
Perfluorobutane Sulfonate (PFBS) in use throughout our economy (EPA,2016).
Currently, PFAS are not regulated by United States Environmental Protection Agency (EPA)
under the Safe Drinking Water Act (SDWA). PFAS are not currently listed as federal
Comprehensive Environmental Response, Compensation, and Liability Act (CERCLA)
hazardous substances. No PFAS are listed as hazardous wastes under the federal Resource
Conservation and Recovery Act (RCRA) nor are they regulated under the Toxic Substances
Control Act (TSCA). Finally, no PFAS are listed as a toxic or priority pollutants under the federal
Clean Water Act (CWA).
After PFAS were found in drinking water in several locations in the United States, the concern
regarding PFAS rapidly increased. While significant progress has been made, characterization
efforts continue to be hampered by the analytical challenges associated with PFAS. In addition,
only limited toxicity data are available for a limited number of PFAS. The available data
demonstrate that PFAS exposures are a human health hazard. However, data is generally
lacking to further characterize the hazard and provide reliable estimates of the human health
risk. PFAS science is rapidly evolving and the recommendations in this document represent our
PFAS Phase II SAP - DRAFT Version 9.0.9
2
current understanding. As the science advances and more information become available, the
recommendations will be modified as appropriate.
2.0 Objectives and Design of Investigation
The Utah Department of Environmental Quality (DEQ) convened an internal workgroup in 2019
to develop a monitoring strategy to address potential PFAS contamination in Utah. The
workgroup consists of representatives from the Utah Department of Environmental Quality
(DEQ) Divisions of Drinking Water (DDW), Water Quality (DWQ), Waste Management and
Radiation Control (WMRC), Environmental Response and Remediation (DERR), and the Utah
Department of Health Bureau of Epidemiology. Its primary purpose is development of an
ongoing, adaptive monitoring and reporting strategy to determine whether Utah’s drinking
water, groundwater, surface waters, or land is contaminated by PFAS, and if so, whether this
contamination threatens public health and/or the environment. Initial efforts will focus on
potential human exposure to PFAS from areas where these compounds are known to have been
used or disposed.
The workgroup compiled information on PFAS use in Utah and identified potential sources of
contamination. DEQ will sample selected drinking water sources that pose the highest potential
risk of contamination to determine if PFAS are present. Decisions regarding additional actions
will be made according to each division’s regulatory authorities.
A systematic planning process ensures that the data collected support the objectives of the
project and make efficient use of available resources and funding. DEQ will use the Data Quality
Objective (DQO) process to determine the type, quantity, and quality of data needed to reach
defensible decisions and make credible estimates. DQO begins by stating the problem or issue
under investigation, identifying key members of the project team and their roles, and selecting.
specific goals for the investigation. . The project scope establishes boundaries and identifies key
constraints. The analytic approach describes how the project will be implemented, and the
decision criteria describe how the data will be interpreted and actions implemented. The DQO is
summarized in Table 1.
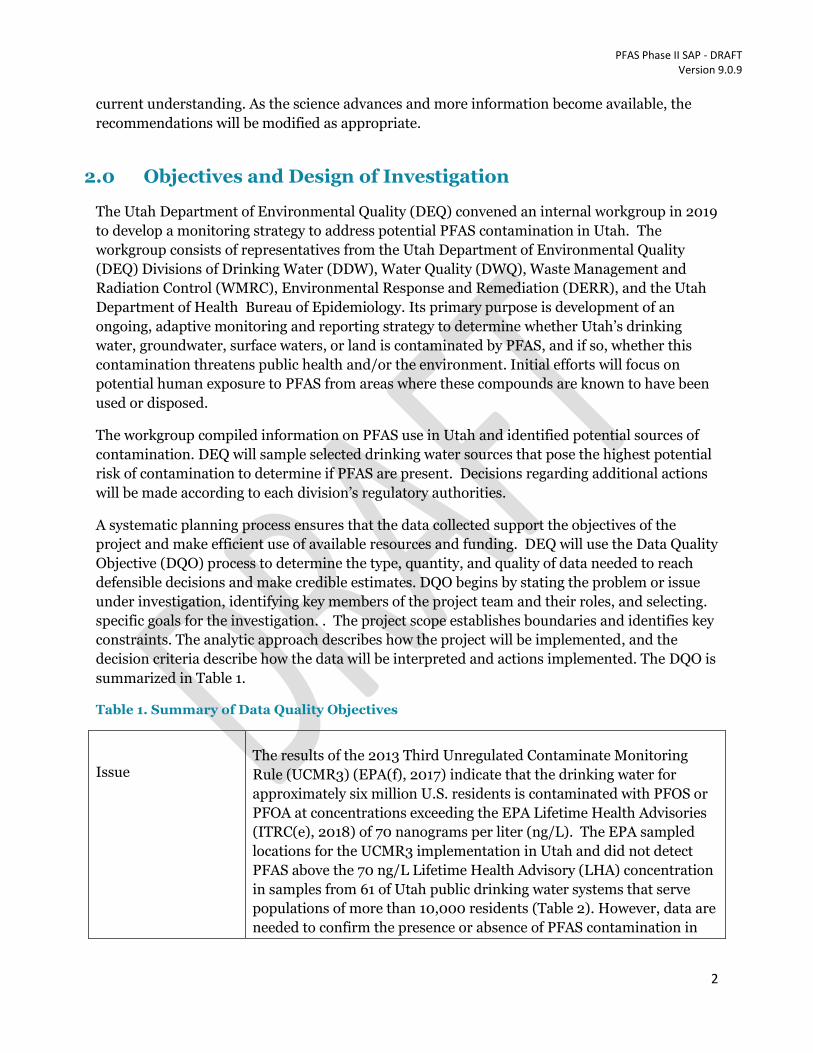
Table 1. Summary of Data Quality Objectives
Issue The results of the 2013 Third Unregulated Contaminate Monitoring
Rule (UCMR3) (EPA(f), 2017) indicate that the drinking water for
approximately six million U.S. residents is contaminated with PFOS or
PFOA at concentrations exceeding the EPA Lifetime Health Advisories
(ITRC(e), 2018) of 70 nanograms per liter (ng/L). The EPA sampled
locations for the UCMR3 implementation in Utah and did not detect
PFAS above the 70 ng/L Lifetime Health Advisory (LHA) concentration
in samples from 61 of Utah public drinking water systems that serve
populations of more than 10,000 residents (Table 2). However, data are
needed to confirm the presence or absence of PFAS contamination in
PFAS Phase II SAP - DRAFT Version 9.0.9
3
Utah smaller drinking water systems.
Project Goals The project has three primary goals:
Determine if PFAS are present in a selection of Utah’s 489 community water systems.
Communicate how these results impact the public’s health.
Provide drinking water providers and other regulated entities with information to mitigate impacts to the public from PFAS contamination.
Team Members and
Roles
Utah DEQ Division of Drinking Water
Outreach and coordination with drinking water providers Division of Water Quality
Coordination and sample collection/analysis Utah Department of Health
Outreach and consultation Utah Poison Control
Consultation and reporting Drinking water providers
Coordination, sampling assistance, outreach and mitigation
Study Boundaries Phase 1 Target Population: The study targets Utah’s community
(public) drinking water systems and selected private wells.
Time: A sampling plan that can be developed and implemented rapidly
is preferred because the safety of drinking water is a high priority of the
study.
Resources: The initial sampling plan must be executable using the
available existing resources.
Target Analytes: The analyses must generate data that are accurate
and precise. Commercial laboratories have modified and validated EPA
Methods 537.1 and 533 for selected PFAS. Analytical methods continue
to evolve, and the number of target PFAS will be reviewed and
potentially revised and validated prior to implementation of this plan.
Target Levels: No EPA maximum contaminant level (MCL) is
available for any PFAS. EPA Lifetime Health Advisories (LHAs) are
available for both PFOA and PFOS. The EPA LHAs for PFOS and PFOA
of 0.07 µg/L (70 ng/L) will be used as comparison values for the 32
PFAS tested. If EPA or the Agency for Toxic Substances and Disease
Registry (ATSDR) develops drinking water recommendations for
additional PFAS, these new values will be incorporated into the
comparisons.

PFAS Phase II SAP - DRAFT Version 9.0.9
4
Analytic Approach Drinking water samples will be analyzed once for PFAS compounds
using a modified version of EPA Methods 537.1 and 533.
Decision Criteria Immediate resampling will occur if PFAS are detected above MDL. If
PFAS are not detected, resampling is unnecessary. Immediate actions
are required if any PFAS are confirmed to be present. If any individual
PFAS concentration or PFAS concentrations combined exceed 70 ng/L,
the public water system will be notified and appropriate actions will be
taken, in consultation with the LHD and DOH.

PFAS Phase II SAP - DRAFT Version 9.0.9
5
2.1 Data Quality Objectives
2.1.1 Problem Statement
The results from the 2013 UCMR3 (EPA(f), 2017) indicate that the drinking water for
approximately six million U.S. residents is contaminated with PFOS or PFOA at concentrations
exceeding the EPA Lifetime Health Advisory level (ITRC(e), 2018). In other states, public and
private drinking water have been contaminated with PFAS at locations where PFAS were
manufactured or where large quantities of PFAS were used in other manufacturing processes.
Of the six specific PFAS examined in Utah during UCMR3 monitoring (Table 2), none were
detected in the samples collected from 61 public drinking water systems above the reference
concentration of 7.0 ng/L. These samples were collected between 2013 and 2016 from systems
serving populations greater than 10,000 residents, representing approximately 2.5 million
people, or 86% of Utah’s population.
Table 2. UCMR3 (Six Perfluorinated Compounds)
Contaminant CAS
Registry
Number1
Minimum
Reporting
Level
Sampling
Points2
Analytical
Methods
Perfluorooctanesulfonic acid (PFOS) 1763-23-1 4.0 ng/L EPTDS EPA 537 Rev 1.1
Perfluorooctanoic acid (PFOA) 335-67-1 2.0 ng/L EPTDS EPA 537 Rev 1.1
Perfluorononanoic acid (PFNA) 375-95-1 2.0 ng/L EPTDS EPA 537 Rev 1.1
Perfluorohexanesulfonic acid (PFHxS) 355-46-4 3.0 ng/L EPTDS EPA 537 Rev 1.1
Perfluoroheptanoic acid (PFHpA) 375-85-9 1.0 ng/L EPTDS EPA 537 Rev 1.1
Perfluorobutanesulfonic acid (PFBS) 375-73-5 9.0 ng/L EPTDS EPA 537 Rev 1.1
Utah’s remaining 428 public water supply systems (PWSSs) have not been sampled. This
includes two new systems that serve more than 10,000 people, 52 medium systems, 134 small
systems, and 240 very small systems. Data are needed to confirm that these public drinking
water systems are not contaminated with PFAS at levels dangerous to long-term human health.
Analytical methods for PFAS continue to evolve rapidly. Currently, validated analytical methods
are available for 32 PFAS by EPA 537.1 and 25 PFAS by EPA 533. The Utah samples collected
between 2013 and 2016 were analyzed for six PFAS. Data are currently unavailable for
additional PFAS for the 61 drinking water systems sampled under the 2013 UCMR3 monitoring.
2.1.2 Project Goals
DEQ has identified three goals for the sampling project:
Determine if PFAS contamination is present in public drinking water systems identified
as highest priority for sampling due to the potential risk of PFAs contamination.
PFAS Phase II SAP - DRAFT Version 9.0.9
6
Communicate these results along with any associated health concerns to drinking water
providers, health officials, and the public.
Communicate these analytical results to the water providers and regulated entities so
they can take additional measures, such as engineering or administrative controls, to
reduce PFAS exposure from drinking water.
The Division of Drinking Water (DDW) is leading this particular phase of PFAS monitoring.
DDW has the authority to implement the Safe Drinking Water Act (SDWA) in Utah and
implementing any regulatory actions regarding public drinking water. The division is
responsible for all DEQ communication and coordination with the water system operators and
the public.
The Division of Water Quality (DWQ) routinely implements similar sampling protocols for
Utah’s streams and reservoirs, including coordination with analytical laboratories. DWQ is the
primary author of this SAP. DWQ has primary responsibility for coordinating with the analytical
laboratories, assembling appropriate sampling gear, recommending appropriate sampling
procedures, conducting or overseeing the sampling, and ensuring that the samples are delivered
to the laboratory under appropriate chain of custody and environmental conditions. DWQ will
validate sample results and prepare a summary to distribute to partner agencies and drinking
water providers..
The Bureau of Epidemiology, Utah Department of Health (DOH), is responsible for assessing
the potential human health risks for PFAS. DOH will coordinate these efforts with DDW, the
Utah Poison Control Center, and local health departments. DOH will provide recommendations
to the public on ways to mitigate or reduce human exposures. The Utah Poison Control Center
will respond to inquiries from the public and health care providers. DWQ is responsible for
coordinating with Poison Control and DOH by sharing anticipated sampling events and sample
results.
2.1.3 Project Boundaries
While it would be beneficial for DEQ to collect PFAS data from all 489 of Utah’s public water
system PWSSs, it is not feasible at this time due to resource limitations. As a result, this SAP will
focus on water supplies near known or suspected sources of PFAS based on DEQ’s analysis of
drinking water sources and their potential for contamination (see Strategy).
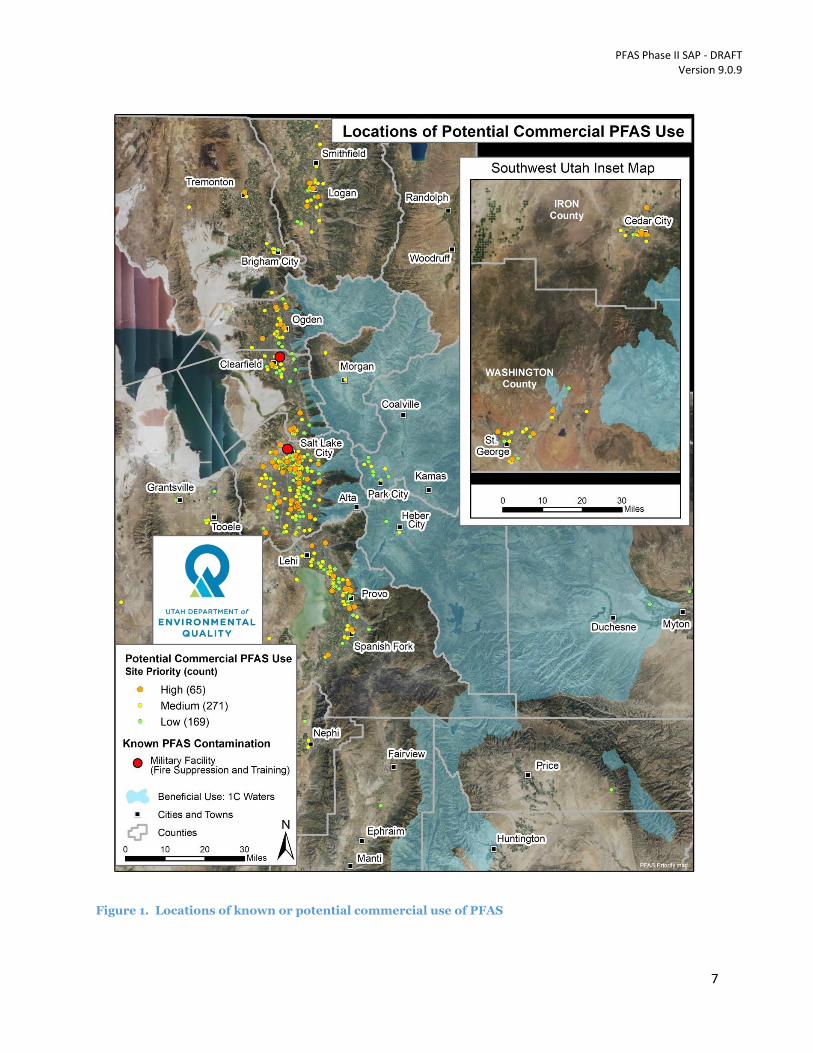
Most drinking water contamination in other states is localized and associated with PFAS
manufacturing facilities, manufacturing facilities where large amount of PFAS were used in a
process, or large quantities of Aqueous Fire Fighting Foam (AFFF) have been released (see
Figure 2). No PFAS manufacturing facilities or manufacturing activities that use large amounts
of PFAS were identified in Utah, but these investigations are incomplete. AFFF has likely been
applied at emergency response sites such as tanker accidents along with repeat applications at
airports, military bases, and petroleum refineries.
PFAS Phase II SAP - DRAFT Version 9.0.9
7
Figure 1. Locations of known or potential commercial use of PFAS
PFAS Phase II SAP - DRAFT Version 9.0.9
8
DEQ compiled a list of the North American Industrial Classification Codes (NAICS) for
industries that potentially use PFAS. The businesses were prioritized based on best professional
judgment regarding the likelihood and quantities of PFAS used but the current confidence in
these identifications and prioritizations is low. Confidence may increase in the future by
reviewing existing Utah DEQ Division of Waste Management and Radiation Control (DWMRC)
inspection reports and conducting site visits.
The locations of businesses that may use PFAS were compared to DWQ Class 1C (drinking
water) streams and reservoirs and DDW (groundwater) 15-year -travel -time Source Protection
Zones. With the exception of the upper Jordan River, Class 1C surface waters are not near any
locations expected to be significant sources of PFAS (Error! Reference source not found.).
hile the upper Jordan is protected for drinking water use, it is not currently used as a drinking
water source.
PFAS groundwater contamination has been confirmed at two locations in Utah: the Utah Air
National Guard (UTANG) at the Salt Lake City International Airport and Hill Air Force Base
(HAFB) (Error! Reference source not found.). No Source Protection Zones are located in
he vicinity of the UTANG at the Salt Lake International Airport. HAFB has the potential to affect
some of the Source Protection Zones for HAFB, South Weber Water Conservancy District,
Clearfield, Roy, and the Weber Basin Water Conservancy District. All of these systems were
previously sampled for the 2013 UCMR3 for the six PFAS compounds.
Additional comparisons to DDW Source Protection Areas identified 101 wells co-located with
higher priority businesses potentially using PFAS. These wells are predominantly located in
urban areas (Error! Reference source not found.). Recharge areas for the drinking water
quifers on the valley floors are in the Wasatch Mountains and secondarily from the benches. On
the valley floors, the drinking water aquifers are confined and protected by thick layers of low-
permeability clay that helps protect the aquifer from surface contamination. In addition, these
areas are served by wastewater collection systems (sewers), further decreasing the likelihood of
drinking water aquifer contamination.
Drinking water may be provided from multiple locations (e.g., different wells) in a Source
Protection Zone. In the case of a centralized treatment plant, samples should be collected where
the water enters the distribution system. Where individual wells or well fields serve the public,
samples should be collected from each unique source where the water enters the distribution
system. The numbers of these sample locations are shown in Error! Reference source not
ound.. The sampling locations were determined by reviewing each system to determine the
number of sample locations needed.
Error! Reference source not found. divides all non-transient PWSSs in Utah into eight
cenarios. The scenarios are intended to support phasing of the implementation because of
resource limitations. Ideally, priority would be based exclusively on the potential for PFAS
contamination. However, as previously discussed, accurately characterizing the potential for
PFAS contamination is uncertain because of a lack of data. Therefore, the scenarios are based
primarily on PWS size and, secondarily, the potential for PFAS contamination. System size is
important because it directly correlates with number of people potentially affected, and larger

PFAS Phase II SAP - DRAFT Version 9.0.9
9
PWSSs are likely to have Source Protection Zones based on the volumes of drinking water
provided. Therefore, PWSSs serving more people are a higher priority under this sampling plan.
Utah’s large and very large PWSSs were previously sampled and PFAS were not detected at
levels above the LHA. The scenarios also consider if the presumed lack of contamination in
these previously sampled PWSSs should be confirmed.
Table 3. Drinking water sampling scenarios. Scenario 4 is the targeted sample population.
Scenario
Number
of
Public
Systems
Number
of
Sample
Locations
1. Sample highest priority locations potentially impacted
by known PFAS contamination located near source
protection zones (Hill AFB, Utah National Guard)
excluding locations sampled for 2013 UCMR3
monitoring.
0 0
2. Sample highest priority (groundwater) source
protection zones based on nearby or known PFAS
contamination (Hill AFB), including locations
sampled for 2013 UCMR3 monitoring.
5 22
3. Sample highest priority locations based on the
location of high priority PFAS businesses located near
source protection zones (groundwater), excluding
locations sampled for 2013 UCMR3 monitoring.
3 5
4. Sample highest priority locations based on the
location of high priority PFAS businesses located near
source protection zones (groundwater), including
locations sampled for 2013 UCMR3 monitoring.
22
76*
5. Repeat 2013 UCMR sampling (all large and very large
systems (serving >10,000)
63 194
6. Sample all medium public water systems (serving
between 3301-10,000 people)
52 [104
estimated]
7. Sample all small public water systems (serving
between 500-3300 people)
134 [201
estimated]
8. Sample all very small public water systems (serving
<500people )
240 [240
estimated]
PFAS Phase II SAP - DRAFT Version 9.0.9
10
*After working with LHDs on locations of private wells in target areas, DEQ will target an
additional 40 private wells for voluntary monitoring for PFAS.
Scenario 1 is based on sampling PWSSs potentially impacted by known PFAS contamination
that have never been sampled for PFAS. Of the two known locations of contamination in Utah,
only HAFB is co-located with Source Protection Zones. All of the potentially affected Source
Protection Zones at HAFB were previously sampled under the UCMR3, so under this scenario,
no sampling is recommended. However, this sampling occurred over five years ago, and since
that time, analytical methods have been developed for up to 32 PFAS from the previous 6 PFAS
for UCMR3.
Scenario 2 identifies five PWSSs that are potentially impacted by HAFB. These five PWSSs
have 22 unique sampling locations where drinking water is distributed to the public.
Scenario 3 is based on sampling Source Protection Zones co-located with businesses most
likely to use PFAS, and locations of known PFAS contamination (Error! Reference source
ot found.) that were not sampled as part of UCMR3 because they serve less than 10,000
people. Five potentially affected PWSSs are identified that were not previously sampled as part
of UCMR3.
Under Scenario 4, if these previously sampled UCMR3 sites are included with the additional
five PWSSs, then 124 samples for 22 PWSSs are required. This is the initial sampling scenario
selected for implementation under this SAP because it addresses PWSSs at highest risk based on
currently available data. In addition to these providers, DWQ will attempt to sample private
wells on a voluntary basis to evaluate PFAS from other groundwater sources in the areas of
concern.
Scenarios 5 through 8 identify the number of PWSSs and number of sampling locations
based on PWS size only. For very small through medium sized PWSSs, the number of unique
sampling locations are estimated using best professional judgment because this information is
not readily available. The estimations are based on the assumption that PWSSs serving smaller
populations are less likely to have multiple unique locations where the drinking water enters the
distribution system. The Source Protection Zones are also likely smaller for the smaller PWSSs
and therefore, less likely to be impacted by contamination. Scenarios 5 through 8 are used to
estimate the resources required to sample all Utah PWSSs or only a portion based on size. For
instance, to sample all Utah’s 489 non-transient PWSSs would require approximately 739
samples. Under Scenario 4, 463 PWSSs would not be sampled, but 38 of these were previously
sampled for UCMR3.
2.1.4 Analytic Approach
The analyses must generate data that are accurate, precise, and defensible. Currently, EPA
Method 537.1 is validated for 18 PFAS. Six of the 18 PFAS were target analytes for the previous
2013 UCMR3 sampling in Utah. The specific PFAS are shown in Table 9. Commercial
laboratories have modified and validated Method 537.1 to quantify 14 additional PFAS, or 32
PFAS Phase II SAP - DRAFT Version 9.0.9
11
total PFAS. EPA Method 533 is validated for 25 PFAS compounds (11 are not covered by 537.1).
Note that over6,000 PFAS are thought to exist.
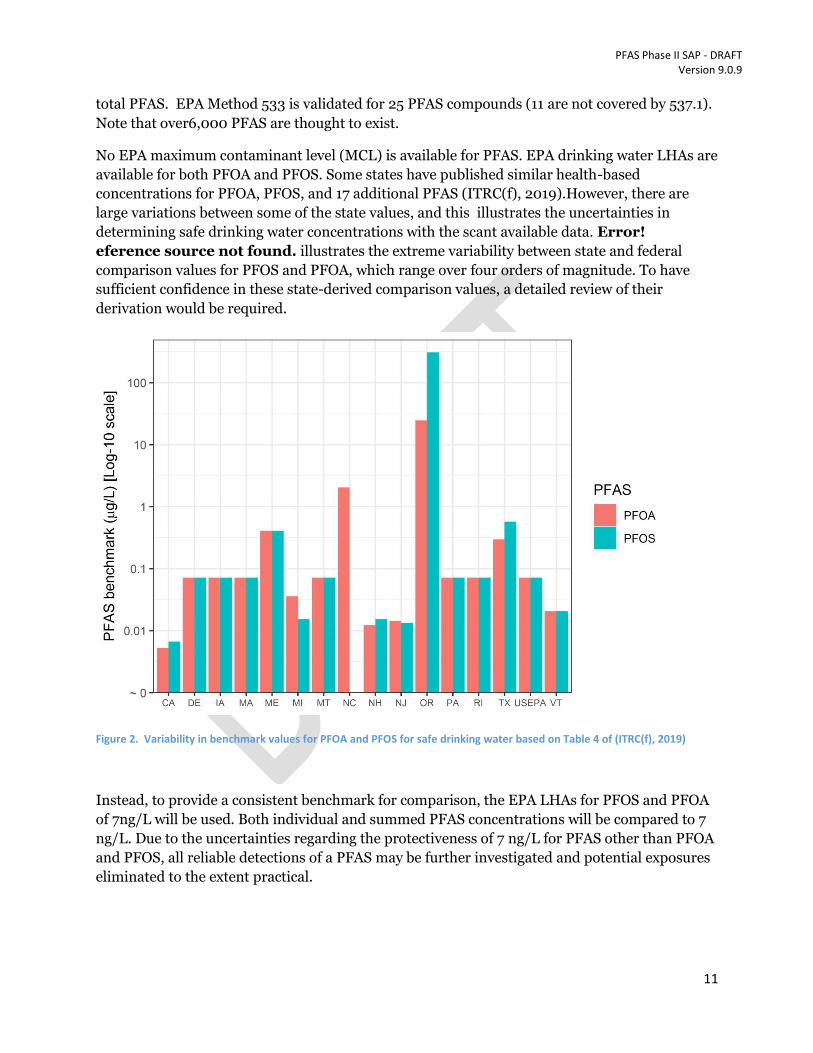
No EPA maximum contaminant level (MCL) is available for PFAS. EPA drinking water LHAs are
available for both PFOA and PFOS. Some states have published similar health-based
concentrations for PFOA, PFOS, and 17 additional PFAS (ITRC(f), 2019).However, there are
large variations between some of the state values, and this illustrates the uncertainties in
determining safe drinking water concentrations with the scant available data. Error!
eference source not found. illustrates the extreme variability between state and federal
comparison values for PFOS and PFOA, which range over four orders of magnitude. To have
sufficient confidence in these state-derived comparison values, a detailed review of their
derivation would be required.
Figure 2. Variability in benchmark values for PFOA and PFOS for safe drinking water based on Table 4 of (ITRC(f), 2019)
Instead, to provide a consistent benchmark for comparison, the EPA LHAs for PFOS and PFOA
of 7ng/L will be used. Both individual and summed PFAS concentrations will be compared to 7
ng/L. Due to the uncertainties regarding the protectiveness of 7 ng/L for PFAS other than PFOA
and PFOS, all reliable detections of a PFAS may be further investigated and potential exposures
eliminated to the extent practical.
PFAS Phase II SAP - DRAFT Version 9.0.9
12
2.1.5 Decision Criteria
A reliable detection of any PFAS will trigger immediate resampling due to the potential for PFAS
contamination, not representative of the sample, to occur during sampling or in the laboratory.
After the 2nd sample is collected, a 3rd sample will be collected more than 2 weeks later and less
than 2 months from the second sample. The purpose of the third sample is to confirm the results
of the 2nd sample, in particular, if the result of the 2nd sample is non-detect. If PFAS
concentrations combined exceed 0.07 µg/L, the affected consumers, UDOH, LHDs and the Utah
Poison Control Center will be notified. DDW will work with drinking water providers to identify
the specific source of the PFAS.
DDW will assist drinking water providers to determine the specific source of PFAS detected at
concentrations less than 0.07 µg/L. This might include, but is not limited to, actions such as
consumer notification, consumer advice, or consultation from the Utah Poison Control Center
(UPCC).
3.0 Special Precautions and Safety Plan for PFAS
3.1 Health and Safety
Hazardous conditions can exist in any environment. When unfavorable conditions are present
at the time of sampling, field personnel should reschedule the site visit. If hazardous weather
conditions arise, such as lightning or high winds, during sampling, personnel should cease
sampling and move to a safe location.
Proper safety precautions shall be observed when traveling to and from sites and when
collecting environmental samples. All field crews shall be equipped with safety equipment such
as proper field gear, gloves, first aid kits, cellular phone, etc. Field personnel should follow
specific health and safety practices when operating watercraft and working on, in, or around
water, along possibly steep or unconsolidated banks of surface waters, or when sampling on the
property of drinking water or wastewater treatment facilities.
When collecting PFAS-related environmental samples, bottles may contain preservatives as
required by a particular method (e.g. TRIZMA in sampling bottles for PFAS for finished
(chlorinated) drinking water, following EPA Method 537.1) and will commonly be prepared by
the contracted lab. During packing and handling of bottles, be sure that caps are tightly sealed.
Take care to avoid contact with preservative. If minor skin contact occurs, rinse with copious
amounts of water. If major skin or internal contact occurs, seek medical attention. Field crews
should have the supplies and training to provide first aid in the event of an injury or illness.
Wear gloves and be sure to wash hands prior to and after sampling, especially when working in
potentially contaminated areas.
PFAS Phase II SAP - DRAFT Version 9.0.9
13
4.0 Field Sampling Methods and Documentation
This section summarizes the sample collection workflow and provides reference to standard
operating procedures (SOPs) and other protocols, primarily from drinking water systems, and
incorporates the Data Quality Objectives outlined in Section 0.
4.1 Special Training Requirements
Field crews will review this SAP and all applicable SOPs prior to conducting any sample
collection activities and acknowledge they have done so via a signature page kept on file by the
field-crew lead or manager of the Monitoring Section. Personnel performing water sampling
must be familiar with SOPs for sampling techniques, safety procedures, proper sample handling,
shipping, and recordkeeping.
4.2 General Sample Collection Considerations
Because of the ubiquity and low ambient concentrations of PFAS in the environment
(micrograms per liter (µ/L), special precautions are required during field procedures,
particularly between field personnel and sample-collection materials, to:
Avoid cross-contamination between samples
Reduce the chance of false positive detections, and
Minimize the potential for elevated detection limits because of background
contamination.
4.2.1 Minimize Background PFAS Contamination
To minimize background PFAS contamination to samples, sampling crews shall review
materials and sampling protocols,(including this SAP and associated SOPs, prior to any sample
collection event. Personnel should take care to ensure there is no transfer of PFAS from
sampling gear or personal protective equipment to field samples. Cross-contamination could
occur from sun screen and insect repellent, personal hygiene and personal care products, or
food packaging.
In general, field-gear and sampling equipment that contain the following materials should not
be used during field sampling, since these materials could contaminate samples with PFAS:
Teflon®, polytetrafluoroethylene (PTFE)
Common water-proof coatings such as durable water repellent (DWR) or fabric softener
containing PFAS
Fluorinated ethylene propylene (FEP)
Ethylene tetrafluoroethylene (ETFE)
Low-density polyethylene (LDPE) [1]
1 LDPE equipment may be used if prior analysis has confirmed equipment blanks to be PFAS-free; LDPE does not
include PFAS as raw material, but may contain PFAS from the manufacturing process. Additional detailed
information on the potential for PFAS contamination from particular materials is available from the Michigan DEQ
General PFAS Sampling Guidance (Michigan DEQ, 2018).

PFAS Phase II SAP - DRAFT Version 9.0.9
14
Polyvinylidene fluoride (PVDF)
Pipe thread compounds and tape (e.g., Teflon® tape)
Three tables below identify some common allowableand prohibited materials for sampling
equipment, field gear, and sunscreen/personal care products to guide field crews prior to
sampling. A Quick Reference Guide is available from Michigan DEQ’s PFAS response guidance
(Michigan DEQ, 2018)1, and some field gear and sampling equipment materials have been
examined as well (Danish Environmental Protection Agency, 2015) However, this is not a
guarantee that the following are PFAS-free.
Table 4. Allowable and Prohibited Materials for Sampling Equipment
Sampling Equipment, Sample Storage and Sample Preservation
Allowable Prohibited HDPE (High-density polyethylene) [sample bottles;
RECOMMENDED CONTAINER]
Items or materials containing any fluoropolymer
LDPE (Low-density polyethylene) [tubing] PTFE (Polytetrafluoroethylene) lined bottles or
bottle-caps PPE (Polypropylene) [sample bottles]
Stainless steel
Glass jars
Wet ice Chemical or blue ice
LDPE re-sealable storage bags
Table 5. Allowable and Prohibited Personal Field Gear
Field Gear and Personal Equipment (clothing, boots, rain gear, etc.)
Allowable Prohibited
Synthetic or 100% cotton clothing, washed without
Fabric Softeners
New or unwashed clothing
Items recently washed with fabric softeners or
stain-resistant chemicals
Items made with polyurethane, PVC (polyvinyl
chloride), wax-coated fabrics, rubber/neoprene,
uncoated Tyvek®
Items that contain Gore-Tex™ or other water-
resistant synthetics, including coated Tyvek
Powder-less nitrile gloves Latex gloves
Powder-less nitrile gloves should be changed frequently and any time there is an opportunity for
cross-contamination. For example:
PFAS Phase II SAP - DRAFT Version 9.0.9
15
Before sample collection
While handling a sample, including Quality Assurance/Quality Control (QA/QC)
samples, such as field reagent blanks (field blanks)
Handling of any non-dedicated sampling equipment (i.e., used for more than one
specific location), contact with non-decontaminated surfaces, or when deemed necessary
Because biological hazards (sunburn, mosquitos, ticks, etc.) may be encountered during
sampling, and since many types of sunscreens or insect repellants may contain PFAS in the
product or during manufacture, this project seeks to minimize the potential for PFAS
contamination while maintaining personal safety. The table below identifies a few examples of
sunscreens, insect repellants, and decontamination solutions that have previously been
identified as PFAS-free. However, this is no guarantee, and other products may meet project
sampling goals.
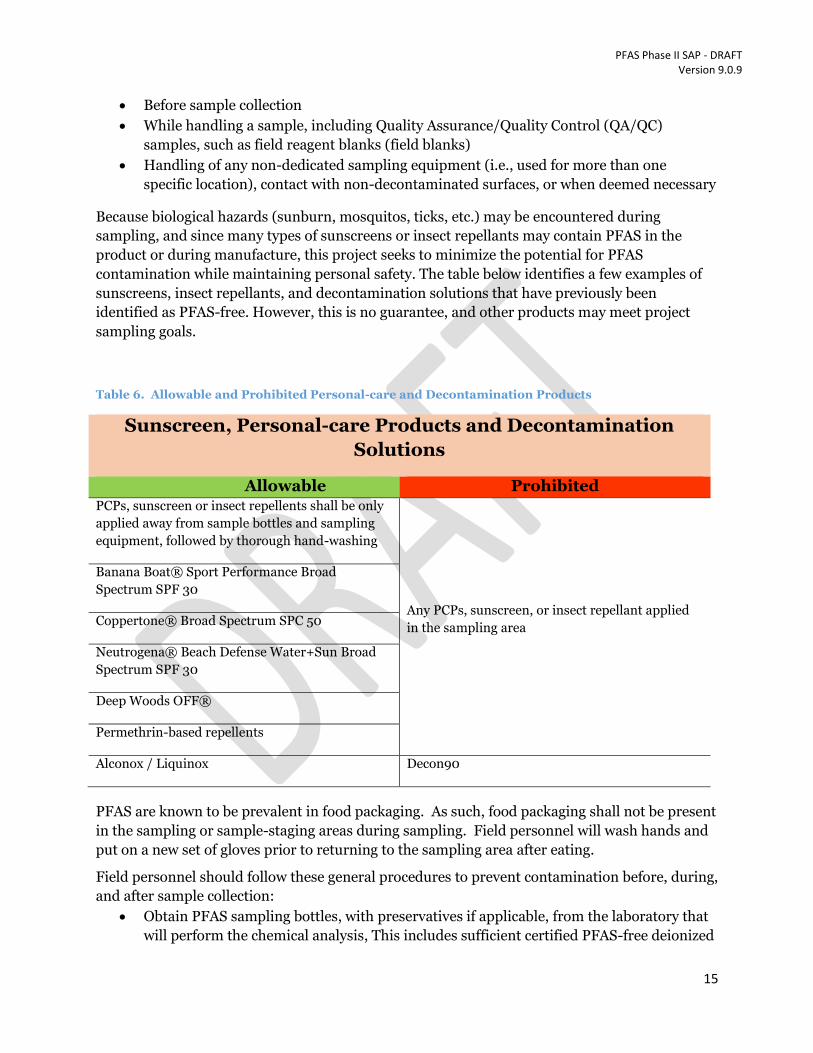
Table 6. Allowable and Prohibited Personal-care and Decontamination Products
Sunscreen, Personal-care Products and Decontamination
Solutions
Allowable Prohibited PCPs, sunscreen or insect repellents shall be only
applied away from sample bottles and sampling
equipment, followed by thorough hand-washing
Any PCPs, sunscreen, or insect repellant applied
in the sampling area
Banana Boat® Sport Performance Broad
Spectrum SPF 30
Coppertone® Broad Spectrum SPC 50
Neutrogena® Beach Defense Water+Sun Broad
Spectrum SPF 30
Deep Woods OFF®
Permethrin-based repellents
Alconox / Liquinox Decon90
PFAS are known to be prevalent in food packaging. As such, food packaging shall not be present
in the sampling or sample-staging areas during sampling. Field personnel will wash hands and
put on a new set of gloves prior to returning to the sampling area after eating.
Field personnel should follow these general procedures to prevent contamination before, during,
and after sample collection:
Obtain PFAS sampling bottles, with preservatives if applicable, from the laboratory that
will perform the chemical analysis, This includes sufficient certified PFAS-free deionized

PFAS Phase II SAP - DRAFT Version 9.0.9
16
(DI) water for use in field blanks (one per site), equipment blanks (when additional
sample collection equipment is required), and trip blanks (may include one per sampling
day)
Wash hands well before leaving the staging area and prior to sampling.
Put on clean (new) powder-less nitrile gloves before collecting samples, handling sample
containers, or handling sampling equipment.
Keep the sample bottle must be kept sealed and open only during sample collection.
Never set the cap down, touch any part of the cap that contacts the bottle, or let anything
touch the rim of the bottle or inside of the cap.
Ensure that no dust or fibers fall into the sample bottle.
Take care that no splashed drops of water from a sink or ground enter the sample bottle,
Fill sample bottle to the neck only; do not let the sample bottle overflow, particularly for
finished drinking water samples. If the bottle overflows, the Trizma preservative will be
flushed out or diluted
Use PFAS-free markers (e.g., fine or ultra-fine point Sharpies®) to label the empty
sample bottle prior to sample collection. Make sure the cap is on the sample bottle and
gloves are changed after bottle labeling. Allow ink to dry completely before proceeding.
Pre-printed labels may also be used.
Cap the bottle and gently agitate by hand until preservative (solid) is dissolved. Do not
reopen the sample bottle.
Double-bag samples in re-sealable LDPE or disposable HDPE bags.
Chill samples chilled on water-ice. Sample temperature must not exceed 10 degrees C
during first 48 hours after collection
Recommended sampling materials and equipment for PFAS (See (DOD(a), 2017)):
HDPE and silicon for tubing, bailers, tape, and plumbing paste
Acetate liners for direct-push technologies
Nitrile gloves (powder-less)
Loose paper with Masonite clipboards
Pens known to be PFAS-free
Bags of ice
Alconox/Liquionox and methanol for decontamination solutions
Laboratory-supplied and verified “PFAS-free” DI water for the trip, field,
decontamination blanks, and decontamination processes
4.3 Field Collection Protocols by Sample Type
Utah’s public drinking water systems are the target group for this project is , as described in
Section 2.0 of this document. The following sub-sections briefly outline procedures for sample
collections from finished (treated) drinking water, groundwater source waters (via wells) and
surface waters (springs, streams, lakes, etc.). Samples from one or more of the above sample
types will be used to assess the level of quantifiable PFAS for that drinking water system.
Because DEQ’s goal is to protect the public from exposure to PFAS-contaminated drinking
water, initial sampling is intended to focus on source water conveyed to public consumers.

PFAS Phase II SAP - DRAFT Version 9.0.9
17
However, the structure of Utah’s public drinking water systems varies across the state, and as
such, specific sampling locations will be determined for each drinking water system on a case-
by-case basis.
Samples of source water from treatment plants can be obtained at the sampling port for each
well. Since the system is continuously operating, minimal flushing will be required and no
special sampling equipment (e.g., pumps or tubing) is expected. However, if the drinking water
treatment system contains multiple water sources, including intermittent sources, samples of
raw water may be collected either at the point of entry (prior to any treatment) or at the source.
Sample collections from these locations could require methods used for monitoring or
production groundwater wells, or even from surface waters. Once the sample population has
been selected, a site-specific review will identify the appropriate sampling locations for each site.
4.3.1 Finished Drinking Water
The project team will identify water treatment devices and appropriate sample locations prior to
visiting a drinking water treatment site. Initially, samples are expected to be taken from post-
treatment finished water. EPA Method 537.1 requires the sampler to open the finished water
sampling port and allow the system to flush until water temperature has stabilized (typically 3-5
minutes). In Utah, public drinking water plants are required to use chlorination in the
treatment process, so sample bottles for finished drinking water must be preserved with
Trizma.® Sample bottles will be prepared by the analytical laboratory, but field crews will
follow PFAS-contamination reducing measures identified in previous sections when sample
bottles are labeled. When collecting a sample of finished water, great care must be taken to
ensure that bottles are not overfilled such that the Trizma® preservative is lost.
4.3.2 Groundwater
When raw-water sources to drinking water plants are sampled, specific sample collection
procedures may vary, depending in part on the status of the well. Production wells are usually
continuously flowing. Monitoring wells and offline production wells are commonly static and
must be purged prior to sampling, or a new sampling well could be installed for site-specific
sampling. Sampling from online production wells, either at the point of entry to the treatment
facility prior to any treatment or near the raw-water source would be conducted from a
dedicated sampling port.
Sampling from static monitoring wells requires a more involved procedure. Briefly, a minimum
of three (3) well-water volumes are purged to avoid sampling stagnant groundwater that may
not be representative of the current aquifer conditions. Measurements of total well depth and
depth to water, along with well-casing diameter, are used to calculate the volume of water in the
well, and therefore how much water needs to be purged. In some cases, e.g., wells with screened
depths in tight formations and with low porosity, a low-flow purging method would be
employed, where water chemistry parameters would be monitoring and sampling would occur
only after some stabilization criteria have been met. Measurement procedures, suitable
equipment, and purging method will vary, depending on the size, depth, and type of well. When
required, DEQ will develop specific details for sampling various well types in coordination with
drinking water facility personnel or other knowledgeable experts. PFAS sampling plans
PFAS Phase II SAP - DRAFT Version 9.0.9
18
developed by the state of North Dakota (North Dakota DOH, 2016) and Department of the Navy
(NCBC, 2019) were used as reference documents and contain additional detail for developing
site-specific well-monitoring protocols.
4.4 Equipment Decontamination
Decontamination of sampling equipment must be conducted consistently to assure the quality of
samples collected. Dedicated sampling equipment (disposable) is preferred to reduce the
potential for sample contamination. All non-disposable equipment used in the field and that
comes into contact with potentially contaminated soil or water must be cleaned and/or
disinfected according to the procedures described in each applicable SOP and broadly outlined
here. For non-dedicated (reusable) sampling equipment, decontamination materials should
include (CWRB(b), 2019):
Alconox®, Liquinox®, and Citranox® can be used for equipment decontamination. Do
not use Decon 90® as it contains fluorosurfactants.
Laboratory-supplied PFAS-free deionized water is preferred for decontamination as
rinse water.
Sampling equipment can be scrubbed using a polyethylene or polyvinyl chloride (PVC)
brush to remove particulates.
Equipment should be triple-rinsed with PFAS-free water. If equipment or rinsate blanks
demonstrate signs of background contamination, LC/MS-grade methanol may be used
as part of the rinsing process
One decontamination method using three PFAS-free buckets is provided below:
(1) Wash equipment with mixture of PFAS-free water and PFAS-free soap in In PFAS-free
bucket #1
(2) Rinse equipment with PFAS-free water n PFAS-free bucket #2
(3) Do final rinse of equipment with PFAS-free water In PFAS-free bucket #3
(4) Change decontamination-water between cleanings if multiple pieces of equipment
require decontamination or if multiple sites are visited in a day.
4.5 Field QC samples
Cross-contamination of samples during sample collection, transport, or storage is possible due
to the prevalence of PFAS in a wide range of materials and may lead to false detections, elevated
background concentrations, or a positive in sample concentrations of PFAS. Field quality control
samples should be collected to evaluate the potential presence and magnitude of cross-
contamination.
The two main types of quality control samples are blanks and replicates, and these QC-sample
types are employed during both field sampling and laboratory analysis.
Field blanks are prepared in the laboratory by placing an aliquot of PFAS-free water reagent
water in a sample container and treating it as a sample in all respects, including shipment to the
sampling site, exposure to sampling site conditions, storage, preservation, and all analytical
procedures. At the sampling location, the field blank is uncapped and transferred to a second
PFAS Phase II SAP - DRAFT Version 9.0.9
19
bottle, then immediately capped and stored. Field blanks are used to determine if method
analytes or other interferences are present in the field environment. Field blanks sample
frequency will be the greater of one per sample site, or one field blank for every 10 field samples.
Trip blanks are a bottle of PFAS-free water prepared in the laboratory, shipped to the
sampling site, and then transported back to the laboratory without having been exposed to any
other sampling procedure. While the trip blank is typically used only for volatile analytes, it may
be recommended for PFAS sampling to assess laboratory and shipping-procedures cross-
contamination. Trip blanks can be compared to field blanks to account for site-specific
aerosolized PFAS contamination. One trip blank will be collected for each sampling day.
When non-disposable equipment is used to collect environmental samples, equipment blank
samples are collected by passing laboratory-prepared-and-verified PFAS-free water over or
through decontaminated field sampling equipment before the collection of samples. This allows
the assessment of the adequacy of decontamination procedures and/or evaluation of the
magnitude of potential contamination from the equipment used during sampling. One
equipment blank sample will be collected per day when non-disposable equipment is used.
Field replicates are two separate samples collected at the same time and place under
identical circumstances and treated exactly the same throughout field and laboratory
procedures. These samples are submitted to the laboratory as two different distinct
samples. Field replicates help quantify both field and laboratory precision. Because this
is an initial survey of potential contaminants to drinking water, DEQ recommends that
field replicates be collected every 10 samples, field blanks collected at every system (PWS
Facility), and an additional set of duplicate samples collected either at every water
system or for every 10-20 samples, as appropriate, for matrix spike and matrix spike
duplicate samples.
4.6 Field Sampling Documentation
Field personnel will properly document the sample collection activities from sampling itself to
the chain of custody (COC). This documentation constitutes a record that allows for the
reconstruction of field events and helps with data review and interpretation. DEQ will retain all
project-specific documents, including COC records, field sampling forms, field notebooks, and
equipment calibration logs. Hard copies will be kept for five years; electronic copies will be
stored indefinitely on the DWQ network.
DDW staff will determine water sources and sample collection locations for the site (PWS)
before sampling. The goal is to sample any water source where drinking water enters the
distribution system. Surface water systems are typically treated at a centralized plant, whereas
groundwater may enter the distribution system from multiple locations. In the field notebook or
prepared field sheets, field crews will record sample collection date and time, PWS name,
whether sample is pre- (raw water) or post-treatment (finished water), and clear description of
sample location (i.e. well number, sample port) and if the sample was chemically preserved.
Field personnel will adhere to all relevant elements of this SAP and DWQ’s QAPP for monitoring
activities (Utah DWQ, 2014). If field conditions warrant a deviation from this SAP, the
PFAS Phase II SAP - DRAFT Version 9.0.9
20
Designated Project Manager (DPM) will be notified to discuss potential deviations and
formulate alternate sampling plans. The agreed upon deviations will then be documented in the
field sampling form and field notebook. The following details should be noted:
Reason for the deviation
Corrective action to be taken
Identification of the samples and parameters that may be impacted, and
Significance of the potential impacts to the integrity of each sample
4.6.1 Data Reporting Elements
Because the target population for this monitoring project centers around public drinking water
systems, the data reporting elements produced below (Table 7) are based on EPA’s Third
Unregulated Contaminant Rule (UCMR3) program (EPA(f), 2017).

PFAS Phase II SAP - DRAFT Version 9.0.9
21
Table 7. Minimum Data Reporting Elements from Field Records
Data Element Definition
PWS ID Public Water System (PWS) Identification code. Format: UT[nnnnnnn] {7} PWS Name Name of Public Water System Size PWS size-class (L: > 10,000; S: ≤ 10,000 population served) Facility ID PWS Facility Identification code. Format: [nnnnn] {5} Facility Name Name of facility within PWS Facility Water Type Source of water to facility [*] Sample Point ID ID for each sample location in PWS Sample Point Name Name of sample location Sample Point Type PWS sampling point code: EP – entry point to distribution system; MR – distribution
system at max. residence time Disinfectant Type Type of treatment used [†] Sample Date Date of sample collection (YYYY-MM-DD) Sample ID Laboratory Sample Number Contaminant (analyte) Name of analyte reported (may also include a CAS no.) Method ID Identification code of analytical method MRL Minimum Reporting Limit reported from lab Result Code Identifier for result relative to detection limit, reporting limit, or upper range of
calibration curve Result Value Numerical value of result Result Units Units of numerical result and MRL for a contaminant Lab ID Identifier for laboratory conducting analysis Sample Collection Method Reference to sample collection method for various sample types [‡] *Facility water types: SE (surface water); GW (groundwater); GU (groundwater w/ surface water influence); MX (mixed sources). †Disinfectant types: CLGA (gaseous chlorine); CLOF (offsite-generated hypochlorite, stored as liquid); CLON (Onsite-generated hypochlorite, no storage); CAGC (chloramine, from gaseous chlorine); CAOF (chloramine, from offsite hypochlorite); CAON (chloramine, from onsite hypochlorite); CLDO (chlorine dioxide); OZON (ozone); ULVL (ultraviolet light); OTHD (other types), NODU (no disinfectant used). ‡Sample collection methods may include grab-sampling from surface waters, purge-method for sampling from groundwater wells, etc.
4.6.2 Sample Bottle Labeling
Prior to sample collection, sample containers should be labeled. Field personnel should use an
indelible ink pen/marker or pre-printed labels when available and not record sample
information on the sample bottle lid. Label information must include:
Facility name
Unique site identifier
Date
Time of collection written in military time
Initials of collector
Preservation (chemical and/or cooling)
For example, a sample taken from the pre-treatment spigot from the “Anytown Drinking Water
Treatment Plant” on September 24, 2020 at 11:00 a.m. will be labeled as follows:
Facility name: Anytown DWTP
Unique site identifier: Pre-treatment
Date: 2020/09/24
Time: 1100
Collector initials
Preservation (e.g., wet ice, no Trizma2) 2 The Trizma chemical preservative is only required for finished drinking water, where the treatment stream may have been chlorinated
PFAS Phase II SAP - DRAFT Version 9.0.9
22
Containers for both field and QA/QC samples should be prepared at the same time (batch).
4.7 Field Sampling Workflow
To maintain safety protocols and ensure proper locations of samples collected, field staff should
observe the following workflow:
1. Make planning arrangements with facility at least three weeks prior to sampling. Be sure
to provide facility personnel with information on clothing or personal care product
requirements (see Tables 3-5 and Section 4.6 of this SAP).
2. Arrive at facility.
3. Check-in and coordinate with facility point-of-contact.
a. Review sampling logistics, including schedule.
b. Assure point-of-contact debriefs monitoring staff on safety precautions at facility.
4. Arrive at sampling location.
5. Ensure there are no safety concerns. If at any point monitoring staff feel unsafe with
sampling conditions, they should cease sampling efforts and report issues to DPM.
6. Prepare sampling equipment.
7. Conduct sampling efforts.
8. Assure sample bottles and paperwork are legible and complete.
9. Clean-up sampling environment.
10. Relocate to next sampling location at facility and follow steps 3-9 if applicable.
11. Check out with facility operators.
12. Complete a chain-of-custody form and ship samples.
4.8 Sampling Complications and Corrective Actions
Prior to field visits and any sample collection activities, sites and sampling locations will be
evaluated to ensure that:
The site is a member of the target population
DWQ field crews have received explicit permission to access sites located on private
property. In some instances, a facility chaperone or site guide may be required by the
facility.
The site contains the specific sample collection locations necessary to meet project goals
as identified in Section 2.0 (DQOs)
Field crews have the required number and type of sample containers (bottles) and other
sampling equipment.
If a previously evaluated site or sampling location no longer represents the sample target for this
project, the field crew will contact the DPM for further instructions and then continue on to the
next sample collection location.
To clarify sample design and sampling terminology:
Facility is synonymous with drinking water system and analyzed as a stratum
Wells, sites, or facility outfalls are synonymous with sampling location and analyzed as a
sample element
PFAS Phase II SAP - DRAFT Version 9.0.9
23
Abnormal field conditions could arise during the course of sampling. Field crews are required to
adhere to all proper safety precautions and plans during the execution of this project,
particularly when sample collection activities may be affected by weather conditions such as
hard rain, high winds, or excessive lightning; facility construction; or facility operation and
maintenance.
The DPM will work closely with the contract laboratory and the DWQ QA Officer conducting the
data review to examine data that fall outside of QC criteria. The DPM will determine whether
data should be re-analyzed, rejected, or used with appropriate qualification
5.0 Project Team and Responsibilities
One team member from the Monitoring Section (DWQ) will be assigned the duty of
coordinating monitoring efforts for this phase of PFAS sampling (Field Coordinator). Other
monitoring staff will be made available to help the Field Coordinator with sampling efforts as
needed. This person will be responsible for the following:
Coordinate with the PFAS Workgroup (guidance/direction on sampling efforts,
reporting, etc.).
Coordinate sampling logistics such as planning, scheduling, and reporting. Act as lab
liaison and coordinate with the facility or landowner.
Conduct field sampling events.
Organize field data.
6.0 Data Management
Data management describes the data path from generation in the field or laboratory to final use
or storage. This includes standard record-keeping procedures, document control systems, and
the approach for data storage and retrieval.
Field observations, including site maps and photos, will be stored in site-specific subfolders
within the PFAS project folder located on the DEQ internal network. Special care will be taken
to employ a succinct and consistent sample labeling scheme for all samples collected from all
sites. Sample results from the analytical laboratory will be provided to DEQ as an analytical
report, including a detailed sample narrative, in PDF format. Final sample data will also be
submitted to DEQ in a common electronic data deliverable (EDD) format. DEQ will perform an
external data validation on all results reported from the laboratory. Once data review is
complete and results are finalized, these data will be submitted to DDW using a template
appropriate for DDW’s Safe Drinking Water Information System (SDWIS) database. DDW staff
are responsible for maintaining the SDWIS database.
Finalized annual or final project reports, including all appendices, data tables and any other
project deliverables, will be stored in DEQs D2 electronic document archival system. DEQ staff
are responsible for maintaining the document control system.

PFAS Phase II SAP - DRAFT Version 9.0.9
24
7.0 Laboratory Sample Handling Procedures
All sample collections will be obtained following the field-protocols outlined above in section
4.0, and as necessary, described in method-specific SOPs (Appendix A).
Table 8 lists the required container type, sample volume, sample-preservation (if any), and the
allowable holding time for all possible sample collection activities in this project.
Table 8. Sample Container Requirements
SITE TYPE SAMPLE TYPE
ANALYTICAL
METHOD
CONTAINER
TYPE
CONTAINE
R VOLUME PRESERV.
HOLDING
TIME & TEMP
Drinking
Water
Finished Water EPA 537.1 HDPE bottle 2 X 250 mL
Trizma®
(5 g/L) 14 d at <6 °C
Raw Source Water EPA 537.1 [mod] HDPE bottle 2 X 250 mL none 14 d at <6 °C
Raw Groundwater EPA 537.1 [mod] HDPE bottle 2 X 250 mL none 14 d at <6 °C
Table-details derived from EPA Method 537.1 (ver. 1.0) and sample requirements obtained from Eurofins TestAmerica Inc.
7.1 Sample Shipping
DWQ is working with TestAmerica Inc. laboratory in Sacramento, CA. Shipping address and
contact information:
TestAmerica Sacramento 880 Riverside Parkway West Sacramento, CA 95605 Ph: 916.373.5600 Contact: Jill Kellmann ([email protected]) COC forms, sample containers, etc. are available from the TestAmerica contact person listed
above.
DWQ has an electronic copy of TestAmerica’s Corporate Quality Management Plan (dated
03/28/2019; Doc. No. CA-Q-M-002, rev 4.1) for reference. This document serves as a broad
QAPP. However, specific laboratories may have QA Manuals that, per CQMP, take precedence
over the CQMP.
FedEX Shipping labels are available at Susan Woeppel’s office or can be printed from FedEx’s
website. Regardless of which label is used, a receipt must be obtained for each shipment and
submitted to Susan within one week of the shipment. Be sure to include DWQ billing (unit and
program) on the receipt (coding has yet to be determined at this time).
The sample acceptance policy of the contracted lab defines and identifies the conditions where
“compromised” samples must be documented and reported to the client (DWQ). In some cases,
PFAS Phase II SAP - DRAFT Version 9.0.9
25
compromised samples may not represent credible data, but the full sample result should be
reviewed. Samples will be considered “compromised” by TestAmerica if the following
conditions are observed upon receipt:
Samples outside temperature specification or beyond holding time
Broken, leaking, or inappropriate containers
COC items that do not match sample-labels or are incomplete or missing
Breakage of any Custody Seal
Apparent tampering with cooler or samples
Seepage of extraneous water/materials into samples
Inadequate number or volume of samples
Illegible, impermanent, or non-unique sample labeling
Upon receipt of samples, TestAmerica will contact DWQ and report the status of all received
samples prior to initiation of sample preparation and analysis.
8.0 Analytical Methods and Laboratory Documentation
The analytical approach developed for detection, identification, and quantitation of PFAS is
based on solid-phase extraction (SPE) from aqueous samples, followed by liquid
chromatography tandem-mass spectrometry (LC-MS/MS), with multiple reaction monitoring
(MRM) of mass-specific parent-to-product ion transitions for all targeted analytes. The addition
of isotopically-labeled surrogates prior to extraction is used to monitor analyte recovery through
the entire sample preparation and analysis process. The entire sample should be used for
laboratory analysis, such as solid-phase extraction of PFAS from water samples.
A key challenge in developing a baseline survey of PFAS in Utah PWSSs involves identifying
which PFAS compounds to evaluate. Well over 6,000 distinct PFAS have been produced or
released to the global environment (Wang et al, 2017). EPA’s UCMR3 survey of public water
systems using EPA Method 537 included six PFAS (see Table 9. PFAS Analyte list for EPA
Method 537.1 (ver. 1.0)). EPA Method 537 includes 14 compounds, while the updated EPA 537.1
Method includes 18 compounds. Some commercial labs have modified EPA 537 to analyze 24 to
32 PFAS from surface water, groundwater, or biota. A new method, EPA Method 533 (EPA,
2019), was released in late 2019, and includes 25 compounds, 11 of which are shorter-chain
compounds TestAmerica has indicated that it expects to be ready to process EPA Method 533
samples, even suggesting it as preferable to EPA Method 537.1 due it its isotope dilution
methodology and coverage of a greater number of the newer PFAS compounds. Other methods
being developed through ASTM, ISO, and DOD (consensus-based standards organizations) are
performance-based (i.e., they rely heavily on recovery of isotopically labeled surrogates and
internal standards; the number of analytes potentially available is only restricted by the ability
to meet specific QC requirements) (DOD(b), 2017).
As described in this SAP, the focus of this project is finished (post-treatment) drinking water
and/or raw sourcewater to drinking water treatment facilities. Because EPA does not currently
regulate PFAS under the Safe Drinking Water Act, there are no regulatory requirements for
PFAS Phase II SAP - DRAFT Version 9.0.9
26
monitoring that states and PWSSs must undertake to create continuity with national water
quality monitoring programs, Utah DWQ will build on prior work from the UCMR3 study using
an updated and expanded analytical method for analysis of PFAS from drinking water (EPA
537.1).
Table 9. PFAS Analyte list for EPA Method 537.1 (ver. 1.0) and Method 533
Acronym Analyte Name CAS UCMR 3 EPA
537.1
EPA
533
Advisory
Level MRL*
PFBA Perfluorobutanoic acid 375-22-4 x -
PFMPA Perfluoro-3-methoxypropanoic acid 377-73-1 x -
PFEESA Perfluoro(2-ethoxyethane)sulfonic acid 113507-82-7 x -
PFBS Perfluorobutanesulfonic acid 375-73-5 x x x 2.0
PFPeA Perfluoropentanoic acid 2706-90-3 x -
PFMBA Perfluoro-4-methoxybutanoic acid 863090-89-5 x -
NFDHA Nonafluoro-3,6-dioxaheptanoic acid 151772-58-6 x -
4:2 FTS 4:2 Fluorotelemer Sulfonate 757124-72-4 x -
PFPeS Perfluoropentanesulfonic acid 2706-91-4 x -
PFHxA Perfluorohexanoic acid 307-24-4 x x 2.0
GenX HFPO-DA (GenX) 13252-13-6 x x 4.0
DONA DONA (Dioxa Nonanoate) 919005-14-4 x x 2.0
PFHxS Perfluorohexanesulfonic acid 355-46-4 x x x 2.0
PFHpA Perfluoroheptanoic acid 375-85-9 x x x 2.0
6:2 FTS 6:2 Fluorotelemer Sulfonate 27609-97-2 x -
PFHpS Perfluoroheptanesulfonic Acid 375-92-8 x -
PFOA Perfluorooctanoic acid 335-67-1 x x x 70 † 2.0
F-53B maj F-53B Major 756426-58-1 x x 2.0
8:2 FTS 8:2 Fluorotelemer Sulfonate 39108-34-4 x -
NMeFOSAA N-methyl perfluorooctanesulfonamido
acetic acid
2355-31-9 x 20.0
NEtFOSAA N-ethyl perfluorooctanesulfonamido
acetic acid
2991-50-6 x 20.0
PFOS Perfluorooctanesulfonic acid 1763-23-1 x x x 70 † 2.0
PFNA Perfluorononanoic acid 375-95-1 x x x 2.0
PFDA Perfluorodecanoic acid 335-76-2 x x 2.0
F-53B min F-53B Minor 763051-92-9 x x 2.0
PFUnA Perfluoroundecanoic acid 2058-94-8 x x 2.0
PFDoA Perfluorododecanoic acid 307-55-1 x x 2.0
PFTriA Perfluorotridecanoic acid 72629-94-8 x 2.0
PFTeA Perfluorotetradecanoic acid 376-06-7 x 2.0
* Units are ng /L; MRL values are max-reported values from September 2019 (Test-America), for surface water
samples; these values are expected to be maximum MRLs using the methods described above. MRLs for analytes
only from Method EPA 533 are unknown.
† Benchmark values listed for PFOA and PFOS are EPA Lifetime Health Advisories (LHA) for drinking water
(EPA(e), 2019).
8.1 Identify and Control Sample Matrix Effects
While less an issue with drinking water or groundwater samples, identification and quantitation
of PFAS extracted from some surface waters and soils/biosolids can be substantially influenced
by the combined effect of all the non-target components in the sample (Delaney, M.F., 2017;
Krynitsky, A.J., et al.). Surface waters (streams, lakes, wetlands), wastewaters (influent and
PFAS Phase II SAP - DRAFT Version 9.0.9
27
effluent), and samples extracted from soils usually have higher concentrations of suspended
solids, dissolved organic compounds, or dissolved inorganic solutes (salts) compared to
relatively pure finished drinking water and ultraclean laboratory water. Since most analytical
methods of environmental samples were developed and calibrated under controlled laboratory
conditions, differences between an environmental sample and laboratory water/reagents can
interfere with otherwise accurate analytical procedures and result in poor sensitivity or biased
results.
Laboratory techniques, such as the addition of isotopically labeled surrogate compounds, can
help identify strong reductions in extraction efficiency. This is particularly true when surrogate
and internal standard compounds are added prior to sample-extraction or cleanup steps.
Field-based QC checks include routine collection of supplemental field sample bottles for use as
matrix spikes. Recovery of added analyte from matrix spike samples is compared to recovery
from lab control spikes (lab method blank spiked before analysis) to identify instrument
performance vs. matrix interference. In addition, collection of ancillary field measurements,
such as water in situ pH or total suspended solids concentrations, may provide lab analysts and
the Designated Project Manager (DPM) with information to better predict or interpret observed
matrix effects.
9.0 Project Quality Control Requirements Baseline QC requirements follow DWQ’s Quality Assurance Project Plan for monitoring
activities (Utah DWQ, 2014) (see also Error! Reference source not found.). However, this
SAP document also includes some project-specific items. Activities related to sample-data-
collection quality control occur throughout the lifetime of a project.
The broad goal of this investigation is to determine whether PFAS compounds are present at
measurable levels in Utah’s public water systems (Table 1. Summary of Data Quality
ObjectivesTable 1). Sampling design is a key element for ensuring that a project meets its data
quality objectives by considering the degree to which collected measurements are representative
of the target population. For this project, public water supply systems (PWSSs) are the
population of interest, and this population may include both the source water and the treated
finished water for these systems. Given that available resources for this project are finite (see
section 11.2, Estimated Costs), it is improbable that funds are available to sample all source
water and outflows from allPWSSs. Instead, Sections 1.0 and 2.0 of this SAP describe possible
scenarios for prioritizing which systems to sample, ranging from sampling restricted to areas of
known PFAS contamination near source protection zones to a one-time census of all PWSSs..
Further consultation with project partners, including local health departments and managers of
water supply systems, along with spatial analysis of potential sampling locations identified in
Error! Reference source not found., will identify the degree to which the sampling design
s judgmental versus probability-based. Key factors controlling probability-based sampling are
proportion of water systems that can be sampled and the number and importance of distinct
water sources to each system.
PFAS Phase II SAP - DRAFT Version 9.0.9
28
The requirements for field and lab analytical-activities for this project are described below. In
general, QC samples are collected to establish the magnitude of potential sample contamination
from field gear or sampling equipment, particularly when questionable materials may come into
contact with a sample. The most frequent QC sample collected for PFAS monitoring is a field
blank (also referred to as a field reagent blank or site blank), where PFAS-free water is
dispensed to a sample bottle in the field and then otherwise treated the same as all other
samples collected during that sampling event.
If supplemental sampling equipment is required to obtain a sample, such as sample tubing for
pumps or transfer containers used to composite samples, one or more equipment blanks should
be prepared for every five field samples collected. When ambient exposure of samples to PFAS
is a concern, perhaps due to aerosolized PFAS or heavy storm events, a trip blank can be used in
addition to a site-specific field blank to assess the degree of potential contamination.
One additional type of QC sample collected is a field replicate, where a second full set of samples
are collected from a particular sampling location. Analyses of results from these samples help
identify the level of precision, or repeatability, of the entire sample collection, handling, and
laboratory analysis system.
Sample handling and collection requirements are often matrix- or sample type-specific:
Finished Drinking Water: Approved bottles with preservative (Trizma), no transfer
containers, and no PTFE-lined lids on sample bottles. Sample temperature must be
maintained at or below 10 °C (wet ice only).
Groundwater (from wells or source-water to drinking water facilities): Approved bottles,
no preservative required (unless water has been chlorinated), no PTFE lids. Transfer
bottles or tubing only as necessary. Sample temperature must be maintained at or below
10 °C (wet ice only).
Surface Water: Approved bottles, no preservative, no PTFE lids. Transfer bottles or
tubing as necessary. Sample temperature must be maintained at or below 10 °C (wet ice
only).
Soils / Sediments / Biosolids: Approved bulk containers (glass jars), no PTFE lids,
appropriate sample collection and homogenization tools (stainless steel spatula and
mixing bowls), and PFAS-free rinse and decontamination water (solutions) as necessary.
Equipment blanks are expected. Review laboratory procedures and analytical method for
additional sample preservation requirements.
9.1 Field QC Activities Field QC samples will be collected as often as appropriate and practical during sampling
activities. Performance goals for field replicates, field blanks, and equipment blanks are
described below.
9.1.1 Field Replicates
Field replicate samples will be collected for every 10 field sample collections.
PFAS Phase II SAP - DRAFT Version 9.0.9
29
Performance Goal: Relative percent difference (RPD) in result values (RV) between replicate
field sample pairs, overall and for each analyte, is less than 30% (e.g., see EPA Method 537.1,
Sect. 9.3.7.2).
𝑅𝑃𝐷 = |𝑅𝑉1𝑖−𝑅𝑉2𝑖|
(𝑅𝑉1𝑖+𝑅𝑉2𝑖) 2⁄ × 100
Greater variability (i.e., lower precision) may be found when result values are within a factor of
two of the minimum reporting level (MRL). Here, RPDs should be < 50%.
Corrective Action: If the RPD of any analyte falls outside the designated range, and lab
performance for that analyte is shown to be within system acceptance limits, precision is
affected by matrix interference and should be labeled/ flagged in the dataset. For larger
projects, further review of additional field replicates in comparison with lab-QC analyses can
provide insight to the magnitude and consistency of matrix effects compared to inadequate
laboratory practices.
9.1.2 Field Blanks
Field blanks (FB), also called site blanks or field reagent blanks, are collected at every site (i.e.,
PWSS), and may also be collected after every five to 10 samples at a site. The goal here is to
ensure that PFAS identified and quantitated in field samples were not inadvertently introduced
to the sample during sample collection or handling. Generally, analysis of field blanks is only
required when a field sample contains one or more analytes above the MRL.
Performance Goal: Concentration of any analyte in a field blank sample that is also detected in
the associated field sample should be less than the MRL, preferably < 1/3 of MRL.
Corrective Action: For drinking water samples, if target analyte results are outside acceptance
limits, EPA Methods 537.1 and 533 suggest all samples associated with that FB should be
considered invalid and be recollected and re-analyzed. More detail on QC of blank results can be
found in Section 9.2.1 of this SAP.
9.1.3 Equipment Blanks
Performance Goal: Concentrations of any analyte detected in the associated field sample should
be less than the MRL, preferably < 1/3 of MRL.
Corrective Action: Interpretation of additional types of field blanks is dependent on the context
of the sample set However, one result could be that concentrations of some target analytes could
be considered positively biased and/or less precise (with result value qualified as ‘estimated’ “J”)
when collected using field sampling or compositing equipment, compared to more directly
acquired samples. This could have consequences on achieving data quality objectives for the
project.
9.2 Laboratory QC Activities Analytical QC requirements include the use of various types of control samples that are analyzed
with each batch of samples to monitor laboratory performance in terms of accuracy, precision,
sensitivity, selectivity, and interferences. General approaches and control samples are available
for the contracted lab, TestAmerica, in the Corporate Quality Management Plan (TestAmerica,

PFAS Phase II SAP - DRAFT Version 9.0.9
30
2019 [CBI]), from Section 9.0 of EPA Method 537.1, and from a PFAS data review and guidance
document (EPA(g), 2018).
More broadly, depending on the level of the QC-package requested, results from lab-internal QC
samples can be provided directly as raw data, in blank /spike summaries, or reviewed in the case
narrative supplied in the laboratory data package. In addition to raw sample data and
descriptions of sample preparation work, laboratory data packages typically include a narrative
specific to the samples analyzed that identify any data-quality issues and any potential impacts
to data usability. While DEQ will review the case narrative for all laboratory results, at
minimum, 10% of lab QC results will be reviewed by project personnel.
9.2.1 Field Quality Control Samples
Trip blank/ field blank 3/ equipment blank (TB, FB, EQBK) cumulatively measure analyte
contributions to sample contamination from source water and shipping, the environment of the
sampling location, and field equipment used during sampling, respectively. Most common are
field blanks, which are required at least once per site (i.e., PWSS)). Field blanks will be collected
at each sampling location and held by the lab to be analyzed if sample results are above
detection and will be compared to sample results to determine if contamination is present. If
ambient analyte contamination is suspected at the sampling location (e.g., known release of
contaminant to air, or severe weather conditions that promote mixing), collection of a trip blank
is recommended to isolate the ambient- field source contamination from the sample material or
shipping contribution.
Performance Goal: Similar to method blanks, if analytes are detected, concentrations should be
below 1/3 of MRL (EPA 537.1) or less than MRL (EPA PFAS Data Review Guidance). It is
expected that results from TBs should be most similar to method blanks (MBs), while results
from EQBKs could be greater than or equal to values from FBs. Note that results from field
blanks may have a “B” qualifier attached if the MB result for that analyte was detected and
exceeded 1/3 MRL. Project QA personnel will review FB results and consider the context of
target analyte “hits” from recovery of added surrogate compounds, detections from laboratory
blanks, as well as magnitude of field-sample target analyte concentrations.
Corrective Action: If FB result is detected, and both MB and FB results are within acceptance
criteria, no data qualifiers are required. When FB result is detected but exceeds acceptance
criteria and the associated field-sample result is less than 10 times greater than FB, evidence
exists for target analyte contamination and thus positive bias for that result. The result value
should be qualified appropriately and the magnitude-to -background contamination reviewed
for impacts to project objectives.
1.1.1 Laboratory Quality Control Samples
Laboratory control sample4/matrix spike (LCS, MS) are used to determine the accuracy of the
method in a blank or a field-sample matrix, respectively. These are generated at least one per
batch. For LCS, a sample of clean (analyte-free) lab water and/or method reagents is spiked with
3 Field Blanks may also be called Field Reagent Blanks (FRB) 4 Lab Control Samples may also be called Laboratory Fortified Blank or Lab Spikes

PFAS Phase II SAP - DRAFT Version 9.0.9
31
a known concentration of analyte(s), and processed through the entire sample preparation and
analysis sequence. A laboratory control sample duplicate (LCSD) is a second sample prepared
in the same way and provides an estimate of method precision from a blank matrix. In contrast,
a MS is an aliquot (or an entire duplicate sample) of a field sample spiked with a known
concentration of analyte(s) and processed through the entire sample preparation and analysis
sequence. Similar to laboratory control samples, a MSD (matrix spike duplicate) is a second
sample prepared in the same way as the MD and provides an estimate of method precision from
a field-sample matrix.
Performance Goal: For spike levels greater than the lower third of the calibration range, spike
recovery should be within 70-130% of the true value. If a lower concentration spike is used, e.g.,
from the lower third of calibration curve– and no greater than 2x MRL, spike recovery should be
within 50-150% of the true value. If spike recovery is < 10%, associated results from that batch
should be rejected, unless system setup is corrected and re-analysis of the sample falls within
acceptance limits.
Corrective Action: If analyte recovery from an LCS sample is outside acceptance limits, at
minimum, results from field samples should be qualified with a “J” flag. This identifies the
reported concentration of the field result as estimated. For drinking water samples, if LCS
recovery is outside acceptance limits, EPA Methods 537.1 and 533 suggest that all results in that
preparation batch should be considered invalid (Section 9.3.3 of EPA 537.1). If analyte recovery
from MS samples is outside acceptance limits while laboratory performance for those analytes is
shown to be in control, then recovery is judged to be matrix-biased. Results for the
corresponding analyte(s) in the unfortified sample are reported as “suspect-matrix.” Project QA
personnel will validate all results from LCS/LCSD and MS/MSD samples per batch and consider
the consequences of data-qualifiers or other remedial actions, as appropriate.
Method Blank (MB; also known as Laboratory Reagent Blank (LRB)) measures the method
contribution to any source of contamination, It is generated at least one per batch. MB samples
are used to detect interferences during chromatography that may prevent the determination or
quantitation of that analyte. The analyte then determines the source of contamination and
eliminates the interference before processing samples.
Performance Goal: If analytes are detected, concentrations must be below 1/3 of MRL.
Corrective Action: For drinking water samples, if concentration of detected target analytes from
MBs exceed 1/3 of MRL, EPA Methods 537.1 and 533 recommend that all results for that analyte
in that preparation batch be considered invalid (Section 9.3.1).However, EPA PFAS data review
guidelines suggest that these data may still be useful so long as field-sample results are more
than 10 times the blank (MB). EPA recently promulgated changes to detection limit calculations
as part of Clean Water Act Method Update Rule (EPA(h)), where estimated target analyte
concentrations from MBs could be used to help derive matrix-specific MDLs. These updated,
matrix-specific limits could then be used to obtain practical quantitation limits for complex
fieldsamples.
PFAS Phase II SAP - DRAFT Version 9.0.9
32
Surrogate Recovery (SURR)is rRecovery of isotopically labeled surrogates that are added to all
samples and quality control samples, MBs, LCS, etc., added prior to extraction. The sample is
examined for all available surrogate compounds, and calculated as:
%𝑅𝑒𝑐𝑜𝑣𝑒𝑟𝑦 = (𝑅𝑉𝑖
𝑆𝑝𝑖𝑘𝑒.𝐶𝑜𝑛𝑐𝑖) × 100
where the result value (RVi)of the surrogate analyte is divided by the concentration of surrogate
added (Spike Conci). Because surrogate compounds are added prior to sample extraction, and
because they are added to all extracted samples including method blanks, MS/MSD and
LCS/LCSD, they allow for comparisons of recovery of surrogate compounds with and without
sample-specific matric effects.
Performance Goal: SURR recovery should be in the 70 to 130% range.
Corrective Action: If SURR recovery for MB or LCS is outside acceptance limits, the lab analyst
should check performance of the system, correct any problems, and then re-analyze the extract
(EPA 537.1, see 9.3.5). If SURR recovery is outside the 70-130% control range for a field blank,
field sample, or matrix spike, but lab QC samples are in control, matrix interference is
suspected, and target-analyte results associated with that surrogate should be qualified with “J”
since confidence in reported concentration is compromised. If recovery of added surrogates is <
10%, associated results from that batch should be rejected, unless system setup is corrected and
re-analysis of sample falls within acceptance limits.
9.3 Data Qualifiers The following qualifiers are used in the data review process.
Table 10. Data Review Qualifiers
B An analyte detected in the sample was also detected in a laboratory or field blank Result may be biased by low-level contamination
J
Result value is an estimated quantity of concentration of analyte in the sample. Result value was greater than method detection limit (MDL) and less than sample reporting limit. Field blanks, field sample, or matrix spikes are outside the acceptance limits, but the laboratory QC samples, method blank, and LCS spikes are in control, then matrix interference is suspected. The target analytes associated with surrogates outside acceptable limits will be flagged “J”.
J+ / J-
Result value is estimated Results may be biased high or low, respectively.
R Result is rejected due to serious deficiencies in meeting QC criteria.
U The analyte was not detected above the level of the reported sample detection limit.
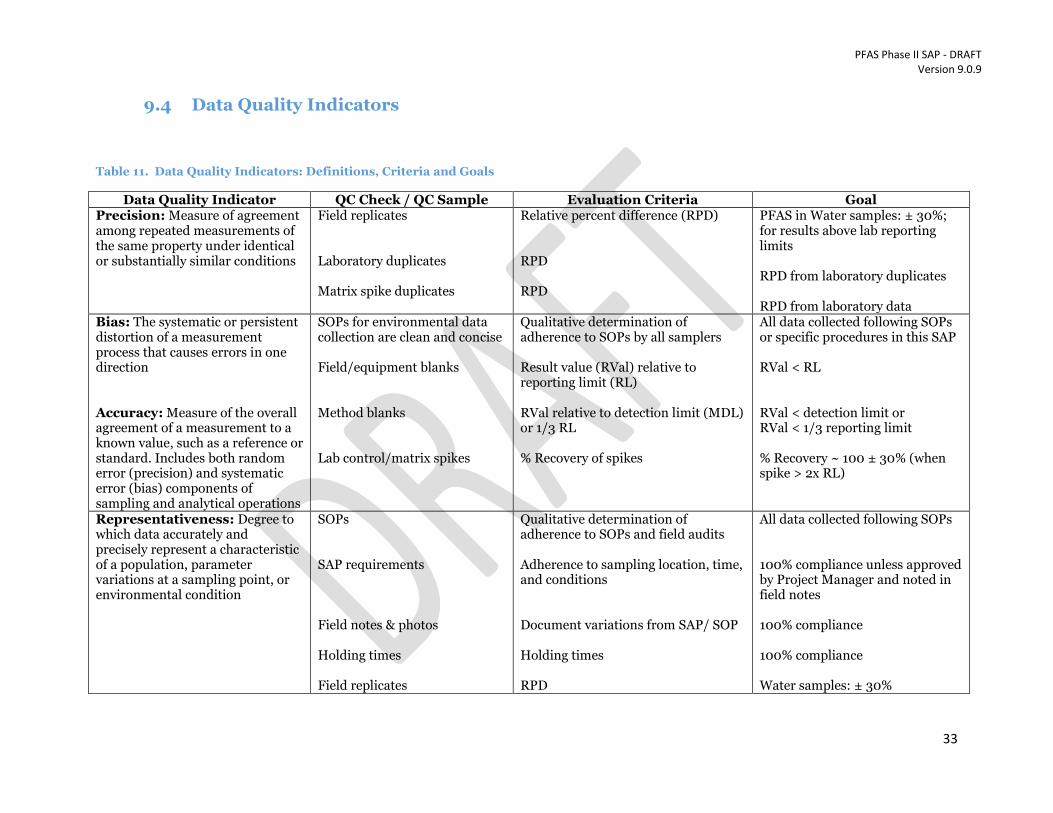
PFAS Phase II SAP - DRAFT Version 9.0.9
33
9.4 Data Quality Indicators
Table 11. Data Quality Indicators: Definitions, Criteria and Goals
Data Quality Indicator QC Check / QC Sample Evaluation Criteria Goal Precision: Measure of agreement among repeated measurements of the same property under identical or substantially similar conditions
Field replicates Laboratory duplicates Matrix spike duplicates
Relative percent difference (RPD) RPD RPD
PFAS in Water samples: ± 30%; for results above lab reporting limits RPD from laboratory duplicates RPD from laboratory data
Bias: The systematic or persistent distortion of a measurement process that causes errors in one direction Accuracy: Measure of the overall agreement of a measurement to a known value, such as a reference or standard. Includes both random error (precision) and systematic error (bias) components of sampling and analytical operations
SOPs for environmental data collection are clean and concise Field/equipment blanks Method blanks Lab control/matrix spikes
Qualitative determination of adherence to SOPs by all samplers Result value (RVal) relative to reporting limit (RL) RVal relative to detection limit (MDL) or 1/3 RL % Recovery of spikes
All data collected following SOPs or specific procedures in this SAP RVal < RL RVal < detection limit or RVal < 1/3 reporting limit % Recovery ~ 100 ± 30% (when spike > 2x RL)
Representativeness: Degree to which data accurately and precisely represent a characteristic of a population, parameter variations at a sampling point, or environmental condition
SOPs SAP requirements Field notes & photos Holding times Field replicates
Qualitative determination of adherence to SOPs and field audits Adherence to sampling location, time, and conditions Document variations from SAP/ SOP Holding times RPD
All data collected following SOPs 100% compliance unless approved by Project Manager and noted in field notes 100% compliance 100% compliance Water samples: ± 30%

PFAS Phase II SAP - DRAFT Version 9.0.9
34
Data Quality Indicator QC Check / QC Sample Evaluation Criteria Goal Comparability: Qualitative term expressing the measure of confidence that one dataset can be compared to another and can be combined in order to answer a question or make a decision
SOPs (sample collection and handling) Holding times Analytical methods Similar frequency and types of QC samples (field dups, blanks, lab QA)
Qualitative determination of SOP adherence Holding times DWQ- or EPA-approved, or other appropriate performance-based methods with compatible QC requirements Verify
All data collected following SOPs or specific procedures described in this SAP 100% compliance 100% use of approved methods Evaluate for comparability
Completeness: Quantity of valid data obtained from measurement system compared to quantity of data expected
Complete sampling % Valid data 100% completeness
Sensitivity: Capability of method or instrument to discriminate between measurement responses representing different levels of the variable of interest. Primarily a lab indicator
Laboratory detection limit Laboratory reporting limit for target analytes
Must be below action level RL < 1/5 Action Level of 70 ng/L (HA)
100% compliance 100% compliance
RPD - Relative Percent Difference (RPD (%) = {(X1 - X2)/(X1+X2)}/2 x 100, where X1 = result from first sample and X2 = result from second sample

PFAS Phase II SAP - DRAFT Version 9.0.9
35
10.0 Data Analysis, Record-keeping, and Reporting
Requirements
10.1 Project Record-keeping
In accordance with DWQ QAPP for Monitoring Activities (see Error! Reference source not
found.), field personnel shall use field notebooks, pre-printed field worksheets, and/or
electronic tablets to accurately document onsite conditions, field measurements, sample
collection information, field instrument readings (as appropriate), and other pertinent site-
related information obtained during sample collection activities.
Appropriate laboratory-analysis-request sheets and COC forms will be maintained before,
during, and after sample collection and reviewed for accuracy before the samples and the lab
sheet/COC forms are stored in the vehicle. Laboratory-specific sample acceptance criteria will
be reviewed prior to sample storage, transport, and shipping.
11.0 Schedule and Budget
11.1 Schedule
There are five primary components to the overall structure of Phase 1 monitoring :
1. SAP development
2. Monitoring implementation
3. Data review/validation
4. Data reporting
5. Reassessment
Scheduling and implementation (monitoring) will be dependent on monetary resources
allocated to this program. Monitoring staff are available to begin field sampling as early as May
2020 once project funding has been determined and logistics have been planned. Sites will be
selected from target population of water providers identified under scenario 4 in Table 3 once
input is given from DEQ management and input from the PFAS workgroup.
Considering there are many unknowns regarding this project, overall scheduling will be dynamic
and subject to change. Ultimately, DWQ’s Monitoring Section has staff resources allocated to
allow for ongoing PFAS sampling into the near future. Continuous support from DDW, DERR,
DWMRC, and DWQ will be needed to make to make the overall PFAS project a success. This
includes help with project design, implementation, data review/analysis, and reporting. See
Table 12 for more information on Phase 1 scheduling.
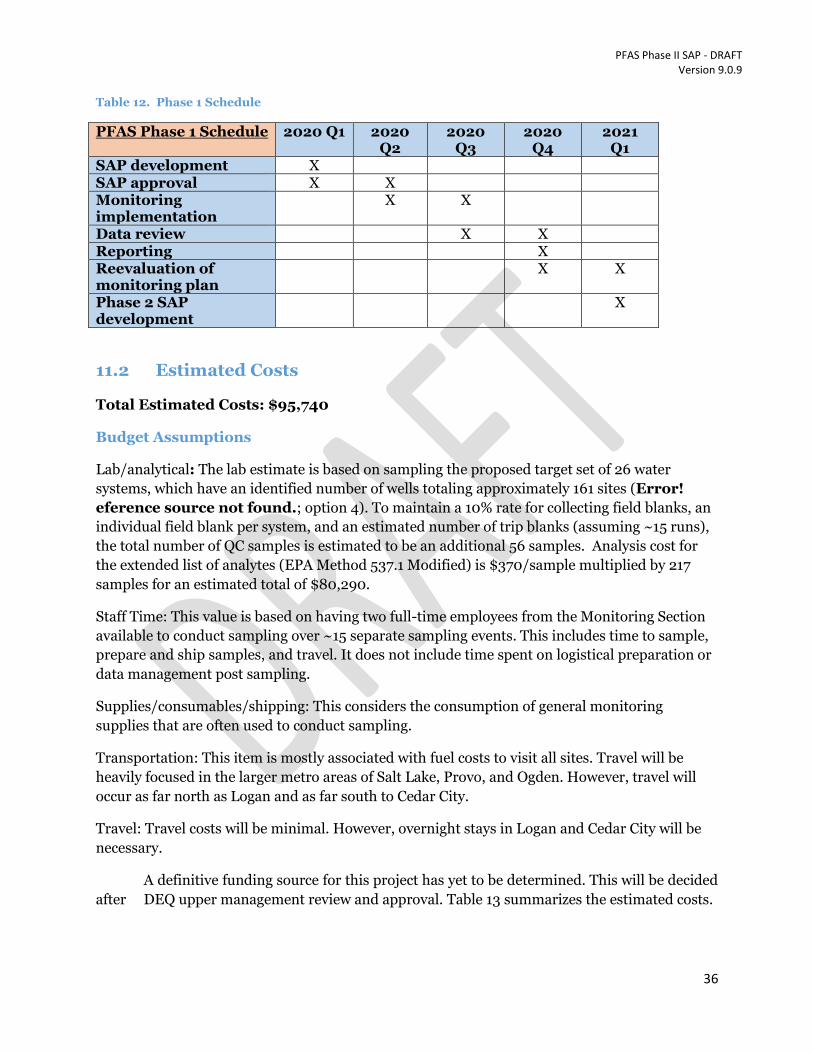
PFAS Phase II SAP - DRAFT Version 9.0.9
36
Table 12. Phase 1 Schedule
PFAS Phase 1 Schedule
2020 Q1 2020 Q2
2020 Q3
2020 Q4
2021 Q1
SAP development X SAP approval X X Monitoring implementation
X X
Data review X X Reporting X Reevaluation of monitoring plan
X X
Phase 2 SAP development
X
11.2 Estimated Costs
Total Estimated Costs: $95,740
Budget Assumptions
Lab/analytical: The lab estimate is based on sampling the proposed target set of 26 water
systems, which have an identified number of wells totaling approximately 161 sites (Error!
eference source not found.; option 4). To maintain a 10% rate for collecting field blanks, an
individual field blank per system, and an estimated number of trip blanks (assuming ~15 runs),
the total number of QC samples is estimated to be an additional 56 samples. Analysis cost for
the extended list of analytes (EPA Method 537.1 Modified) is $370/sample multiplied by 217
samples for an estimated total of $80,290.
Staff Time: This value is based on having two full-time employees from the Monitoring Section
available to conduct sampling over ~15 separate sampling events. This includes time to sample,
prepare and ship samples, and travel. It does not include time spent on logistical preparation or
data management post sampling.
Supplies/consumables/shipping: This considers the consumption of general monitoring
supplies that are often used to conduct sampling.
Transportation: This item is mostly associated with fuel costs to visit all sites. Travel will be
heavily focused in the larger metro areas of Salt Lake, Provo, and Ogden. However, travel will
occur as far north as Logan and as far south to Cedar City.
Travel: Travel costs will be minimal. However, overnight stays in Logan and Cedar City will be
necessary.
A definitive funding source for this project has yet to be determined. This will be decided
after DEQ upper management review and approval. Table 13 summarizes the estimated costs.

PFAS Phase II SAP - DRAFT Version 9.0.9
37
Table 13. Summary of Estimated Costs
Estimated Costs
Lab/analytical $80,290
Staff time (field work) $9,000
Supplies/consumables/shipping $450
Transportation $5,000
Travel $1,000
Total Estimated Costs $95,740
12.0 Site List
A line-item site list will be created upon approval of this SAP by DEQ management. The PFAS
workgroup will determine a final site list and implement sampling once a budget is provided and
sites have been selected. The site list will be a working document and will depend on well
locations and usage by drinking water systems, which may vary seasonally. Therefore, the target
site numbers are an estimate for budget and planning purposes only and are subject to change.
An addendum to this SAP will be added to this section once sites have been prioritized. It will
include the following:
Water provider name
Number of sampling locations
Unique site identifiers (monitoring location ID)
Trip/equipment/field blank information
Duplicate sample information
13.0 Decision Framework
Once results are received by DEQ, the DWQ QA officer will review and validate results and
summarize any QC issues. DDW and DWQ staff will review the data packages and determine if
results above detection are valid of a function of sample contamination. Additional samples will
be collected to confirm results if results are above detection. Furthermore, individual results for
PFAS compounds identified by the Agency for Toxic Substances and Disease Registry (ATSDR)
summarized in Figure 3. If results exceed either the EPA advisory levels for all PFAS
compounds or individual compounds in the list of ATSDR analytes, additional samples will be
collected from the distribution systems supplied by the well. If contamination if confirmed in a
drinking water system, DEQ and DOH staff will consult with the water provider to determine
the best course of action.

PFAS Phase II SAP - DRAFT Version 9.0.9
38
Figure 3. Decision flowchart for evaluating PFAS sample results
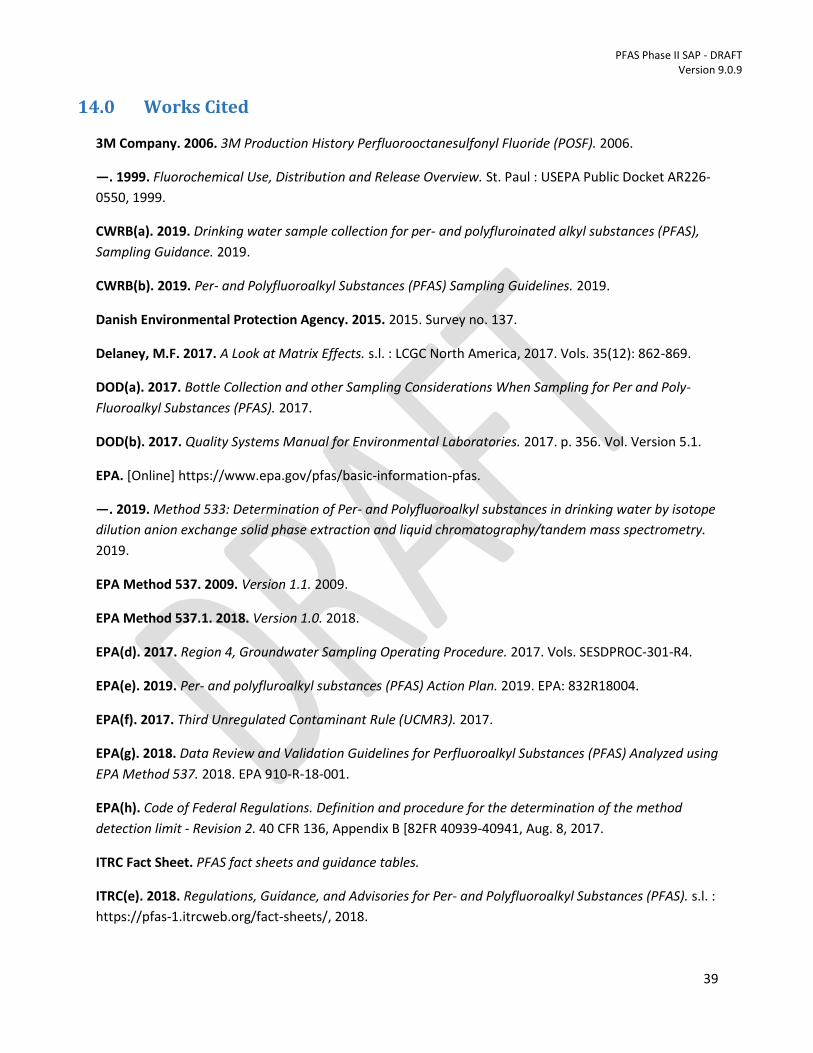
PFAS Phase II SAP - DRAFT Version 9.0.9
39
14.0 Works Cited
3M Company. 2006. 3M Production History Perfluorooctanesulfonyl Fluoride (POSF). 2006.
—. 1999. Fluorochemical Use, Distribution and Release Overview. St. Paul : USEPA Public Docket AR226-
0550, 1999.
CWRB(a). 2019. Drinking water sample collection for per- and polyfluroinated alkyl substances (PFAS),
Sampling Guidance. 2019.
CWRB(b). 2019. Per- and Polyfluoroalkyl Substances (PFAS) Sampling Guidelines. 2019.
Danish Environmental Protection Agency. 2015. 2015. Survey no. 137.
Delaney, M.F. 2017. A Look at Matrix Effects. s.l. : LCGC North America, 2017. Vols. 35(12): 862-869.
DOD(a). 2017. Bottle Collection and other Sampling Considerations When Sampling for Per and Poly-
Fluoroalkyl Substances (PFAS). 2017.
DOD(b). 2017. Quality Systems Manual for Environmental Laboratories. 2017. p. 356. Vol. Version 5.1.
EPA. [Online] https://www.epa.gov/pfas/basic-information-pfas.
—. 2019. Method 533: Determination of Per- and Polyfluoroalkyl substances in drinking water by isotope
dilution anion exchange solid phase extraction and liquid chromatography/tandem mass spectrometry.
2019.
EPA Method 537. 2009. Version 1.1. 2009.
EPA Method 537.1. 2018. Version 1.0. 2018.
EPA(d). 2017. Region 4, Groundwater Sampling Operating Procedure. 2017. Vols. SESDPROC-301-R4.
EPA(e). 2019. Per- and polyfluroalkyl substances (PFAS) Action Plan. 2019. EPA: 832R18004.
EPA(f). 2017. Third Unregulated Contaminant Rule (UCMR3). 2017.
EPA(g). 2018. Data Review and Validation Guidelines for Perfluoroalkyl Substances (PFAS) Analyzed using
EPA Method 537. 2018. EPA 910-R-18-001.
EPA(h). Code of Federal Regulations. Definition and procedure for the determination of the method
detection limit - Revision 2. 40 CFR 136, Appendix B [82FR 40939-40941, Aug. 8, 2017.
ITRC Fact Sheet. PFAS fact sheets and guidance tables.
ITRC(e). 2018. Regulations, Guidance, and Advisories for Per- and Polyfluoroalkyl Substances (PFAS). s.l. :
https://pfas-1.itrcweb.org/fact-sheets/, 2018.

PFAS Phase II SAP - DRAFT Version 9.0.9
40
ITRC(f). 2019. Standards and Guidance values for PFAS in groundwater, drinking water, and surface
water/effluent (wastewater). 2019. Table 4-1.
Krynitsky, A.J., et al. Important considerations regarding matrix effects when developing reliable
analytical residue methods using mass spectrometry. s.l. : LCGC North America. Vols. 35(7): 444-451.
Michigan DEQ. 2018. General PFAS Sampling Guidance. 2018.
NCBC. 2019. Sampling and Analysis Plan (Field Sampling Plan and Quality Assurance Project Plan) for
Per- and Polyfluoroalkyl substances in off-property private drinking water wells. 2019.
North Dakota DOH. 2016. North Dakota statewide per- and polyfluoralkly substances (PFAS) field
sampling plan. s.l. : North Dakota DOH personnel, 2016.
Utah DWQ. 2014. Quality Assurance Program Plan for Environmental Data Operations. 2014.
Wang et al. 2017. A never-ending story of Per- and Polyfluoroalkyl Substances. s.l. : Environ. Sci.
Technol., 2017. Vols. 51(5), 2508-2518.
Washington State Dept of Ecology. 2016. Quality Assurance Project Plan: Statewide survey of per- and
polyfluoroalkyl substances in Washington State river and lakes. 2016. 16-03-110.
Top Related