


Languages
Pages
Legal


GLOBAL POWERED AGRICULTURE EQUIPMENT MARKET
By Equipment Type (Tractor, Combine Harvester, Self-propelled
Sprayer, Self-propelled Forage Harvester, & Self-propelled
Sugarcane Harvester)
Country Analysis & Forecast from 2016 to 2022

BIS Research Sample Pages 2
Global Powered Agriculture Equipment Market
Country Analysis & Forecast from 2016 to 2022
BIS Research is a leading market intelligence and technology research company. BIS Research
publishes in-depth market intelligence reports focusing on the market estimations, technology
analysis, emerging high-growth applications, deeply segmented granular country-level market
data and other important market parameters useful in the strategic decision making for senior
management. BIS Research provides multi-client reports, company profiles, databases, and
custom research services.
Copyright © 2016 BIS Research
All Rights Reserved. This document contains highly confidential information and is the sole
property of BIS Research. Disclosing, copying, circulating, quoting or otherwise reproducing
any or all contents of this document is strictly prohibited. Access to this information is provided
exclusively for the benefit of the people or organization concerned. It may not be accessed by,
or offered whether for sale or otherwise to any third party.

BIS Research Sample Pages 3
Global Powered Agriculture Equipment Market
Country Analysis & Forecast from 2016 to 2022
TABLE OF CONTENTS
1 EXECUTIVE SUMMARY ....................................................................................... 19
2 SCOPE & RESEARCH METHODOLOGY ............................................................ 22
2.1 REPORT SCOPE ......................................................................... 22
2.1.1 MARKET DEFINITION ...................................................... 22
2.1.2 REPORT COVERAGE ......................................................... 23
2.1.2.1 Market Classification .................................................. 23
2.1.2.1.1 Market Segmentation by Equipment.................... 23
2.1.2.1.2 Market Segmentation by Geography ................... 24
2.1.3 ASSUMPTIONS & LIMITATIONS ...................................... 25
2.1.4 STAKEHOLDERS .............................................................. 26
2.2 RESEARCH PARAMETERS .......................................................... 26
2.3 RESEARCH DESIGN ................................................................... 28
2.3.1 SECONDARY RESEARCH .................................................. 29
2.3.2 PRIMARY RESEARCH ....................................................... 30
2.3.3 DATA ANALYZING & MARKET ESTIMATION ..................... 31
2.3.3.1 Bottom-Up Approach .................................................. 31
3 MARKET DYNAMICS ............................................................................................ 32
3.1 INTRODUCTION ........................................................................ 32
3.2 MARKET DRIVERS ..................................................................... 33
3.2.1 DECREASING ARABLE LAND AREA .................................. 33
3.2.2 RISING GLOBAL POPULATION ........................................ 34
3.2.3 EASY CREDIT AND SUBSIDIES AVAILABILITY IN
ASIAN MARKETS ............................................................. 36
3.2.4 RISING DEMAND FOR ADVANCED AGRICULTURAL
MACHINERY .................................................................... 37
3.3 MARKET RESTRAINTS ............................................................... 38
3.3.1 FLUCTUATING WEATHER CONDITIONS & FARMING
CALENDARS .................................................................... 38
3.3.2 DYNAMIC ECONOMIC ENVIRONMENT ............................. 40
BIS Research Sample Pages 4
Global Powered Agriculture Equipment Market
Country Analysis & Forecast from 2016 to 2022
3.3.3 ALTERING GOVERNMENT POLICIES ................................ 41
3.3.4 HIGH COST OF MACHINERY ............................................ 42
3.4 MARKET OPPORTUNITIES ......................................................... 43
3.4.1 IMPROVED CREDIT AVAILABILITY .................................. 43
3.4.2 GOVERNMENT SUBSIDIES ............................................... 43
4 INDUSTRY TRENDS ............................................................................................. 44
4.1 VALUE CHAIN ANALYSIS ........................................................... 44
4.2 CONSORTIUMS IN AGRICULTURE EQUIPMENT MARKET ............ 45
5 COMPETITIVE LANDSCAPE ............................................................................... 48
5.1 KEY STRATEGIES & DEVELOPMENTS IN THE GLOBAL
AGRICULUTURE EQUIPMENT MARKET ....................................... 48
5.1.1 INTRODUCTION .............................................................. 48
5.1.2 MERGERS AND ACQUISITIONS ....................................... 51
5.1.3 PARTNERSHIPS, COLLABORATIONS & JOINT
VENTURES ...................................................................... 53
5.1.4 PRODUCT LAUNCHES ...................................................... 54
5.1.5 BUSINESS EXPANSION ................................................... 55
5.1.6 AWARDS & RECOGNITIONS ............................................ 56
5.2 PORTER’S FIVE FORCES ANALYSIS ........................................... 59
5.2.1 INTRODUCTION .............................................................. 59
5.2.2 THREAT OF NEW ENTRANTS ............................................ 61
5.2.2.1 Capital Requirements ................................................. 61
5.2.2.2 Product Differentiation ............................................... 61
5.2.2.3 Government Policies .................................................. 62
5.2.2.4 Economies of Scale .................................................... 62
5.2.2.5 Access to Distribution Channel..................................... 62
5.2.3 BARGAINING POWER OF BUYERS ................................... 62
5.2.3.1 Concentration of Buyers ............................................. 63
5.2.3.2 Product Differentiation ............................................... 63
5.2.3.3 Buyer’s Information About Supplier’s Product ................ 63
5.2.3.4 Switching Cost .......................................................... 63
5.2.3.5 Presence of Substitutes .............................................. 64
5.2.4 BARGAINING POWER OF SUPPLIERS .............................. 64

BIS Research Sample Pages 5
Global Powered Agriculture Equipment Market
Country Analysis & Forecast from 2016 to 2022
5.2.4.1 Product Differentiation ............................................... 64
5.2.4.2 Supplier Concentration ............................................... 64
5.2.4.3 Threat of forward integration ...................................... 65
5.2.4.4 Switching Cost .......................................................... 65
5.2.5 THREAT FROM SUBSTITUTES .......................................... 65
5.2.5.1 Switching Costs ......................................................... 65
5.2.5.2 Buyer’s Propensity towards Substitute .......................... 65
5.2.6 INTENSITY OF COMPETITIVE RIVALRY ........................... 66
5.2.6.1 Industry Concentration ............................................... 66
5.2.6.2 Intermittent Over Capacity ......................................... 66
5.2.6.3 Customer’s Loyalty Towards Brand ............................... 66
5.2.6.4 Switching Cost .......................................................... 67
5.2.6.5 Product Differentiation ............................................... 67
5.2.6.6 Entry Barriers ........................................................... 67
6 AGRICULTURE EQUIPMENT MARKET, BY EQUIPMENTS ........................ 68
6.1 INTRODUCTION ........................................................................ 69
6.2 TRACTOR .................................................................................. 70
6.2.1 REGIONAL ANALYSIS OF TRACTORS MARKET ................. 71
6.2.1.1 The Americas ............................................................ 71
6.2.1.2 Europe ..................................................................... 79
6.2.1.3 Asia-Pacific ............................................................... 87
6.3 COMBINE/COMBINE HARVESTER ............................................ 102
6.4 SELF-PROPELLED SPRAYER ..................................................... 106
6.5 FORAGE HARVESTER ............................................................... 111
6.6 SUGAR CANE HARVESTER ....................................................... 114
7 GEOGRAPHICAL ANALYSIS ............................................................................ 117
7.1 INTRODUCTION ...................................................................... 118
7.2 THE AMERICAS ....................................................................... 119
7.2.1 MARKET STATISTICS .................................................... 120
7.2.2 NORTH AMERICA .......................................................... 122
7.2.2.1 THE U.S. ................................................................ 125
7.2.2.2 CANADA ................................................................. 127

BIS Research Sample Pages 6
Global Powered Agriculture Equipment Market
Country Analysis & Forecast from 2016 to 2022
7.2.3 SOUTH AMERICA ........................................................... 129
7.2.3.1 BRAZIL .................................................................. 131
7.2.3.2 Rest of South America .............................................. 134
7.3 EUROPE .................................................................................. 136
7.3.1 MARKET STATISTICS .................................................... 137
7.3.2 WESTERN EUROPE ........................................................ 139
7.3.2.1 GERMANY ............................................................... 141
7.3.2.2 THE U.K. ................................................................ 143
7.3.2.3 FRANCE ................................................................. 146
7.3.2.4 ITALY .................................................................... 148
7.3.2.5 Rest of Western Europe ............................................ 151
7.3.3 EASTERN & CENTRAL EUROPE ....................................... 152
7.3.3.1 RUSSIA .................................................................. 154
7.3.3.2 Turkey ................................................................... 155
7.4 ASIA-PACIFIC ......................................................................... 157
7.4.1 MARKET STATISTICS .................................................... 158
7.4.2 CHINA ........................................................................... 159
7.4.3 INDIA ........................................................................... 161
7.4.4 JAPAN ........................................................................... 164
7.4.5 AUSTRALIA/NEW ZEALAND .......................................... 166
7.4.6 SOUTH KOREA ............................................................... 168
7.4.7 REST OF ASIA-PACIFIC ................................................. 171
7.5 REST OF THE WORLD .............................................................. 173
7.5.1 MARKET STATISTICS .................................................... 174
7.5.2 MIDDLE EAST & NORTH AFRICA .................................... 175
7.5.3 SOUTH AFRICA ............................................................. 176
8 COMPANY PROFILES ........................................................................................ 178
8.1 INTRODUCTION ...................................................................... 178
8.2 AGCO CORPORATION .............................................................. 179
8.2.1 COMPANY OVERVIEW ................................................... 179
8.2.2 FINANCIALS ................................................................. 180
8.2.2.1 Overall Financials .................................................... 180
8.2.2.2 Geographic Revenue Mix .......................................... 181

BIS Research Sample Pages 7
Global Powered Agriculture Equipment Market
Country Analysis & Forecast from 2016 to 2022
8.2.2.3 Segment Revenue Mix .............................................. 182
8.2.2.4 Financial Summary .................................................. 182
8.2.3 KEY STRATEGIES & DEVELOPMENTS ............................. 183
8.2.4 SWOT ANALYSIS ........................................................... 185
8.3 ALAMO GROUP ........................................................................ 186
8.3.1 COMPANY OVERVIEW ................................................... 186
8.3.2 FINANCIALS ................................................................. 187
8.3.2.1 Overall Financials .................................................... 187
8.3.2.2 Revenue by Divisions (Segment & Geographical
Revenue Mix) .......................................................... 188
8.3.2.3 Financial Summary .................................................. 188
8.3.3 KEY STRATEGIES & DEVELOPMENTS ............................. 189
8.3.4 SWOT ANALYSIS ........................................................... 190
8.4 CLAAS GROUP ......................................................................... 191
8.4.1 COMPANY OVERVIEW ................................................... 191
8.4.2 FINANCIALS ................................................................. 192
8.4.2.1 Overall Financials .................................................... 192
8.4.2.2 Geographic Revenue Mix .......................................... 193
8.4.2.3 Financial Summary .................................................. 193
8.4.3 KEY STRATEGIES & DEVELOPMENTS ............................. 194
8.4.4 SWOT ANALYSIS ........................................................... 196
8.5 CNH INDUSTRIAL NV .............................................................. 197
8.5.1 COMPANY OVERVIEW ................................................... 197
8.5.2 FINANCIALS ................................................................. 198
8.5.2.1 Overall Financials .................................................... 198
8.5.2.2 Geographic Revenue Mix .......................................... 199
8.5.2.3 Segment Revenue Mix .............................................. 200
8.5.2.4 Financial Summary .................................................. 200
8.5.3 KEY STRATEGIES & DEVELOPMENTS ............................. 201
8.5.4 SWOT ANALYSIS ........................................................... 203
8.6 DEERE & COMPANY ................................................................. 204
8.6.1 COMPANY OVERVIEW ................................................... 204
8.6.2 FINANCIALS ................................................................. 205
8.6.2.1 Overall Financials .................................................... 205

BIS Research Sample Pages 8
Global Powered Agriculture Equipment Market
Country Analysis & Forecast from 2016 to 2022
8.6.2.2 Geographic Revenue Mix .......................................... 206
8.6.2.3 Segment Revenue Mix .............................................. 207
8.6.2.4 Financial Summary .................................................. 207
8.6.3 KEY STRATEGIES & DEVELOPMENTS ............................. 208
8.6.4 SWOT ANALYSIS ........................................................... 210
8.7 ESCORTS GROUP ..................................................................... 211
8.7.1 COMPANY OVERVIEW ................................................... 211
8.7.2 FINANCIALS ................................................................. 212
8.7.2.1 Segment Revenue Mix .............................................. 212
8.7.2.2 Financial Summary .................................................. 212
8.7.3 KEY STRATEGIES & DEVELOPMENTS ............................. 213
8.7.4 SWOT ANALYSIS ........................................................... 214
8.8 ISEKI & COMPANY LIMITED .................................................... 215
8.8.1 COMPANY OVERVIEW ................................................... 215
8.8.2 FINANCIALS ................................................................. 216
8.8.2.1 Overall Financials .................................................... 216
8.8.2.2 Segment Revenue Mix .............................................. 217
8.8.2.3 Geographic Revenue Mix .......................................... 218
8.8.2.4 Financial Summary .................................................. 218
8.8.3 KEY STRATEGIES & DEVELOPMENTS ............................. 219
8.8.4 SWOT ANALYSIS ........................................................... 220
8.9 KUBOTA CORPORATION .......................................................... 221
8.9.1 COMPANY OVERVIEW ................................................... 221
8.9.2 FINANCIALS ................................................................. 222
8.9.2.1 Overall Financials .................................................... 222
8.9.2.2 Segment Revenue Mix .............................................. 223
8.9.2.3 Geographic Revenue Mix .......................................... 224
8.9.2.4 Financial Summary .................................................. 224
8.9.3 KEY STRATEGIES & DEVELOPMENTS ............................. 225
8.9.4 SWOT ANALYSIS ........................................................... 226
8.10 MAHINDRA & MAHINDRA (M&M) ............................................ 227
8.10.1 COMPANY OVERVIEW ................................................... 227
8.10.2 FINANCIALS ................................................................. 228
8.10.2.1 Overall Financials .................................................... 228

BIS Research Sample Pages 9
Global Powered Agriculture Equipment Market
Country Analysis & Forecast from 2016 to 2022
8.10.2.2 Segment Revenue Mix .............................................. 229
8.10.2.3 Geographic Revenue Mix .......................................... 230
8.10.2.4 Financial Summary .................................................. 230
8.10.3 KEY STRATEGIES & DEVELOPMENTS ............................. 231
8.10.4 SWOT ANALYSIS ........................................................... 233
8.11 SAME DEUTZ-FAHR GROUP S.P.A. ........................................... 234
8.11.1 COMPANY OVERVIEW ................................................... 234
8.11.2 FINANCIALS ................................................................. 235
8.11.2.1 Overall Financials .................................................... 235
8.11.2.2 Segment Revenue Mix .............................................. 236
8.11.2.3 Geographic Revenue Mix .......................................... 237
8.11.2.4 Financial Summary .................................................. 237
8.11.3 KEY STRATEGIES & DEVELOPMENTS ............................. 238
8.11.4 SWOT ANALYSIS ........................................................... 239

BIS Research Sample Pages 10
Global Powered Agriculture Equipment Market
Country Analysis & Forecast from 2016 to 2022
LIST OF TABLES
TABLE 1 INCREASE IN ARABLE LAND AREA 33
TABLE 2 PRESENT & ESTIMATED CHANGE IN POPULATION IN THE TEN MOST POPULOUS COUNTRIES 35
TABLE 3 SUBSIDIES SPECIFICALLY FOR THE PURCHASE OF AGRICULTURE
EQUIPMENT 36
TABLE 4 WORLD FARMING CALENDAR 39
TABLE 5 PRICES OF AGRICULTURE EQUIPMENTS 42
TABLE 6 THE U.S. : TRACTORS SALES BY HP, 2015 – 2022 (UNITS) 71
TABLE 7 KEY COMPANIES OPERATING IN THE U.S. 73
TABLE 8 CANADA : TRACTORS SALES BY HP, 2015 – 2022 (UNITS) 74
TABLE 9 BRAZIL : TRACTORS SALES BY HP, 2015 – 2022 (UNITS) 75
TABLE 10 REST OF SOUTH AMERICA : TRACTORS SALES BY HP, 2015 – 2022
(UNITS) 78
TABLE 11 GERMANY: TRACTORS SALES BY HP, 2015 – 2022 (UNITS) 79
TABLE 12 THE U.K.: TRACTORS SALES BY HP, 2015 – 2022 (UNITS) 80
TABLE 13 FRANCE: TRACTORS SALES BY HP, 2015 – 2022 (UNITS) 81
TABLE 14 ITALY: TRACTORS SALES BY HP, 2015 – 2022 (UNITS) 82
TABLE 15 REST OF WESTERN EUROPE: TRACTORS SALES BY HP, 2015 – 2022
(UNITS) 83
TABLE 16 RUSSIA: TRACTORS SALES BY HP, 2015 – 2022 (UNITS) 84
TABLE 17 TURKEY: TRACTORS SALES BY HP, 2015 – 2022 (UNITS) 85
TABLE 18 INDIA: TRACTORS SALES BY HP, 2015 – 2022 (UNITS) 87
TABLE 19 FARM MECHANIZATION SCHEMES 89
TABLE 20 NUMBER OF TRACTORS PER HECTARE BY STATE 92
TABLE 21 KEY COMPANIES OPERATING IN INDIA 93
TABLE 22 CHINA: TRACTORS SALES BY HP, 2015 – 2022 (UNITS) 94
TABLE 23 SALE OF TRACTORS WITH PRODUCTION VOLUMES 95
TABLE 24 EXPORT VOLUME OF WHEELED TRACTOR 95
TABLE 25 SUBSIDIES FOR TRACTORS IN CHINA 97
TABLE 26 KEY COMPANIES OPERATING IN CHINA BY MARKET SHARE 98
TABLE 27 JAPAN: TRACTORS SALES BY HP, 2015 – 2022 (UNITS) 99
TABLE 28 AUSTRALIA & NEW ZEALAND: TRACTORS SALES BY HP, 2015 – 2022
(UNITS) 99
BIS Research Sample Pages 11
Global Powered Agriculture Equipment Market
Country Analysis & Forecast from 2016 to 2022
TABLE 29 KOREA: TRACTORS SALES BY HP, 2015 – 2022 (UNITS) 100
TABLE 30 REST OF APAC: TRACTORS SALES BY HP, 2015 – 2022 (UNITS) 101
TABLE 31 GLOBAL COMBINES MARKET SIZE, BY COUNTRY, 2014 – 2022 (UNITS) 103
TABLE 32 REGISTRATION OF COMBINE HARVESTERS IN EU 105
TABLE 33 GLOBAL SELF-PROPELLED SPRAYERS MARKET SIZE, BY COUNTRY, 2014 – 2022 (UNITS) 108
TABLE 34 ASP OF SPRAYERS 110
TABLE 35 GLOBAL SELF-PROPELLED FORAGE HARVESTERS MARKET SIZE, BY
COUNTRY, 2014 – 2022 (UNITS) 112
TABLE 36 GLOBAL SELF-PROPELLED SUGAR CANE HARVESTER MARKET SIZE, BY COUNTRY, 2014 – 2022 (UNITS) 115
TABLE 37 THE AMERICAS AGRICULTURE EQUIPMENT MARKET VOLUME, BY TYPE
(UNITS), 2015-2022 120
TABLE 38 THE AMERICAS TRACTOR MARKET VOLUME, BY TYPE (UNITS), 2015-2022 121
TABLE 39 THE AMERICAS AGRICULTURE EQUIPMENT MARKET VOLUME, BY
REGION (UNITS), 2015-2022 122
TABLE 40 NORTH AMERICA AGRICULTURE EQUIPMENT MARKET VOLUME, BY TYPE
(UNITS), 2015-2022 124
TABLE 41 NORTH AMERICA TRACTOR MARKET VOLUME, BY TYPE (UNITS), 2015-2022 125
TABLE 42 THE U.S. AGRICULTURE EQUIPMENT MARKET VOLUME, BY TYPE
(UNITS), 2015-2022 126
TABLE 43 THE U.S. TRACTOR MARKET VOLUME, BY TYPE (UNITS), 2015-2022 127
TABLE 44 CANADA AGRICULTURE EQUIPMENT MARKET VOLUME, BY TYPE (UNITS), 2015-2022 128
TABLE 45 CANADA TRACTOR MARKET VOLUME, BY TYPE (UNITS), 2015-2022 129
TABLE 46 SOUTH AMERICA AGRICULTURE EQUIPMENT MARKET VOLUME, BY TYPE
(UNITS), 2015-2022 130
TABLE 47 SOUTH AMERICA TRACTOR MARKET VOLUME, BY TYPE (UNITS), 2015-
2022 131
TABLE 48 BRAZIL AGRICULTURE EQUIPMENT MARKET VOLUME, BY TYPE (UNITS), 2015-2022 132
TABLE 49 BRAZIL TRACTOR MARKET VOLUME, BY TYPE (UNITS), 2015-2022 133
TABLE 50 REST OF SOUTH AMERICA AGRICULTURE EQUIPMENT MARKET VOLUME,
BY TYPE (UNITS), 2015-2022 134
TABLE 51 REST OF SOUTH AMERICA TRACTOR MARKET VOLUME, BY TYPE (UNITS), 2015-2022 135
TABLE 52 EUROPE AGRICULTURE EQUIPMENT MARKET VOLUME, BY TYPE
(UNITS), 2015-2022 137

BIS Research Sample Pages 12
Global Powered Agriculture Equipment Market
Country Analysis & Forecast from 2016 to 2022
TABLE 53 EUROPE TRACTOR MARKET VOLUME, BY TYPE (UNITS), 2015-2022 138
TABLE 54 EUROPE AGRICULTURAL EQUIPMENT MARKET VOLUME, BY REGION
(UNITS), 2015-2022 138
TABLE 55 WESTERN EUROPE AGRICULTURE EQUIPMENT MARKET VOLUME, BY TYPE (UNITS), 2015-2022 139
TABLE 56 WESTERN EUROPE TRACTOR MARKET VOLUME, BY TYPE (UNITS), 2015-
2022 140
TABLE 57 GERMANY TRACTOR MARKET STATISTICS 142
TABLE 58 GERMANY AGRICULTURE EQUIPMENT MARKET VOLUME, BY TYPE
(UNITS), 2015-2022 142
TABLE 59 GERMANY TRACTOR MARKET VOLUME, BY TYPE (UNITS), 2015-2022 143
TABLE 60 TRACTOR MARKET STATISTICS 144
TABLE 61 THE U.K. AGRICULTURE EQUIPMENT MARKET VOLUME, BY TYPE (UNITS), 2015-2022 144
TABLE 62 THE U.K. TRACTOR MARKET VOLUME, BY TYPE (UNITS), 2015-2022 145
TABLE 63 TRACTOR MARKET STATISTICS 146
TABLE 64 FRANCE AGRICULTURE EQUIPMENT MARKET VOLUME, BY TYPE (UNITS), 2015-2022 147
TABLE 65 FRANCE TRACTOR MARKET VOLUME, BY TYPE (UNITS), 2015-2022 148
TABLE 66 TRACTOR MARKET STATISTICS 149
TABLE 67 ITALY AGRICULTURE EQUIPMENT MARKET VOLUME, BY TYPE (UNITS),
2015-2022 149
TABLE 68 ITALY TRACTOR MARKET VOLUME, BY TYPE (UNITS), 2015-2022 150
TABLE 69 REST OF WESTERN EUROPE AGRICULTURE EQUIPMENT MARKET
VOLUME, BY TYPE (UNITS), 2015-2022 151
TABLE 70 REST OF WESTERN EUROPE TRACTOR MARKET VOLUME, BY TYPE (UNITS), 2015-2022 152
TABLE 71 EASTERN/CENTRAL EUROPE AGRICULTURE EQUIPMENT MARKET
VOLUME, BY TYPE (UNITS), 2015-2022 153
TABLE 72 EASTERN/CENTRAL EUROPE TRACTOR MARKET VOLUME, BY TYPE (UNITS), 2015-2022 154
TABLE 73 RUSSIA TRACTOR MARKET VOLUME, BY TYPE (UNITS), 2015-2022 155
TABLE 74 TURKEY TRACTOR MARKET VOLUME, BY TYPE (UNITS), 2015-2022 156
TABLE 75 ASIA-PACIFIC AGRICULTURE EQUIPMENT MARKET VOLUME, BY TYPE
(UNITS), 2015-2022 158
TABLE 76 CHINA AGRICULTURE EQUIPMENT MARKET VOLUME, BY TYPE (UNITS),
2015-2022 160
TABLE 77 CHINA TRACTOR MARKET VOLUME, BY TYPE (UNITS), 2015-2022 161
TABLE 78 PRICE & SUBSIDY OF AGRICULTURE EQUIPMENT 162

BIS Research Sample Pages 13
Global Powered Agriculture Equipment Market
Country Analysis & Forecast from 2016 to 2022
TABLE 79 INDIA AGRICULTURE EQUIPMENT MARKET VOLUME, BY TYPE (UNITS),
2015-2022 163
TABLE 80 INDIA TRACTOR MARKET VOLUME, BY TYPE (UNITS), 2015-2022 164
TABLE 81 JAPAN AGRICULTURE EQUIPMENT MARKET VOLUME, BY TYPE (UNITS), 2015-2022 165
TABLE 82 JAPAN TRACTOR MARKET VOLUME, BY TYPE (UNITS), 2015-2022 166
TABLE 83 AUSTRALIA & NEWZEALAND AGRICULTURE EQUIPMENT MARKET
VOLUME, BY TYPE (UNITS), 2015-2022 167
TABLE 84 AUSTRALIA & NEW ZEALAND TRACTOR MARKET VOLUME, BY TYPE
(UNITS), 2015-2022 168
TABLE 85 SOUTH KOREA AGRICULTURE EQUIPMENT MARKET VOLUME, BY TYPE (UNITS), 2015-2022 169
TABLE 86 SOUTH KOREA TRACTOR MARKET VOLUME, BY TYPE (UNITS), 2015-
2022 170
TABLE 87 REST OF APAC AGRICULTURE EQUIPMENT MARKET VOLUME, BY TYPE (UNITS), 2015-2022 171
TABLE 88 REST OF APAC TRACTOR MARKET VOLUME, BY TYPE (UNITS), 2015-
2022 172
TABLE 89 REST OF THE WORLD (ROW) AGRICULTURE EQUIPMENT MARKET VOLUME, BY TYPE (UNITS), 2015-2022 174
TABLE 90 MIDDLE EAST & NORTH AFRICA AGRICULTURE EQUIPMENT MARKET
VOLUME, BY TYPE (UNITS), 2015-2022 175
TABLE 91 SHARE OF AGRICULTURE TRACTOR PLAYERS IN SOUTH AFRICA (2014) 176
TABLE 92 SOUTH AFRICA AGRICULTURE EQUIPMENT MARKET VOLUME, BY TYPE
(UNITS), 2015-2022 177

BIS Research Sample Pages 14
Global Powered Agriculture Equipment Market
Country Analysis & Forecast from 2016 to 2022
LIST OF FIGURES
FIGURE 1 GLOBAL AGRICULTURE EQUIPMENT MARKET, BY EQUIPMENT TYPE (UNITS) 19
FIGURE 2 TRACTORS AND COMBINES MARKET VOLUME, BY COUNTRY, 2015
(UNITS) 21
FIGURE 3 AGRICULTURE EQUIPMENT MARKET CLASSIFICATION 23
FIGURE 4 AGRICULTURE EQUIPMENT MARKET SEGMENTATION, BY EQUIPMENT TYPE 23
FIGURE 5 AGRICULTURE EQUIPMENT MARKET SEGMENTATION, BY GEOGRAPHY 24
FIGURE 6 AGRICULTURE EQUIPMENT MARKET – STAKEHOLDERS 26
FIGURE 7 RESEARCH PARAMETERS 27
FIGURE 8 REPORT DESIGN 28
FIGURE 9 PRIMARY INTERVIEWS BREAKDOWN, BY PLAYERS, DESIGNATION, AND REGION 30
FIGURE 10 DRO OF AGRICULTURAL EQUIPMENT MARKET AND THE INTENSITY OF
IMPACT 32
FIGURE 11 EFFECT OF ECONOMIC ENVIRONMENT ON THE AGRICULTURE EQUIPMENT DEMAND 41
FIGURE 12 VALUE CHAIN ANALYSIS OF AGRICULTURE EQUIPMENT MARKET 44
FIGURE 13 ORGANIC & INORGANIC STRATEGIES ADOPTED BY THE KEY PLAYERS 49
FIGURE 14 TOTAL NUMBER OF STRATEGIES & DEVELOPMENTS 51
FIGURE 15 KEY MERGERS & ACQUISITIONS (2013-15) 52
FIGURE 16 KEY PARTNERSHIPS & COLLABORATIONS (2013-15) 54
FIGURE 17 KEY PRODUCT LAUNCHES (2013-15) 55
FIGURE 18 KEY BUSINESS EXPANSION ACTIVITIES (2013-15) 56
FIGURE 19 KEY AWARDS & RECOGNITIONS (2013-15) 58
FIGURE 20 PORTER’S FIVE FORCES ANALYSIS FOR THE AGRICULTURE EQUIPMENT
INDUSTRY 60
FIGURE 21 TRACTORS VOLUME TO CROSS 2.3 MILLION UNITS BY 2022 69
FIGURE 22 INDIA & CHINA – LEADING TRACTORS MARKETS 70
FIGURE 23 DRIVERS OF TRACTOR MARKET IN THE U.S. 72
FIGURE 24 DRIVERS OF TRACTOR MARKET IN BRAZIL 76
FIGURE 25 CHALLENGES FACED BY TRACTOR MARKET IN BRAZIL 77
FIGURE 26 CHALLENGES IN TRACTOR MARKET IN TURKEY 86
FIGURE 27 DRIVERS OF TRACTOR MARKET IN INDIA 88
BIS Research Sample Pages 15
Global Powered Agriculture Equipment Market
Country Analysis & Forecast from 2016 to 2022
FIGURE 28 CHALLENGES FOR TRACTOR MARKET IN INDIA 90
FIGURE 29 SEGMENTATION OF TRACTORS IN INDIA BY HORSEPOWER & MARKET
SHARE 91
FIGURE 30 DRIVER OF THE TRACTOR MARKET IN CHINA 96
FIGURE 31 INDIA & BRAZIL – LEADING IN COMBINES MARKET 102
FIGURE 32 THE U.S. – THE LARGEST MARKET FOR SPRAYERS, 2015 107
FIGURE 33 FORAGE HARVESTERS MARKET SIZE, VOLUME (UNITS) 111
FIGURE 34 BRAZIL – LEADING COUNTRY SUGARCANE HARVESTER MARKET 114
FIGURE 35 GEOGRAPHIC LANDSCAPE 118
FIGURE 36 SNAPSHOT OF AGRICULTURE EQUIPMENT MARKET IN THE AMERICAS 119
FIGURE 37 SNAPSHOT OF AGRICULTURE EQUIPMENT MARKET IN NORTH AMERICA 123
FIGURE 38 SNAPSHOT OF AGRICULTURE EQUIPMENT MARKET IN EUROPE 136
FIGURE 39 SNAPSHOT OF WESTERN EUROPE AGRICULTURE EQUIPMENT MARKET, BY COUNTRY 141
FIGURE 40 SNAPSHOT OF AGRICULTURE EQUIPMENT MARKET IN ASIA-PACIFIC 157
FIGURE 41 SNAPSHOT OF AGRICULTURE EQUIPMENT MARKET IN ROW 173
FIGURE 42 GEOGRAPHIC REVENUE MIX OF TOP 5 PLAYERS IN THE MARKET 178
FIGURE 43 OVERALL FINANCIALS, 2012-14 ($MILLION) 180
FIGURE 44 GEOGRAPHIC REVENUE MIX, 2012-14 ($MILLION) 181
FIGURE 45 SEGMENT REVENUE MIX, 2012-14 ($MILLION) 182
FIGURE 46 OVERALL FINANCIALS, 2012-14 ($MILLION) 187
FIGURE 47 REVENUE BY DIVISIONS, 2012-14 ($MILLION) 188
FIGURE 48 OVERALL FINANCIALS, 2013-15 ($MILLION) 192
FIGURE 49 GEOGRAPHIC REVENUE MIX, 2013-14 ($MILLION) 193
FIGURE 50 OVERALL FINANCIALS, 2012-14 ($BILLION) 198
FIGURE 51 GEOGRAPHIC REVENUE MIX, 2013-14 ($BILLION) 199
FIGURE 52 SEGMENT REVENUE MIX, 2012-14 ($BILLION) 200
FIGURE 53 OVERALL FINANCIALS, 2012-14 ($BILLION) 205
FIGURE 54 GEOGRAPHIC REVENUE MIX, 2012-14 ($BILLION) 206
FIGURE 55 SEGMENT REVENUE MIX, 2012-14 ($BILLION) 207
FIGURE 56 SEGMENT REVENUE MIX, 2012-14 ($MILLION) 212
FIGURE 57 OVERALL FINANCIALS, 2012-14 ($MILLION) 216
FIGURE 58 SEGMENT REVENUE MIX, 2012-14 ($MILLION) 217
FIGURE 59 GEOGRAPHIC REVENUE MIX, 2012-14 ($MILLION) 218
FIGURE 60 OVERALL FINANCIALS, 2012-14 ($MILLION) 222
FIGURE 61 SEGMENT REVENUE MIX, 2012-14 ($MILLION) 223

BIS Research Sample Pages 16
Global Powered Agriculture Equipment Market
Country Analysis & Forecast from 2016 to 2022
FIGURE 62 GEOGRAPHIC REVENUE MIX, 2012-14 ($MILLION) 224
FIGURE 63 OVERALL FINANCIALS, 2012-14 ($MILLION) 228
FIGURE 64 SEGMENT REVENUE MIX, 2012-14 ($MILLION) 229
FIGURE 65 GEOGRAPHIC REVENUE MIX, 2012-14 ($MILLION) 230
FIGURE 66 OVERALL FINANCIALS, 2012-14 ($MILLION) 235
FIGURE 67 SEGMENT REVENUE MIX, 2012-14 ($MILLION) 236
FIGURE 68 GEOGRAPHIC REVENUE MIX, 2012-14 ($MILLION) 237

BIS Research Sample Pages 17
Global Powered Agriculture Equipment Market
Country Analysis & Forecast from 2016 to 2022
1 EXECUTIVE SUMMARY
The need for agriculture equipments is gradually rising due to constraining factors such as
rising global population, growing labor shortage and rural wages. The increasing mechanization
in agriculture provides with the solution of the above issues and offers the scope of maximizing
production and productivity both. The rising farm income is the major factor driving the end
users to adopt more of the agriculture equipments. The agriculture equipment market has
been categorized into key equipments, namely: tractors, combine harvesters, sprayers, forage
harvesters, and sugarcane harvesters. In this report, the market share and size of these
agriculture equipments have been tracked.
FIGURE 1
GLOBAL AGRICULTURE EQUIPMENT MARKET, BY EQUIPMENT TYPE
(UNITS)
Tractors
Combines
Sprayers
Forage
Harvesters
Sugar cane
Harvesters
Volume, 2015 (Units) Volume, 2022 (Units) CAGR % (2016 – 2022)
XX
XX
XX
XX
XX
XX
XX
XX
XX
XX
XX
XX
XX
XX
XX
Volume, 2014 (Units)
XX
XX
XX
XX
XX
Source: Secondary Research, Expert Interviews, and BIS Research Analysis
The figure above details the market size and growth of global agriculture equipment market.
The sales of tractor market was XX units in 2012, which increased by XX% in 2013. The
market, however, declined by XX% in 2014 and further went down to XX% in 2015. However,
this sales volume is predicted to increase and reach XX units by 2022. The sales of combine

BIS Research Sample Pages 18
Global Powered Agriculture Equipment Market
Country Analysis & Forecast from 2016 to 2022
harvester was XX units in 2012, which increased by XX% in 2013. The market then declined
by XX% in 2014 and further XX% in 2015. However, this sales volume is predicted to increase
and reach XX units by 2022.
The sales of sprayers was XX units in 2012, which increased by XX% in 2013. Later the market
declined by XX% in 2014 and increased by XX% in 2015. However, this sales volume is
predicted to increase and reach XX units by 2022. The sales of forage harvester was XX units
in 2012, which decreased by XX% in 2013. Further the market declined by XX% and XX% in
2014 and 2015 respectively. However, this sales volume is predicted to increase and reach XX
units by 2022. The sales of sugarcane harvester was XX units in 2012, which increased by
XX% in 2013. Later the market declined by XX% in 2014 and further XX% in 2015. However,
this sales volume is predicted to increase and reach XX units by 2022.
Some of the key players in the industry are: AGCO Corporation, CNH Industrial, Deere & Co.,
Kubota Corporation, Same Deutz FAHR, and Mahindra & Mahindra among others. These
companies are further aiming for more product launches and mergers & acquisitions to expand
their market and stop new entrants from entering. The expected growth rate between 2016
and 2022 of the market would remain less than XX% because of factors such as: high cost of
equipments, fluctuating weather conditions, altering government policies, and dynamic
economic environment among others, thus, restricting the market growth.

BIS Research Sample Pages 19
Global Powered Agriculture Equipment Market
Country Analysis & Forecast from 2016 to 2022
FIGURE 2
TRACTORS AND COMBINES MARKET VOLUME, BY COUNTRY,
2015 (UNITS)
CanadaTractors: XX units
Combines: XX units
U.S.Tractors: XX units
Combines: XX units
Brazil Tractors: 52,985 units
Combines: 6,786 units
U.K.Tractors: XX units
Combines: XX units
Germany Tractors: XX units
Combines: XX units Russia Tractors: XX units
Combines: XX units
China Tractors: XX units
Combines: XX unitsIndia Tractors: XX units
Combines: XX units
Australia & New
Zealand Tractors: XX units
Combines: XX units
Source: Secondary Research, Expert Interviews, and BIS Research Analysis
The above figure shows the tractors and combines market volumes in different countries in
2015. Maximum sales of tractors i.e. XX units in the year 2015 was from India, followed by
China. In India XX units of combine harvesters were sold in the same year. Similarly, China
sold a total of XX units of tractors and XX units of combines in 2015. The next country leading
is the U.S., contributing a significant share in the global agriculture equipment market. The
country sold XX units of tractors and XX units of combines in 2015.
APAC is leading the market by selling a total of XX units of agricultural equipments in 2015.
This is due to the reason that it includes countries such as India, China, and Japan, among
others which are the leading populous countries globally. This high rate of population has
boosted the demand of food & other agricultural products and consequently has led to the rise
in demand of agriculture equipments.

BIS Research Sample Pages 20
Global Powered Agriculture Equipment Market
Country Analysis & Forecast from 2016 to 2022
2 SCOPE & RESEARCH METHODOLOGY
2.1 REPORT SCOPE
The necessity of engaging in innovative strategies regarding agriculture production and
reducing the reliance on manual labor has boosted the demand of agriculture equipments
globally. The report constitutes of a thorough study of the market share and the market size of
the agriculture equipments including the analysis of tractors, combines harvesters, sprayers,
forage harvesters, and sugarcane harvesters. The agriculture equipments market by
geography has also been extensively analyzed in this report including the market trends across
the key geographic regions of the global market, along these lines- market size, drivers,
growth opportunities, and challenges. The industry analysis presents a detailed insight about
the participants in the agriculture equipment industry using the value chain analysis.
2.1.1 MARKET DEFINITION
The agriculture equipment market comprises of the various equipments which are used to
enhance agricultural productivity, production and cropping intensity. The market has been
analyzed for the key equipments, namely: tractors, self-propelled combine harvesters, self-
propelled sprayers, self-propelled forage harvesters, and self-propelled sugarcane harvesters.
BIS Research Sample Pages 21
Global Powered Agriculture Equipment Market
Country Analysis & Forecast from 2016 to 2022
2.1.2 REPORT COVERAGE
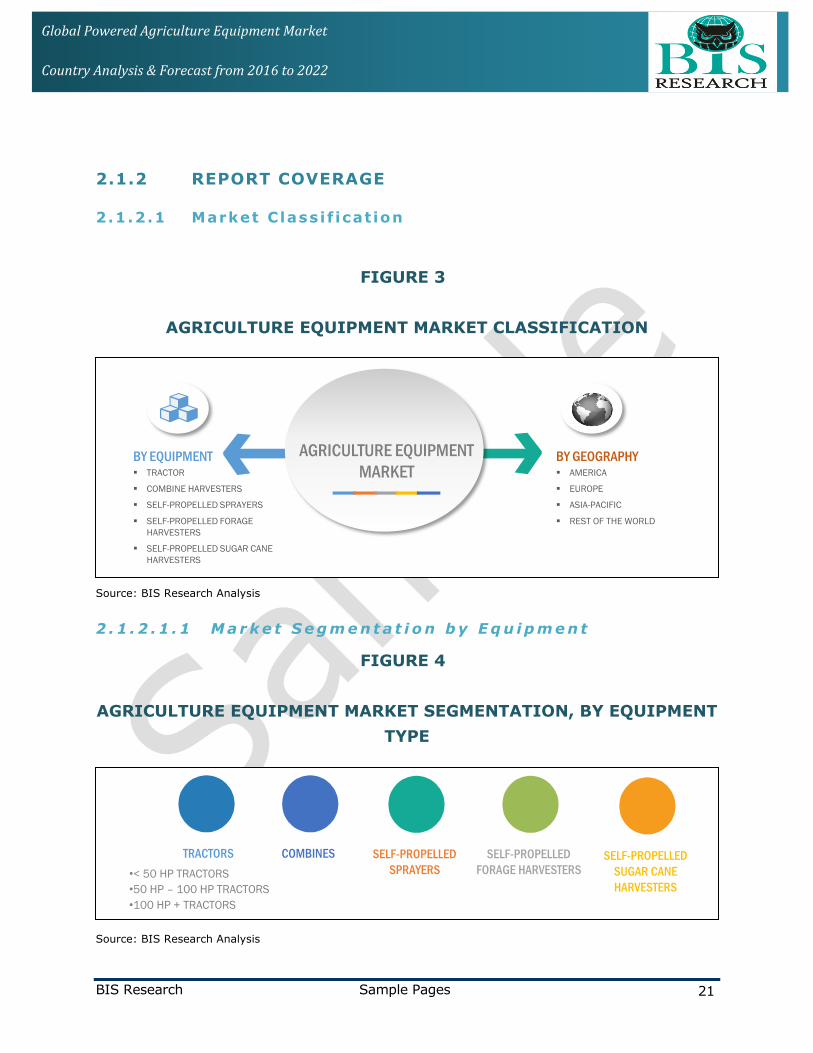
2.1.2.1 Market Classi f icat ion
FIGURE 3
AGRICULTURE EQUIPMENT MARKET CLASSIFICATION
BY EQUIPMENT BY GEOGRAPHY TRACTOR
COMBINE HARVESTERS
SELF-PROPELLED SPRAYERS
SELF-PROPELLED FORAGE
HARVESTERS
SELF-PROPELLED SUGAR CANE
HARVESTERS
AMERICA
EUROPE
ASIA-PACIFIC
REST OF THE WORLD
AGRICULTURE EQUIPMENT
MARKET
Source: BIS Research Analysis
2 . 1 . 2 . 1 . 1 M a r k e t S e g m e n t a t i o n b y E q u i p m e n t
FIGURE 4
AGRICULTURE EQUIPMENT MARKET SEGMENTATION, BY EQUIPMENT
TYPE
SELF-PROPELLED
SUGAR CANE
HARVESTERS
TRACTORS
•< 50 HP TRACTORS
•50 HP – 100 HP TRACTORS
•100 HP + TRACTORS
SELF-PROPELLED
SPRAYERS
SELF-PROPELLED
FORAGE HARVESTERS
COMBINES
Source: BIS Research Analysis

BIS Research Sample Pages 22
Global Powered Agriculture Equipment Market
Country Analysis & Forecast from 2016 to 2022
The equipments chapter is divided into five key products in the market, which are: tractors,
combines harvesters, sprayers, forage harvesters, and sugarcane harvesters. Each product is
presented with the key players, restraints, and opportunities in addition to the proper market
size and share.
2 . 1 . 2 . 1 . 2 M a r k e t S e g m e n t a t i o n b y G e o g r a p h y
FIGURE 5
AGRICULTURE EQUIPMENT MARKET SEGMENTATION,
BY GEOGRAPHY
U.S.
Canada
Brazil
U.K. Germany
Russia
India
France
Turkey
Middle East
& North
Africa
South
Africa
Italy
China
Japan
Korea
Australia
New Zealand
Source: BIS Research Analysis
The market for agriculture equipment by geography includes a detailed analysis of the market
size, growth opportunities, and trends across major geographies. The geographic analysis
includes quantification of major drivers in certain countries of the world, along with analysis of
equipments, key players and trends within these regions.

BIS Research Sample Pages 23
Global Powered Agriculture Equipment Market
Country Analysis & Forecast from 2016 to 2022
2.1.3 ASSUMPTIONS & LIMITATIONS
The market has been segmented on the basis of equipments and geography in the
agriculture equipment market
The market has been mapped on the lines of key equipments used in agriculture,
namely; tractors, self-propelled combine harvesters, self-propelled sprayers, self-
propelled forage harvesters, and self-propelled sugarcane harvesters
In Asia-Pacific region the tractors market for <XX HP or <XX HP tractors for Japan,
China, and Korea was not considered
The geographical areas have been segmented into The Americas, Europe, Asia-
Pacific, and Rest of the World (ROW). For better analysis, The Americas is further
divided into North America (including the U.S. and Canada) & South America
(including Brazil), Europe into Western Europe (Germany, UK, France, and Italy) and
Eastern & Central Europe (Russia and Turkey), Asia-Pacific (India, China, Japan,
Australia & New Zealand (ANZ), and Korea) and ROW (South Africa and Middle East
& North Africa)
Turkey is considered in the Eastern Europe region for the calculation purposes
The countries in the European Union were considered in the Western Europe region
for the market size calculation
At instances where market size for the self-propelled forage harvesters and sugar
cane harvesters was not available from the secondary or primary sources, there the
market size was estimated based on the value addition from the interviews
The base year considered for the calculation of market size was 2015. Instances
where the market size for the FY 2015 was not available from primary or secondary
sources, at such instances the values were estimated
The historical year analysis was done from the FY 2009 to FY 2014
The market size was estimated for the FY 2016 and projected from the year 2016 to
2022
The compound annual growth rate (CAGR) was calculated from 2016 to 2022

BIS Research Sample Pages 24
Global Powered Agriculture Equipment Market
Country Analysis & Forecast from 2016 to 2022
2.1.4 STAKEHOLDERS
FIGURE 6
AGRICULTURE EQUIPMENT MARKET – STAKEHOLDERS
EQUIPMENT MANUFACTURERS
EQUIPMENT SUPPLIERS
OEMSAGRICULTURE CONSULTANTS
GOVERNMENT ASSOCIATIONS
Source: BIS Research Analysis
2.2 RESEARCH PARAMETERS
The research parameters constitutes of the factors that are highly impacting the concerned
market. The figure below gives the list of factors that were analyzed to estimate and forecast
the agriculture equipments market.

BIS Research Sample Pages 25
Global Powered Agriculture Equipment Market
Country Analysis & Forecast from 2016 to 2022
FIGURE 7
RESEARCH PARAMETERS
MARKET DRIVERS
BURNING ISSUES
MARKET RESTRAINTS MARKET OPPORTUNITIES
• AGREEMENTS, COLLABORATIONS, & PARTNERSHIPS: More than 30 deals in the last three years
• NEW PRODUCT LAUNCHES: More than 40 new product launches in the
last three years
INDUSTRY TRENDS
CURRENT MARKET
INFORMATION
AND DATA
SUPPLY AND DEMAND
SIDE FACTORS
PORTER’S ANALYSIS &
GEOGRAPHIC USAGE PATTERN
INFLUENCING
FACTORS (Market Trends and
Dynamics)
MARKET SIZE & SHARE
ANALYSIS
MARKET SIZE & FORECAST:
• By Equipment
• By Region
Arrive at the Market Size, Share,
and CAGR for
the Agriculture Equipments
Market
MARKET SIZE
INDUSTRY TRENDSEVOLUTIONPRODUCT/EQUIPMENT
ANALYSIS
MARKET SHARE
COMPANY DEVELOPMENTSSUPPLY &
VALUE CHAIN
PRICING ANALYSIS
COMPETITIVE LANDSCAPE
HIGH GROWTH
SEGMENTS
FORECAST
Source: Secondary Research, Primary Interviews, and BIS Research Analysis

BIS Research Sample Pages 26
Global Powered Agriculture Equipment Market
Country Analysis & Forecast from 2016 to 2022
2.3 RESEARCH DESIGN
The research methodology design adopted for this specific study includes a mix of data
collected from secondary and primary sources. We exhaustively use both primary sources (in-
house experts, industry leaders, market players, and independent consultants) and secondary
sources (a host of paid and unpaid databases) along with analytical tools to build our forecast
and predictive models.
FIGURE 8
REPORT DESIGN
Bottom-
Up
Top-
down
Scope Definition Research Design Sample Selection
REPORT
WRITINGData Validation Data Analysis Data Collection
Primary
Interviews
Observation
/Feature
Mapping
Primary
Data
Secondary
DataPrimary Interviews/
Secondary Research
Source: BIS Research Analysis
This research study involves the usage of extensive secondary sources, directories, company
websites, and annual reports. It also makes use of databases such as Hoovers, Bloomberg,
Business-week, Factiva, and One-Source to collect useful and effective information for an
extensive, technical, market-oriented, and commercial study of the global market. The
following illustrative figure shows the market research methodology applied in preparing this
report on the agriculture equipment market.
The process of market engineering involved calculation of the market statistics, market size
estimations, market forecast, market crackdown, and data triangulation (the methodology for

BIS Research Sample Pages 27
Global Powered Agriculture Equipment Market
Country Analysis & Forecast from 2016 to 2022
these quantitative data processes is explained in the sections below). An extensive primary
research study was undertaken to gather information, and authenticate the critical numbers
arrived at segmentation types, industry trends, and key players of each type of equipment in
the market.
For this purpose, bottom-up approach was used extensively along with several data
triangulation methods to perform market estimation and market forecast for the overall
segment markets listed in this report. From all the numbers arrived at in the complete market
engineering process, extensive qualitative and quantitative analysis was also undertaken, in
order to list key information throughout the report.
2.3.1 SECONDARY RESEARCH
Several hundreds of secondary sources such as certified publications, articles from recognized
authors, white papers, annual reports of companies, investor relations presentations,
directories, and databases among others were used in the broad secondary research process
for this research study, to identify and collect qualitative and quantitative information of the
market.
Secondary research was conducted in order to obtain crucial information about the industry’s
value chain, market’s monetary chain, total pool of key players, and application areas. It also
assisted in market segmentation according to industry trends to the bottom-most level,
geographical markets and key developments from both market and technology oriented
perspectives. The key data points taken from secondary sources include:
Segmentation breakups, split-ups, and percentage shares
Data for market volume
Key industry trends of the top players of the market
Qualitative insights into various aspects of the market, key trends, emerging areas
Quantitative data for mathematical and statistical calculations
BIS Research Sample Pages 28
Global Powered Agriculture Equipment Market
Country Analysis & Forecast from 2016 to 2022
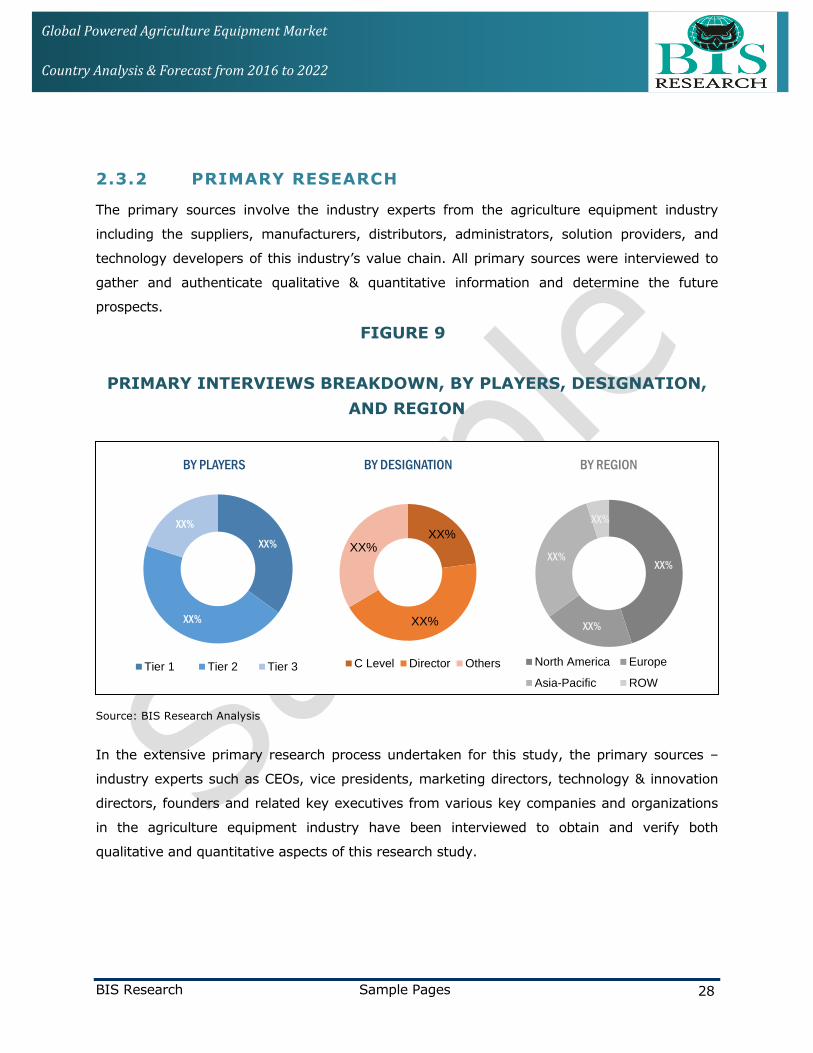
2.3.2 PRIMARY RESEARCH
The primary sources involve the industry experts from the agriculture equipment industry
including the suppliers, manufacturers, distributors, administrators, solution providers, and
technology developers of this industry’s value chain. All primary sources were interviewed to
gather and authenticate qualitative & quantitative information and determine the future
prospects.
FIGURE 9
PRIMARY INTERVIEWS BREAKDOWN, BY PLAYERS, DESIGNATION,
AND REGION
XX%
XX%
XX%
BY PLAYERS
Tier 1 Tier 2 Tier 3
XX%
XX%
XX%
XX%
BY REGION
North America Europe
Asia-Pacific ROW
XX%
XX%
XX%
BY DESIGNATION
C Level Director Others
Source: BIS Research Analysis
In the extensive primary research process undertaken for this study, the primary sources –
industry experts such as CEOs, vice presidents, marketing directors, technology & innovation
directors, founders and related key executives from various key companies and organizations
in the agriculture equipment industry have been interviewed to obtain and verify both
qualitative and quantitative aspects of this research study.

BIS Research Sample Pages 29
Global Powered Agriculture Equipment Market
Country Analysis & Forecast from 2016 to 2022
Data Points taken from Primary Sources includes:
Validation and triangulation of all the numbers and graphs
Current and proposed production volumes of a particular equipments by market
players
Pricing estimation and validation of the pricing and forecast model
Validation of the numbers of the various markets for equipment and geography
Market shares of key industry players in the agriculture equipment ecosystem
Percentage split of individual markets for geographical analysis. Forecast for various
segments of overall markets and validation of the forecast data
Industry preferences, and market dynamics
2.3.3 DATA ANALYZING & MARKET ESTIMATION
2.3.3.1 Bottom-Up Approach
Total Market Size in Terms of VolumeGlobal
Market
Size
Summation of
equipments volume
globally
Summation of equipments
volume in a region
Summation of all types of equipments
(for e.g. summation of all types of
tractors)in a country
Volume of each Agriculture Equipments (for
e.g. tractors) shipped in particular country
PRIMARY SOURCES:
Demand and Supply Side Experts
SECONDARY SOURCES:
Annual Reports, Presentations,
Press Release, Journals, Paid Databases,
Company Websites, News Articles
and BIS Repository
Source: BIS Research Analysis

BIS Research Sample Pages 30
Global Powered Agriculture Equipment Market
Country Analysis & Forecast from 2016 to 2022
3 MARKET DYNAMICS
3.1 INTRODUCTION
The market dynamics section of the report examines the diverse factors which governs the
process of manufacturing, distribution and usage of agricultural equipments globally. This
analysis will provide an in-depth understanding of the direction in which the market is headed
and the impacts of various factors on the same. . This section covers the major market
dynamics, namely: the drivers, restraints, challenges, and the opportunities in the agricultural
equipment market, listing and analyzing several factors that positively and negatively affect
the agricultural equipment industry.
FIGURE 10
DRO OF AGRICULTURAL EQUIPMENT MARKET AND THE INTENSITY
OF IMPACT
DR
IVE
RS
• Decreasing arable land area
• Rising global population
• Easy Credit and Subsidies Availability in Asian Markets
• Rising demand for advanced agricultural machinery
RE
STR
AIN
TSO
PP
OR
TUN
ITIE
S
• Fluctuating Weather Conditions & farming calendars
• Dynamic economic environment
• Altering government policies
• High cost of machinery
• Improved credit facilities
• Government subsidies
D
R
O
XXXX
XXXX
XXXX
XXXX
IMPACT
XXXX
XXXX
XXXX
XXXX
IMPACT
XXXX
XXXXIMPACT
Source: Secondary Sources, Primary Interviews, BIS Research Analysis

BIS Research Sample Pages 31
Global Powered Agriculture Equipment Market
Country Analysis & Forecast from 2016 to 2022
4 AGRICULTURE EQUIPMENT MARKET,
BY EQUIPMENTS
4.1 INTRODUCTION
The necessity of achieving food sufficiency for the ever-growing global population led to the
increased focus of government authorities on the adoption and utilization of agriculture
machinery worldwide. There has also been active support from the government in the form of
subsidies and credit facilities in this market to ensure its utilization by the small farmers as
well. The market gets further boost by the increasing migration of labor workforce to urban
areas, increasing farm incomes, and other factors. This chapter describes in detail the key
agricultural equipments and their market size in terms of volume such as tractors, combine
harvesters, sprayers, forage harvesters, and sugarcane harvesters along with the status of
their utilization in key markets.
FIGURE 11
TRACTORS VOLUME TO CROSS 2.3 MILLION UNITS BY 2022
Tractors
Combines
Sprayers
Forage
Harvesters
Sugar cane
Harvesters
Volume, 2022 (Units) CAGR % (2016-2022)
XX
XX
XX
XX
XX
XX
XX
XX
XX
XX
Volume, 2015 (Units)
XX
XX
XX
XX
XX
Source: Secondary Research, Expert Interviews, and BIS Research Analysis

BIS Research Sample Pages 32
Global Powered Agriculture Equipment Market
Country Analysis & Forecast from 2016 to 2022
4.2 TRACTOR
The tractors are the integral part of the agriculture industry with highest volume market as
compared to any other equipment. The historical trend in the tractors market has many ups
and downs, with a huge increase of XX% in 2013 and consistent decrease in 2014 and 2015 of
XX% and XX% respectively. In 2016, the market is expected to show steady growth rate with
a tendency of decline in some countries.
FIGURE 12
INDIA & CHINA – LEADING TRACTORS MARKETS
XX
XX XX XX
XX
2012 2013 2014 2015 2022
U.S.
2015 = XX units
2022 = XX units
India
2015 = XX units
2022 = XX units
China
2015 = XX units
2022 = XX units
Brazil
2015 = XX units
2022 = XX units
Turkey
2015 = XX units
2022 = XX units
Russia
2015 = XX units
2022 = XX units
Germany
2015 = XX units
2022 = XX units
France
2015 = XX units
2022 = XX units
Canada
2015 = XX units
2022 = XX units
Tractors Market
By 2022, the tractors volume is expected
to cross XX million units with expected
CAGR of XX%, between 2016 and 2022
India and China are the biggest market
with ~XX% market share in terms of
tractors volume in 2015
The U.S., Turkey, Brazil, Russia, Germany,
France, and Canada are the other bigger
tractors market
Source: Secondary Sources, Expert Interviews, and BIS Research Analysis
BIS Research Sample Pages 33
Global Powered Agriculture Equipment Market
Country Analysis & Forecast from 2016 to 2022
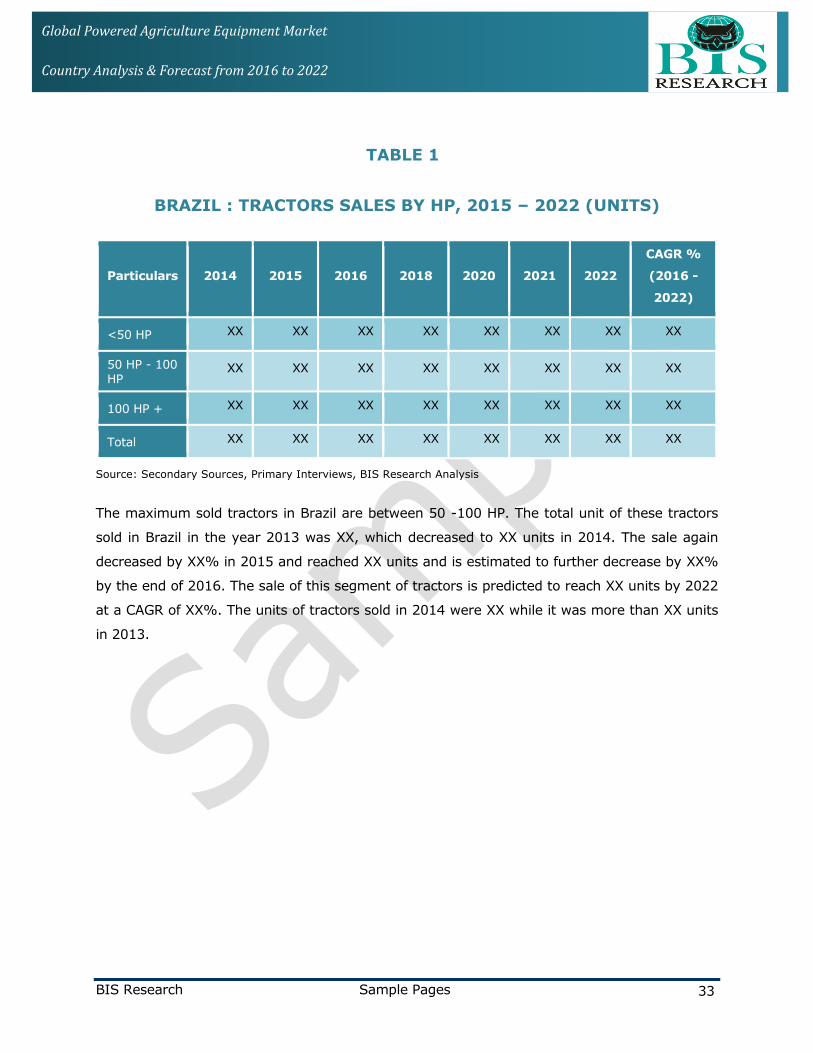
TABLE 1
BRAZIL : TRACTORS SALES BY HP, 2015 – 2022 (UNITS)
Particulars 2014 2015 2016 2018 2020 2021 2022
CAGR %
(2016 -
2022)
<50 HP XX XX XX XX XX XX XX XX
50 HP - 100 HP
XX XX XX XX XX XX XX XX
100 HP + XX XX XX XX XX XX XX XX
Total XX XX XX XX XX XX XX XX
Source: Secondary Sources, Primary Interviews, BIS Research Analysis
The maximum sold tractors in Brazil are between 50 -100 HP. The total unit of these tractors
sold in Brazil in the year 2013 was XX, which decreased to XX units in 2014. The sale again
decreased by XX% in 2015 and reached XX units and is estimated to further decrease by XX%
by the end of 2016. The sale of this segment of tractors is predicted to reach XX units by 2022
at a CAGR of XX%. The units of tractors sold in 2014 were XX while it was more than XX units
in 2013.

BIS Research Sample Pages 34
Global Powered Agriculture Equipment Market
Country Analysis & Forecast from 2016 to 2022
4.2.1.1 Asia-Paci f ic
The major countries included in the Asia-Pacific (APAC) region are India, China, Japan, Korea,
Australia, and New Zealand among others.
TABLE 2
INDIA: TRACTORS SALES BY HP, 2015 – 2022 (UNITS)
Particulars 2014 2015 2016 2018 2020 2021 2022
CAGR %
(2016 -
2022)
<50 HP XX XX XX XX XX XX XX XX
50 HP - 100 HP
XX XX XX XX XX XX XX XX
100 HP + XX XX XX XX XX XX XX XX
Total XX XX XX XX XX XX XX XX
Source: Secondary Sources, Primary Interviews, BIS Research Analysis
The maximum sold tractors in India are between 50 HP to 100 HP. The total unit of these
tractors sold in India in the year 2013 was XX which decreased to XX units in 2014. The sale
further decreased by XX% in 2015 and reached XX units and is now estimated to increase by
XX% by the end of 2016. The sale of this segment of tractors is predicted to increase and
reach XX units by 2022 at a CAGR of XX%.
The growth in the Indian tractor market has been on the path of continuity, although not
uniformly due to slowdown in agriculture sector. The Indian tractor industry accounts for one
third of the total production of tractors globally and provides livelihood to about XX% of India’s
population. Moreover, India is amongst the XX leading exporters of agricultural products in the
world. The export of agriculture products which were $XX billion in 2010 reached $XX billion by
2014 and is further expected to reach $XX billion by the end of 2015. India has been exporting
tractors to countries such as Sri Lanka, Nepal, and the U.S.

BIS Research Sample Pages 35
Global Powered Agriculture Equipment Market
Country Analysis & Forecast from 2016 to 2022
The tractors in India are available in different horsepower ranging from less than XX to more
than XX HP. The highest demand in Indian agriculture is for the tractors with XX HP to XX HP.
The reason behind growth of the tractors below XX HP is the low initial cost involved and better
fuel efficiency when compared to their high priced and high powered alternatives, making it
feasible for the small farmers to adopt tractors than using bullock carts. On the other hand,
factors which are hindering the growth of this below XX HP segment particularly are: the
restricted applicability of such tractors on soft soil only, existence of second hand market of
high HP tractors, and limited creditworthiness of farmers among others.
The total tractors above XX HP sold in the year 2015 in India are XX units. These are used in
areas with ample amount of alluvial soil which does not require deep plowing such as Punjab,
Haryana and Uttar Pradesh among others. It has been predicted that the sale of these tractors
with high HP will rise due to the government support for contract farming through leasing of
farm lands.
FIGURE 13
SEGMENTATION OF TRACTORS IN INDIA BY HORSEPOWER &
MARKET SHARE
Tractors Segment By Horsepower
Below 30 HP XX% 31-40 HP XX% 41-50 HP XX% Above 50 HP XX%
Mahindra Swaraj
Mahindra
Eicher
Eicher
Mahindra
New Holland
John Deere
Massey Ferguson
New Holland
Mahindra
Sonalika
New Holland
Source: BIS Research Analysis
The figure above provides a synopsis of the demand of tractors with different horsepower in
India and the companies leading in those segments, with Mahindra leading the India tractor
market.

BIS Research Sample Pages 36
Global Powered Agriculture Equipment Market
Country Analysis & Forecast from 2016 to 2022
India currently has a total of XX domestic and XX multinational companies manufacturing
tractors. Few of the companies with their tractor sales during 2014-15, are listed below:
TABLE 3
KEY COMPANIES OPERATING IN INDIA
Company Tractor Sales in
Units (2014-15) Description
Mahindra &
Mahindra XX
Founded in 1983, operates in 40 countries in 6
continents, provides with tractors ranging from15 HP to
85 HP under the brand name- Arjun, Bhoomiputra,
Sarpanch, Shaan, Yuvraj and Swaraj
Escorts XX
Launched in 1960, provides with tractors under the brand
name- Farmtrac, Powertrac and Steeltrac, has four
manufacturing plants in Faridabad and one subsidiary
unit in Poland in the name of Farmtrac Europe
Tractors &
Farm
Equipments
XX
Founded in 1960, holds approx. than XX% of Indian
tractor industry, works in partnership with AGCO
Corporation and the Massey Ferguson brand
ITL (Sonalika) XX
Its agro segment was established in 1969, provides a
complete product line including tractors, engines, farm
machinery attachments, and diesel gensets among others
John Deere XX
Founded in 1837, manufactures agricultural,
construction, and forestry machinery, diesel engines,
drive trains used in heavy equipment and lawn care
equipment
New Holland XX
Founded in 1895, offers a large range of agricultural
tractors and farm machinery in India including harvesting
equipments, hay & forage equipments, seeding
equipments and sprayers among others
Source: Secondary Sources, Primary Interviews, BIS Research Analysis

BIS Research Sample Pages 37
Global Powered Agriculture Equipment Market
Country Analysis & Forecast from 2016 to 2022
TABLE 4
KEY COMPANIES OPERATING IN CHINA BY MARKET SHARE
Company Market Share Description
YTO XX%
Founded in 1955, manufactures a range of products
including agricultural tractors, engines, combine
harvesters and trucks
Foton XX%
Founded in 1998, specializes in agricultural equipment
construction machinery, vehicles, core components,
financial services and other businesses
John Deere XX% Founded in 1837, manufactures agricultural, construction,
and forestry machinery, diesel engines, drivetrains
Mahindra Yueda XX%
Formed in 2009 with a joint venture between Mahindra’s
Farm Equipment Company in India and Jiangsu Yueda
Yancheng Tractor Manufacturing Co. Ltd., a Chinese
tractor manufacturer
Shanghai New
Holland XX%
Formed in 2001, with a joint venture between CNH Global
and SAIC, manufactures, distributes and ultimately
exports agricultural tractors under 100 horsepower
Jiangsu Qingtuo
Ag Equipment XX%
manufacturer of big and middle size tractors for near 40
years
Shandong
Shifeng XX%
Founded in 1993, works on five subsidiary lines-
Agricultural Vehicle, Agricultural Equipment, LCV &
Electric Car, Nylon Chemical Fiber & Tire, and the Coal-
fired Power Plant
Others XX%
Changzhou Dongfeng Agricultural Machinery Co., Anhui
Changjiang Agricultural Machienry, Chnagfa Group, and
Guangxi Quinzhou Lishun Machinery among others
Source: Secondary Sources, Primary Interviews, BIS Research Analysis

BIS Research Sample Pages 38
Global Powered Agriculture Equipment Market
Country Analysis & Forecast from 2016 to 2022
4.3 COMBINE/COMBINE HARVESTER
Combines are amongst the most expensive agricultural equipments in the market. Since
combines are used for short period of time, thus, users prefer renting than buying. Earlier,
combines were drawn by horse or mule and used as a bull wheel to provide power but the
modern combines are self-propelled and use diesel or gas engines for power. The combines
consist of a combine head which are equipped with different heads designed for particular
crops. Moreover, the maximum utilized type of combine harvester is a self-propelled combine.
FIGURE 14
INDIA & BRAZIL – LEADING IN COMBINES MARKET
XX
XX
XX
XX
XX
XX
XX
XX
XX
XX
XX
XX
XX
XX
XX
XX
XX
XX
XX
XX
XX
XX
XX
XX
XX
XX
XX
XX
XX
XX
India
Brazil
U.S.
Middle East & NorthAfrica
Eastern/CentralEurope
China
Germany
France
Canada
Italy
ANZ
U.K.
Japan
Korea
South Africa 2015 2022
XX
XX
XX
XX
XX
XX
XX
XX
XX
XX
XX
XX
XX
XX
XX
Combines Market Size, Volume, By Country, (Units)Combines CAGR % (2016 – 2022), By Country
Source: Secondary Research, Expert Interviews, and BIS Research Analysis

BIS Research Sample Pages 39
Global Powered Agriculture Equipment Market
Country Analysis & Forecast from 2016 to 2022
TABLE 5
GLOBAL COMBINES MARKET SIZE, BY COUNTRY,
2014 – 2022 (UNITS)
Particulars 2014 2015 2016 2018 2020 2021 2022
CAGR %
(2016 -
2022)
U.S. XX XX XX XX XX XX XX XX
Canada XX XX XX XX XX XX XX XX
Brazil XX XX XX XX XX XX XX XX
Rest of South
America XX XX XX XX XX XX XX XX
Germany XX XX XX XX XX XX XX XX
U.K. XX XX XX XX XX XX XX XX
France XX XX XX XX XX XX XX XX
Italy XX XX XX XX XX XX XX XX
Rest of Western Europe
XX XX XX XX XX XX XX XX
Eastern/Central
Europe XX XX XX XX XX XX XX XX
China XX XX XX XX XX XX XX XX
India XX XX XX XX XX XX XX XX
Japan XX XX XX XX XX XX XX XX
Korea XX XX XX XX XX XX XX XX
ANZ XX XX XX XX XX XX XX XX
Rest of APAC XX XX XX XX XX XX XX XX
Middle East &
North Africa XX XX XX XX XX XX XX XX

BIS Research Sample Pages 40
Global Powered Agriculture Equipment Market
Country Analysis & Forecast from 2016 to 2022
Particulars 2014 2015 2016 2018 2020 2021 2022
CAGR %
(2016 -
2022)
South Africa XX XX XX XX XX XX XX XX
Total XX XX XX XX XX XX XX XX
Source: Secondary Research, Expert Interviews, and BIS Research Analysis
4.4 SELF-PROPELLED SPRAYER
FIGURE 15
THE U.S. – THE LARGEST MARKET FOR SPRAYERS, 2015
XX
XX
XX
XX
XX
XX
XX
XX
XX
XX
XX
XX
XX
XX
XX
XX
XX
XX
XX
XX
XX
XX
XX
XX
XX
XX
XX
XX
XX
XX
XX
XX
XX
XX
XX
XX
XX
XX
XX
XX
Sp
rayers
CA
GR
% (
2016 –
2022)
Sp
rayers
(U
nit
s)
2015 2022 CAGR % (2016 - 2022)
Source: Secondary Research, Expert Interviews, and BIS Research Analysis

BIS Research Sample Pages 41
Global Powered Agriculture Equipment Market
Country Analysis & Forecast from 2016 to 2022
4.5 SUGAR CANE HARVESTER
Sugarcane harvester is used in agriculture to harvest the sugarcanes and partially process it in
a faster and more efficient manner. . The equipment is light weight, which results in more
flexibility. Along with this, the damage rate of the equipment is low and consumes less oil. The
sugarcane harvester is suitable for plain grounds mainly and for large number of sugarcane
only. The users have to be cautious about the processing of sugarcane. The sugarcane
harvested in segments should be processed as soon as possible because the sugarcane starts
losing sugar content once its cut. This market possesses a permanent threat from the low or
no-calorie sweeteners used as a substitute. Imports hold insignificant market shares in this
market because the crop requires immediate processing after harvesting in order to prevent
damage.
FIGURE 16
BRAZIL – LEADING COUNTRY SUGARCANE HARVESTER MARKET
XX
XX XX XX XX XX XX XX XX XX
XX
XX
XX
XX
XX
XX
XX
XX
XX
XX
XX
XX
XX
XX
XX
XX
XX
XX
XX
XX
XX
XX
XX
XX
XX
XX
XX
XX
XX
2015 2022 CAGR % (2016 - 2022)
Source: Secondary Research, Expert Interviews, and BIS Research

BIS Research Sample Pages 42
Global Powered Agriculture Equipment Market
Country Analysis & Forecast from 2016 to 2022
5 GEOGRAPHICAL ANALYSIS
5.1 INTRODUCTION
The “Geographical Analysis” segment of the report covers the major region-wise trends in the
agriculture equipment market. The market statistics for each of the major geographies are also
given in this chapter. The market has been segmented into four different regions, namely: The
Americas, Europe, Asia Pacific (APAC), and Rest of the World (ROW). North America is further
divided into South America & North America and Europe is divided into Western and Eastern/
Central Europe, which are further explained country wise. APAC region includes China, India,
Australia New Zealand (ANZ), South Korea, and others. ROW includes the Middle East and
South Africa.
FIGURE 17
GEOGRAPHIC LANDSCAPE
Americas Europe Asia-Pacific
Tractor
Combine Harvester
Sprayers
Forage Harvesters
Sugar Cane
Harvesters
XX XX XX XX
2014 2015 2016 2022
XX XX XX XX
2014 2015 2016 2022
XX XX XXXX
2014 2015 2016 2022
XX XX XX XX
2014 2015 2016 2022
XXXX XX
XX
2014 2015 2016 2022
XXXX XX
XX
2014 2015 2016 2022
XX XX XXXX
2014 2015 2016 2022
XX XX XX XX
2014 2015 2016 2022
XX
XX XX
XX
2014 2015 2016 2022
XX XX XX XX
2014 2015 2016 2022
XX XXXX
XX
2014 2015 2016 2022
XX XX XX
XX
2014 2015 2016 2022
XX XX XX
XX
2014 2015 2016 2022
XXXX XX
XX
2014 2015 2016 2022
XX XX XX
XX
2014 2015 2016 2022
Source: Expert Interviews and BIS Research Analysis

BIS Research Sample Pages 43
Global Powered Agriculture Equipment Market
Country Analysis & Forecast from 2016 to 2022
5.2 THE AMERICAS
For better mapping of the market size of agriculture equipment market in America, the market
has been segmented into North America and South America. Further, the key regions of all
segmentation has been analysed both qualitatively and quantitatively. The focus has been
placed on the factors driving and restraining the market growth.
FIGURE 18
SNAPSHOT OF AGRICULTURE EQUIPMENT MARKET IN
THE AMERICAS
NORTH AMERICA
Market Volume (2016): XX Units
CAGR (2016-2022): XX%
SOUTH AMERICA
Market Volume (2016): XX Units
CAGR (2016-2022): XX%
CAGR (2016-2022) : XX%
CAGR (2016-2022) : XX %
CAGR (2016-2022) : XX%
Note: The CAGR mentioned in the figure is in terms of volume
Source: Secondary Sources, Primary Interviews, BIS Research Analysis

BIS Research Sample Pages 44
Global Powered Agriculture Equipment Market
Country Analysis & Forecast from 2016 to 2022
5.2.1 MARKET STATISTICS
TABLE 6
THE AMERICAS AGRICULTURE EQUIPMENT MARKET VOLUME,
BY TYPE (UNITS), 2015-2022
Particulars 2015 2016 2017 2018 2019 2020 2021 2022
CAGR
%
(2016-
2022)
Tractor XX XX XX XX XX XX XX XX XX
Combine Harvester
XX XX XX XX XX XX XX XX XX
Sprayers XX XX XX XX XX XX XX XX XX
Forage Harvesters
XX XX XX XX XX XX XX XX XX
Sugar Cane Harvesters
XX XX XX XX XX XX XX XX XX
Total XX XX XX XX XX XX XX XX XX
Source: Expert Interviews and BIS Research Analysis
The total tractors sold in the American agriculture equipment market in 2014 were XX which
decreased to XX units in 2015. This sales volume is estimated to decrease further by XX% by
the end of 2016. The sale of tractors is predicted to increase and reach XX units by 2022 at a
CAGR of XX%. This region includes countries which are rich in agriculture related activities and
thus forms a significant market for agriculture equipments.
The sale of combine harvesters was XX units in 2014 which decreased to XX units in 2015. This
sales volume is estimated to decrease by XX% by the end of 2016. The sale of combine
harvesters is predicted to increase and reach XX units by 2022 at a CAGR of XX.

BIS Research Sample Pages 45
Global Powered Agriculture Equipment Market
Country Analysis & Forecast from 2016 to 2022
5.3 EUROPE
The agriculture sector in Europe is facing challenges due to the climate change and,
environmental reforms. Further, lack of sufficient water supplies, increasing droughts and
uncertainties implies that Europe's agriculture sector needs to focus on the ways to increase
productivity. The Europe market accounts for around XX% share in the global agriculture
equipment market in the year 2015. Germany is the largest contributor in the market with
XX% share, followed by France (XX%) and Italy (XX%).
FIGURE 19
SNAPSHOT OF AGRICULTURE EQUIPMENT MARKET IN EUROPE
EUROPE: Agriculture Equipment Market Volume, 2015 – 2022
(UNITS)
XX XX
XX
2015 2016 2022
~XX%Of Agriculture Equipment
Market is shared by Western
Europe
~XX%Of Agriculture Equipment
Market is shared by Eastern
and Central Europe
Eastern and
Central Europe
Western Europe
Europe: CAGR of Agriculture Equipment Market Volume, 2016–
2022 (%)
XX
XX
XX
XX
XX
Tractor
Combine Harvester
Sprayers
Forage Harvesters
Sugar CaneHarvesters
Source: Secondary Sources, Primary Interviews, BIS Research Analysis

BIS Research Sample Pages 46
Global Powered Agriculture Equipment Market
Country Analysis & Forecast from 2016 to 2022
FIGURE 20
SNAPSHOT OF WESTERN EUROPE AGRICULTURE EQUIPMENT
MARKET, BY COUNTRY
The agriculture equipment
market of Germany in terms
of volume is growing at
~XX%CAGR from 2016 to 2022
XX%
XX%
XX%
XX%
XX%
Germany
France
U.K.
Italy
The agriculture equipment
market of the U.K. in terms
of volume is growing at
~XX%CAGR from 2016 to 2022
The agriculture equipment
market of France in terms of
volume is growing at
~XX%CAGR from 2016 to 2022
The agriculture equipment
market of France in terms of
volume is growing at
~XX%CAGR from 2016 to 2022
Source: Secondary Sources, Primary Interviews, BIS Research Analysis
5.3.1.1 GERMANY
Germany is one of the leading exporting countries of agriculture machinery in the world and is
ranked first when it comes to agriculture equipment market in Western Europe. The key factor
pushing this market towards growth is the wide coverage of value chain in Germany, which
leads to innovations and developments in product portfolio.

BIS Research Sample Pages 47
Global Powered Agriculture Equipment Market
Country Analysis & Forecast from 2016 to 2022
TABLE 7
CHINA AGRICULTURE EQUIPMENT MARKET VOLUME, BY TYPE
(UNITS), 2015-2022
Particulars 2015 2016 2017 2018 2019 2020 2021 2022
CAGR%
(2016-
2022)
Tractor XX XX XX XX XX XX XX XX XX
Combine Harvester
XX XX XX XX XX XX XX XX XX
Sprayers XX XX XX XX XX XX XX XX XX
Forage Harvesters
XX XX XX XX XX XX XX XX XX
Sugar Cane Harvesters
XX XX XX XX XX XX XX XX XX
Total XX XX XX XX XX XX XX XX XX
Source: Expert Interviews and BIS Research Analysis
The total tractors sold in the agriculture equipment market in China in 2014 were XX units,
which decreased to XX units in 2015. This sales volume is estimated to increase further by
XX% by the end of 2016. The sale of tractors is predicted to increase and reach XX units by
2022 at a CAGR of XX%. The sale of combine harvesters was XX units in 2014 which
decreased to XX units in 2015. This sales volume is estimated to increase by XX% by the end
of 2016. The sale of combine harvesters is predicted to increase and reach XX units by 2022 at
a CAGR of XX%.

BIS Research Sample Pages 48
Global Powered Agriculture Equipment Market
Country Analysis & Forecast from 2016 to 2022
TABLE 8
AUSTRALIA & NEWZEALAND AGRICULTURE EQUIPMENT MARKET
VOLUME, BY TYPE (UNITS), 2015-2022
Particulars 2015 2016 2017 2018 2019 2020 2021 2022
CAGR%
(2016-
2022)
Tractor XX XX XX XX XX XX XX XX XX
Combine Harvester
XX XX XX XX XX XX XX XX XX
Sprayers XX XX XX XX XX XX XX XX XX
Forage Harvesters
XX XX XX XX XX XX XX XX XX
Sugar Cane Harvesters
XX XX XX XX XX XX XX XX XX
Total XX XX XX XX XX XX XX XX XX
Source: Expert Interviews and BIS Research Analysis
The total tractors sold in the agriculture equipment market in Australia-New Zealand in 2014
were XX units, which decreased to XX units in 2015. This sales volume is estimated to increase
further by XX% by the end of 2016. The sale of tractors is predicted to increase and reach XX
units by 2022 at a CAGR of XX%. The sale of combine harvesters was XX units in 2014 which
decreased to XX units in 2015. This sales volume is estimated to increase by XX% by the end
of 2016. The sale of combine harvesters is predicted to increase and reach XX units by 2022 at
a CAGR of XX%.
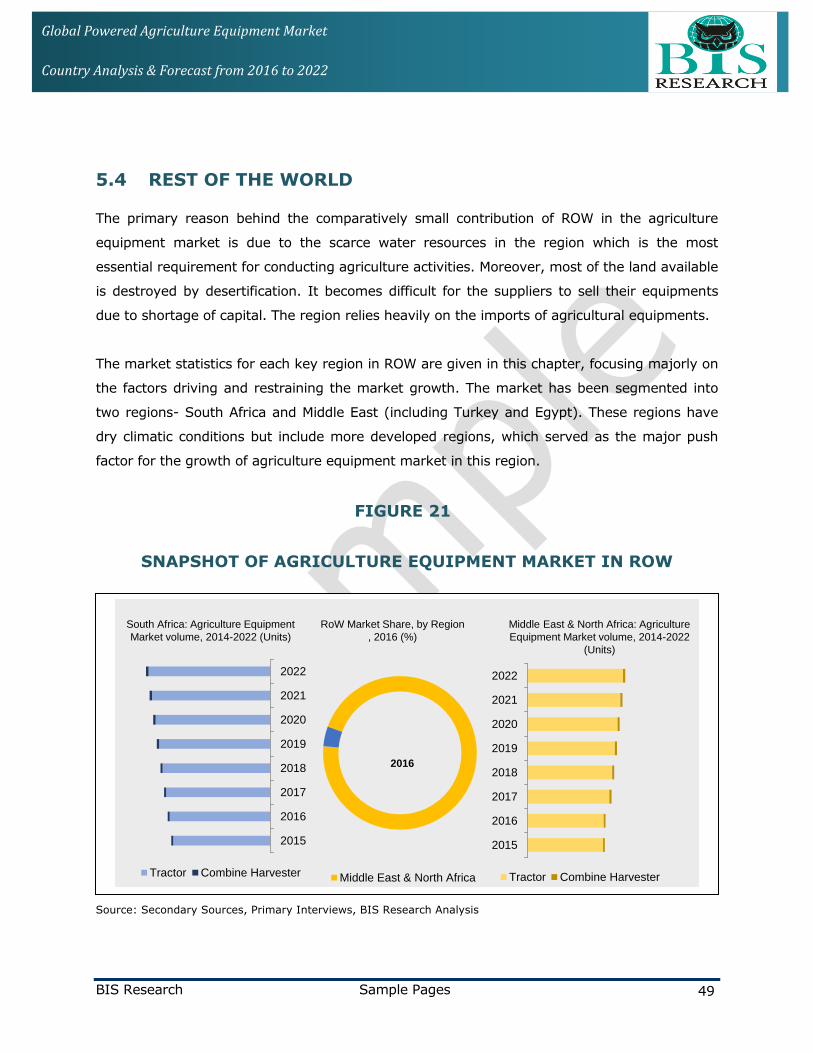
BIS Research Sample Pages 49
Global Powered Agriculture Equipment Market
Country Analysis & Forecast from 2016 to 2022
5.4 REST OF THE WORLD
The primary reason behind the comparatively small contribution of ROW in the agriculture
equipment market is due to the scarce water resources in the region which is the most
essential requirement for conducting agriculture activities. Moreover, most of the land available
is destroyed by desertification. It becomes difficult for the suppliers to sell their equipments
due to shortage of capital. The region relies heavily on the imports of agricultural equipments.
The market statistics for each key region in ROW are given in this chapter, focusing majorly on
the factors driving and restraining the market growth. The market has been segmented into
two regions- South Africa and Middle East (including Turkey and Egypt). These regions have
dry climatic conditions but include more developed regions, which served as the major push
factor for the growth of agriculture equipment market in this region.
FIGURE 21
SNAPSHOT OF AGRICULTURE EQUIPMENT MARKET IN ROW
Middle East & North Africa
2016
2015
2016
2017
2018
2019
2020
2021
2022
Tractor Combine Harvester
South Africa: Agriculture Equipment
Market volume, 2014-2022 (Units)
2015
2016
2017
2018
2019
2020
2021
2022
Tractor Combine Harvester
Middle East & North Africa: Agriculture
Equipment Market volume, 2014-2022
(Units)
RoW Market Share, by Region
, 2016 (%)
Source: Secondary Sources, Primary Interviews, BIS Research Analysis

BIS Research Sample Pages 50
Global Powered Agriculture Equipment Market
Country Analysis & Forecast from 2016 to 2022
6 COMPANY PROFILES
6.1 AGCO CORPORATION
6.1.1 COMPANY OVERVIEW
Particular Specific (as of 2015)
Website www.agcocorp.com
Contact Details
4205 River Green Parkway Duluth,
Georgia 30096 U.S.
Tel: +1.770.813.9200
Year of Establishment 1990
Ownership Type Public
Company Type Manufacturer, Distributor
Number of Employees 22,111
Net Revenue $XX million (as per 2014)
Competitors Alamo group, CLAAS Group, CNH Industrial, Kubota Corporation
Brands Challenger, FENDT, GSI, Massey Ferguson, VALTRA, GLEANER, and
White Planters among others
Subsidiaries
Massey Ferguson Corp., Valtractors Mexico SA de CV, Fendt
Fordertechnik GmbH, AGCO Funding Corporation, AGCO
Manufacturing Ltd.
Related Products & Services Tractors, combine harvesters, seeding & tillage equipments, hay &
forage solutions, parts
Other Products & Services Precision farming, ground storage, protein production system,
ground care machinery, engines, generators
Source: AGCO Corp. Website, BIS Research Analysis
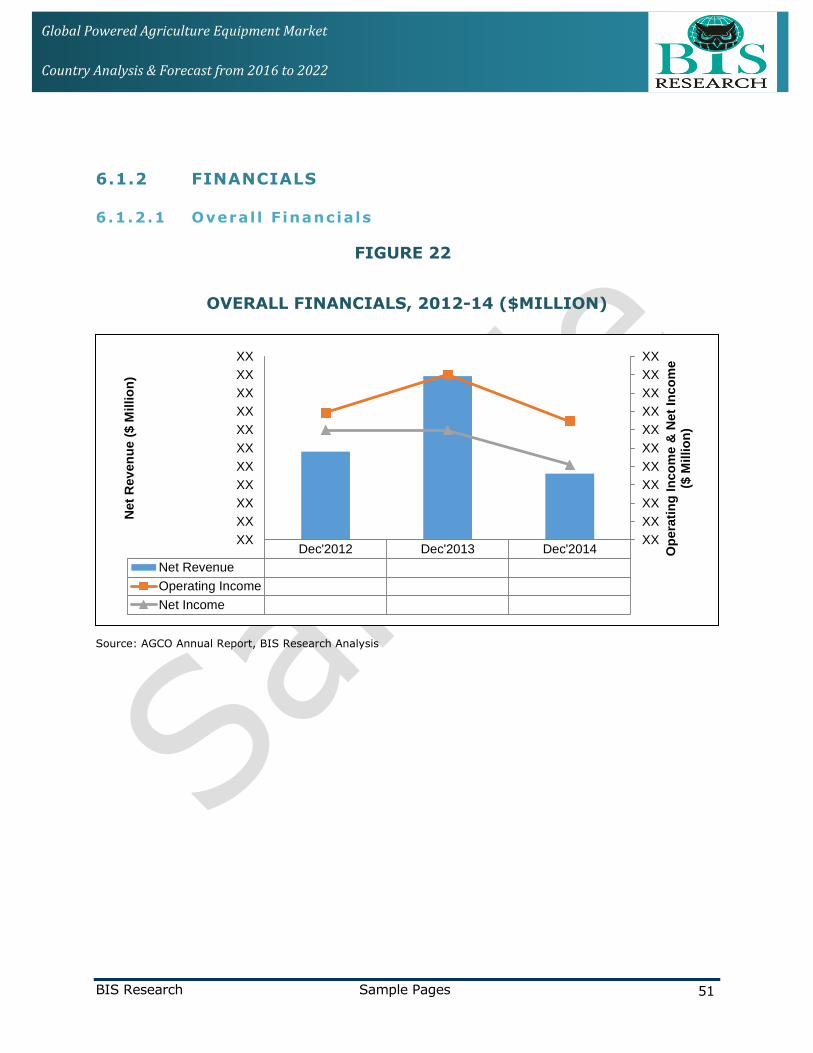
BIS Research Sample Pages 51
Global Powered Agriculture Equipment Market
Country Analysis & Forecast from 2016 to 2022
6.1.2 FINANCIALS
6.1.2.1 Overal l F inancials
FIGURE 22
OVERALL FINANCIALS, 2012-14 ($MILLION)
Dec'2012 Dec'2013 Dec'2014
Net Revenue 9,962.20 10,786.90 9,723.70
Operating Income 693.2 900.7 646.5
Net Income 597.2 597.2 410.4
XX
XX
XX
XX
XX
XX
XX
XX
XX
XX
XX
XX
XX
XX
XX
XX
XX
XX
XX
XX
XX
XX
Op
era
tin
g I
nco
me
& N
et
Inco
me
($ M
illio
n)
Ne
t R
ev
en
ue
($ M
illi
on
)
Source: AGCO Annual Report, BIS Research Analysis

BIS Research Sample Pages 52
Global Powered Agriculture Equipment Market
Country Analysis & Forecast from 2016 to 2022
6.1.2.2 Geographic Revenue Mix
FIGURE 23
GEOGRAPHIC REVENUE MIX, 2012-14 ($MILLION)
XX
XX
XX
XX
XX
XX
XX
EAME North America South America APAC
$ M
illio
n
Dec'2012 Dec'2013 Dec'2014
Source: AGCO Annual Report, BIS Research Analysis
EAME* Europe, Africa, Middle East

BIS Research Sample Pages 53
Global Powered Agriculture Equipment Market
Country Analysis & Forecast from 2016 to 2022
6.1.2.3 Segment Revenue Mix
FIGURE 24
SEGMENT REVENUE MIX, 2012-14 ($MILLION)
XX
XX
XX
XX
XX
XX
XX
XX
$ M
illio
n
Dec'2012 Dec'2013 Dec'2014
Source: AGCO Annual Report, BIS Research Analysis
6.1.2.4 Financial Summary
AGCO Corporation generated net revenue of $XX million in the FY 2014 which was XX% less
than the FY 2013. The company earned $XX million from Europe, Africa & Middle East regions
alone in 2014 and its highest earning business segment in the same year was tractors which
added $XX million alone to its revenue. Till the third quarter of 2015, the company accounted
for total $XX million of net revenue, which was XX% less than the same time period in 2014.
Moreover, maximum sales generated by the third quarter of FY 2015 was concentrated in the
EMEA region which was around $XX billion, less than that of the previous year. The sales
revenue was largest from Germany, Scandinavia and Russia. The reason behind this declining
revenue is the lower rate of industry demand for farm equipment across all regions and the
unfavourable effect of foreign currency translation.

BIS Research Sample Pages 54
Global Powered Agriculture Equipment Market
Country Analysis & Forecast from 2016 to 2022
6.1.3 KEY STRATEGIES & DEVELOPMENTS
Date Strategy Description
November
2015 Recognition
AGCO Corporation won the “Major European Tractor of the
Year” Awards at Agritechnica, Hannover Fair for its products
Fendt, Massey Ferguson and Valtra Tractors
September
2015 Product Launch
AGCO Corporation launched the next generation of guidance
technology for farm machinery to help growers maximize
outputs
September
2015 Product Launch
AGCO Corporation launched the AGCO e-sourcing platform to
manage all production material sourcing projects across the
organization
September
2015 Business Expansion
AGCO Corporation signed a memorandum of understanding
(MOU) with the Alibaba Group in Shanghai, China to start an
“Internet-plus-Agriculture” crossover program
September
2015 Business Expansion
AGCO Corporation announced the opening of its brand new
manufacturing base in Changzhou, China to enhance R&D
and manufacturing capacity
September
2015 Product Launch
AGCO Corporation launched the Go-Task Mobile App for
wireless transfer of task data to and from AGCO machines
and programs
August 2015 Product Launch
AGCO Corporation launched fuse connected services to
combine the right machines, technologies, parts, and
services
April 2015 Partnership
AGCO Corporation’s brand GSI partnered with Cultivating
New Frontiers in Agriculture (CNFA) to improve farm
productivity and food security
November
2014 Joint Venture
AGCO Corporation and Appareo Systems(the U.S.) entered
into a joint venture to deliver advanced technologies and
equipment management solutions

BIS Research Sample Pages 55
Global Powered Agriculture Equipment Market
Country Analysis & Forecast from 2016 to 2022
Date Strategy Description
May 2014 Collaboration
AGCO Corp. collaborated with DuPont Pioneer (the U.S.) to
bring wireless data transfer technology solutions to farmers
in the U.S., Canada, Brazil and key European countries
February
2014 Business Expansion
AGCO launched the Global Fuse Contact Center, a customer
support resource to assist customers with setup, calibration,
and operational support on all its precision agriculture and
machine communication technology products
September
2013 Joint Venture
AGCO Corp. and Russian Machines(Russia), part of the Basic
Element group formed a joint venture to manufacture and
distribute agricultural equipments and replacement parts in
Russia
July 2013 Business Expansion AGCO Corp. announced the launch of precision farming
business strategy Fuse Technologies (the U.K.)
Source: AGCO Corporation Press Release, BIS Research Analysis
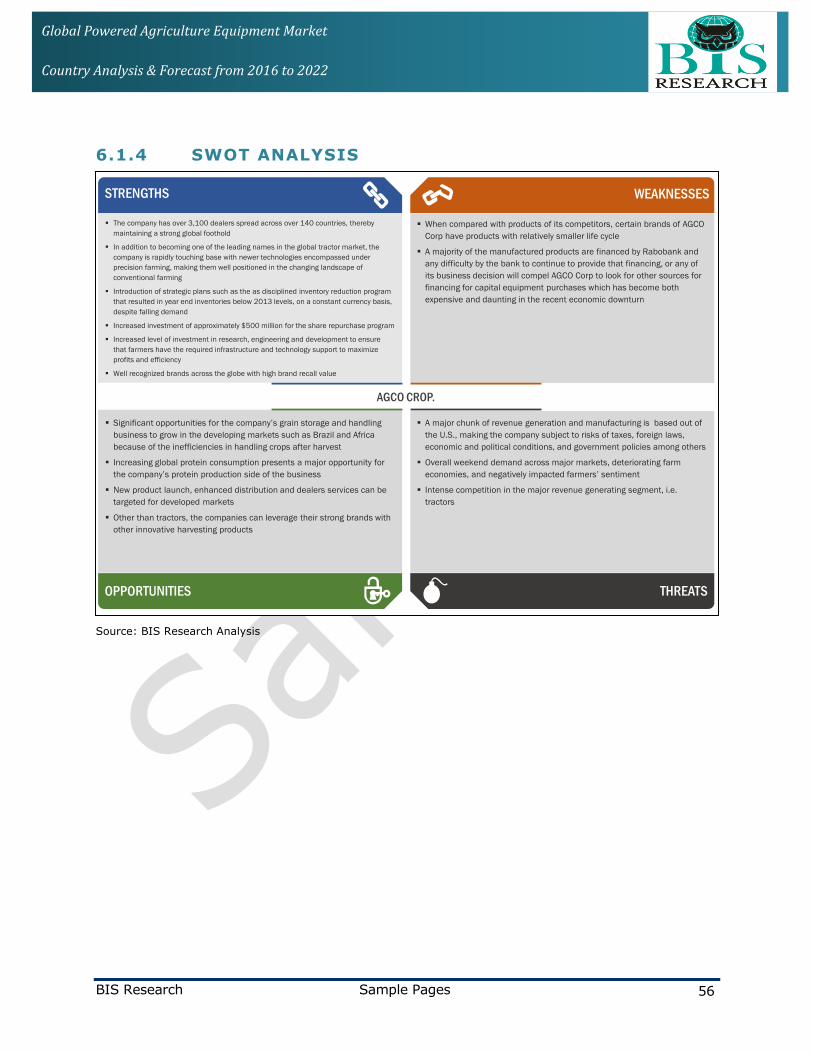
BIS Research Sample Pages 56
Global Powered Agriculture Equipment Market
Country Analysis & Forecast from 2016 to 2022
6.1.4 SWOT ANALYSIS
AGCO CROP.
The company has over 3,100 dealers spread across over 140 countries, thereby
maintaining a strong global foothold
In addition to becoming one of the leading names in the global tractor market, the
company is rapidly touching base with newer technologies encompassed under
precision farming, making them well positioned in the changing landscape of
conventional farming
Introduction of strategic plans such as the as disciplined inventory reduction program
that resulted in year end inventories below 2013 levels, on a constant currency basis,
despite falling demand
Increased investment of approximately $500 million for the share repurchase program
Increased level of investment in research, engineering and development to ensure
that farmers have the required infrastructure and technology support to maximize
profits and efficiency
Well recognized brands across the globe with high brand recall value
STRENGTHS WEAKNESSES
OPPORTUNITIES THREATS
When compared with products of its competitors, certain brands of AGCO
Corp have products with relatively smaller life cycle
A majority of the manufactured products are financed by Rabobank and
any difficulty by the bank to continue to provide that financing, or any of
its business decision will compel AGCO Corp to look for other sources for
financing for capital equipment purchases which has become both
expensive and daunting in the recent economic downturn
Significant opportunities for the company’s grain storage and handling
business to grow in the developing markets such as Brazil and Africa
because of the inefficiencies in handling crops after harvest
Increasing global protein consumption presents a major opportunity for
the company’s protein production side of the business
New product launch, enhanced distribution and dealers services can be
targeted for developed markets
Other than tractors, the companies can leverage their strong brands with
other innovative harvesting products
A major chunk of revenue generation and manufacturing is based out of
the U.S., making the company subject to risks of taxes, foreign laws,
economic and political conditions, and government policies among others
Overall weekend demand across major markets, deteriorating farm
economies, and negatively impacted farmers’ sentiment
Intense competition in the major revenue generating segment, i.e.
tractors
Source: BIS Research Analysis

BIS Research Sample Pages 57
Global Powered Agriculture Equipment Market
Country Analysis & Forecast from 2016 to 2022
DISCLAIMER
BIS Research provides valuable market intelligence to an exclusive group of customers in
response to orders. The report is licensed for the customer's internal use only and is subject to
restrictions set henceforth. This document and its contents are confidential and may not be
further distributed, published or reproduced, in whole or in part, by any medium or in any form
for any purpose, without the express written consent of BIS Research. Customer will not
disclose the contents of the report, whether directly in any media or indirectly through
incorporation in a database, marketing list, report or otherwise, or use or permit the use of
Information to generate any statistical or other information that is or will be provided to third
parties; or voluntarily produce Information in legal proceedings.
Market reports are based on expectations, estimates and projections as of the date such
information is available. Any recommendation contained in this report may not be suitable for
all investors or businesses. The market conclusions drawn are necessarily based upon a
number of estimates and assumptions that, while considered reasonable by BIS Research as of
the date of such statements, are inherently subject to market fluctuations and business,
economic and competitive uncertainties and contingencies
For more details regarding permission, please contact us:
Email: [email protected]
Tel: +1 650 228 0182
Top Related