


Languages
Pages
Legal

Safety versus Access: The maternity care dilemma in
South Africa
Bob Pattinson MRC Maternal and Infant Health Care Strategies Unit, University of Pretoria,
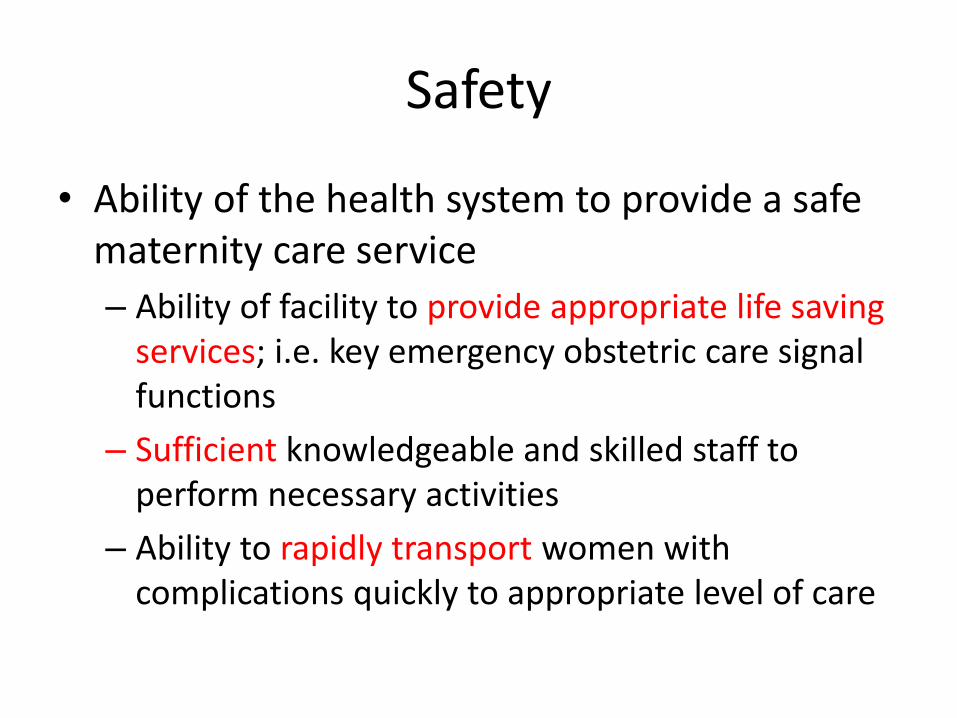
Safety
• Ability of the health system to provide a safe maternity care service
– Ability of facility to provide appropriate life saving services; i.e. key emergency obstetric care signal functions
– Sufficient knowledgeable and skilled staff to perform necessary activities
– Ability to rapidly transport women with complications quickly to appropriate level of care

Access
• Ability of a pregnant woman to be seen and treated by appropriate health care providers in facilities with the appropriate resources when entering the health care system close to her home – Appropriately resourced facilities in appropriate
geographical locations
– Knowledgeable and skilled staff in those facilities
– Rapid appropriate transport for women with complications to the appropriate level of care

Two sides of the same coin

Data
• Briefing prior to visit and distribution of survey forms
• Team – 2-3 from MRC
– 2-3 from district and MCWH of province
• Emergency-drill workshop
• Training in National Birth Register and Monthly data sheets
• Walk through to verify data in baseline data sheets
• Follow-up telephone call to clarify any points

Sites
• 53 CHC’s
• 63 District Hospitals
• 13 Regional Hospitals
• 4 Provincial tertiary hospitals

Human resources and maternity units

Not enough staff?
• Not enough staff to manage births in district?
• Not enough staff on-site to have critical mass of staff needed to provide key functions?

Staffing of labour ward/maternity unit
• WHO criteria: 1 Midwife should perform 175 deliveries/year
– WHO Annual Report, Human Resources 2005
– 40% women in labour referred from CHC to DH
• Greenfield criteria: 1 midwife should perform 75 deliveries/year
– SA developed norms

0
20
40
60
80
100
120
140
160
180
Births/Midwife
Nu
mb
er o
f b
irth
s p
er y
ear
pe
r m
idw
ife
Comparison between districts of births per midwife per year:
WHO and Greenfield
Lejweleputswa
Thabo Mofutsanyane
Fezile Dabi
Amatole
Ekurhuleni
Ugu
Umgungungundlovu
Uthungulu
Waterberg
Gert Sibande
Bojanala Platinum
Francis Baard
Sufficient midwives per district
Is their distribution correct?

-30
-25
-20
-15
-10
-5
0
5
10
15
20
Ab
ove
/be
low
th
eo
reti
cal s
taff
ing
Ekurhuleni Staff per facility
ESANYWENI MOU
J DUMANE
KWA-THEMA MOU
NOKUTHELA NGWENYA
PHILIP MOYO
Ramakonopi
PHOLA PARK
BERTHA GXOWA -GERMISTON HOSPITAL
FAR EAST RAND
NATALSPRUIT
O R TAMBO
PHOLOSONG HOSPITAL

-10
-5
0
5
10
15
Ab
ove
/be
low
th
eo
reti
cal s
taff
ing
Gert Sibande Staffing/facility
Amsterdam CHC
Badplaas CHC
Paulinah Morapedi CHC
Siyathemba
Embalenhle
Amajuba Memorial Hospital
Bethal Hospital
Carolina Hospital
Embhuleni Hospital
Evander Hospital
Piet Retief Hospital
Standerton Hospital
Elsie Ballot
Ermelo

Distribution variable
Is there a critical mass of staff essential for a safe maternity
unit?

Maternal Care Guidelines for Observations in labour
Half hourly FH and contraction monitoring
Hourly BP, pulse and respiration 2 hourly vaginal examination
Labour ward is a high care setting: One PN for maximum 2 women in labour
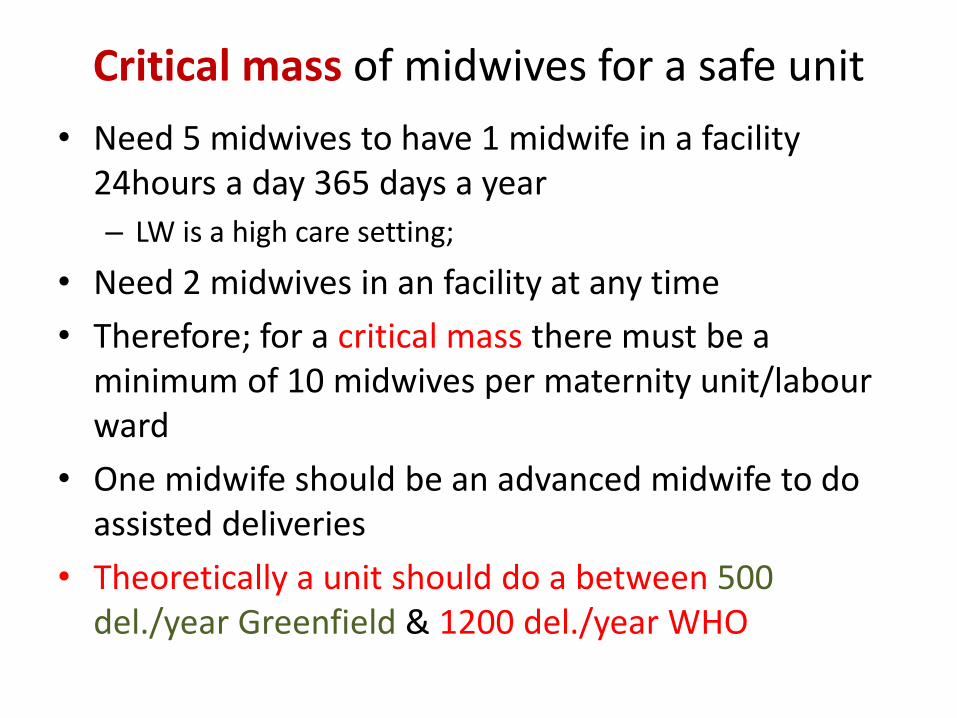
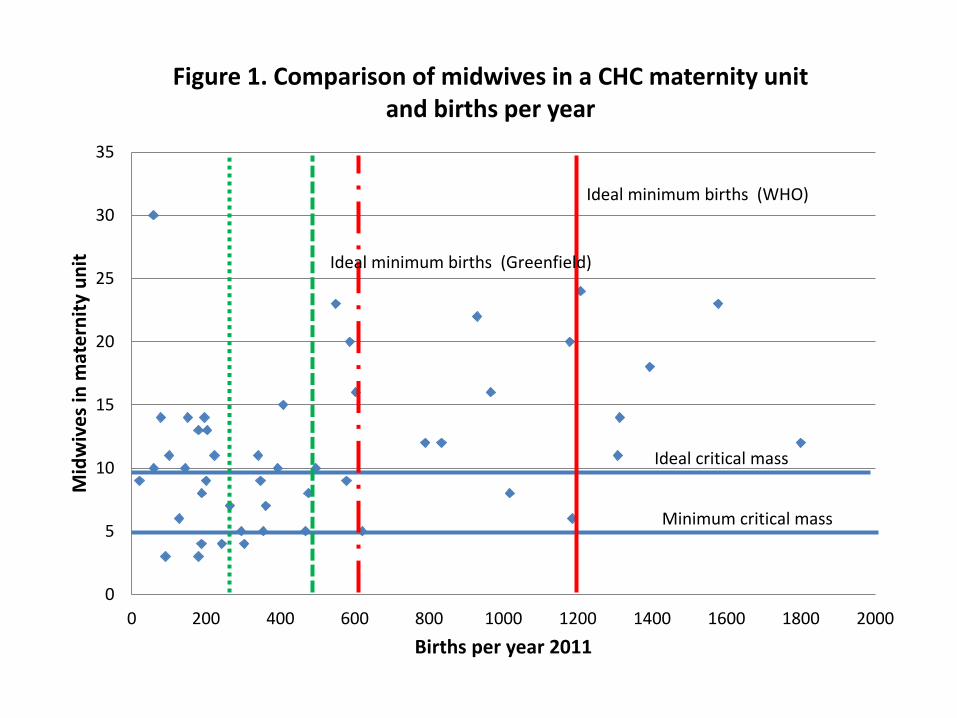
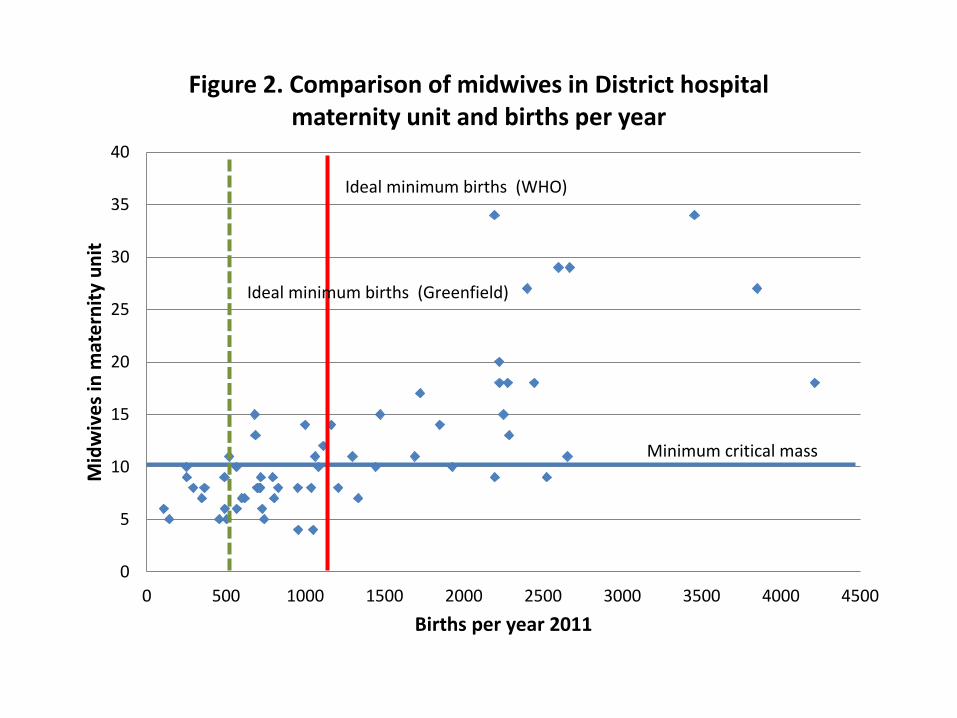
Critical mass of midwives for a safe unit
• Need 5 midwives to have 1 midwife in a facility 24hours a day 365 days a year
– LW is a high care setting;
• Need 2 midwives in an facility at any time
• Therefore; for a critical mass there must be a minimum of 10 midwives per maternity unit/labour ward
• One midwife should be an advanced midwife to do assisted deliveries
• Theoretically a unit should do a between 500 del./year Greenfield & 1200 del./year WHO

Births in CHCs/BEmOC sites
0
5
10
15
20
25
30
<500 500-999 1000-1499 1500+
Nu
mb
er
Deliveries
0
10
20
30
40
50
60
<500 500-999 1000-1499 1500+
Per
cen
t
Deliveries

Births in CEmOCs 2011
0
5
10
15
20
25
Nu
mb
er
Births
0.0
5.0
10.0
15.0
20.0
25.0
30.0
Pe
rce
nt
Births
Staffing at CHCs and DHs allocated to maternity units
0
5
10
15
20
25
30
35
0 200 400 600 800 1000 1200 1400 1600 1800 2000
Mid
wiv
es
in m
ate
rnit
y u
nit
Births per year 2011
Figure 1. Comparison of midwives in a CHC maternity unit and births per year
Ideal critical mass
Minimum critical mass
Ideal minimum births (WHO)
Ideal minimum births (Greenfield)
0
5
10
15
20
25
30
35
40
0 500 1000 1500 2000 2500 3000 3500 4000 4500
Mid
wiv
es
in m
ate
rnit
y u
nit
Births per year 2011
Figure 2. Comparison of midwives in District hospital maternity unit and births per year
Minimum critical mass
Ideal minimum births (WHO)
Ideal minimum births (Greenfield)

Problem of staff allocation and number of deliveries
& Problem number of deliveries and cost
effectiveness
Many units are unsafe for pregnant women in labour
Or not cost effective

Not enough facilities?

Facilities and UN recommendations for EmOC (For every 500,000 population: 1 DH & 4 CHCs)
District CHC DH RH PT Total District
Population
Population
that could be
served#
"Excess
capacity"
Amathole 9 12 1 1 23 1,806,831 6,000,000 4,193,169
Fezile Dabi 0 4 1 0 5 499,875 2,000,000 1,500,125
Lejweleputswa 0 5 1 0 6 694,198 2,500,000 1,805,802
T Mofuntsanyane 1 10 1 0 12 767,678 5,000,000 4,232,322
Ekurhuleni 7 1 4 1 13 2,965,602 3,000,000 34,398
Ugu 3 3 1 0 7 760,648 2,000,000 1,239,352
Umgungundlovu 4 2 1 1 8 1,058,086 2,000,000 941,914
Uthungulu 3 6 1 0 10 965,950 3,500,000 2,534,050
Waterberg 2 8 0 0 10 666,664 4,000,000 3,333,336
Gert Sibande 6 8 1 0 15 943,137 4,500,000 3,556,863
Francis Baard 4 2 0 1 7 375,167 1,500,000 1,124,833
Bojanala 16 3 1 0 20 1,400,000 2,000,000 600,000
Total 55 64 13 4 136

Midwives and staffing
• There are too many facilities for the staff available
• However, there are sufficient midwives per district
• Few CHCs and DHs reach the critical mass of staff to provide a safe service and/or have sufficient deliveries to be cost effective
• Some facilities are overstaffed for workload but understaffed for a safe service
• There are too many facilities to provide emergency obstetric care effectively

However, if sites are decreased accessibility of care for women is
compromised

Loeriesfontein (Northern Cape)
• Population – 3000 people
• CHC with 5 staff members
• Births 20-30 per year
• Distance to nearest District Hospital – 150 km
Should Loeriesfontein provide care for women in labour?

Thank you
Top Related