


Languages
Pages
Legal


PREPARED FOR:CALIFORNIA DEPARTMENT OF TOXIC SUBSTANCES CONTROLHAZARDOUS WASTE MANAGEMENT PROGRAMPO BOX 806SACRAMENTO, CALIFORNIA 95812
PREPARED BY:
GEOCON CONSULTANTS, INC.3160 GOLD VALLEY DRIVE, SUITE 800RANCHO CORDOVA, CALIFORNIA 95742
GEOCON PROJECT NO. S9850-03-21 DECEMBER 23, 2016
SA Recycling – Terminal Island901 New Dock Street
Terminal Island, California
AIR MONITORING SUMMARY REPORT
Project No. S9850-03-21 December 23, 2016 Edward Benelli Hazardous Substances Engineer Hazardous Waste Management Program Department of Toxic Substances Control P.O. Box 806 Sacramento, California 95812-0806 Subject: AIR MONITORING SUMMARY REPORT
SA RECYCLING – TERMINAL ISLAND 901 NEW DOCK STREET TERMINAL ISLAND, CALIFORNIA 90731 CONTRACT NO. 15-T4124 A-1
Dear Mr. Benelli: In accordance with the above-referenced contract, Geocon has performed air monitoring at and prepared the enclosed Air Monitoring Summary Report for the above-referenced metal shredding/recycling facility. The California Department of Toxic Substances Control (DTSC) requested air monitoring to evaluate the potential for off-site migration of airborne particulates, toxic organic compounds, and asbestos from metal shredding/recycling facilities. The report summarizes the air monitoring activities performed including sample collection, laboratory analysis, and the results of a data quality assessment. The DTSC intends to use these results to assess the potential impacts from air emissions from metal shredding/recycling operations. We appreciate the opportunity to work with the DTSC on this project. Please let us know if you have questions concerning the report or we may be of further service. Sincerely, GEOCON CONSULTANTS, INC. Josh Ewert, PG Jim Brake, PG Project Geologist Senior Geologist
i
IDENTIFICATION FORM
Document Title: Air Monitoring Summary Report SA Recycling – Terminal Island
Site Location: 901 New Dock Street, Terminal Island, CA 90731 Contract No.: 15-T4124 A-1
Prepared by: Geocon Consultants, Inc. 3160 Gold Valley Drive, Suite 800 Rancho Cordova, California 95742 916.852.9118 Geocon Project Number: S9850-03-21
Geocon Contract Manager: Jim Brake, PG [email protected] 916.852.9118 Geocon Contract Manager:
Approval: Date: December 23, 2016 Jim Brake, PG No. 5753 Geocon Project Manager:
Approval: Date: December 23, 2016 Josh Ewert, PG No. 9096
This Report has been prepared for the California Environmental Protection Agency (CalEPA), DTSC. The material herein is not to be disclosed to, discussed with, or made available to any person(s) for any reason without prior express approval of the appropriate responsible DTSC officer.

iii
DISTRIBUTION LIST Edward Benelli, Contract Manager (1 hard-copy, e-copy) California Environmental Protection Agency DTSC Hazardous Waste Management Program Megan Cambridge, Project Manager (1 hard-copy, e-copy) California Environmental Protection Agency DTSC Hazardous Waste Management Program Josh Ewert, PG and Jim Brake, PG (project file) Geocon Consultants, Inc.

iv
TABLE OF CONTENTS
AIR MONITORING SUMMARY REPORT SA RECYCLING – TERMINAL ISLAND PAGE
IDENTIFICATION FORM …………………………………………………………………….…….. i APPROVAL FORM …………………………………………………………………………….…….ii DISTRIBUTION LIST ………………………………………………………………………….…….iii TABLE OF CONTENTS …………………………………………………………………….……….iv ACRONYMS AND ABBREVIATIONS………………………………………………….………….vi
1.0 INTRODUCTION .................................................................................................................... 1 1.1 Background .................................................................................................................. 1 1.2 Responsible Agency ..................................................................................................... 2 1.3 Project Contact Information ......................................................................................... 2
2.0 SITE DESCRIPTION ............................................................................................................... 3 2.1 Facility Description ...................................................................................................... 3 2.2 Regional Climate and Wind Direction ......................................................................... 3
3.0 METHODS AND PROCEDURES ........................................................................................... 4 3.1 Pre-Field Activities ...................................................................................................... 4 3.2 Sampling Locations ...................................................................................................... 4 3.3 Sampling Equipment .................................................................................................... 4 3.4 Calibration and Leak Check Testing ............................................................................ 6
3.4.1 TSP Calibration ............................................................................................... 6 3.4.2 PM10 and PM2.5 Calibration Activities ............................................................ 6 3.4.3 PCB Calibration Activities .............................................................................. 7 3.4.4 Formaldehyde and Asbestos Calibration Activities ........................................ 8
3.5 Air Sampling Description ............................................................................................ 8 3.5.1 First Monitoring Event (T1) ............................................................................ 8 3.5.2 Second Monitoring Event (T2) ....................................................................... 9 3.5.3 Third Monitoring Event (T3) ........................................................................ 10
3.6 Meteorological Conditions ......................................................................................... 10 3.7 Packaging and Shipping ............................................................................................. 11 3.8 Laboratory Analysis ................................................................................................... 11 3.9 Variance from SAP .................................................................................................... 12
4.0 RESULTS ............................................................................................................................... 13 4.1 Analytical Results ...................................................................................................... 13
4.1.1 TSP ................................................................................................................ 13 4.1.2 PM10 ............................................................................................................. 13 4.1.3 PM2.5 ............................................................................................................ 14 4.1.4 Asbestos ........................................................................................................ 14 4.1.5 PCBs ............................................................................................................. 14 4.1.6 Formaldehyde ............................................................................................... 14 4.1.7 VOCs ............................................................................................................. 14
4.2 Data Quality Analysis ................................................................................................ 14 4.3 Meteorological Data ................................................................................................... 15
5.0 REPORT LIMITATIONS ....................................................................................................... 18
6.0 REFERENCES ........................................................................................................................ 19

TABLE OF CONTENTS (Continued)
v
FIGURES 1. Vicinity Map 2. Site Plan PHOTOGRAPHS 1 through 4 TABLES – IN-TEXT (Identified by the “T” Preface) T1.3 Personnel Contact Information and Title T3.3A Sampling Analytes, Media and Equipment T3.3B Sampler Spacing Requirements T3.4.1 TSP Sampler Flow Rates and Total Flows T3.4.2 PM10 and PM2.5 Sampler Flow Rates T3.4.3 PCB Sampler Flow Rates and Total Flows T3.5 Sample Times and Facility Operations T4.3A Meteorological Data Per Test T4.3B – Frequency of Wind Direction and Its Effect on Sample Location Representativeness for T1 T4.3C – Frequency of Wind Direction and Its Effect on Sample Location Representativeness for T2 T4.3D – Frequency of Wind Direction and Its Effect on Sample Location Representativeness for T3 TABLES – POST-TEXT 1. Summary of Gravimetric and Metals Analytical Data – TSP 2. Summary of Gravimetric and Metals Analytical Data – PM10 3. Summary of Gravimetric and Metals Analytical Data – PM2.5 4. Summary of Asbestos Analytical Data 5. Summary of PCB Analytical Data 6. Summary of Formaldehyde Analytical Data 7. Summary of TOS Analytical Data
APPENDICES A. Health and Safety Plan
B. Geocon Field Logs
C. TSP Calibration Worksheets
D. Sampling Summary, Data Log, and Alarm Log - PM10 Sampling Equipment
E. Sampling Summary, Data Log, and Alarm Log – PM2.5 Sampling Equipment
F. PUF Calibration Worksheets
G. Meteorological Data and Activity Log
H. Analytical Reports
I. Data Quality Assessment Report
J. Wind Rose Diagrams
vi
ABBREVIATIONS AND ACRONYMS
aka Also known as
AHERA Asbestos Hazard Emergency Response Act
AQMD Air Quality Management District
CFR Code of Federal Regulations
CLN CHESTER LabNet
COC Chain-of-custody
COPC Chemical of potential concern
DTSC Department of Toxic Substances Control
EAT Eurofins Air Toxics
ECS Eurofins Calscience
EMSL EMSL Analytical, Inc.
HSP Health and safety plan
in-Hg Inches of mercury pressure
L/min Liters per minute
LCS/LCSD Laboratory control sample/laboratory control sample duplicate
m3 Cubic meter
m3/min Cubic meter per minute
MPH Miles per hour
MRP Metal recovery plant
NELAP National Environmental Laboratory Accreditation Program
NVLAP National Voluntary Laboratory Accreditation Program
PCB Polychlorinated biphenyls
PM10 Particulate matter less than 10 µm
PM2.5 Particulate matter less than 2.5 µm
POLA Port of Los Angeles
PTFE Polytetrafluoroethylene
PUF Polyurethane foam
QA/QC Quality assurance/ quality control
RCRA Resource Conservation and Recovery Act
SAP Sampling and Analysis Plan
SARB SA Recycling Bakersfield
SARTI SA Recycling Terminal Island
SB Senate Bill
SMM Sims Metal Management
T1/T2/T3 Test 1/Test 2/Test 3
TEM Transmission electron microscopy
Tisch Tisch Environmental
TOS Toxic organic species
TSP Total suspended particulates
USEPA United States Environmental Protection Agency
VOC Volatile organic compounds
XRF X-ray fluorescence
°F Degrees Fahrenheit
Air Monitoring Summary Report SA Recycling – Terminal Island
Geocon Project No. S9850-03-21 - 1 - December 23, 2016
AIR MONITORING SUMMARY REPORT SA RECYCLING – TERMINAL ISLAND
CONTRACT NO. 15-T4124 A-1 _____________________________________________________
1.0 INTRODUCTION
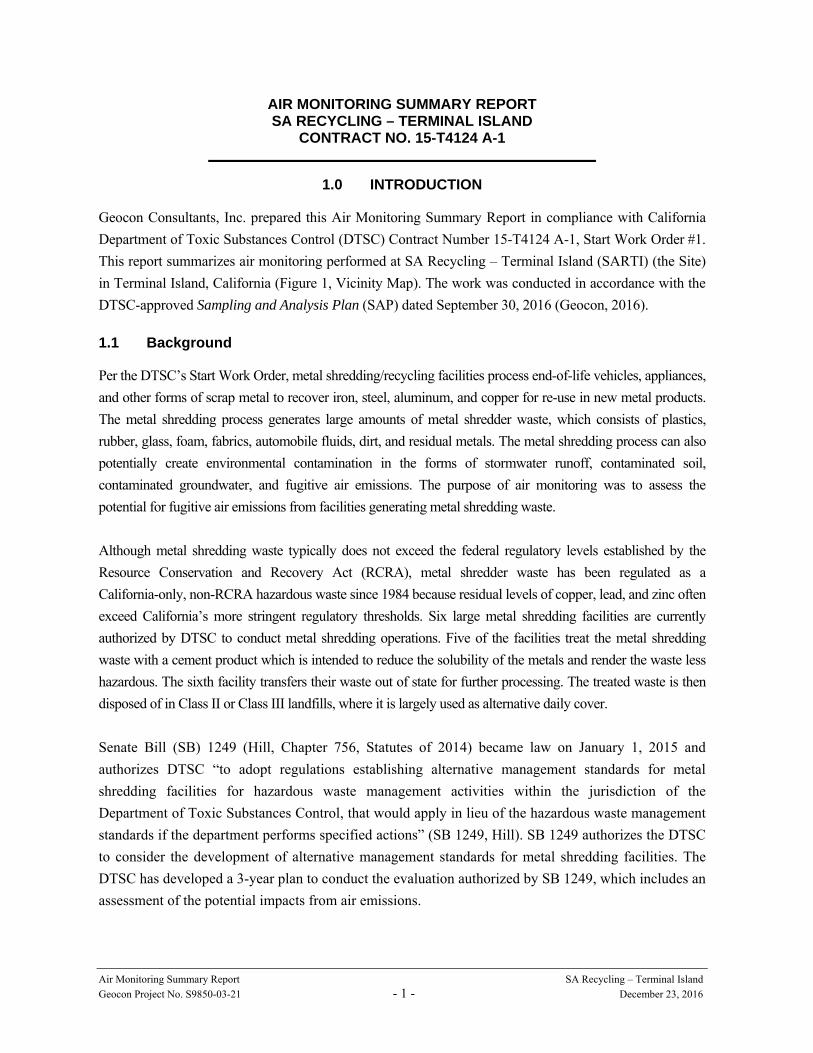
Geocon Consultants, Inc. prepared this Air Monitoring Summary Report in compliance with California
Department of Toxic Substances Control (DTSC) Contract Number 15-T4124 A-1, Start Work Order #1.
This report summarizes air monitoring performed at SA Recycling – Terminal Island (SARTI) (the Site)
in Terminal Island, California (Figure 1, Vicinity Map). The work was conducted in accordance with the
DTSC-approved Sampling and Analysis Plan (SAP) dated September 30, 2016 (Geocon, 2016).
1.1 Background
Per the DTSC’s Start Work Order, metal shredding/recycling facilities process end-of-life vehicles, appliances,
and other forms of scrap metal to recover iron, steel, aluminum, and copper for re-use in new metal products.
The metal shredding process generates large amounts of metal shredder waste, which consists of plastics,
rubber, glass, foam, fabrics, automobile fluids, dirt, and residual metals. The metal shredding process can also
potentially create environmental contamination in the forms of stormwater runoff, contaminated soil,
contaminated groundwater, and fugitive air emissions. The purpose of air monitoring was to assess the
potential for fugitive air emissions from facilities generating metal shredding waste.
Although metal shredding waste typically does not exceed the federal regulatory levels established by the
Resource Conservation and Recovery Act (RCRA), metal shredder waste has been regulated as a
California-only, non-RCRA hazardous waste since 1984 because residual levels of copper, lead, and zinc often
exceed California’s more stringent regulatory thresholds. Six large metal shredding facilities are currently
authorized by DTSC to conduct metal shredding operations. Five of the facilities treat the metal shredding
waste with a cement product which is intended to reduce the solubility of the metals and render the waste less
hazardous. The sixth facility transfers their waste out of state for further processing. The treated waste is then
disposed of in Class II or Class III landfills, where it is largely used as alternative daily cover.
Senate Bill (SB) 1249 (Hill, Chapter 756, Statutes of 2014) became law on January 1, 2015 and
authorizes DTSC “to adopt regulations establishing alternative management standards for metal
shredding facilities for hazardous waste management activities within the jurisdiction of the
Department of Toxic Substances Control, that would apply in lieu of the hazardous waste management
standards if the department performs specified actions” (SB 1249, Hill). SB 1249 authorizes the DTSC
to consider the development of alternative management standards for metal shredding facilities. The
DTSC has developed a 3-year plan to conduct the evaluation authorized by SB 1249, which includes an
assessment of the potential impacts from air emissions.
Air Monitoring Summary Report SA Recycling – Terminal Island
Geocon Project No. S9850-03-21 - 2 - December 23, 2016
The SAP describes air monitoring activities at the following metals shredding facilities:
SARTI in Terminal Island, California,
SA Recycling – Bakersfield (SARB) located at 2000 E. Brundage Lane in Bakersfield, California, and
Sims Metal Management (SMM) located at 699 Seaport Boulevard in Redwood City, California. These three facilities were selected to represent examples of larger (SARTI, SMM) and smaller
(SARB) metal shredding/recycling facilities that operate in a variety of different geographic conditions
and under the jurisdiction of various local Air Quality Management Districts (AQMD). At each facility
Geocon staff performed three consecutive 24-hour air monitoring events. Information from the air
monitoring events will be used to develop regulations establishing alternative management standards
for metal shredding facilities for hazardous waste management activities.
1.2 Responsible Agency
DTSC is the lead regulatory agency overseeing this air monitoring program. DTSC regulates hazardous
waste in California under the authority of RCRA and the California Health and Safety Code.
1.3 Project Contact Information
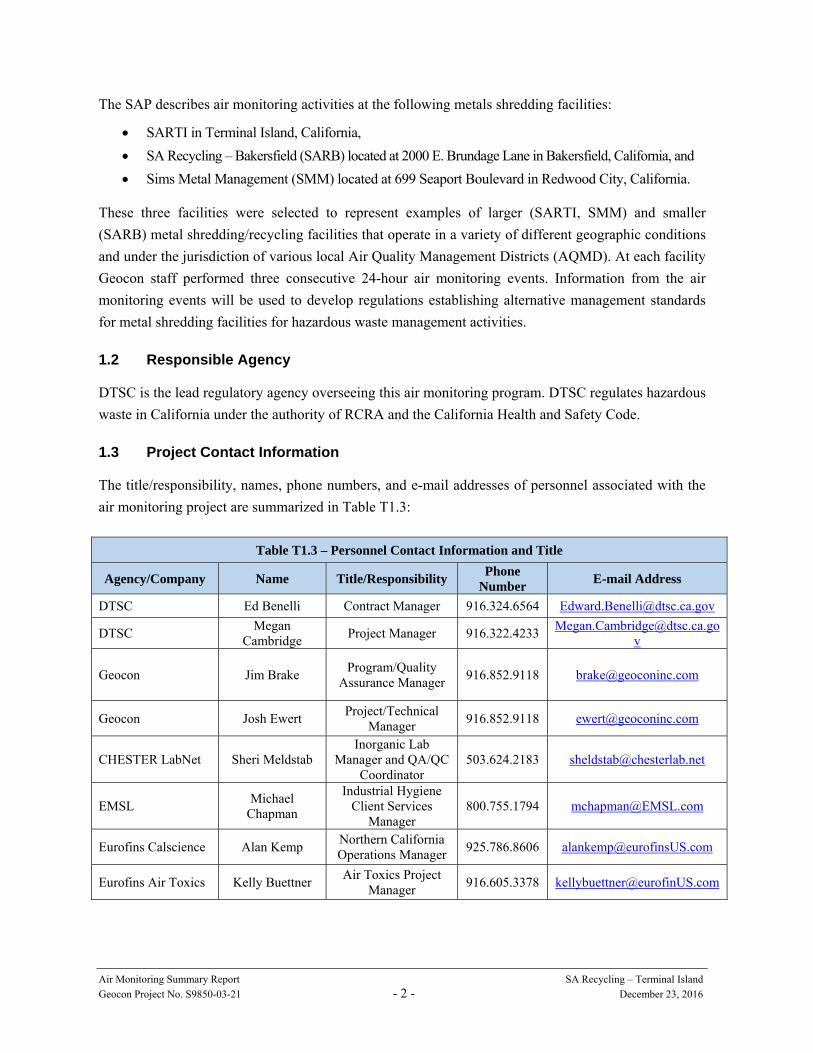
The title/responsibility, names, phone numbers, and e-mail addresses of personnel associated with the
air monitoring project are summarized in Table T1.3:
Table T1.3 – Personnel Contact Information and Title
Agency/Company Name Title/Responsibility Phone Number E-mail Address
DTSC Ed Benelli Contract Manager 916.324.6564 [email protected]
DTSC Megan
Cambridge Project Manager 916.322.4233
Geocon Jim Brake Program/Quality
Assurance Manager 916.852.9118 [email protected]
Geocon Josh Ewert Project/Technical
Manager 916.852.9118 [email protected]
CHESTER LabNet Sheri Meldstab Inorganic Lab
Manager and QA/QC Coordinator
503.624.2183 [email protected]
EMSL Michael
Chapman
Industrial Hygiene Client Services
Manager 800.755.1794 [email protected]
Eurofins Calscience Alan Kemp Northern California Operations Manager
925.786.8606 [email protected]
Eurofins Air Toxics Kelly Buettner Air Toxics Project
Manager 916.605.3378 [email protected]
Air Monitoring Summary Report SA Recycling – Terminal Island
Geocon Project No. S9850-03-21 - 3 - December 23, 2016
2.0 SITE DESCRIPTION
2.1 Facility Description
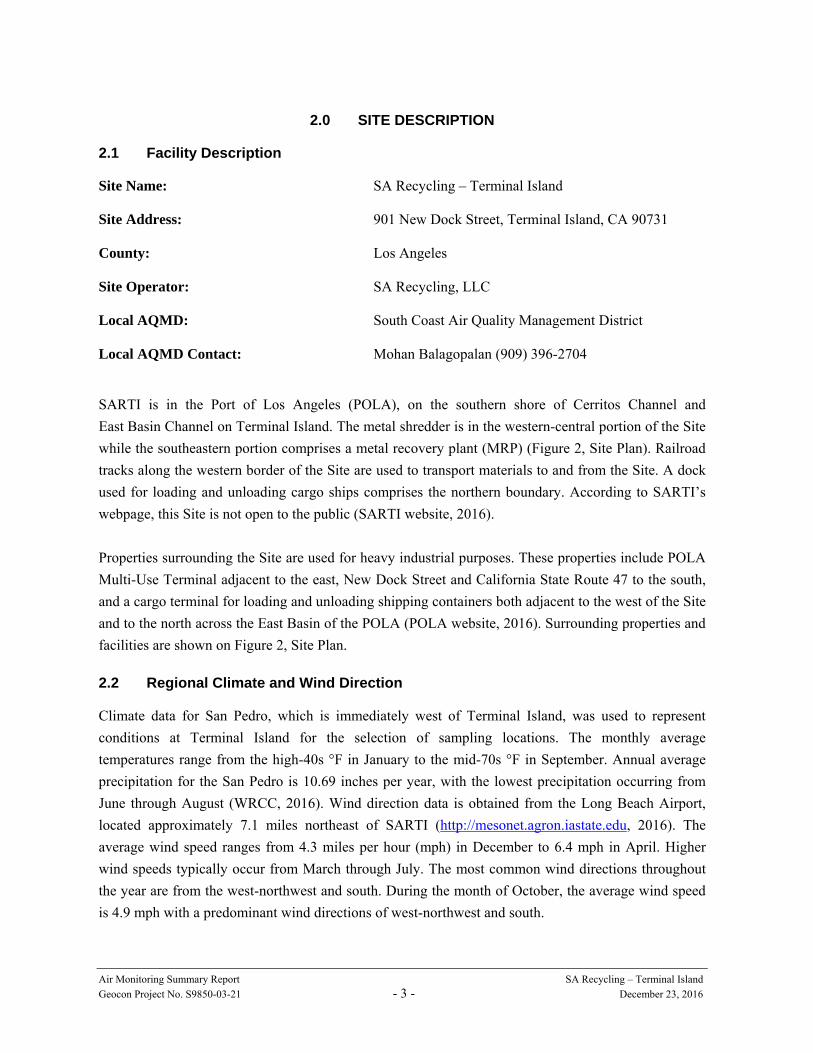
Site Name: SA Recycling – Terminal Island Site Address: 901 New Dock Street, Terminal Island, CA 90731 County: Los Angeles Site Operator: SA Recycling, LLC Local AQMD: South Coast Air Quality Management District Local AQMD Contact: Mohan Balagopalan (909) 396-2704 SARTI is in the Port of Los Angeles (POLA), on the southern shore of Cerritos Channel and
East Basin Channel on Terminal Island. The metal shredder is in the western-central portion of the Site
while the southeastern portion comprises a metal recovery plant (MRP) (Figure 2, Site Plan). Railroad
tracks along the western border of the Site are used to transport materials to and from the Site. A dock
used for loading and unloading cargo ships comprises the northern boundary. According to SARTI’s
webpage, this Site is not open to the public (SARTI website, 2016).
Properties surrounding the Site are used for heavy industrial purposes. These properties include POLA
Multi-Use Terminal adjacent to the east, New Dock Street and California State Route 47 to the south,
and a cargo terminal for loading and unloading shipping containers both adjacent to the west of the Site
and to the north across the East Basin of the POLA (POLA website, 2016). Surrounding properties and
facilities are shown on Figure 2, Site Plan.
2.2 Regional Climate and Wind Direction
Climate data for San Pedro, which is immediately west of Terminal Island, was used to represent
conditions at Terminal Island for the selection of sampling locations. The monthly average
temperatures range from the high-40s °F in January to the mid-70s °F in September. Annual average
precipitation for the San Pedro is 10.69 inches per year, with the lowest precipitation occurring from
June through August (WRCC, 2016). Wind direction data is obtained from the Long Beach Airport,
located approximately 7.1 miles northeast of SARTI (http://mesonet.agron.iastate.edu, 2016). The
average wind speed ranges from 4.3 miles per hour (mph) in December to 6.4 mph in April. Higher
wind speeds typically occur from March through July. The most common wind directions throughout
the year are from the west-northwest and south. During the month of October, the average wind speed
is 4.9 mph with a predominant wind directions of west-northwest and south.
Air Monitoring Summary Report SA Recycling – Terminal Island
Geocon Project No. S9850-03-21 - 4 - December 23, 2016
3.0 METHODS AND PROCEDURES
This section summarizes the activities to prepare for and the methods and sampling procedures utilized
during each of the three air monitoring events performed at the Site. Detailed information and protocols
for field methods are provided in the SAP (Geocon, 2016).
3.1 Pre-Field Activities
Geocon staff performed the following pre-field activities in preparation for air monitoring:
Performed a site visit on August 16, 2016, to meet with SARTI and DTSC staff and identify the sample locations at the Site.
Prepared a site-specific health and safety plan (HSP) to provide guidelines on the use of personal protective equipment and health and safety procedures to be implemented during the field activities. Field activities were conducted in accordance with the HSP prepared for the air monitoring at SARTI. A copy of the HSP is in Appendix A.
Retained CHESTER LabNet (CLN), a National Environmental Laboratory Accreditation Program (NELAP)-certified laboratory in Tigard, Oregon, to provide gravimetric and metals analysis of air samples.
Retained EMSL Analytical Inc. (EMSL), a National Voluntary Laboratory Accreditation Program (NVLAP) and NELAP-certified laboratory in Cinnaminson, New Jersey, to provide asbestos and volatile organic compounds (VOC) analysis of air samples.
Retained Eurofins Calscience (ECS), a California ELAP and NELAP-certified laboratory in Garden Grove, California, to perform polychlorinated biphenyls (PCB) analysis of air samples.
Retained Eurofins Air Toxics (EAT), a California ELAP and NELAP-certified laboratory in Folsom, California, to perform formaldehyde analysis of air samples.
3.2 Sampling Locations
As described in Section 2.2, the anticipated wind directions during the monitoring events were from the
west-northwest and south. During the August 16, 2016 site visit, SARTI staff stated that they
anticipated the predominant wind direction during the monitoring event would be from the south.
Therefore the four air sampling locations included one upwind (SARTI1), one downwind (SARTI2),
and two crosswind (SARTI3 and SARTI4) location.. SARTI5 was a collocated duplicate sampling
location for SARTI2 and was sampled in accordance with the schedule for quality assurance/quality
control sampling schedule in the SAP. Sample locations are shown on Figure 2. Photos 1 through 4
provide images of the sample equipment in reference to the sample locations.
3.3 Sampling Equipment
At each sampling location, air samples were collected using the equipment in Table T3.3A:

Air Monitoring Summary Report SA Recycling – Terminal Island
Geocon Project No. S9850-03-21 - 5 - December 23, 2016
Table T3.3A – Sampling Analytes, Media and Equipment Analytes Sample Media Sampler
Total suspended particulates (TSP), Metals
8-inch x 10-inch Quartz fiber filter TE-5170V high-volume
Particulate matter (PM) less than 10 micrograms (µm) (PM10), Metals
46.2-mm-diameter PTFE Teflon™ with integral support ring with a pore size of 10
µm TE-Wilbur10 low-volume
PM less than 2.5 µm (PM2.5), Metals 46.2-mm-diameter PTFE Teflon with
integral support ring with a pore size of 10 µm
TE-Wilbur2.5 low-volume
Asbestos Cartridge with a 25-mm-diameter mixed
cellulose ester fiber filter Gillian GilAir 3 personal
air pump
PCBs 3-inch-thick polyurethane foam (PUF) plugs TE-1000 PUF high-volume
air sampler
Formaldehyde Sorbant tube containing 0.35 g of 150-250 μm (60-100 mesh) silica gel coated with 1.0 mg of acidified 2,4-dinitrophenylhydrazine
Gillian GilAir 3 personal air pump
Toxic organic species1 (TOS) 6-Liter Summa canisters
None. Canister shipped with a vacuum inside
which was used to collect a sample.
Note: 1 = TOS includes benzene, chloromethane, 1,1-dichloroethene, ethylbenzene, 4-ethyltoluene, dichlorodifluoromethane [also known as (aka) Freon 12], trichlorofluoromethane (aka Freon 11), 1,2,4-trimethylbenzene, toluene, 1,3,5-trimethylbenzene, xylenes, and vinyl chloride.
A diesel-powered generator was used to supply power to the TSP, PM10, PM2.5, and PCB samplers
located at SARTI2 and SARTI5. Onsite electrical outlets were used to power the TSP, PM10, PM2.5,
and PCB sampling equipment at the remaining sampling locations. Rechargeable batteries were used to
power the asbestos and formaldehyde samplers. Power was not needed for the TOS samplers.
Spatial arrangement of samplers in each location (i.e., distance between samplers, height above ground
surface) were in accordance with the sampling placement requirements listed in 40 CFR Appendix E to Part 58 - Probe and Monitoring Path Siting Criteria for Ambient Air Quality Monitoring [United
States Environmental Protection Agency (USEPA), 2015] and comments provided by the Bay Area Air
Quality Management District (Stevenson, 2016). As such, requirements for sampler spacing were
relative to the sampling unit inlet (edge) and conformed to Table T3.3B:
Table T3.3B – Sampler Spacing Requirements
Parameter Inlet Above Ground Level Height Requirement (meters)
Horizontal Collocation Requirement (meters)
Vertical Collocation Requirement (meters)
TSP, Metals 2-7 2-4 ≤ 3
PM10, Metals 2-7 1-4 ≤ 3
PM2.5, Metals 2-7 1-4 ≤ 3
Asbestos 2-7 1-4 ≤ 3
PCBs 2-7 2-4 ≤ 3
Formaldehyde 2-7 0-4 ≤ 3
TOS 2-7 0-4 ≤ 3

Air Monitoring Summary Report SA Recycling – Terminal Island
Geocon Project No. S9850-03-21 - 6 - December 23, 2016
Additionally, inlets were greater than 2 meters (m) away from supporting structures (like walls,
parapets, or penthouses), greater than 10 m from trees, and between 2 and 10 m from roadways. Inlets
also had unrestricted airflow and were located away from obstacles so that the distance from the
obstacle to the inlet was at least twice the height that the obstacle protruded above the inlet.
3.4 Calibration and Leak Check Testing
The TSP, PM10, PM2.5, asbestos, PCB, and formaldehyde sampling equipment was calibrated onsite on
October 11, 2016. Calibration and leak check activities were performed once the equipment was set up
at a sampling location and prior to its first use. Calibration and leak check procedures were performed
in accordance with the calibration schedule in Table 3 of the SAP. A copy of the field log, which
contains additional information about the calibration and leak check testing, is in Appendix B.
3.4.1 TSP Calibration
Calibration included attaching a calibrated orifice and water manometer to each sampler, operating
each device with the orifice at five positions that varied the flow rate into the sampler, and recording
the measurements of the water manometer for each position directly into the TE-5170V Sampler Calibration Worksheet (Appendix C). Leak checks were performed by covering the top of the orifice
and listening for a high-pitched squeal. The calculated flow rates and total flows for the TSP sampling
equipment are in Table T3.4.1:
Table T3.4.1 – TSP Sampler Flow Rates and Total Flows
Sample Location Calculated TSP Flow Rate (m3/min)
Calculated TSP Total Flow1 (m3)
SARTI1 1.220 1,756.22
SARTI2 1.218 1,754.32
SARTI3 1.217 1,752.07
SARTI4 1.220 1,756.22
SARTI5 1.207 1,738.30
Notes: m3/min = cubic meters per minute m3 = cubic meters No leaks were identified and observed flow rates were acceptable to achieve the desired reporting
limits for a 24-hour sample specified in the SAP (Geocon, 2016).
3.4.2 PM10 and PM2.5 Calibration Activities
Calibration included measuring temperature and pressure using calibrated temperature and barometric
pressure devices, and entering the measurements into the samplers at the appropriate calibration input
screen. Flows were calibrated by placing a calibrated flow standard on the intake of the sampler and
running the flow calibration program for the sampler. External leak checks were performed by

Air Monitoring Summary Report SA Recycling – Terminal Island
Geocon Project No. S9850-03-21 - 7 - December 23, 2016
installing a closed flow rate adapter to the sample inlet and running the leak check program on the
sampler. Internal leak checks were performed by installing internal leak check disks into the samplers
and running the internal leak check program on the sampler. The calibration results for the PM10 and
PM2.5 sampling equipment were recorded in Geocon’s field log (Appendix B) and on the PM10 and
PM2.5 alarm logs on each unit (Appendices D and E, respectively). The calculated flow rates for the
PM10 and PM2.5 sampling equipment are provided in Table T3.4.2:
Table T3.4.2 – PM10 and PM2.5 Sampler Flow Rates
Sample Location Analyte Calculated Flow Rate (m3/min)
SARTI1 PM10 16.671
PM2.5 16.671
SARTI2 PM10 16.671
PM2.5 16.681
SARTI3 PM10 16.681
PM2.5 16.671
SARTI4 PM10 16.671
PM2.5 16.671
SARTI5 PM10 16.671
PM2.5 16.671
No leaks were identified and observed flow rates were acceptable to achieve the desired reporting
limits for a 24-hour sample specified in the SAP (Geocon, 2016).
3.4.3 PCB Calibration Activities
Calibration included attaching a calibrated orifice and water manometer to each sampler, operating
each device with the orifice at five positions that varied the flow rate into the sampler, and recording
the measurements of the water manometer for each position directly into the TE-1000 PUF Calibration Worksheet (Appendix F). The calculated flow rates and total flows for the PCB sampling equipment
are in Table T3.4.3.
Table T3.4.3 – PCB Sampler Flow Rates and Total Flows
Sample Location Calculated PCB Flow Rate (m3/min) Calculated PCB Total Flow1 (m3)
SARTI1 0.262 378.8
SARTI2 0.270 389.5
SARTI3 0.259 373.3
SARTI4 0.264 379.5
SARTI5 0.264 381.1

Air Monitoring Summary Report SA Recycling – Terminal Island
Geocon Project No. S9850-03-21 - 8 - December 23, 2016
The observed flow rates were acceptable to achieve the desired reporting limits for a 24-hour sample
specified in the SAP (Geocon, 2016).
3.4.4 Formaldehyde and Asbestos Calibration Activities
The formaldehyde and asbestos sampling equipment were calibrated on October 11, 2016. Information
from the calibration was recorded in Geocon’s field notes (Appendix B). Calibration included attaching
a calibrated rotometer to each sampler, operating each device and adjusting the flow rates of the
formaldehyde and asbestos samplers to 2.0 and 1.0 liters per minute (lpm), respectively. The observed
flow rates were acceptable to achieve the desired reporting limits for a 24-hour sample specified in the
SAP (Geocon, 2016).
3.5 Air Sampling Description
The three 24-hour monitoring events (T1, T2, and T3) were performed between
October 11 and 14, 2016. The following sub-sections summarize the activities performed during each
event and describe the facility operations during each event.
3.5.1 First Monitoring Event (T1)
After calibrating and installing the appropriate sample media in each sampling device, Geocon staff
began the first 24-hour monitoring event by turning on the sampling equipment for SARTI1 at 1430 on
October 11, 2016. Minutes later, Geocon staff turned on sampling equipment at locations at SARTI4,
SARTI2, and SARTI3 at 1505, 1515, and 1525, respectively. Geocon staff checked on the status of the
sampling equipment after approximately 6 and 18 hours of runtime. After 24 hours, Geocon staff ended
T1 by turning off the sampling equipment at each location, and retrieved and stored the sample media.
No field-based QC parameters were performed during T1.
SARTI staff’s activity log (Appendix G) summarizes receiving, processing, shipping and dust control
procedures for each day of the week of October 10, 2016. For the facility processes, an average of the hours
listed for October 11 and 12, 2016 was assumed because the monitoring event took place across both days.
Approximately 4.5 hours of metals shredding occurred during T1. The MRP operated approximately
8.8 hours while shearing, torch cutting, and welding/fabrication occurred for approximately 9.5, 2.3, and
15.5 hours each, respectively. An average of 106.5 trucks unloaded material on the Site and 7.5 trucks and
containers were loaded and hauled offsite. Three open-topped rail cars were unloaded but no rail cars were
moved nor train engines operated during T1. Two different types of sweepers were operated including a
Tymco sweeper, which is used to clean the street leading up to the main gate of and the haul roads around
the scales and warehouse, and the manual sweeper is used around the shredder, MRP, and piles. The Tymco
and manual sweepers operated for approximately 10 and 2 hours, respectively, and water trucks sprayed
water across the ground surface for approximately 11.5 hours.
Air Monitoring Summary Report SA Recycling – Terminal Island
Geocon Project No. S9850-03-21 - 9 - December 23, 2016
3.5.2 Second Monitoring Event (T2)
At the completion of T1, Geocon staff replaced the sample media in each of the pumps, then began the
next 24-hour monitoring event as soon as practicable. The process of finishing T1 and beginning T2
took approximately 2 hours. T2 began by turning on the sampling equipment for SARTI1, SARTI4,
SARTI3, and SARTI2/SARTI5 at 1630, 1645, 1700 and 1715, respectively.
Geocon staff checked on the status of the sampling equipment after approximately 5.5 and 18 hours of
runtime. Sometime between the 5.5- and 18-hour system check the TSP sampler at SARTI2, PCB
sampler at SARTI3, and the asbestos pump at SARTI5 stopped working. Based on the hour meters on
the TSP and PCB samplers, the systems were not operating between for 12.32 and 8.68 hours during
T2, respectively. Because there were no hour meters on the asbestos pumps, the sampler at SARTI5 is
assumed to have been down from immediately after the 5.5-hour system check during T2. The TSP and
PCB samplers were shut down due to mechanical issues with their mechanical timers and the asbestos
sampler was shut down because of a faulty battery and battery charger. Geocon staff repaired the
equipment and resumed collecting samples by 1200 on October 13, 2016. No other equipment issues
were noted during T2.
After 24 hours, Geocon staff ended T2 by turning off the sampling equipment at each location, and
retrieving and storing the sample media.
Field-based QC parameters performed during T2 included collection of collocated samples and field
blanks. Collocated samples, also referred to as duplicate samples for air sampling, were collected and
analyzed to check for sampling and analysis error, reproducibility, and homogeneity. Collocated
samples SARTI2 (primary sample) and SARTI5 (duplicate sample) were obtained from two identically
configured sampler sets operating simultaneously in one location. Field blanks were collected and
analyzed to assess the possible contamination of samples before, during, and after sample collection.
Each field blank consisted of a clean filter that was placed onto the air sampler and then taken off
without running the sampler. Geocon staff collected a field blank sample from location SARTI1 in
between T1 and T2.
For the facility processes, an average of the hours listed for October 12 and 13, 2016 was assumed
because the sampling took place across both days. Approximately 3.8 hours of metals shredding
occurred during T2. The MRP operated approximately 8.4 hours while shearing, torch cutting, and
welding/fabrication occurred for approximately 9, 2.5, and 16.5 hours each, respectively. An average
of 79.5 trucks unloaded material on the Site and 10 trucks and containers were loaded and hauled
offsite. No rail cars were loaded or moved and no train engines operated during T2. Dust controls
performed at the Site during T2 included 13 hours of watering the ground surface and 2 hours of
sweeping and 10 hours of Tymco sweeping.
Air Monitoring Summary Report SA Recycling – Terminal Island
Geocon Project No. S9850-03-21 - 10 - December 23, 2016
3.5.3 Third Monitoring Event (T3)
At the completion of T2, Geocon staff replaced the sample media in each of the pumps, then began the
next 24-hour monitoring event as soon as practicable. The process of finishing T2 and beginning T3
took approximately 2 hours. T3 began by turning on the sampling equipment for SARTI3,
SARTI2/SARTI5, SARTI4, and SARTI1 at 1910, 1915, 1922 and 1930, respectively.
Geocon staff checked on the status of the sampling equipment after approximately 13.5 hours of
runtime. During the sampling equipment check, Geocon staff noticed that the 6-liter Summa canister
collecting sample SARTI1-T3-TOS was sampling at a faster than anticipated rate. At 1230 and after a
sampling duration of 17 hours, collection of sample SARTI1-T3-TOS was stopped. No replacement
canister was available to collect a sample during the remaining 7 hours. No other equipment issues
were noted during T3.
After 24 hours, Geocon staff ended T3 by turning off the sampling equipment at each location, and
retrieved and stored the sample media.
Field-based QC parameters performed during T3 included collection of collocated samples, field
blanks and filter blanks. Collocated samples SARTI2 (primary sample) and SARTI5 (duplicate sample)
were obtained from two identically configured sampler sets operating simultaneously in one location.
Geocon staff collected a field blank sample from location SARTI4 in between T2 and T3. Filter blanks
(sometimes referred to as trip blanks for air sampling) were collected and analyzed to assess the
contamination of samples from the native presence of target analytes in the filters used for air sample
collection. Each filter blank consisted of a clean filter that was transported with the associated primary
samples, but was not taken out of its protective sleeve. One filter blank was collected after T3.
For the other facility processes, an average of the hours listed for October 13 and 14, 2016 was
assumed because the monitoring event took place across both days. Approximately 3.8 hours of metals
shredding occurred during T3. The MRP operated approximately 4.3 hours while shearing, torch
cutting, and welding/fabrication occurred for approximately 10.3, 0.6, and 11 hours each, respectively.
An average of 84 trucks unloaded material on the Site and 10 trucks and containers were loaded and
hauled offsite. No rail cars were loaded or moved and no train engines operated during T3. Dust
controls performed at the Site during T3 included 13.5 hours of watering the ground surface and 7.5
hours of sweeping and 10 hours of Tymco sweeping.
3.6 Meteorological Conditions
A Davis Vantage Pro2 weather monitoring station recorded site-specific data for wind direction, speed,
temperature, relative humidity, and pressure during the three monitoring events. Weatherlink®
software and a data logger allowed monitoring and downloading of the site-specific data. The location

Air Monitoring Summary Report SA Recycling – Terminal Island
Geocon Project No. S9850-03-21 - 11 - December 23, 2016
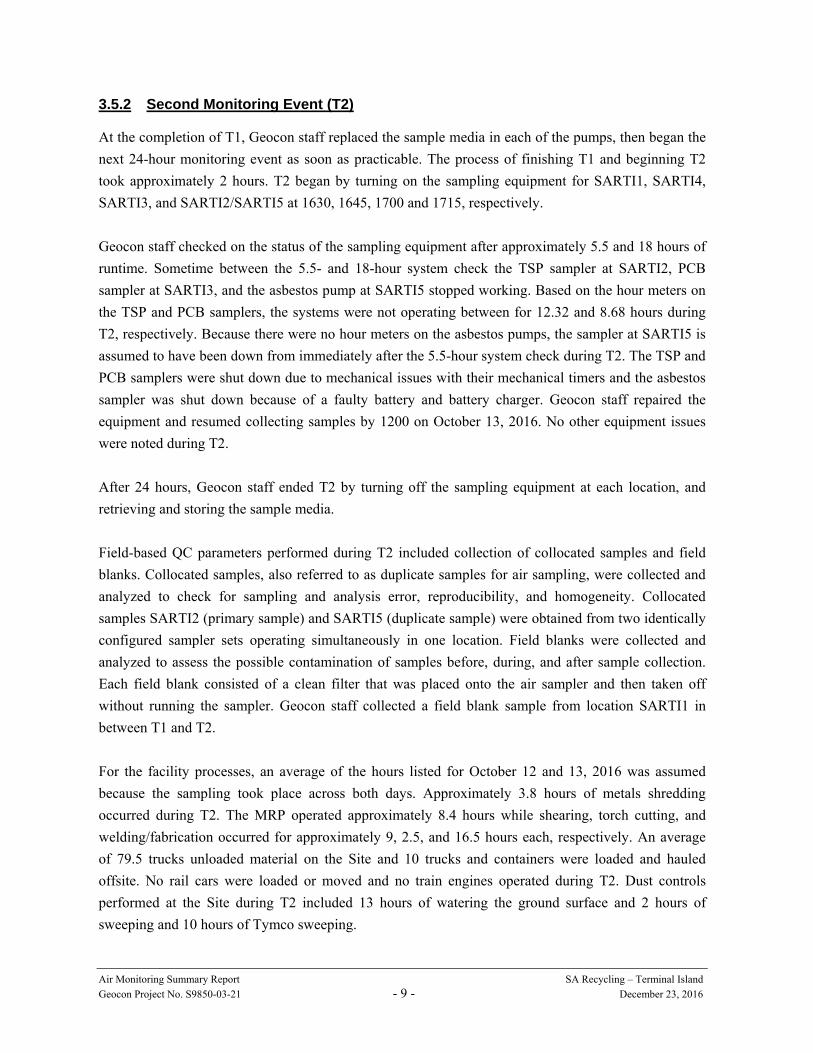
of the weather station during the monitoring events is shown on the Site Plan, Figure 2. The
meteorological data is in Appendix G.
3.7 Packaging and Shipping
Geocon staff shipped the asbestos and TOS samples via 2-day shipping under standard
chain-of-custody (COC) to EMSL on October 15, 2016. Geocon staff shipped the TSP, PM10, and
PM2.5 samples via overnight delivery under standard COC to CLN on October 15, 2016. Geocon staff
delivered the PCB and formaldehyde samples to ECS under standard COC on October 15, 2016. ECS
then transported the formaldehyde samples to EAT, which received them on October 19, 2016.
The following summarizes the sample packaging procedures used for the proposed investigation:
Sample and QA/QC containers were placed into re-sealable plastic storage bags that were put into the sample coolers. Blue ice bags were packed on top and around the samples to maintain an appropriate temperature in the cooler.
Empty space in sample coolers was filled with bubble wrap to prevent sample containers from shifting during transportation to the laboratory.
The appropriate COC(s) associated with the sample cooler were double-bagged in re-sealable plastic bags and placed inside the cooler.
3.8 Laboratory Analysis
CLN analyzed the samples for the following:
TSP - 40 CFR Part 50, Appendix B to Part 50 Reference Method for the Determination of Suspended Particulate Matter in the Atmosphere (USEPA, 1998);
PM10 - 40 CFR Part 50, Appendix J to Part 50 Reference Method for the Determination of Particulate Matter as PM10 in the Atmosphere (USEPA, 1998), 40 CFR Part 50, Appendix L to Part 50 Reference Method for the Determination of Particulate Matter as PM2.5 in the Atmosphere (USEPA, 1998) and Quality Assurance Guidance Document 2.12 – Monitoring PM2.5 in Ambient Air Using Designated Reference or Class I Equivalent Methods (USEPA, 2016);
PM2.5 - 40 CFR Part 50, Appendix L to Part 50 Reference Method for the Determination of Particulate Matter as PM2.5 in the Atmosphere (USEPA, 1998) and Quality Assurance Guidance Document 2.12 – Monitoring PM2.5 in Ambient Air Using Designated Reference or Class I Equivalent Methods (USEPA, 2016);
EMSL analyzed the samples for the following:
Asbestos – Asbestos Hazard Emergency Response Act (AHERA)-modified transmission electron microscopy (TEM) as found in 40 CFR part 763 Appendix A Subpart E (USEPA, 1987);
VOCs - USEPA method TO-15 (USEPA, 1999c).
Air Monitoring Summary Report SA Recycling – Terminal Island
Geocon Project No. S9850-03-21 - 12 - December 23, 2016
ECS and EAT respectively analyzed the samples for the following:
PCBs – USEPA method TO-4A (USEPA, 1999a).
Formaldehyde – USEPA method TO-11A (USEPA, 1999b).
3.9 Variance from SAP
Sample location SARTI4 was relocated approximately 50 feet southwest from the location proposed in
the SAP. The Site Plan (Figure 2) shows the modified sampling location for SARTI4. Changing the
sampling location allowed for the sampling equipment to be powered by onsite electrical outlets and
avoided the need to use scissor lifts to elevate the samples due to stacked trailers at the originally
proposed location. DTSC staff approved of this modification in an e-mail dated October 10, 2016.
As described in Section 3.5.2, Geocon staff checked on the status of the sampling equipment after
approximately 5.5 and 18 hours of runtime during T2. Sometime between the 5.5 and 18 hours system
checks, the TSP sampler at SARTI2, PCB sampler at SARTI3, and the asbestos pump at SARTI5
stopped working. Based upon the hour meters on the TSP and PCB samplers, the systems were not
operating between for 12.32 and 8.68 hours during T2, respectively. Because there were no hour
meters on the asbestos pumps, the sampler at SARTI5 is assumed to have been down from immediately
after the 5.5-hour system check during T2. The TSP and PCB samplers were shut down due to
mechanical issues with their mechanical timers and the asbestos sampler was shut down because of a
faulty battery and battery charger. Geocon staff repaired the equipment and resumed collecting samples
by 1200 on October 13, 2016. Because collocated sampling was being performed at SARTI2 and
SARTI5 during T2, representative 24-hour samples from the collected samplers (SARTI5 for TSP and
SARTI2 for asbestos) were collected. SARTI3 was not a collocated sampling location and therefore the
PCB concentrations should be qualified being representative of a 15-hour sampling duration and is not
representative of overnight and early morning (midnight to 10 AM) conditions.
As described in Section 3.5.3, the 6-liter Summa canister collecting sample SARTI1-T3-TOS was
observed sampling at a rate that was faster than anticipated. As a result, collection of this sample
stopped after a sampling duration of 17 hours when the canister only had 3 inches of mercury vacuum
remaining. SARTI1 was not a collocated sampling location and therefore the TOS concentrations
should be qualified being representative of a 17-hour sampling duration and is not representative of
afternoon to early evening (1230 to 1930) conditions.
Data from SARTI’s onsite weather station is used to represent the meteorological conditions at the Site
instead of Geocon’s weather station.

Air Monitoring Summary Report SA Recycling – Terminal Island
Geocon Project No. S9850-03-21 - 13 - December 23, 2016
4.0 RESULTS
This section presents the laboratory analytical results for samples collected during the three monitoring
events and an evaluation of the quality of the data reported by the laboratory.
4.1 Analytical Results
The results of the gravimetric and metals analyses for the TSP, PM10, and PM2.5 samples are shown in
Tables 1 through 3, respectively. The results of the analyses for asbestos, PCBs, formaldehyde, and
TOS samples are shown in Tables 4 through 7, respectively. Copies of the analytical reports are in
Appendix H.
Following are our observations with respect to the analytical results:
4.1.1 TSP
The greatest TSP concentrations were detected in samples from SARTI4, followed by SARTI1, SARTI2, and SARTI3. Potential reasons for SARTI4 having the greatest concentrations are that the sample location was the closest of the four sample locations to stockpile material, was downwind (when the wind was from the northwest) of the both stockpiled materials and metal shredder, and was in a relatively dirtier and dustier area of the Site.
Comparing the results from each of the three monitoring events, the greatest TSP concentrations were detected in samples collected during monitoring event T3, followed by T2, and T1. Worth noting is that of the three days monitored, T3 coincided with the slowest average wind speed, the shortest duration of metal shredding, MRP production, torching, welding/fabrication, and manual sweeping, and the longest durations of shearing and watering the ground surface. T1 coincided with the fastest average wind speed, the longest duration of metal shredding, MRP production, and the shortest duration of manual sweeping. One possible explanation for why the greatest TSP concentrations were during T3 is that there was more material being stored onsite compared to T1. Because the facility was in the process of accruing material to load another freighter ship, the amount of material at the Site increased each day.
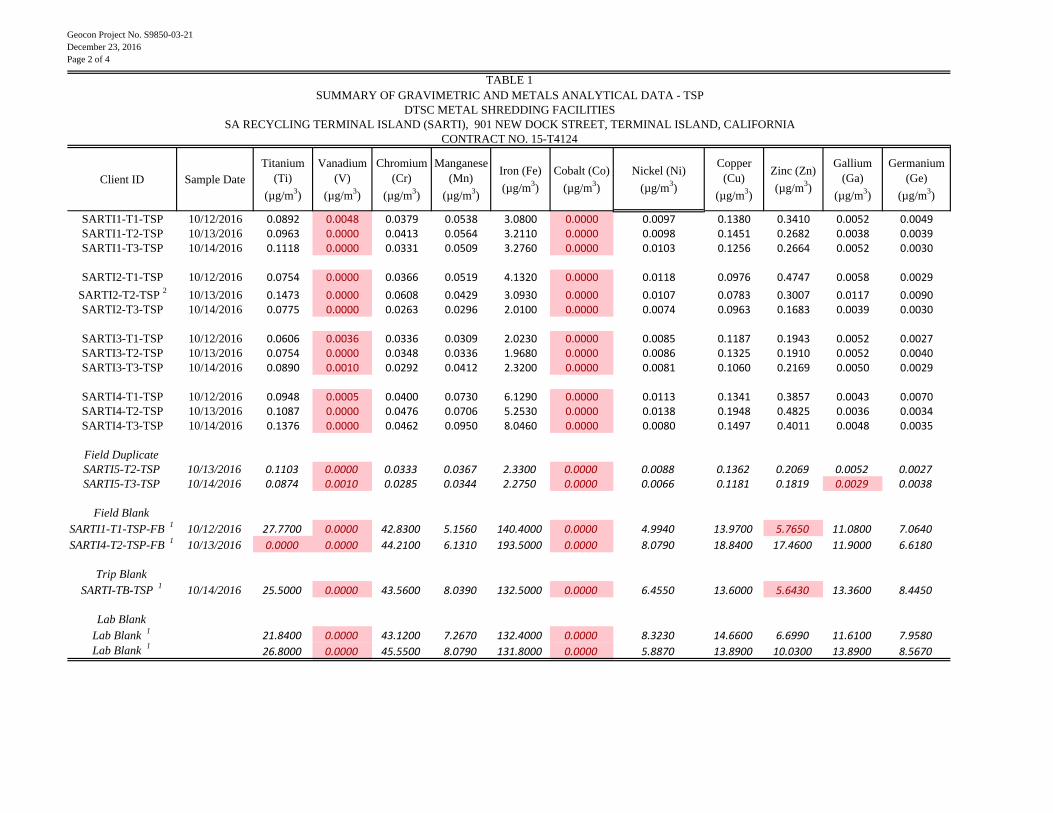
The TSP metals with the highest concentrations were iron at 8.046 micrograms per cubic meter (µg/m3), calcium at 5.951 µg/m3, sulfur at 2.224 µg/m3, aluminum at 0.7887 µg/m3, and potassium at 0.7630 µg/m3.
4.1.2 PM10
The greatest PM10 concentrations were detected in samples from SARTI4, followed by SARTI1, SARTI2, and SARTI3.
Comparing the results from each of the three monitoring events, the greatest PM10 concentrations were detected in samples collecting during monitoring event T3, followed by T2, and T1.
Air Monitoring Summary Report SA Recycling – Terminal Island
Geocon Project No. S9850-03-21 - 14 - December 23, 2016
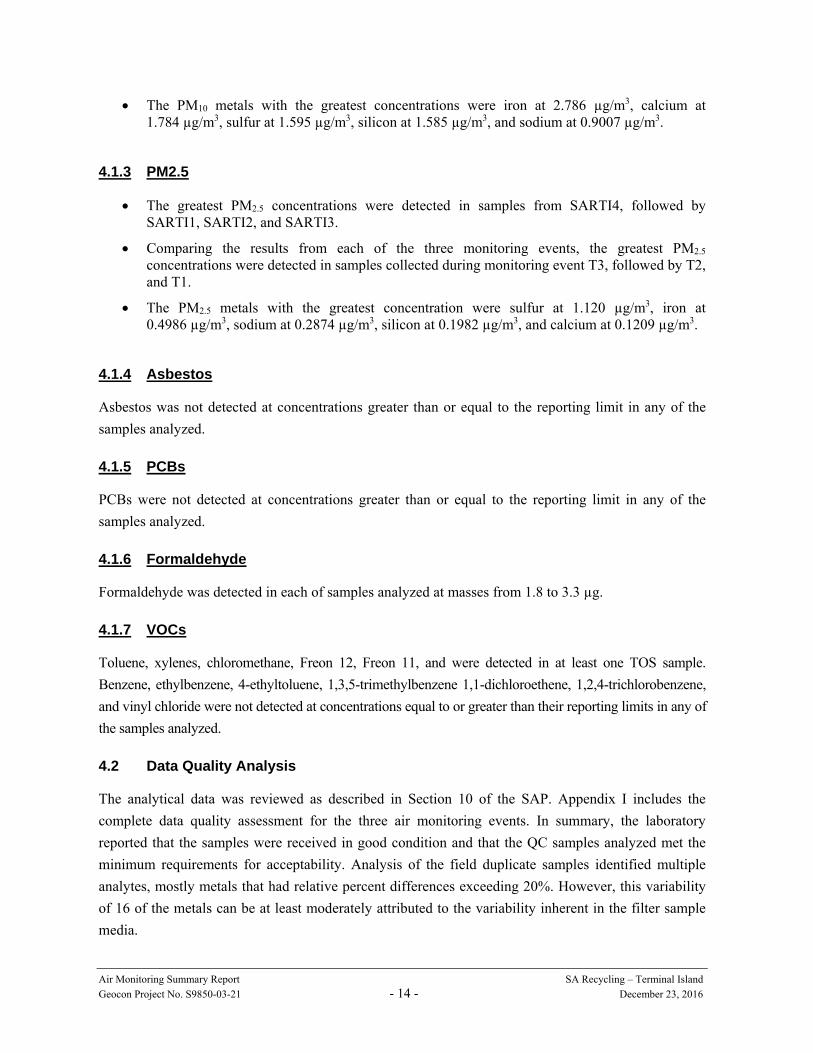
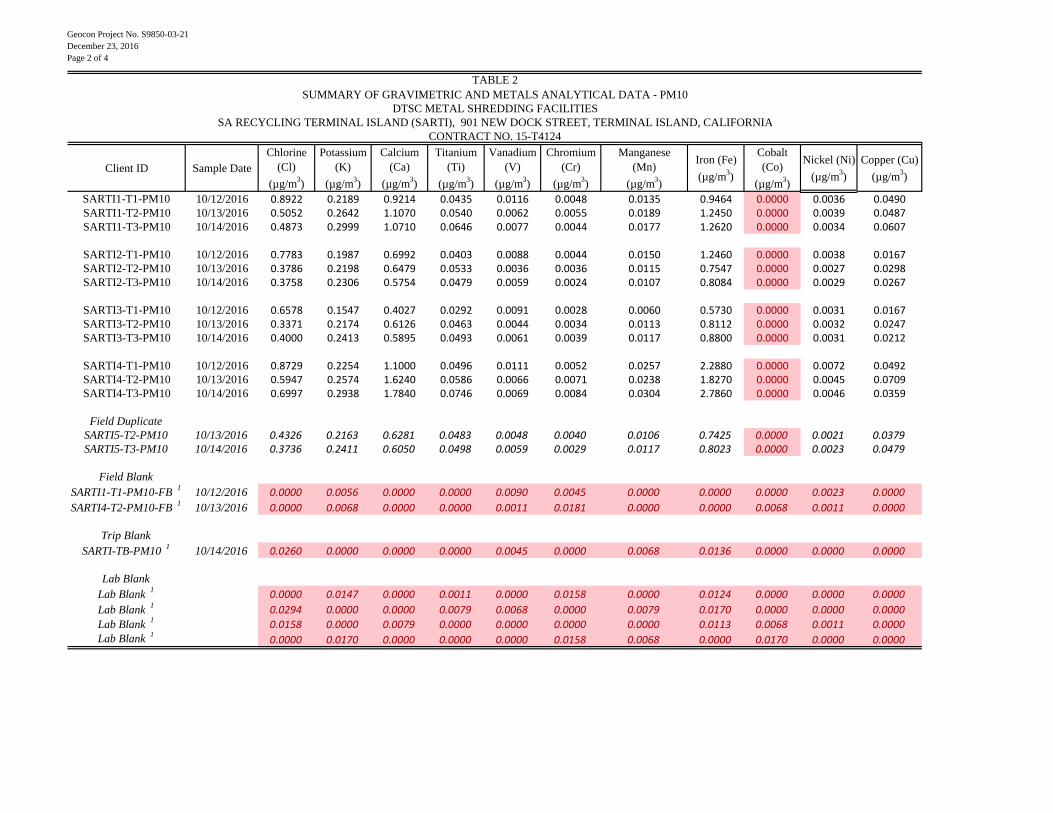
The PM10 metals with the greatest concentrations were iron at 2.786 µg/m3, calcium at 1.784 µg/m3, sulfur at 1.595 µg/m3, silicon at 1.585 µg/m3, and sodium at 0.9007 µg/m3.
4.1.3 PM2.5
The greatest PM2.5 concentrations were detected in samples from SARTI4, followed by SARTI1, SARTI2, and SARTI3.
Comparing the results from each of the three monitoring events, the greatest PM2.5 concentrations were detected in samples collected during monitoring event T3, followed by T2, and T1.
The PM2.5 metals with the greatest concentration were sulfur at 1.120 µg/m3, iron at 0.4986 µg/m3, sodium at 0.2874 µg/m3, silicon at 0.1982 µg/m3, and calcium at 0.1209 µg/m3.
4.1.4 Asbestos
Asbestos was not detected at concentrations greater than or equal to the reporting limit in any of the
samples analyzed.
4.1.5 PCBs
PCBs were not detected at concentrations greater than or equal to the reporting limit in any of the
samples analyzed.
4.1.6 Formaldehyde
Formaldehyde was detected in each of samples analyzed at masses from 1.8 to 3.3 µg.
4.1.7 VOCs
Toluene, xylenes, chloromethane, Freon 12, Freon 11, and were detected in at least one TOS sample.
Benzene, ethylbenzene, 4-ethyltoluene, 1,3,5-trimethylbenzene 1,1-dichloroethene, 1,2,4-trichlorobenzene,
and vinyl chloride were not detected at concentrations equal to or greater than their reporting limits in any of
the samples analyzed.
4.2 Data Quality Analysis
The analytical data was reviewed as described in Section 10 of the SAP. Appendix I includes the
complete data quality assessment for the three air monitoring events. In summary, the laboratory
reported that the samples were received in good condition and that the QC samples analyzed met the
minimum requirements for acceptability. Analysis of the field duplicate samples identified multiple
analytes, mostly metals that had relative percent differences exceeding 20%. However, this variability
of 16 of the metals can be at least moderately attributed to the variability inherent in the filter sample
media.
Air Monitoring Summary Report SA Recycling – Terminal Island
Geocon Project No. S9850-03-21 - 15 - December 23, 2016
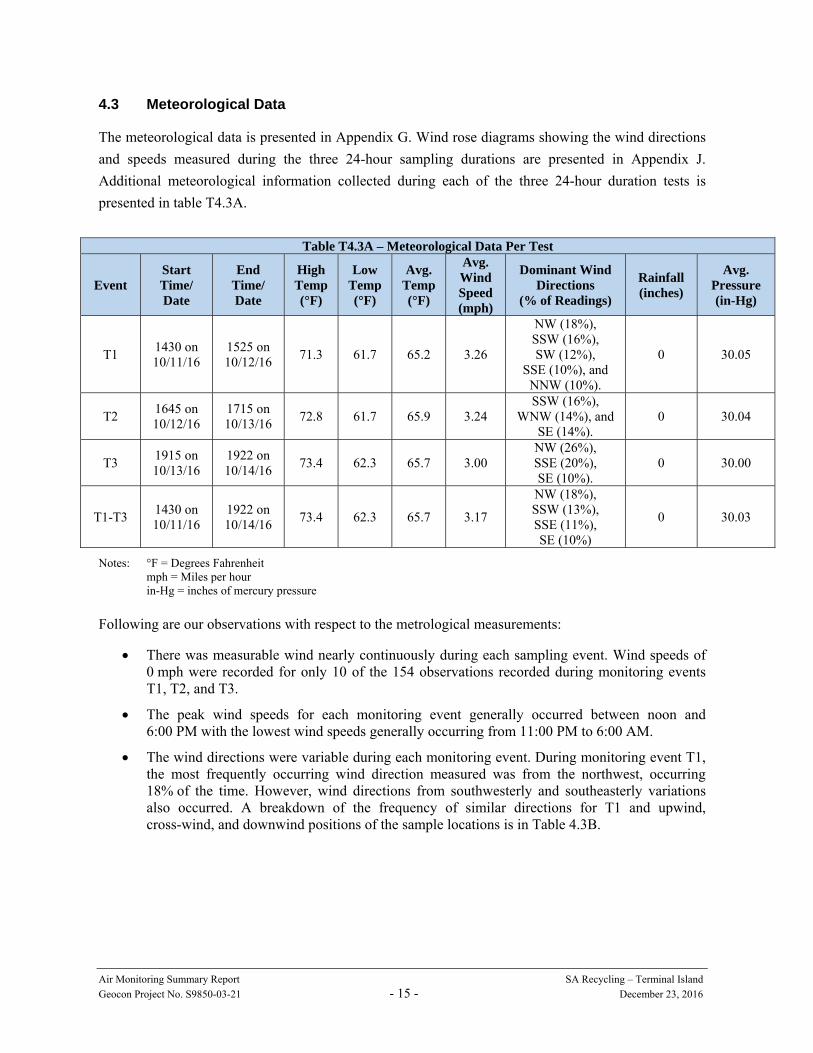
4.3 Meteorological Data
The meteorological data is presented in Appendix G. Wind rose diagrams showing the wind directions
and speeds measured during the three 24-hour sampling durations are presented in Appendix J.
Additional meteorological information collected during each of the three 24-hour duration tests is
presented in table T4.3A.
Table T4.3A – Meteorological Data Per Test
Event Start Time/ Date
End Time/ Date
High Temp (°F)
Low Temp (°F)
Avg. Temp (°F)
Avg. Wind Speed (mph)
Dominant Wind Directions
(% of Readings)
Rainfall (inches)
Avg. Pressure (in-Hg)
T1 1430 on 10/11/16
1525 on 10/12/16
71.3 61.7 65.2 3.26
NW (18%), SSW (16%), SW (12%),
SSE (10%), and NNW (10%).
0 30.05
T2 1645 on 10/12/16
1715 on 10/13/16
72.8 61.7 65.9 3.24 SSW (16%),
WNW (14%), and SE (14%).
0 30.04
T3 1915 on 10/13/16
1922 on 10/14/16
73.4 62.3 65.7 3.00 NW (26%), SSE (20%), SE (10%).
0 30.00
T1-T3 1430 on 10/11/16
1922 on 10/14/16
73.4 62.3 65.7 3.17
NW (18%), SSW (13%), SSE (11%), SE (10%)
0 30.03
Notes: °F = Degrees Fahrenheit mph = Miles per hour in-Hg = inches of mercury pressure
Following are our observations with respect to the metrological measurements:
There was measurable wind nearly continuously during each sampling event. Wind speeds of 0 mph were recorded for only 10 of the 154 observations recorded during monitoring events T1, T2, and T3.
The peak wind speeds for each monitoring event generally occurred between noon and 6:00 PM with the lowest wind speeds generally occurring from 11:00 PM to 6:00 AM.
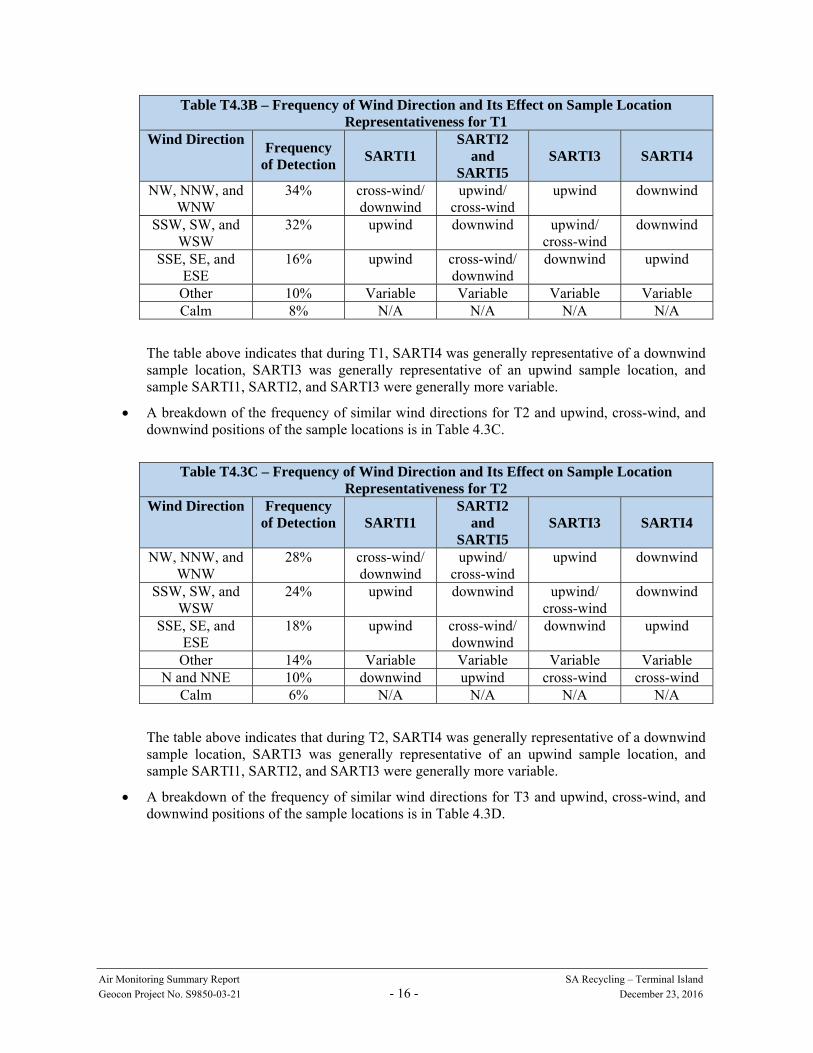
The wind directions were variable during each monitoring event. During monitoring event T1, the most frequently occurring wind direction measured was from the northwest, occurring 18% of the time. However, wind directions from southwesterly and southeasterly variations also occurred. A breakdown of the frequency of similar directions for T1 and upwind, cross-wind, and downwind positions of the sample locations is in Table 4.3B.
Air Monitoring Summary Report SA Recycling – Terminal Island
Geocon Project No. S9850-03-21 - 16 - December 23, 2016
Table T4.3B – Frequency of Wind Direction and Its Effect on Sample Location Representativeness for T1
Wind Direction Frequency of Detection SARTI1
SARTI2 and
SARTI5 SARTI3 SARTI4
NW, NNW, and WNW
34% cross-wind/ downwind
upwind/ cross-wind
upwind downwind
SSW, SW, and WSW
32% upwind downwind upwind/ cross-wind
downwind
SSE, SE, and ESE
16% upwind cross-wind/ downwind
downwind upwind
Other 10% Variable Variable Variable Variable Calm 8% N/A N/A N/A N/A
The table above indicates that during T1, SARTI4 was generally representative of a downwind sample location, SARTI3 was generally representative of an upwind sample location, and sample SARTI1, SARTI2, and SARTI3 were generally more variable.
A breakdown of the frequency of similar wind directions for T2 and upwind, cross-wind, and downwind positions of the sample locations is in Table 4.3C.
Table T4.3C – Frequency of Wind Direction and Its Effect on Sample Location Representativeness for T2
Wind Direction Frequency of Detection SARTI1
SARTI2 and
SARTI5 SARTI3 SARTI4
NW, NNW, and WNW
28% cross-wind/ downwind
upwind/ cross-wind
upwind downwind
SSW, SW, and WSW
24% upwind downwind upwind/ cross-wind
downwind
SSE, SE, and ESE
18% upwind cross-wind/ downwind
downwind upwind
Other 14% Variable Variable Variable Variable N and NNE 10% downwind upwind cross-wind cross-wind
Calm 6% N/A N/A N/A N/A
The table above indicates that during T2, SARTI4 was generally representative of a downwind sample location, SARTI3 was generally representative of an upwind sample location, and sample SARTI1, SARTI2, and SARTI3 were generally more variable.
A breakdown of the frequency of similar wind directions for T3 and upwind, cross-wind, and downwind positions of the sample locations is in Table 4.3D.

Air Monitoring Summary Report SA Recycling – Terminal Island
Geocon Project No. S9850-03-21 - 17 - December 23, 2016
Table T4.3D – Frequency of Wind Direction and Its Effect on Sample Location Representativeness for T3
Wind Direction Frequency of Detection SARTI1
SARTI2 and
SARTI5 SARTI3 SARTI4
S, SSE, and SE 39% upwind cross-wind/ downwind
downwind upwind
NW, NNW, and WNW
31% cross-wind/ downwind
upwind/ cross-wind
upwind downwind
Calm 10% N/A N/A N/A N/A SSW, SW, and
WSW 8% upwind downwind upwind/
cross-wind downwind
N and NNE 8% downwind upwind cross-wind cross-wind Other 4% Variable Variable Variable Variable
The table above indicates that during T3, SARTI2 and SARTI5 were generally representative of a cross-wind sample location, but that SARTI1, SARTI3, and SARTI4 were generally variable.

Air Monitoring Summary Report SA Recycling – Terminal Island
Geocon Project No. S9850-03-21 - 18 - December 23, 2016
5.0 REPORT LIMITATIONS
This report was prepared for the DTSC. Geocon-authorized users of this report are limited to the
DTSC. Individuals or organizations deemed appropriate by the DTSC (including, but not necessarily
limited to other regulatory agencies, prospective real estate brokers and buyers of all or parts of the Site
and their counsel, and/or prospective lending institutions) may utilize the Report for informational
purposes only.
Users of this report should understand that this monitoring event was not a comprehensive
characterization of the Site. Air monitoring was limited to assessing the concentrations of the specified
contaminants of potential concern (COPC) for this project with respect to the specific areas of potential
concern identified in this report.
Geocon does not guarantee or warranty, either express or implied, that there is no environmental,
health, or financial risk associated with the specific areas identified in this report, other areas of the
Site, or the Site as a whole. Users of this report must evaluate the risk of reliance upon the information
herein and assume that risk (if any). Geocon is not responsible for unfavorable results due to reliance
on information provided in this report.
Information herein with respect to the condition of the specific areas associated with this project is
valid only as of the dates of our field activities. Changes in site conditions not brought to our attention
between or subsequent to those dates (if any) could result in the need for additional characterization
investigation and/or mitigation activities.
Information in this report is based on our site observations, analytical results and associated QC data
reported for the air samples. Geocon does not certify or guarantee that the information obtained and
reported by others is accurate or suitable for the intended purpose.
The authors of this report declare that, to the best of their knowledge, the information provided herein
is truthful and accurate, notwithstanding unknown incidental errors or omissions that would not
materially impact or change results of this project or our conclusions. Geocon strived to conduct
activities for this project in accordance with the standard level of care in the local geographic area at
the time the activities were rendered.
Air Monitoring Summary Report SA Recycling – Terminal Island
Geocon Project No. S9850-03-21 - 19 - December 23, 2016
6.0 REFERENCES
Senate Bill 1249, 2013-2014. Ch. 756, 2014 California. http://leginfo.legislature.ca.gov/faces/billNavClient.xhtml?bill_id=201320140SB1249
Geocon Consultants, Inc., Sampling And Analysis Plan -Air Monitoring At Various Metal Shredding Facilities Statewide: Sims Metal Management 699 Seaport Blvd, Redwood City CA, 94063-2712, SA Recycling – Bakersfield, 2000 E. Brundage Lane, Bakersfield, CA 93307-2734, SA Recycling – Terminal Island, 901 New Dock Street, Terminal Island, CA 90731, September 30, 2016.
Iowa Environmental Mesonet Database, http://mesonet.agron.iastate.edu/
Port of Los Angeles webpage, https://www.portoflosangeles.org/pdf/POLA_Cargo_Terminals_Map.pdf
SA Recycling Terminal Island webpage, http://www.sarecycling.com/yard/CA-Los-Angeles-901-New-Dock-Street/
Stevenson, Eric. August 22, 2016. Personal interview
Tisch Environmental, Operations Manual TE-5170V Volumetric Flow Controlled Total Suspended Particulate High-Volume Air Sampler,
Tisch Environmental, TE-Wilbur Operations Manual, Revised January 2016
Tisch Environmental, TE-1000 PUF Polyurethane Foam High-Volume Air Sampler Operations Manual
United States Environmental Protection Agency, 40 CFR Part 50, Appendix B to Part 50 Reference Method for the Determination of Suspended Particulate Matter in the Atmosphere, 1998.
United States Environmental Protection Agency, 40 CFR Appendix E to Part 58 - Probe and Monitoring Path Siting Criteria for Ambient Air Quality Monitoring, 2015.
United States Environmental Protection Agency, 40 CFR Part 50, Appendix J to Part 50 Reference Method for the Determination of Particulate Matter as PM10 in the Atmosphere, 1998.
United States Environmental Protection Agency, 40 CFR Part 50, Appendix L to Part 50 Reference Method for the Determination of Particulate Matter as PM2.5 in the Atmosphere, 1998.
United States Environmental Protection Agency, Quality Assurance Guidance Document 2.12 – Monitoring PM2.5 in Ambient Air Using Designated Reference or Class I Equivalent Methods, 2016.
United States Environmental Protection Agency, Compendium of Methods for the Determination of Toxic Organic Compounds in Ambient Air Second Edition: Compendium Method TO-15 - Determination of Volatile Organic Compounds (VOCs) in Air Collected in Specially-Prepared Canisters and Analyzed By Gas Chromatography/Mass Spectrometry, January, 1999.
United States Environmental Protection Agency, Compendium of Methods for the Determination of Toxic Organic Compounds in Ambient Air Second Edition: Compendium Method TO-11A - Determination of Formaldehyde in Ambient Air Using Adsorbent Cartridge Followed by High Performance Liquid Chromatography (HPLC) [Active Sampling Methodology], January, 1999.
United States Environmental Protection Agency, Compendium of Methods for the Determination of Toxic Organic Compounds in Ambient Air Second Edition: Compendium Method TO-4A - Determination of Pesticides and Polychlorinated Biphenyls in Ambient Air Using High Volume Polyurethane Foam (PUF) Sampling Followed by Gas Chromatographic/Multi-Detector Detection, January, 1999.
Western Regional Climate Center webpage, http://www.wrcc.dri.edu/.

0 21
Scale in Miles
Carson
Del Amo Blvd.
South St.
Artesia Blvd.
Carson St. Carson St.
St.
St.Willow
SpringSepulveda
Blvd.
PacificCoast Hwy.
PacificCoast
Hwy.
Anaheim
SeasideFwy.
St.
7th St.
Ocean
Blvd.
Blvd
.Av
alon
Ave.
Ave.
Blvd
.
Blvd
.Be
llflo
wer
Lake
woo
d
Cher
ry
Atla
ntic
Long
Beac
hBl
vd.
Ave.
Paci
fic
Alam
eda
Alameda
St.
St.
LongBeach
Blvd.
Los
Coyotes
Diagon
al
California StateUniversity
Dominquez Hills
Long BeachMunicipal
Airport
Los
Ange
les
Riv
er
Long Beach Harbor
South BayPavilionat Carson
405
710
710
710
405
405
91
91
103
103
47
47
Long BeachMemorialMedicalCenter
Long BeachMemorialMedicalCenter
N
SkylinksGolfCourse
LakewoodCountry
Club
RecreationPark
Golf Course
VirginiaCountry
Club
TERMINALISLAND
LakewoodLakewood
Long BeachCity College
Long BeachCity College
Long BeachCity College
Long BeachCity College
LakewoodCenter
LakewoodCenter
LongBeachLong
Beach
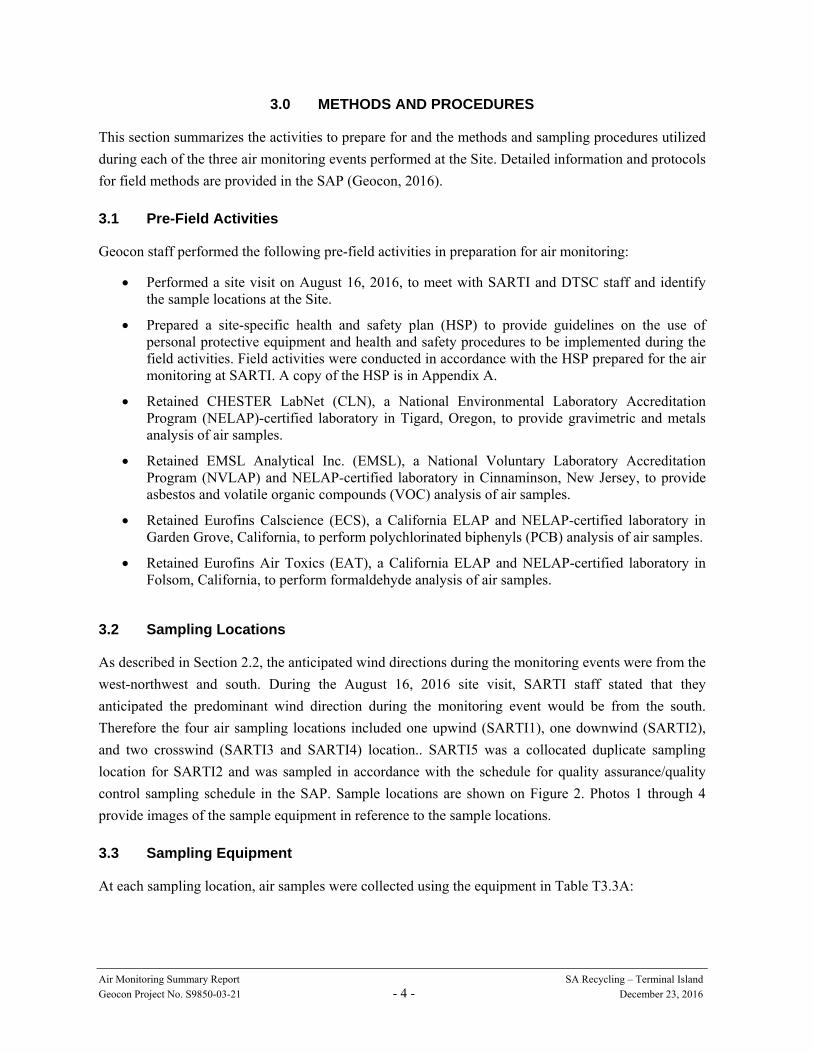
VICINITY MAP
December 2016 Figure 1S9850-03-21
P H O N E 9 1 6 . 8 5 2 . 9 11 8 – FA X 9 1 6 . 8 5 2 . 9 1 3 23 1 6 0 G O L D VA L L E Y D R – S U I T E 8 0 0 – R A N C H O C O R D O VA , C A 9 5 7 4 2
PROJECTSITE
PROJECTSITE
901 New Dock StreetTerminal Island, California
SA Recycling – Terminal Island

N
0 300
Scale in FeetSITE PLAN
December 2016 Figure 2S9850-03-21
P H O N E 9 1 6 . 8 5 2 . 9 11 8 – FA X 9 1 6 . 8 5 2 . 9 1 3 23 1 6 0 G O L D VA L L E Y D R – S U I T E 8 0 0 – R A N C H O C O R D O VA , C A 9 5 7 4 2
LEGEND:
Approximate Site Boundary
Proposed Air Sampling Location
Railroad Tracks
SARTI1
SARTI1
SARTI2
SARTI4
SARTI1
E A S T B A S I NE A S T B A S I N
SARTI2
SARTI4
901 New Dock StreetTerminal Island, California
SA Recycling – Terminal Island
Port of Los AngelesMulti-Use Terminal
MetalShredder
CargoTerminals
Port of Los AngelesMulti-Use Terminal
SARTI3SARTI3
MetalShredder
MeterologicalStation
MeterologicalStation
CargoTerminals
N E W DO C K S
T R E E T
N E W DO C K S
T R E E T
Wind Rose DiagramsSee Appendix J
T1
T2
T3
Wind Rose DiagramsSee Appendix J
T1
T2
T3
Metal RecoveryPlant
Metal RecoveryPlant

PHOTOS NO. 1 & 2
December 2016GEOCON Project No. S9850-03-21
901 New Dock StreetTerminal Island, California
SA Recycling – Terminal Island
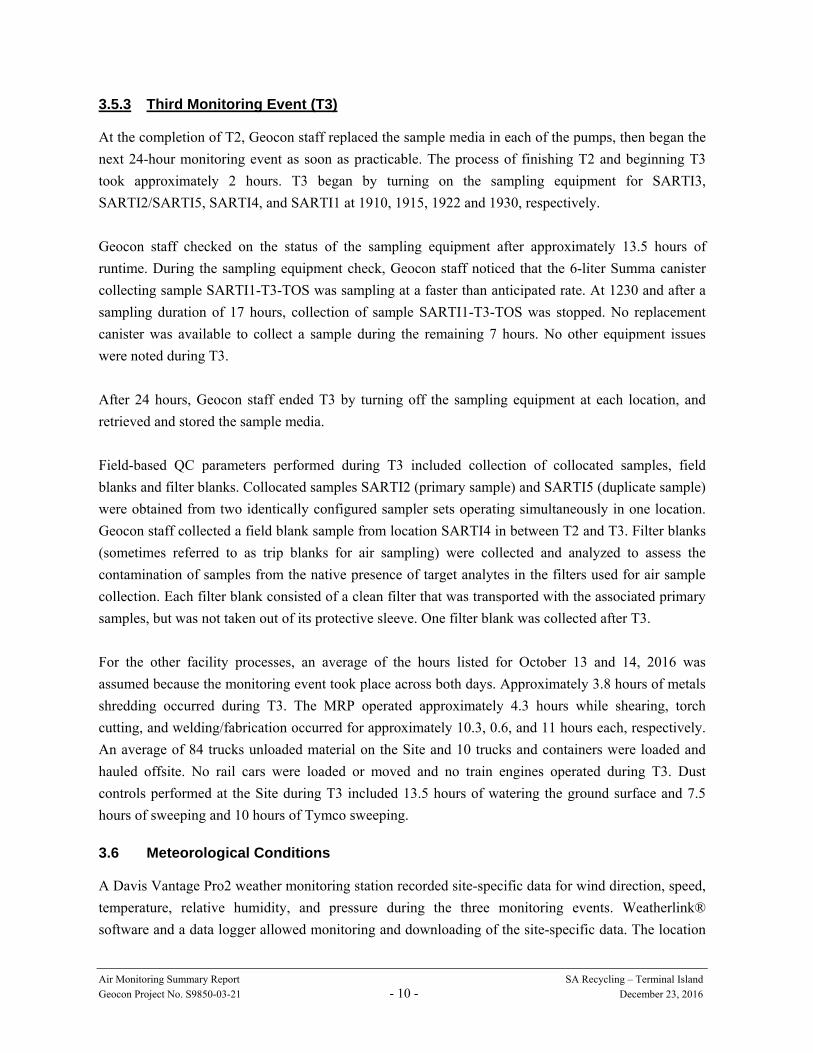
Photo No. 1 Sampling location SARTI1. Equipment shown from right to left: TE-1000 PUF, TE-Wilbur10, TE-5170V, TE-Wilbur2.5. A 6-Liter Summa canister and GilAir pump are difficult to see but shown on top of the SA Recycling sign between the TE-1000 PUF and TE-Wilbur10 samplers.
Photo No. 2 Sampling location SARTI2 along with duplicate sample SARTI5.
P H O N E 9 1 6 . 8 5 2 . 9 11 8 – FA X 9 1 6 . 8 5 2 . 9 1 3 23 1 6 0 G O L D VA L L E Y D R – S U I T E 8 0 0 – R A N C H O C O R D O VA , C A 9 5 7 4 2
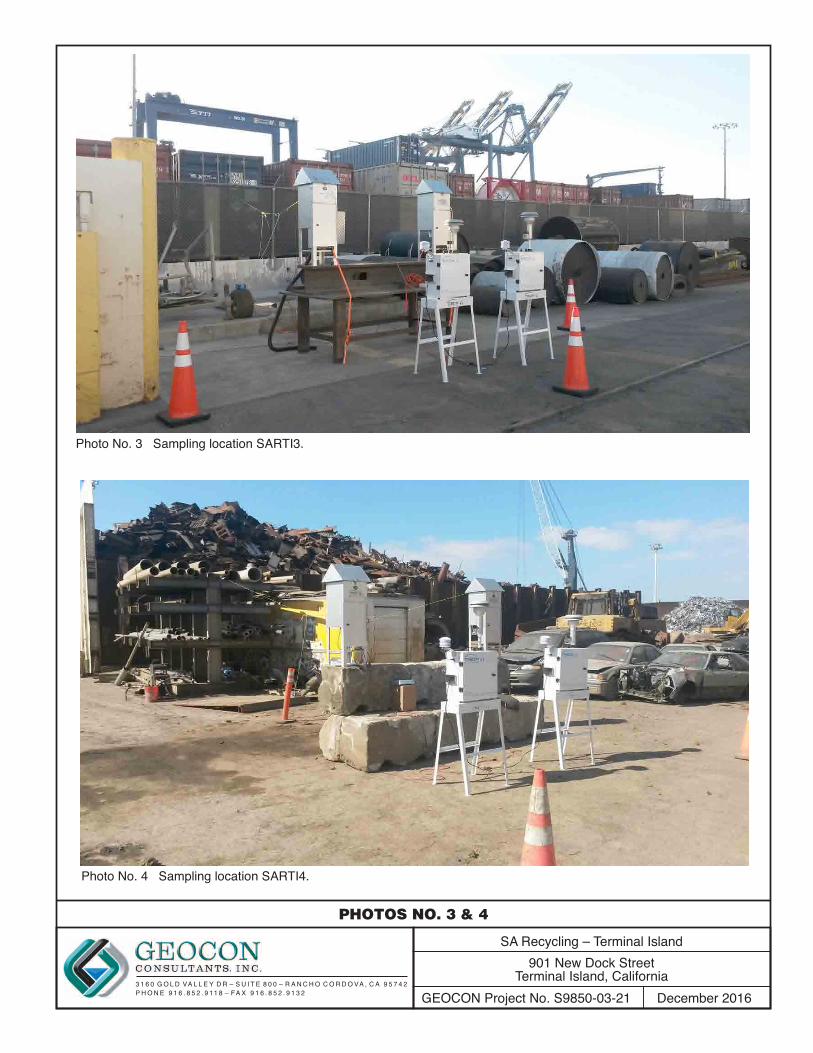
PHOTOS NO. 3 & 4
December 2016GEOCON Project No. S9850-03-21
901 New Dock StreetTerminal Island, California
SA Recycling – Terminal Island
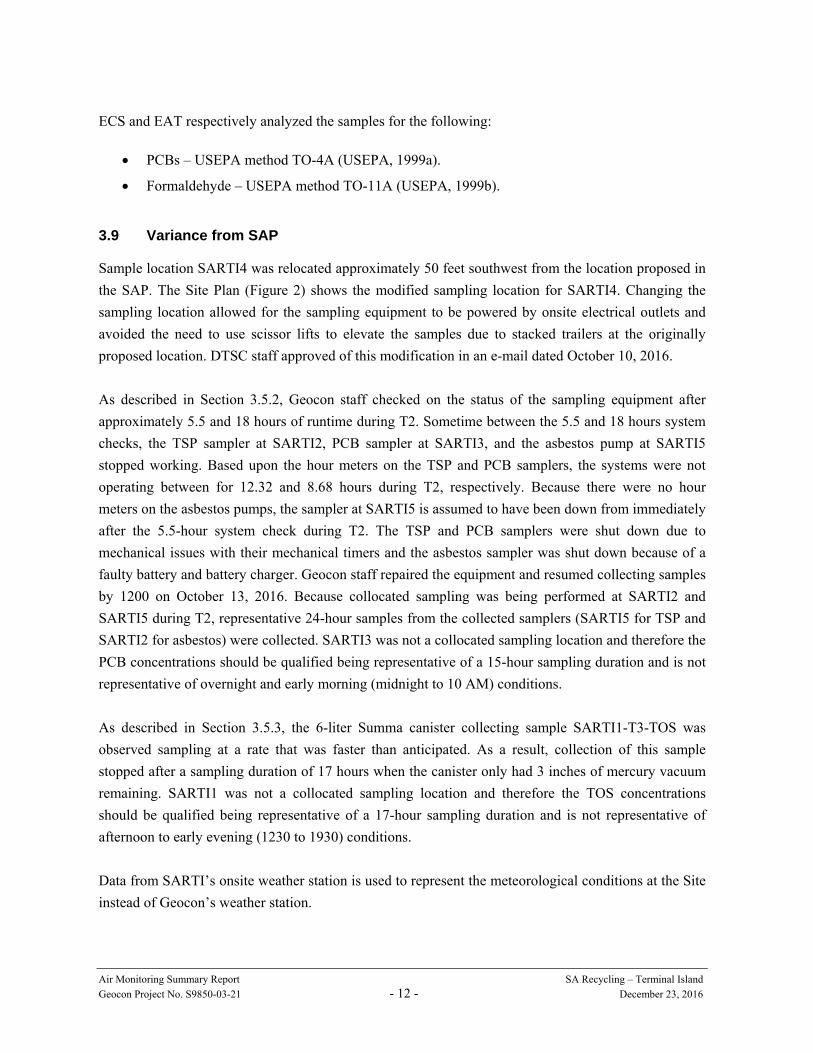
Photo No. 4 Sampling location SARTI4.
P H O N E 9 1 6 . 8 5 2 . 9 11 8 – FA X 9 1 6 . 8 5 2 . 9 1 3 23 1 6 0 G O L D VA L L E Y D R – S U I T E 8 0 0 – R A N C H O C O R D O VA , C A 9 5 7 4 2
Photo No. 3 Sampling location SARTI3.

Geocon Project No. S9850-03-21December 23, 2016Page 1 of 4
Client ID Sample Date Tare(g)
Gross (g)
Net (µg)
Volume(m3)
Concentration
(µg/m3)
Aluminium (Al)
(µg/m3)
Phosphorus (P)(µg/m3)
Sulfur (S) (µg/m3)
Chlorine (Cl)
(µg/m3)
Potassium (K)
(µg/m3)
Calcium (Ca)
(µg/m3)
SARTI1-T1-TSP 10/12/2016 4.2948 4.4008 106,000 1,756 60.4 0.5549 0.0000 0.7759 1.1220 0.6552 3.8150SARTI1-T2-TSP 10/13/2016 4.2861 4.4041 118,000 1,756 67.2 0.6298 0.0000 0.8622 0.6342 0.6980 3.826SARTI1-T3-TSP 10/14/2016 4.2727 4.4117 139,000 1,756 79.2 0.7237 0.0000 1.1460 0.4007 0.7112 3.7550
SARTI2-T1-TSP 10/12/2016 4.3034 4.3967 93,300 1,754 53.2 0.6134 0.0000 0.5838 0.8937 0.4977 3.0140SARTI2-T2-TSP 2 10/13/2016 4.2899 4.3443 54,400 854 63.7 0.7887 0.0000 0.5077 0.3795 0.7630 4.2890SARTI2-T3-TSP 10/14/2016 4.3189 4.4220 103,100 1,754 58.8 0.5798 0.0000 0.8435 0.2226 0.5199 2.5300
SARTI3-T1-TSP 10/12/2016 4.3083 4.3828 74,500 1,752 42.5 0.4832 0.0000 0.5617 0.6127 0.4799 2.4610SARTI3-T2-TSP 10/13/2016 4.2877 4.3782 90,500 1,752 51.7 0.5566 0.0000 0.6350 0.2429 0.5418 2.5720SARTI3-T3-TSP 10/14/2016 4.3323 4.4354 103,100 1,752 58.8 0.5657 0.0000 0.8702 0.2417 0.5228 2.6670
SARTI4-T1-TSP 10/12/2016 4.2771 4.3756 98,500 1,756 56.1 0.5951 0.0000 0.7884 1.1040 0.5963 3.9490SARTI4-T2-TSP 10/13/2016 4.3318 4.4759 144,100 1,756 82.1 0.7239 0.0000 1.3650 0.7831 0.6682 5.1100SARTI4-T3-TSP 10/14/2016 4.32 4.4957 175,700 1,756 100 0.6920 0.0000 2.2240 0.5630 0.6645 5.9510
Field DuplicateSARTI5-T2-TSP 10/13/2016 4.2958 4.3995 103,700 1,738 59.7 0.5983 0.0000 0.7123 0.3609 0.6106 2.8970SARTI5-T3-TSP 10/14/2016 4.3021 4.4107 108,600 1,738 62.5 0.5651 0.0000 0.9066 0.2464 0.6018 2.712
Field BlankSARTI1-T1-TSP-FB 1 10/12/2016 4.3056 4.3082 2,600 354.1000 0.0000 4.5470 13.2800 302.7000 2116.0000SARTI4-T2-TSP-FB 1 10/13/2016 4.3042 4.3058 1,600 247.9000 0.0000 5.5620 19.8900 302.5000 2130.0000
Trip BlankSARTI-TB-TSP 1 10/14/2016 4.3070 4.3092 2,200 343.8000 0.0000 17.7000 23.7500 310.7000 2140.000
Lab BlankLab Blank 1 4.2809 4.2818 900 328.7000 0.0000 1.2590 9.2570 302.4000 2118.000Lab Blank 1 4.3054 4.3062 800 295.4000 0.0000 0.0000 13.8400 320.1000 2137.000
TABLE 1SUMMARY OF GRAVIMETRIC AND METALS ANALYTICAL DATA - TSP
DTSC METAL SHREDDING FACILITIESSA RECYCLING TERMINAL ISLAND (SARTI), 901 NEW DOCK STREET, TERMINAL ISLAND, CALIFORNIA
CONTRACT NO. 15-T4124
Geocon Project No. S9850-03-21December 23, 2016Page 2 of 4
TABLE 1SUMMARY OF GRAVIMETRIC AND METALS ANALYTICAL DATA - TSP
DTSC METAL SHREDDING FACILITIESSA RECYCLING TERMINAL ISLAND (SARTI), 901 NEW DOCK STREET, TERMINAL ISLAND, CALIFORNIA
CONTRACT NO. 15-T4124
Client ID Sample DateTitanium
(Ti)(µg/m3)
Vanadium (V)
(µg/m3)
Chromium (Cr)
(µg/m3)
Manganese (Mn)
(µg/m3)
Iron (Fe)(µg/m3)
Cobalt (Co)(µg/m3)
Nickel (Ni)(µg/m3)
Copper (Cu)
(µg/m3)
Zinc (Zn)(µg/m3)
Gallium (Ga)
(µg/m3)
Germanium (Ge)
(µg/m3)
SARTI1-T1-TSP 10/12/2016 0.0892 0.0048 0.0379 0.0538 3.0800 0.0000 0.0097 0.1380 0.3410 0.0052 0.0049SARTI1-T2-TSP 10/13/2016 0.0963 0.0000 0.0413 0.0564 3.2110 0.0000 0.0098 0.1451 0.2682 0.0038 0.0039SARTI1-T3-TSP 10/14/2016 0.1118 0.0000 0.0331 0.0509 3.2760 0.0000 0.0103 0.1256 0.2664 0.0052 0.0030
SARTI2-T1-TSP 10/12/2016 0.0754 0.0000 0.0366 0.0519 4.1320 0.0000 0.0118 0.0976 0.4747 0.0058 0.0029SARTI2-T2-TSP 2 10/13/2016 0.1473 0.0000 0.0608 0.0429 3.0930 0.0000 0.0107 0.0783 0.3007 0.0117 0.0090SARTI2-T3-TSP 10/14/2016 0.0775 0.0000 0.0263 0.0296 2.0100 0.0000 0.0074 0.0963 0.1683 0.0039 0.0030
SARTI3-T1-TSP 10/12/2016 0.0606 0.0036 0.0336 0.0309 2.0230 0.0000 0.0085 0.1187 0.1943 0.0052 0.0027SARTI3-T2-TSP 10/13/2016 0.0754 0.0000 0.0348 0.0336 1.9680 0.0000 0.0086 0.1325 0.1910 0.0052 0.0040SARTI3-T3-TSP 10/14/2016 0.0890 0.0010 0.0292 0.0412 2.3200 0.0000 0.0081 0.1060 0.2169 0.0050 0.0029
SARTI4-T1-TSP 10/12/2016 0.0948 0.0005 0.0400 0.0730 6.1290 0.0000 0.0113 0.1341 0.3857 0.0043 0.0070SARTI4-T2-TSP 10/13/2016 0.1087 0.0000 0.0476 0.0706 5.2530 0.0000 0.0138 0.1948 0.4825 0.0036 0.0034SARTI4-T3-TSP 10/14/2016 0.1376 0.0000 0.0462 0.0950 8.0460 0.0000 0.0080 0.1497 0.4011 0.0048 0.0035
Field DuplicateSARTI5-T2-TSP 10/13/2016 0.1103 0.0000 0.0333 0.0367 2.3300 0.0000 0.0088 0.1362 0.2069 0.0052 0.0027SARTI5-T3-TSP 10/14/2016 0.0874 0.0010 0.0285 0.0344 2.2750 0.0000 0.0066 0.1181 0.1819 0.0029 0.0038
Field BlankSARTI1-T1-TSP-FB 1 10/12/2016 27.7700 0.0000 42.8300 5.1560 140.4000 0.0000 4.9940 13.9700 5.7650 11.0800 7.0640SARTI4-T2-TSP-FB 1 10/13/2016 0.0000 0.0000 44.2100 6.1310 193.5000 0.0000 8.0790 18.8400 17.4600 11.9000 6.6180
Trip BlankSARTI-TB-TSP 1 10/14/2016 25.5000 0.0000 43.5600 8.0390 132.5000 0.0000 6.4550 13.6000 5.6430 13.3600 8.4450
Lab BlankLab Blank 1 21.8400 0.0000 43.1200 7.2670 132.4000 0.0000 8.3230 14.6600 6.6990 11.6100 7.9580Lab Blank 1 26.8000 0.0000 45.5500 8.0790 131.8000 0.0000 5.8870 13.8900 10.0300 13.8900 8.5670
Geocon Project No. S9850-03-21December 23, 2016Page 3 of 4
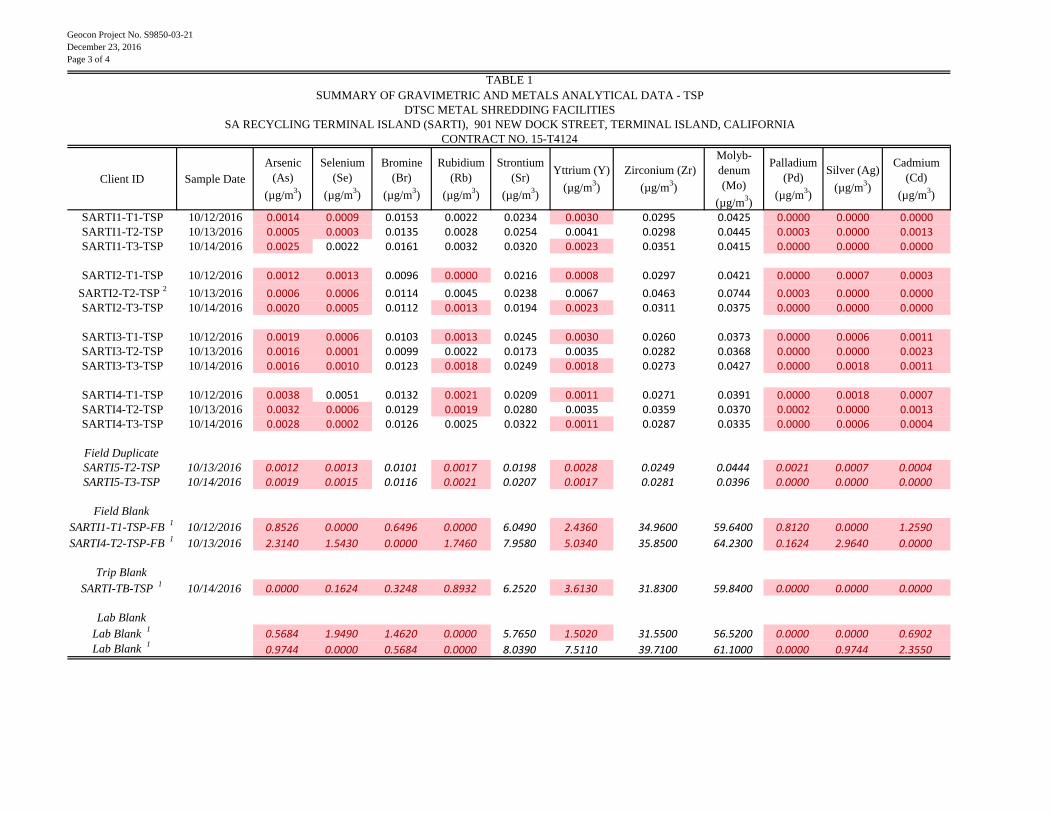
TABLE 1SUMMARY OF GRAVIMETRIC AND METALS ANALYTICAL DATA - TSP
DTSC METAL SHREDDING FACILITIESSA RECYCLING TERMINAL ISLAND (SARTI), 901 NEW DOCK STREET, TERMINAL ISLAND, CALIFORNIA
CONTRACT NO. 15-T4124
Client ID Sample DateArsenic
(As)(µg/m3)
Selenium (Se)
(µg/m3)
Bromine (Br)
(µg/m3)
Rubidium (Rb)
(µg/m3)
Strontium (Sr)
(µg/m3)
Yttrium (Y)(µg/m3)
Zirconium (Zr)(µg/m3)
Molyb-denum (Mo)
(µg/m3)
Palladium (Pd)
(µg/m3)
Silver (Ag)(µg/m3)
Cadmium (Cd)
(µg/m3)
SARTI1-T1-TSP 10/12/2016 0.0014 0.0009 0.0153 0.0022 0.0234 0.0030 0.0295 0.0425 0.0000 0.0000 0.0000SARTI1-T2-TSP 10/13/2016 0.0005 0.0003 0.0135 0.0028 0.0254 0.0041 0.0298 0.0445 0.0003 0.0000 0.0013SARTI1-T3-TSP 10/14/2016 0.0025 0.0022 0.0161 0.0032 0.0320 0.0023 0.0351 0.0415 0.0000 0.0000 0.0000
SARTI2-T1-TSP 10/12/2016 0.0012 0.0013 0.0096 0.0000 0.0216 0.0008 0.0297 0.0421 0.0000 0.0007 0.0003SARTI2-T2-TSP 2 10/13/2016 0.0006 0.0006 0.0114 0.0045 0.0238 0.0067 0.0463 0.0744 0.0003 0.0000 0.0000SARTI2-T3-TSP 10/14/2016 0.0020 0.0005 0.0112 0.0013 0.0194 0.0023 0.0311 0.0375 0.0000 0.0000 0.0000
SARTI3-T1-TSP 10/12/2016 0.0019 0.0006 0.0103 0.0013 0.0245 0.0030 0.0260 0.0373 0.0000 0.0006 0.0011SARTI3-T2-TSP 10/13/2016 0.0016 0.0001 0.0099 0.0022 0.0173 0.0035 0.0282 0.0368 0.0000 0.0000 0.0023SARTI3-T3-TSP 10/14/2016 0.0016 0.0010 0.0123 0.0018 0.0249 0.0018 0.0273 0.0427 0.0000 0.0018 0.0011
SARTI4-T1-TSP 10/12/2016 0.0038 0.0051 0.0132 0.0021 0.0209 0.0011 0.0271 0.0391 0.0000 0.0018 0.0007SARTI4-T2-TSP 10/13/2016 0.0032 0.0006 0.0129 0.0019 0.0280 0.0035 0.0359 0.0370 0.0002 0.0000 0.0013SARTI4-T3-TSP 10/14/2016 0.0028 0.0002 0.0126 0.0025 0.0322 0.0011 0.0287 0.0335 0.0000 0.0006 0.0004
Field DuplicateSARTI5-T2-TSP 10/13/2016 0.0012 0.0013 0.0101 0.0017 0.0198 0.0028 0.0249 0.0444 0.0021 0.0007 0.0004SARTI5-T3-TSP 10/14/2016 0.0019 0.0015 0.0116 0.0021 0.0207 0.0017 0.0281 0.0396 0.0000 0.0000 0.0000
Field BlankSARTI1-T1-TSP-FB 1 10/12/2016 0.8526 0.0000 0.6496 0.0000 6.0490 2.4360 34.9600 59.6400 0.8120 0.0000 1.2590SARTI4-T2-TSP-FB 1 10/13/2016 2.3140 1.5430 0.0000 1.7460 7.9580 5.0340 35.8500 64.2300 0.1624 2.9640 0.0000
Trip BlankSARTI-TB-TSP 1 10/14/2016 0.0000 0.1624 0.3248 0.8932 6.2520 3.6130 31.8300 59.8400 0.0000 0.0000 0.0000
Lab BlankLab Blank 1 0.5684 1.9490 1.4620 0.0000 5.7650 1.5020 31.5500 56.5200 0.0000 0.0000 0.6902Lab Blank 1 0.9744 0.0000 0.5684 0.0000 8.0390 7.5110 39.7100 61.1000 0.0000 0.9744 2.3550

Geocon Project No. S9850-03-21December 23, 2016Page 4 of 4
TABLE 1SUMMARY OF GRAVIMETRIC AND METALS ANALYTICAL DATA - TSP
DTSC METAL SHREDDING FACILITIESSA RECYCLING TERMINAL ISLAND (SARTI), 901 NEW DOCK STREET, TERMINAL ISLAND, CALIFORNIA
CONTRACT NO. 15-T4124
Client ID Sample DateIndium (In)
(µg/m3)Tin (Sn)(µg/m3)
Antimony (Sb)
(µg/m3)
Barium (Ba)
(µg/m3)
Lanthanum (La)
(µg/m3)
Mercury (Hg)
(µg/m3)
Lead (Pb)(µg/m3)
Beryllium (Be)
(µg/m3)--- --- ---
SARTI1-T1-TSP 10/12/2016 0.0001 0.0166 0.0058 0.1213 0.0203 0.0000 0.0383 <0.0000 --- --- ---SARTI1-T2-TSP 10/13/2016 0.0010 0.0139 0.0030 0.1291 0.0000 0.0000 0.0326 <0.0000 --- --- ---SARTI1-T3-TSP 10/14/2016 0.0000 0.0132 0.0023 0.1308 0.0146 0.0000 0.0319 <0.0000 --- --- ---
SARTI2-T1-TSP 10/12/2016 0.0000 0.0166 0.0006 0.1038 0.0000 0.0015 0.0343 <0.0000 --- --- ---SARTI2-T2-TSP 2 10/13/2016 0.0023 0.0163 0.0011 0.1251 0.0116 0.0000 0.0319 <0.0001 --- --- ---SARTI2-T3-TSP 10/14/2016 0.0027 0.0128 0.0002 0.0851 0.0038 0.0016 0.0151 <0.0000 --- --- ---
SARTI3-T1-TSP 10/12/2016 0.0006 0.0165 0.0000 0.0979 0.0000 0.0000 0.0166 <0.0000 --- --- ---SARTI3-T2-TSP 10/13/2016 0.0000 0.0140 0.0016 0.0993 0.0049 0.0000 0.0147 <0.0000 --- --- ---SARTI3-T3-TSP 10/14/2016 0.0000 0.0128 0.0047 0.0975 0.0024 0.0000 0.0274 <0.0000 --- --- ---
SARTI4-T1-TSP 10/12/2016 0.0001 0.0165 0.0037 0.0912 0.0185 0.0037 0.0561 <0.0000 --- --- ---SARTI4-T2-TSP 10/13/2016 0.0004 0.0183 0.0012 0.1405 0.0202 0.0018 0.0517 <0.0000 --- --- ---SARTI4-T3-TSP 10/14/2016 0.0003 0.0143 0.0013 0.1311 0.0000 0.0000 0.0464 <0.0000 --- --- ---
Field DuplicateSARTI5-T2-TSP 10/13/2016 0.0010 0.0136 0.0000 0.1075 0.0086 0.0000 0.0216 <0.0000 --- --- ---SARTI5-T3-TSP 10/14/2016 0.0017 0.0115 0.0028 0.0954 0.0081 0.0000 0.0176 <0.0000 --- --- ---
Field BlankSARTI1-T1-TSP-FB 1 10/12/2016 0.0000 19.3700 5.5220 30.2500 0.0000 0.0000 0.1624 <0.049 --- --- ---SARTI4-T2-TSP-FB 1 10/13/2016 1.7050 17.6200 0.0000 104.8000 20.0200 0.0000 4.0190 <0.049 --- --- ---
Trip BlankSARTI-TB-TSP 1 10/14/2016 0.8526 19.9300 5.3190 61.7100 2.8010 0.0000 3.2480 <0.049 --- --- ---
Lab BlankLab Blank 1 0.0000 16.6900 0.0000 23.7100 0.0000 0.0000 3.4510 <0.049 --- --- ---Lab Blank 1 0.0000 17.5000 4.6280 38.4100 0.0000 0.0000 3.0450 <0.049 --- --- ---
Notes: g = grams µg/m3 = micrograms per cubic meter Highlighted = concentrations are less than three times the uncertaintym3 = cubic meters --- = not sampled/tested Italics = Quality assurance/quality control samplesµg = micrograms 1 = units for these QA/QC samples are µg/filter2 = Sampler did not operate for full 24 duration mechanical problems and is representative of a 11.7 hour sample duration

Geocon Project No. S9850-03-21December 23, 2016Page 1 of 4
Client ID Sample Date Tare(mg)
Gross (mg)
Net (µg)
Volume(m3)
Concentration
(µg/m3)
Sodium (Na)
(µg/m3)
Magnesium (Mg)
(µg/m3)
Aluminium
(Al)(µg/m3)
Silicon (Si)
(µg/m3)
Phosphorus (P)
(µg/m3)
Sulfur (S) (µg/m3)
SARTI1-T1-PM10 10/12/2016 385.577 386.216 639 24 26.6 0.9007 0.2574 0.4202 1.0650 0.0199 0.8310SARTI1-T2-PM10 10/13/2016 376.509 377.313 804 24 33.5 0.8386 0.2852 0.5061 1.3050 0.0177 0.9021SARTI1-T3-PM10 10/14/2016 377.509 378.433 924 24 38.5 0.9129 0.2866 0.5659 1.5780 0.0229 1.3500
SARTI2-T1-PM10 10/12/2016 380.518 381.096 578 24 24.1 0.7514 0.2282 0.3700 0.9539 0.0123 0.7778SARTI2-T2-PM10 10/13/2016 372.184 372.839 655 24 27.3 0.8047 0.2419 0.3921 1.0460 0.0141 0.8254SARTI2-T3-PM10 10/14/2016 378.458 379.312 854 24 35.6 0.7500 0.2579 0.4295 1.1480 0.0131 1.2020
SARTI3-T1-PM10 10/12/2016 372.674 373.152 478 24 19.9 0.7557 0.2089 0.2781 0.7204 0.0089 0.7110SARTI3-T2-PM10 10/13/2016 379.087 379.751 664 24 27.7 0.7722 0.2150 0.4015 1.0710 0.0158 0.7872SARTI3-T3-PM10 10/14/2016 364.390 365.183 793 24 33.0 0.8371 0.2456 0.4208 1.1630 0.0168 1.2460
SARTI4-T1-PM10 10/12/2016 368.655 369.389 734 24 30.6 0.7486 0.2513 0.4450 1.1530 0.0170 0.8061SARTI4-T2-PM10 10/13/2016 375.272 376.201 929 24 38.7 0.7943 0.3007 0.6239 1.3530 0.0228 1.1510SARTI4-T3-PM10 10/14/2016 368.982 370.206 1224 24 51.0 0.7514 0.3002 0.6041 1.5850 0.0241 1.5950
Field DuplicateSARTI5-T2-PM10 10/13/2016 374.275 374.934 659 24 27.5 0.7665 0.2244 0.3834 1.0380 0.0133 0.7929SARTI5-T3-PM10 10/14/2016 367.632 368.437 805 24 33.5 0.7689 0.2202 0.4315 1.1580 0.0139 1.2770
Field BlankSARTI1-T1-PM10-FB 1 10/12/2016 371.401 371.418 17 0.3446 0.0000 0.0000 0.0079 0.0000 0.0011SARTI4-T2-PM10-FB 1 10/13/2016 372.129 372.127 -2 0.8125 0.0757 0.1266 0.0328 0.0000 0.0000
Trip BlankSARTI-TB-PM10 1 10/14/2016 381.134 381.150 16 0.4012 0.0000 0.0000 0.0034 0.0000 0.0000
Lab BlankLab Blank 1 365.638 365.639 1 0.0000 0.0531 0.0000 0.0000 0.0000 0.0023Lab Blank 1 365.472 365.470 -2 0.6509 0.1514 0.0000 0.0000 0.0000 0.0000Lab Blank 1 373.779 373.780 1 0.2554 0.1017 0.0542 0.0226 0.0000 0.0113Lab Blank 1 380.038 380.033 -5 0.0746 0.0000 0.0734 0.0881 0.0000 0.0011
TABLE 2SUMMARY OF GRAVIMETRIC AND METALS ANALYTICAL DATA - PM10
DTSC METAL SHREDDING FACILITIESSA RECYCLING TERMINAL ISLAND (SARTI), 901 NEW DOCK STREET, TERMINAL ISLAND, CALIFORNIA
CONTRACT NO. 15-T4124
Geocon Project No. S9850-03-21December 23, 2016Page 2 of 4
TABLE 2SUMMARY OF GRAVIMETRIC AND METALS ANALYTICAL DATA - PM10
DTSC METAL SHREDDING FACILITIESSA RECYCLING TERMINAL ISLAND (SARTI), 901 NEW DOCK STREET, TERMINAL ISLAND, CALIFORNIA
CONTRACT NO. 15-T4124
Client ID Sample DateChlorine
(Cl)(µg/m3)
Potassium (K)
(µg/m3)
Calcium (Ca)
(µg/m3)
Titanium (Ti)
(µg/m3)
Vanadium (V)
(µg/m3)
Chromium (Cr)
(µg/m3)
Manganese (Mn)
(µg/m3)
Iron (Fe)(µg/m3)
Cobalt (Co)
(µg/m3)
Nickel (Ni)(µg/m3)
Copper (Cu)(µg/m3)
SARTI1-T1-PM10 10/12/2016 0.8922 0.2189 0.9214 0.0435 0.0116 0.0048 0.0135 0.9464 0.0000 0.0036 0.0490SARTI1-T2-PM10 10/13/2016 0.5052 0.2642 1.1070 0.0540 0.0062 0.0055 0.0189 1.2450 0.0000 0.0039 0.0487SARTI1-T3-PM10 10/14/2016 0.4873 0.2999 1.0710 0.0646 0.0077 0.0044 0.0177 1.2620 0.0000 0.0034 0.0607
SARTI2-T1-PM10 10/12/2016 0.7783 0.1987 0.6992 0.0403 0.0088 0.0044 0.0150 1.2460 0.0000 0.0038 0.0167SARTI2-T2-PM10 10/13/2016 0.3786 0.2198 0.6479 0.0533 0.0036 0.0036 0.0115 0.7547 0.0000 0.0027 0.0298SARTI2-T3-PM10 10/14/2016 0.3758 0.2306 0.5754 0.0479 0.0059 0.0024 0.0107 0.8084 0.0000 0.0029 0.0267
SARTI3-T1-PM10 10/12/2016 0.6578 0.1547 0.4027 0.0292 0.0091 0.0028 0.0060 0.5730 0.0000 0.0031 0.0167SARTI3-T2-PM10 10/13/2016 0.3371 0.2174 0.6126 0.0463 0.0044 0.0034 0.0113 0.8112 0.0000 0.0032 0.0247SARTI3-T3-PM10 10/14/2016 0.4000 0.2413 0.5895 0.0493 0.0061 0.0039 0.0117 0.8800 0.0000 0.0031 0.0212
SARTI4-T1-PM10 10/12/2016 0.8729 0.2254 1.1000 0.0496 0.0111 0.0052 0.0257 2.2880 0.0000 0.0072 0.0492SARTI4-T2-PM10 10/13/2016 0.5947 0.2574 1.6240 0.0586 0.0066 0.0071 0.0238 1.8270 0.0000 0.0045 0.0709SARTI4-T3-PM10 10/14/2016 0.6997 0.2938 1.7840 0.0746 0.0069 0.0084 0.0304 2.7860 0.0000 0.0046 0.0359
Field DuplicateSARTI5-T2-PM10 10/13/2016 0.4326 0.2163 0.6281 0.0483 0.0048 0.0040 0.0106 0.7425 0.0000 0.0021 0.0379SARTI5-T3-PM10 10/14/2016 0.3736 0.2411 0.6050 0.0498 0.0059 0.0029 0.0117 0.8023 0.0000 0.0023 0.0479
Field BlankSARTI1-T1-PM10-FB 1 10/12/2016 0.0000 0.0056 0.0000 0.0000 0.0090 0.0045 0.0000 0.0000 0.0000 0.0023 0.0000SARTI4-T2-PM10-FB 1 10/13/2016 0.0000 0.0068 0.0000 0.0000 0.0011 0.0181 0.0000 0.0000 0.0068 0.0011 0.0000
Trip BlankSARTI-TB-PM10 1 10/14/2016 0.0260 0.0000 0.0000 0.0000 0.0045 0.0000 0.0068 0.0136 0.0000 0.0000 0.0000
Lab BlankLab Blank 1 0.0000 0.0147 0.0000 0.0011 0.0000 0.0158 0.0000 0.0124 0.0000 0.0000 0.0000Lab Blank 1 0.0294 0.0000 0.0000 0.0079 0.0068 0.0000 0.0079 0.0170 0.0000 0.0000 0.0000Lab Blank 1 0.0158 0.0000 0.0079 0.0000 0.0000 0.0000 0.0000 0.0113 0.0068 0.0011 0.0000Lab Blank 1 0.0000 0.0170 0.0000 0.0000 0.0000 0.0158 0.0068 0.0000 0.0170 0.0000 0.0000

Geocon Project No. S9850-03-21December 23, 2016Page 3 of 4
TABLE 2SUMMARY OF GRAVIMETRIC AND METALS ANALYTICAL DATA - PM10
DTSC METAL SHREDDING FACILITIESSA RECYCLING TERMINAL ISLAND (SARTI), 901 NEW DOCK STREET, TERMINAL ISLAND, CALIFORNIA
CONTRACT NO. 15-T4124
Client ID Sample DateZinc (Zn)(µg/m3)
Gallium (Ga)
(µg/m3)
Germanium (Ge)(µg/m3)
Arsenic (As)
(µg/m3)
Selenium (Se)
(µg/m3)
Bromine (Br)
(µg/m3)
Rubidium (Rb)(µg/m3)
Strontium (Sr)
(µg/m3)
Yttrium (Y)
(µg/m3)
Zirconium (Zr)
(µg/m3)
Molyb-denum (Mo)
(µg/m3)
SARTI1-T1-PM10 10/12/2016 0.1102 0.0005 0.0000 0.0000 0.0006 0.0065 0.0009 0.0069 0.0016 0.0039 0.0017SARTI1-T2-PM10 10/13/2016 0.1005 0.0003 0.0003 0.0005 0.0000 0.0074 0.0011 0.0080 0.0000 0.0036 0.0023SARTI1-T3-PM10 10/14/2016 0.0893 0.0005 0.0000 0.0000 0.0008 0.0105 0.0017 0.0100 0.0005 0.0039 0.0034
SARTI2-T1-PM10 10/12/2016 0.1213 0.0003 0.0000 0.0011 0.0003 0.0037 0.0006 0.0064 0.0003 0.0037 0.0000SARTI2-T2-PM10 10/13/2016 0.0542 0.0000 0.0000 0.0000 0.0006 0.0059 0.0013 0.0056 0.0000 0.0027 0.0016SARTI2-T3-PM10 10/14/2016 0.0480 0.0005 0.0001 0.0000 0.0002 0.0073 0.0007 0.0057 0.0000 0.0039 0.0016
SARTI3-T1-PM10 10/12/2016 0.0452 0.0002 0.0000 0.0010 0.0007 0.0039 0.0002 0.0059 0.0000 0.0021 0.0010SARTI3-T2-PM10 10/13/2016 0.0582 0.0002 0.0003 0.0008 0.0000 0.0059 0.0013 0.0072 0.0000 0.0048 0.0011SARTI3-T3-PM10 10/14/2016 0.0726 0.0005 0.0006 0.0000 0.0013 0.0084 0.0007 0.0078 0.0008 0.0053 0.0014
SARTI4-T1-PM10 10/12/2016 0.1256 0.0012 0.0000 0.0066 0.0010 0.0050 0.0009 0.0082 0.0004 0.0029 0.0000SARTI4-T2-PM10 10/13/2016 0.1537 0.0009 0.0001 0.0000 0.0001 0.0065 0.0008 0.0102 0.0022 0.0051 0.0000SARTI4-T3-PM10 10/14/2016 0.1362 0.0005 0.0000 0.0000 0.0008 0.0101 0.0008 0.0117 0.0008 0.0035 0.0001
Field DuplicateSARTI5-T2-PM10 10/13/2016 0.0554 0.0000 0.0000 0.0011 0.0002 0.0047 0.0012 0.0062 0.0000 0.0041 0.0057SARTI5-T3-PM10 10/14/2016 0.0533 0.0000 0.0003 0.0010 0.0004 0.0090 0.0009 0.0057 0.0004 0.0034 0.0013
Field BlankSARTI1-T1-PM10-FB 1 10/12/2016 0.0011 0.0000 0.0068 0.0045 0.0011 0.0000 0.0023 0.0000 0.0000 0.0000 0.0000SARTI4-T2-PM10-FB 1 10/13/2016 0.0000 0.0000 0.0000 0.0000 0.0056 0.0000 0.0000 0.0000 0.0023 0.0000 0.0034
Trip BlankSARTI-TB-PM10 1 10/14/2016 0.0011 0.0000 0.0011 0.0000 0.0000 0.0000 0.0011 0.0000 0.0000 0.0305 0.0000
Lab BlankLab Blank 1 0.0000 0.0023 0.0000 0.0000 0.0090 0.0023 0.0000 0.0000 0.0023 0.0000 0.0023Lab Blank 1 0.0000 0.0023 0.0000 0.0000 0.0000 0.0056 0.0000 0.0000 0.0023 0.0000 0.0158Lab Blank 1 0.0000 0.0023 0.0000 0.0000 0.0000 0.0000 0.0000 0.0000 0.0113 0.0023 0.0000Lab Blank 1 0.0000 0.0079 0.0000 0.0034 0.0045 0.0000 0.0068 0.0000 0.0000 0.0000 0.0000

Geocon Project No. S9850-03-21December 23, 2016Page 4 of 4
TABLE 2SUMMARY OF GRAVIMETRIC AND METALS ANALYTICAL DATA - PM10
DTSC METAL SHREDDING FACILITIESSA RECYCLING TERMINAL ISLAND (SARTI), 901 NEW DOCK STREET, TERMINAL ISLAND, CALIFORNIA
CONTRACT NO. 15-T4124
Client ID Sample DatePalladium
(Pd)(µg/m3)
Silver (Ag)(µg/m3)
Cadmium (Cd)
(µg/m3)
Indium (In)(µg/m3)
Tin (Sn)(µg/m3)
Antimony (Sb)
(µg/m3)
Barium (Ba)(µg/m3)
Lanthanum (La)
(µg/m3)
Mercury (Hg)
(µg/m3)
Lead (Pb)(µg/m3)
Beryllium (Be)
(µg/m3)SARTI1-T1-PM10 10/12/2016 0.0000 0.0000 0.0000 0.0000 0.0000 0.0033 0.0393 0.0042 0.0000 0.0159 <0.0003SARTI1-T2-PM10 10/13/2016 0.0000 0.0000 0.0000 0.0000 0.0000 0.0056 0.0480 0.0097 0.0000 0.0146 <0.0003SARTI1-T3-PM10 10/14/2016 0.0025 0.0000 0.0032 0.0000 0.0016 0.0000 0.0394 0.0000 0.0000 0.0151 <0.0003
SARTI2-T1-PM10 10/12/2016 0.0000 0.0000 0.0000 0.0000 0.0000 0.0005 0.0151 0.0000 0.0000 0.0113 <0.0003SARTI2-T2-PM10 10/13/2016 0.0000 0.0000 0.0000 0.0000 0.0043 0.0000 0.0239 0.0000 0.0001 0.0056 <0.0003SARTI2-T3-PM10 10/14/2016 0.0000 0.0012 0.0000 0.0007 0.0000 0.0028 0.0247 0.0021 0.0000 0.0080 <0.0003
SARTI3-T1-PM10 10/12/2016 0.0000 0.0000 0.0017 0.0000 0.0026 0.0056 0.0169 0.0000 0.0003 0.0026 <0.0003SARTI3-T2-PM10 10/13/2016 0.0017 0.0000 0.0000 0.0000 0.0034 0.0000 0.0233 0.0000 0.0000 0.0048 <0.0003SARTI3-T3-PM10 10/14/2016 0.0022 0.0000 0.0013 0.0000 0.0024 0.0039 0.0229 0.0000 0.0012 0.0103 <0.0003
SARTI4-T1-PM10 10/12/2016 0.0000 0.0000 0.0000 0.0000 0.0048 0.0000 0.0199 0.0000 0.0028 0.0166 <0.0003SARTI4-T2-PM10 10/13/2016 0.0000 0.0000 0.0000 0.0000 0.0016 0.0000 0.0332 0.0000 0.0002 0.0228 <0.0003SARTI4-T3-PM10 10/14/2016 0.0000 0.0000 0.0000 0.0000 0.0015 0.0000 0.0314 0.0000 0.0000 0.0224 <0.0003
Field DuplicateSARTI5-T2-PM10 10/13/2016 0.0000 0.0000 0.0000 0.0000 0.0000 0.0000 0.0254 0.0000 0.0005 0.0041 <0.0003SARTI5-T3-PM10 10/14/2016 0.0027 0.0000 0.0035 0.0026 0.0000 0.0014 0.0194 0.0000 0.0004 0.0073 <0.0003
Field BlankSARTI1-T1-PM10-FB 1 10/12/2016 0.0576 0.0011 0.0000 0.0056 0.0000 0.1017 0.0000 0.0000 0.0000 0.0034 <0.008SARTI4-T2-PM10-FB 1 10/13/2016 0.0000 0.0000 0.0000 0.0000 0.0000 0.0000 0.0000 0.0000 0.0000 0.0000 <0.008
Trip BlankSARTI-TB-PM10 1 10/14/2016 0.0158 0.0249 0.0034 0.0000 0.0000 0.1582 0.0000 0.0000 0.0000 0.0023 <0.008
Lab BlankLab Blank 1 0.0000 0.0000 0.0000 0.0622 0.0814 0.0678 0.0000 0.0000 0.0000 0.0124 <0.008Lab Blank 1 0.0203 0.0000 0.0610 0.0000 0.0000 0.0904 0.0000 0.0034 0.0000 0.0079 <0.008Lab Blank 1 0.0000 0.0124 0.0000 0.0622 0.0497 0.0000 0.0158 0.0113 0.0000 0.0000 <0.008Lab Blank 1 0.0000 0.0000 0.0000 0.0000 0.0000 0.0000 0.0079 0.0215 0.0000 0.0023 <0.008
Notes: g = grams µg/m3 = micrograms per cubic meter Highlighted = concentrations are less than three times the uncertaintym3 = cubic meters --- = not sampled/tested Italics = Quality assurance/quality control samplesµg = micrograms 1 = units for these QA/QC samples are µg/filter

Geocon Project No. S9850-03-21December 23, 2016Page 1 of 4
Client ID Sample Date Tare(mg)
Gross (mg)
Net (µg)
Volume(m3)
Concentration
(µg/m3)
Sodium (Na)
(µg/m3)
Magnesium (Mg)
(µg/m3)
Aluminium
(Al)(µg/m3)
Silicon (Si)
(µg/m3)
Phosphorus (P)
(µg/m3)
Sulfur (S) (µg/m3)
SARTI1-T1-PM2.5 10/12/2016 370.501 370.716 215 24 8.96 0.2874 0.0498 0.0791 0.1736 0.0073 0.6041SARTI1-T2-PM2.5 10/13/2016 375.233 375.473 240 24 10.0 0.2280 0.0380 0.0505 0.1234 0.0023 0.6323SARTI1-T3-PM2.5 10/14/2016 365.938 366.256 318 24 13.25 0.2507 0.0451 0.0545 0.1332 0.0064 1.0590
SARTI2-T1-PM2.5 10/12/2016 378.785 378.942 157 24 6.54 0.2452 0.0408 0.0393 0.0984 0.0041 0.5410SARTI2-T2-PM2.5 10/13/2016 372.760 372.980 220 24 9.17 0.2525 0.0441 0.0377 0.0931 0.0034 0.6422SARTI2-T3-PM2.5 10/14/2016 375.598 375.916 318 24 13.25 0.2236 0.0159 0.0394 0.0940 0.0029 1.0950
SARTI3-T1-PM2.5 10/12/2016 374.305 374.491 186 24 7.75 0.2298 0.0371 0.0501 0.1142 0.0040 0.5909SARTI3-T2-PM2.5 10/13/2016 375.797 376.005 208 24 8.67 0.2324 0.0449 0.0500 0.1099 0.0038 0.6413SARTI3-T3-PM2.5 10/14/2016 373.260 373.543 283 24 11.79 0.2397 0.0465 0.0415 0.1064 0.0048 1.1200
SARTI4-T1-PM2.5 10/12/2016 376.564 376.777 213 24 8.88 0.2106 0.0484 0.0882 0.1982 0.0050 0.5782SARTI4-T2-PM2.5 10/13/2016 363.720 363.998 278 24 11.6 0.2114 0.0455 0.0632 0.1431 0.0038 0.6493SARTI4-T3-PM2.5 10/14/2016 351.018 351.468 450 24 18.75 0.1713 0.0366 0.0561 0.1456 0.0032 1.0780
Field DuplicateSARTI5-T2-PM2.5 10/13/2016 367.514 367.730 216 24 9.00 0.2214 0.0333 0.0475 0.1114 0.0040 0.6549SARTI5-T3-PM2.5 10/14/2016 361.420 361.761 341 24 14.21 0.1973 0.0375 0.0425 0.1002 0.0015 1.1270
Field BlankSARTI1-T1-PM2.5-FB 10/12/2016 379.152 379.152 0 0.2768 0.0000 0.1141 0.0407 0.0000 0.0000SARTI4-T2-PM2.5-FB 10/13/2016 375.465 375.470 5 0.3469 0.0000 0.0000 0.0000 0.0000 0.0000
Trip BlankSARTI-TB-PM2.5 1 10/14/2016 377.377 377.388 11 0.0000 0.0000 0.0136 0.0000 0.0000 0.0000
Lab BlankLab Blank 1 365.638 365.639 1 0.0000 0.0531 0.0000 0.0000 0.0000 0.0023Lab Blank 1 365.472 365.470 -2 0.6509 0.1514 0.0000 0.0000 0.0000 0.0000Lab Blank 1 373.779 373.780 1 0.2554 0.1017 0.0542 0.0226 0.0000 0.0113Lab Blank 1 380.038 380.033 -5 0.0746 0.0000 0.0734 0.0881 0.0000 0.0011
TABLE 3SUMMARY OF GRAVIMETRIC AND METALS ANALYTICAL DATA - PM2.5
DTSC METAL SHREDDING FACILITIESSA RECYCLING TERMINAL ISLAND (SARTI), 901 NEW DOCK STREET, TERMINAL ISLAND, CALIFORNIA
CONTRACT NO. 15-T4124

Geocon Project No. S9850-03-21December 23, 2016Page 2 of 4
TABLE 3SUMMARY OF GRAVIMETRIC AND METALS ANALYTICAL DATA - PM2.5
DTSC METAL SHREDDING FACILITIESSA RECYCLING TERMINAL ISLAND (SARTI), 901 NEW DOCK STREET, TERMINAL ISLAND, CALIFORNIA
CONTRACT NO. 15-T4124
Client ID Sample DateChlorine
(Cl)(µg/m3)
Potassium (K)
(µg/m3)
Calcium (Ca)
(µg/m3)
Titanium (Ti)
(µg/m3)
Vanadium (V)
(µg/m3)
Chromium (Cr)
(µg/m3)
Manganese (Mn)
(µg/m3)
Iron (Fe)(µg/m3)
Cobalt (Co)
(µg/m3)
Nickel (Ni)(µg/m3)
Copper (Cu)(µg/m3)
SARTI1-T1-PM2.5 10/12/2016 0.0447 0.0480 0.1306 0.0091 0.0042 0.0009 0.0036 0.1549 0.0000 0.0014 0.0167SARTI1-T2-PM2.5 10/13/2016 0.0169 0.0404 0.1073 0.0049 0.0024 0.0011 0.0028 0.1306 0.0004 0.0007 0.0168SARTI1-T3-PM2.5 10/14/2016 0.0197 0.0393 0.0949 0.0066 0.0029 0.0009 0.0026 0.1240 0.0000 0.0010 0.0153
SARTI2-T1-PM2.5 10/12/2016 0.0234 0.0348 0.0522 0.0033 0.0027 0.0002 0.0045 0.1237 0.0000 0.0015 0.0069SARTI2-T2-PM2.5 10/13/2016 0.0112 0.0345 0.0488 0.0048 0.0021 0.0004 0.0030 0.0784 0.0000 0.0010 0.0189SARTI2-T3-PM2.5 10/14/2016 0.0205 0.0372 0.0442 0.0042 0.0024 0.0000 0.0018 0.0894 0.0000 0.0013 0.0148
SARTI3-T1-PM2.5 10/12/2016 0.0191 0.0409 0.0568 0.0053 0.0045 0.0005 0.0016 0.0965 0.0000 0.0018 0.0069SARTI3-T2-PM2.5 10/13/2016 0.0094 0.0336 0.0581 0.0040 0.0020 0.0000 0.0018 0.0967 0.0000 0.0008 0.0088SARTI3-T3-PM2.5 10/14/2016 0.0193 0.0388 0.0533 0.0064 0.0027 0.0016 0.0024 0.1001 0.0000 0.0013 0.0078
SARTI4-T1-PM2.5 10/12/2016 0.0599 0.0508 0.1209 0.0082 0.0037 0.0010 0.0102 0.4986 0.0000 0.0028 0.0335SARTI4-T2-PM2.5 10/13/2016 0.0353 0.0389 0.0955 0.0068 0.0014 0.0000 0.0047 0.1729 0.0000 0.0015 0.0265SARTI4-T3-PM2.5 10/14/2016 0.0712 0.0446 0.1025 0.0058 0.0035 0.0005 0.0033 0.2816 0.0000 0.0014 0.0189
Field DuplicateSARTI5-T2-PM2.5 10/13/2016 0.0138 0.0368 0.0585 0.0054 0.0012 0.0000 0.0031 0.0882 0.0002 0.0013 0.0161SARTI5-T3-PM2.5 10/14/2016 0.0198 0.0404 0.0451 0.0049 0.0028 0.0000 0.0027 0.0911 0.0000 0.0008 0.0182
Field BlankSARTI1-T1-PM2.5-FB 1 10/12/2016 0.0113 0.0192 0.0045 0.0000 0.0000 0.0000 0.0226 0.0056 0.0000 0.0000 0.0000SARTI4-T2-PM2.5-FB 1 10/13/2016 0.0226 0.0000 0.0000 0.0000 0.0000 0.0000 0.0034 0.0000 0.0000 0.0000 0.0102
Trip BlankSARTI-TB-PM2.5 1 10/14/2016 0.0226 0.0000 0.0000 0.0113 0.0000 0.0011 0.0045 0.0079 0.0000 0.0000 0.0000
Lab BlankLab Blank 1 0.0000 0.0147 0.0000 0.0011 0.0000 0.0158 0.0000 0.0124 0.0000 0.0000 0.0000Lab Blank 1 0.0294 0.0000 0.0000 0.0079 0.0068 0.0000 0.0079 0.0170 0.0000 0.0000 0.0000Lab Blank 1 0.0158 0.0000 0.0079 0.0000 0.0000 0.0000 0.0000 0.0113 0.0068 0.0011 0.0000Lab Blank 1 0.0000 0.0170 0.0000 0.0000 0.0000 0.0158 0.0068 0.0000 0.0170 0.0000 0.0000

Geocon Project No. S9850-03-21December 23, 2016Page 3 of 4
TABLE 3SUMMARY OF GRAVIMETRIC AND METALS ANALYTICAL DATA - PM2.5
DTSC METAL SHREDDING FACILITIESSA RECYCLING TERMINAL ISLAND (SARTI), 901 NEW DOCK STREET, TERMINAL ISLAND, CALIFORNIA
CONTRACT NO. 15-T4124
Client ID Sample DateZinc (Zn)(µg/m3)
Gallium (Ga)
(µg/m3)
Germanium (Ge)(µg/m3)
Arsenic (As)
(µg/m3)
Selenium (Se)
(µg/m3)
Bromine (Br)
(µg/m3)
Rubidium (Rb)(µg/m3)
Strontium (Sr)
(µg/m3)
Yttrium (Y)
(µg/m3)
Zirconium (Zr)
(µg/m3)
Molyb-denum (Mo)
(µg/m3)
SARTI1-T1-PM2.5 10/12/2016 0.0434 0.0003 0.0000 0.0005 0.0000 0.0025 0.0002 0.0013 0.0000 0.0004 0.0000SARTI1-T2-PM2.5 10/13/2016 0.0255 0.0000 0.0002 0.0000 0.0006 0.0035 0.0005 0.0004 0.0000 0.0011 0.0020SARTI1-T3-PM2.5 10/14/2016 0.0115 0.0002 0.0000 0.0009 0.0002 0.0056 0.0002 0.0011 0.0012 0.0000 0.0000
SARTI2-T1-PM2.5 10/12/2016 0.0095 0.0000 0.0000 0.0000 0.0006 0.0017 0.0000 0.0012 0.0000 0.0000 0.0011SARTI2-T2-PM2.5 10/13/2016 0.0088 0.0000 0.0000 0.0000 0.0003 0.0031 0.0000 0.0005 0.0005 0.0005 0.0016SARTI2-T3-PM2.5 10/14/2016 0.0076 0.0000 0.0000 0.0005 0.0009 0.0049 0.0000 0.0000 0.0000 0.0002 0.0031
SARTI3-T1-PM2.5 10/12/2016 0.0140 0.0001 0.0002 0.0000 0.0008 0.0026 0.0005 0.0000 0.0000 0.0000 0.0000SARTI3-T2-PM2.5 10/13/2016 0.0100 0.0003 0.0000 0.0011 0.0005 0.0037 0.0000 0.0007 0.0002 0.0000 0.0016SARTI3-T3-PM2.5 10/14/2016 0.0214 0.0005 0.0000 0.0007 0.0000 0.0066 0.0006 0.0001 0.0000 0.0008 0.0000
SARTI4-T1-PM2.5 10/12/2016 0.0159 0.0000 0.0000 0.0040 0.0001 0.0021 0.0006 0.0009 0.0006 0.0007 0.0009SARTI4-T2-PM2.5 10/13/2016 0.0194 0.0003 0.0003 0.0000 0.0000 0.0045 0.0006 0.0007 0.0005 0.0008 0.0000SARTI4-T3-PM2.5 10/14/2016 0.0160 0.0000 0.0000 0.0001 0.0003 0.0059 0.0003 0.0013 0.0000 0.0002 0.0015
Field DuplicateSARTI5-T2-PM2.5 10/13/2016 0.0088 0.0000 0.0000 0.0000 0.0004 0.0037 0.0000 0.0003 0.0000 0.0004 0.0000SARTI5-T3-PM2.5 10/14/2016 0.0078 0.0003 0.0000 0.0008 0.0004 0.0059 0.0006 0.0006 0.0000 0.0013 0.0005
Field BlankSARTI1-T1-PM2.5-FB 1 10/12/2016 0.0011 0.0068 0.0000 0.0000 0.0000 0.0000 0.0023 0.0000 0.0000 0.0000 0.0000SARTI4-T2-PM2.5-FB 1 10/13/2016 0.0000 0.0000 0.0102 0.0000 0.0011 0.0000 0.0000 0.0000 0.0000 0.0305 0.0000
Trip BlankSARTI-TB-PM2.5 1 10/14/2016 0.0000 0.0000 0.0023 0.0011 0.0000 0.0000 0.0011 0.0113 0.0023 0.0000 0.0000
Lab BlankLab Blank 1 0.0000 0.0023 0.0000 0.0000 0.0090 0.0023 0.0000 0.0000 0.0023 0.0000 0.0023Lab Blank 1 0.0000 0.0023 0.0000 0.0000 0.0000 0.0056 0.0000 0.0000 0.0023 0.0000 0.0158Lab Blank 1 0.0000 0.0023 0.0000 0.0000 0.0000 0.0000 0.0000 0.0000 0.0113 0.0023 0.0000Lab Blank 1 0.0000 0.0079 0.0000 0.0034 0.0045 0.0000 0.0068 0.0000 0.0000 0.0000 0.0000
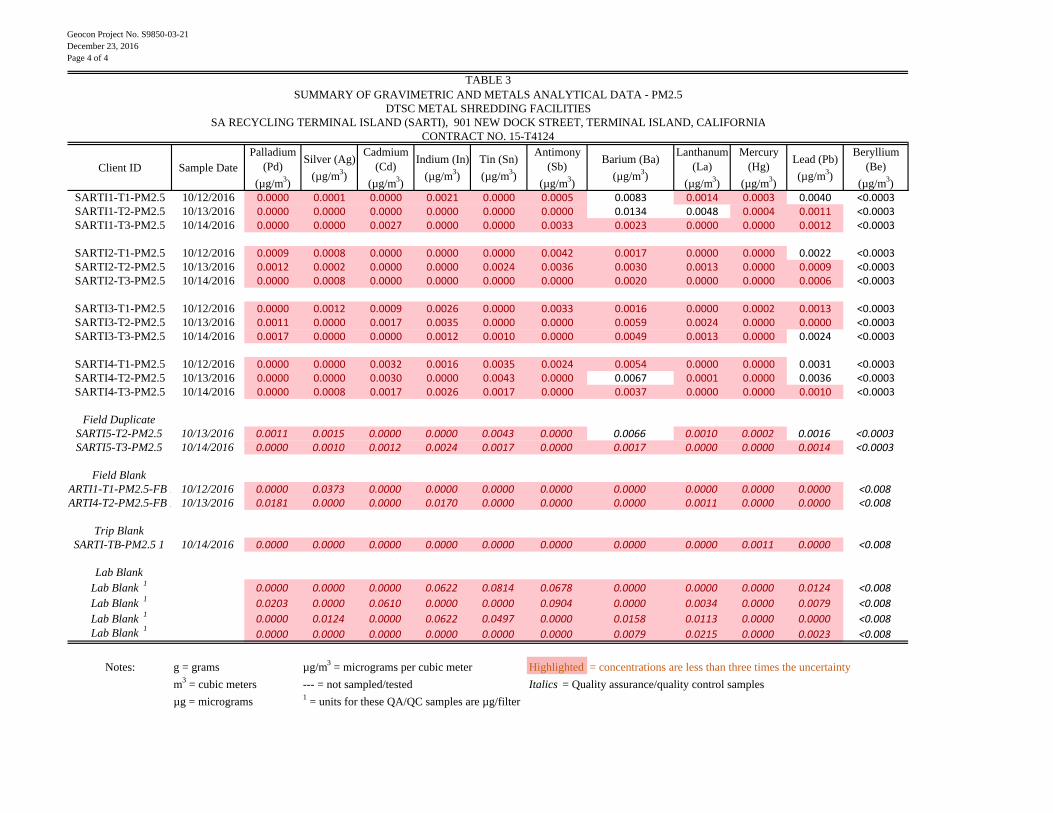
Geocon Project No. S9850-03-21December 23, 2016Page 4 of 4
TABLE 3SUMMARY OF GRAVIMETRIC AND METALS ANALYTICAL DATA - PM2.5
DTSC METAL SHREDDING FACILITIESSA RECYCLING TERMINAL ISLAND (SARTI), 901 NEW DOCK STREET, TERMINAL ISLAND, CALIFORNIA
CONTRACT NO. 15-T4124
Client ID Sample DatePalladium
(Pd)(µg/m3)
Silver (Ag)(µg/m3)
Cadmium (Cd)
(µg/m3)
Indium (In)(µg/m3)
Tin (Sn)(µg/m3)
Antimony (Sb)
(µg/m3)
Barium (Ba)(µg/m3)
Lanthanum (La)
(µg/m3)
Mercury (Hg)
(µg/m3)
Lead (Pb)(µg/m3)
Beryllium (Be)
(µg/m3)SARTI1-T1-PM2.5 10/12/2016 0.0000 0.0001 0.0000 0.0021 0.0000 0.0005 0.0083 0.0014 0.0003 0.0040 <0.0003SARTI1-T2-PM2.5 10/13/2016 0.0000 0.0000 0.0000 0.0000 0.0000 0.0000 0.0134 0.0048 0.0004 0.0011 <0.0003SARTI1-T3-PM2.5 10/14/2016 0.0000 0.0000 0.0027 0.0000 0.0000 0.0033 0.0023 0.0000 0.0000 0.0012 <0.0003
SARTI2-T1-PM2.5 10/12/2016 0.0009 0.0008 0.0000 0.0000 0.0000 0.0042 0.0017 0.0000 0.0000 0.0022 <0.0003SARTI2-T2-PM2.5 10/13/2016 0.0012 0.0002 0.0000 0.0000 0.0024 0.0036 0.0030 0.0013 0.0000 0.0009 <0.0003SARTI2-T3-PM2.5 10/14/2016 0.0000 0.0008 0.0000 0.0000 0.0000 0.0000 0.0020 0.0000 0.0000 0.0006 <0.0003
SARTI3-T1-PM2.5 10/12/2016 0.0000 0.0012 0.0009 0.0026 0.0000 0.0033 0.0016 0.0000 0.0002 0.0013 <0.0003SARTI3-T2-PM2.5 10/13/2016 0.0011 0.0000 0.0017 0.0035 0.0000 0.0000 0.0059 0.0024 0.0000 0.0000 <0.0003SARTI3-T3-PM2.5 10/14/2016 0.0017 0.0000 0.0000 0.0012 0.0010 0.0000 0.0049 0.0013 0.0000 0.0024 <0.0003
SARTI4-T1-PM2.5 10/12/2016 0.0000 0.0000 0.0032 0.0016 0.0035 0.0024 0.0054 0.0000 0.0000 0.0031 <0.0003SARTI4-T2-PM2.5 10/13/2016 0.0000 0.0000 0.0030 0.0000 0.0043 0.0000 0.0067 0.0001 0.0000 0.0036 <0.0003SARTI4-T3-PM2.5 10/14/2016 0.0000 0.0008 0.0017 0.0026 0.0017 0.0000 0.0037 0.0000 0.0000 0.0010 <0.0003
Field DuplicateSARTI5-T2-PM2.5 10/13/2016 0.0011 0.0015 0.0000 0.0000 0.0043 0.0000 0.0066 0.0010 0.0002 0.0016 <0.0003SARTI5-T3-PM2.5 10/14/2016 0.0000 0.0010 0.0012 0.0024 0.0017 0.0000 0.0017 0.0000 0.0000 0.0014 <0.0003
Field BlankSARTI1-T1-PM2.5-FB 1 10/12/2016 0.0000 0.0373 0.0000 0.0000 0.0000 0.0000 0.0000 0.0000 0.0000 0.0000 <0.008SARTI4-T2-PM2.5-FB 1 10/13/2016 0.0181 0.0000 0.0000 0.0170 0.0000 0.0000 0.0000 0.0011 0.0000 0.0000 <0.008
Trip BlankSARTI-TB-PM2.5 1 10/14/2016 0.0000 0.0000 0.0000 0.0000 0.0000 0.0000 0.0000 0.0000 0.0011 0.0000 <0.008
Lab BlankLab Blank 1 0.0000 0.0000 0.0000 0.0622 0.0814 0.0678 0.0000 0.0000 0.0000 0.0124 <0.008Lab Blank 1 0.0203 0.0000 0.0610 0.0000 0.0000 0.0904 0.0000 0.0034 0.0000 0.0079 <0.008Lab Blank 1 0.0000 0.0124 0.0000 0.0622 0.0497 0.0000 0.0158 0.0113 0.0000 0.0000 <0.008Lab Blank 1 0.0000 0.0000 0.0000 0.0000 0.0000 0.0000 0.0079 0.0215 0.0000 0.0023 <0.008
Notes: g = grams µg/m3 = micrograms per cubic meter Highlighted = concentrations are less than three times the uncertaintym3 = cubic meters --- = not sampled/tested Italics = Quality assurance/quality control samplesµg = micrograms 1 = units for these QA/QC samples are µg/filter
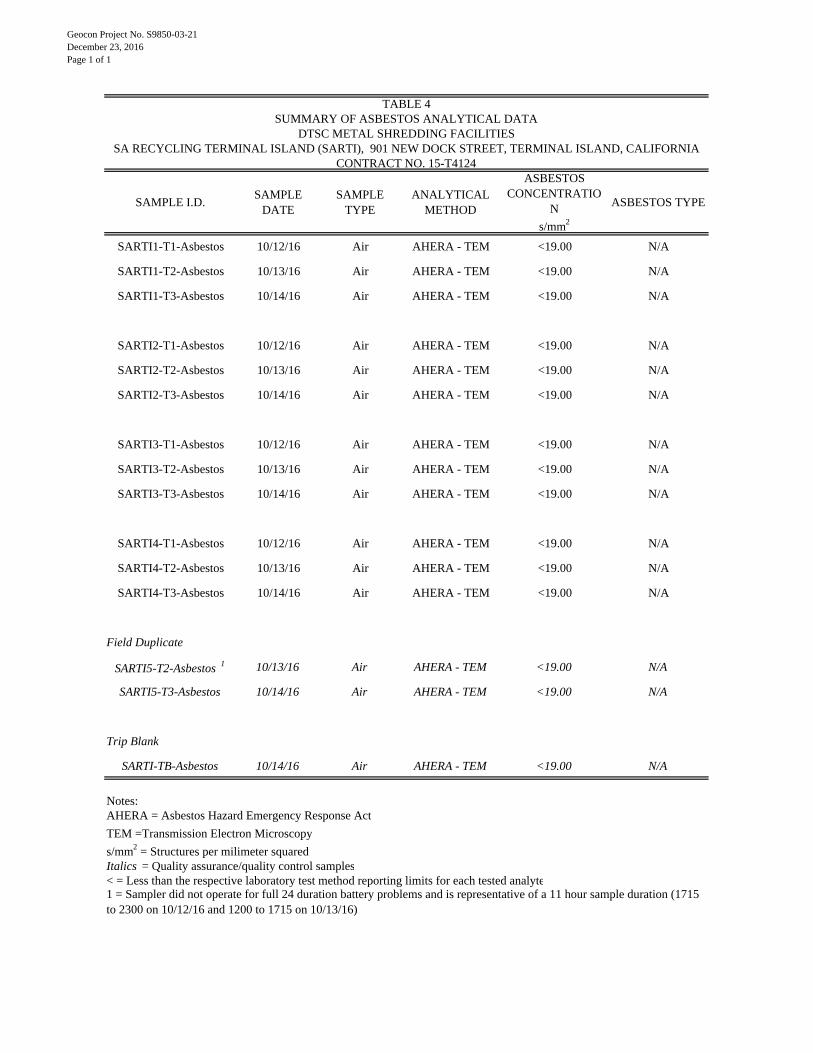
Geocon Project No. S9850-03-21December 23, 2016Page 1 of 1
SAMPLE I.D. SAMPLE DATE
SAMPLE TYPE
ANALYTICALMETHOD
ASBESTOS CONCENTRATIO
Ns/mm2
ASBESTOS TYPE
SARTI1-T1-Asbestos 10/12/16 Air AHERA - TEM <19.00 N/A
SARTI1-T2-Asbestos 10/13/16 Air AHERA - TEM <19.00 N/A
SARTI1-T3-Asbestos 10/14/16 Air AHERA - TEM <19.00 N/A
SARTI2-T1-Asbestos 10/12/16 Air AHERA - TEM <19.00 N/A
SARTI2-T2-Asbestos 10/13/16 Air AHERA - TEM <19.00 N/A
SARTI2-T3-Asbestos 10/14/16 Air AHERA - TEM <19.00 N/A
SARTI3-T1-Asbestos 10/12/16 Air AHERA - TEM <19.00 N/A
SARTI3-T2-Asbestos 10/13/16 Air AHERA - TEM <19.00 N/A
SARTI3-T3-Asbestos 10/14/16 Air AHERA - TEM <19.00 N/A
SARTI4-T1-Asbestos 10/12/16 Air AHERA - TEM <19.00 N/A
SARTI4-T2-Asbestos 10/13/16 Air AHERA - TEM <19.00 N/A
SARTI4-T3-Asbestos 10/14/16 Air AHERA - TEM <19.00 N/A
Field Duplicate
SARTI5-T2-Asbestos 1 10/13/16 Air AHERA - TEM <19.00 N/A
SARTI5-T3-Asbestos 10/14/16 Air AHERA - TEM <19.00 N/A
Trip Blank
SARTI-TB-Asbestos 10/14/16 Air AHERA - TEM <19.00 N/A
Notes:AHERA = Asbestos Hazard Emergency Response ActTEM =Transmission Electron Microscopys/mm2 = Structures per milimeter squared Italics = Quality assurance/quality control samples< = Less than the respective laboratory test method reporting limits for each tested analyte1 = Sampler did not operate for full 24 duration battery problems and is representative of a 11 hour sample duration (1715 to 2300 on 10/12/16 and 1200 to 1715 on 10/13/16)
TABLE 4SUMMARY OF ASBESTOS ANALYTICAL DATA
DTSC METAL SHREDDING FACILITIESSA RECYCLING TERMINAL ISLAND (SARTI), 901 NEW DOCK STREET, TERMINAL ISLAND, CALIFORNIA
CONTRACT NO. 15-T4124

Geocon Project No. S9850-03-21December 23, 2016Page 1 of 1
SAMPLE I.D. SAMPLE DATE
Aroclor-1016(µg/m3)
Aroclor-1221 (µg/m3)
Aroclor-1232 (µg/m3)
Aroclor-1242 (µg/m3)
Aroclor-1248 (µg/m3)
Aroclor-1254 (µg/m3)
Aroclor-1260 (µg/m3)
Aroclor-1262 (µg/m3)
SARTI1-T1-PCB 10/12/16 <0.0026 <0.0026 <0.0026 <0.0026 <0.0026 <0.0026 <0.0026 <0.0026SARTI1-T2-PCB 10/13/16 <0.0026 <0.0026 <0.0026 <0.0026 <0.0026 <0.0026 <0.0026 <0.0026SARTI1-T3-PCB 10/14/16 <0.0026 <0.0026 <0.0026 <0.0026 <0.0026 <0.0026 <0.0026 <0.0026
SARTI2-T1-PCB 10/12/16 <0.0026 <0.0026 <0.0026 <0.0026 <0.0026 <0.0026 <0.0026 <0.0026SARTI2-T2-PCB 10/13/16 <0.0026 <0.0026 <0.0026 <0.0026 <0.0026 <0.0026 <0.0026 <0.0026SARTI2-T3-PCB 10/14/16 <0.0026 <0.0026 <0.0026 <0.0026 <0.0026 <0.0026 <0.0026 <0.0026
SARTI3-T1-PCB 10/12/16 <0.0027 <0.0027 <0.0027 <0.0027 <0.0027 <0.0027 <0.0027 <0.0027SARTI3-T2-PCB 1 10/13/16 <0.0042 <0.0042 <0.0042 <0.0042 <0.0042 <0.0042 <0.0042 <0.0042SARTI3-T3-PCB 10/14/16 <0.0027 <0.0027 <0.0027 <0.0027 <0.0027 <0.0027 <0.0027 <0.0027
SARTI4-T1-PCB 10/12/16 <0.0026 <0.0026 <0.0026 <0.0026 <0.0026 <0.0026 <0.0026 <0.0026SARTI4-T2-PCB 10/13/16 <0.0026 <0.0026 <0.0026 <0.0026 <0.0026 <0.0026 <0.0026 <0.0026SARTI4-T3-PCB 10/14/16 <0.0026 <0.0026 <0.0026 <0.0026 <0.0026 <0.0026 <0.0026 <0.0026
Field DuplicatesSARTI5-T2-PCB 10/13/16 <0.0026 <0.0026 <0.0026 <0.0026 <0.0026 <0.0026 <0.0026 <0.0026SARTI5-T3-PCB 10/14/16 <0.0026 <0.0026 <0.0026 <0.0026 <0.0026 <0.0026 <0.0026 <0.0026
Trip BlankSARTI-TB-PCB 10/14/16 <0.0026 <0.0026 <0.0026 <0.0026 <0.0026 <0.0026 <0.0026 <0.0026
Notes:Notes: PCB = Polychlorinated biphenyls
µg/m3 = micrograms per cubic meterItalics = Quality assurance/quality control samples< = Less than the respective laboratory test method reporting limits for each tested analyte1 = Sampler did not operate for full 24 duration mechanical problems and is representative of a 15.3 hour sample duration
CONTRACT NO. 15-T4124
TABLE 5SUMMARY OF PCB ANALYTICAL DATA DTSC METAL SHREDDING FACILITIES
SA RECYCLING TERMINAL ISLAND (SARTI), 901 NEW DOCK STREET, TERMINAL ISLAND, CALIFORNIA

Geocon Project No. S9850-03-21December 23, 2016Page 1 of 1
SAMPLE I.D. SAMPLE DATE Formaldehyde (µg)
SARTI1-T1-FORM 10/12/16 3.3 1
SARTI1-T2-FORM 10/13/16 2.7
SARTI1-T3-FORM 10/14/16 3.1 1
SARTI2-T1-FORM 10/12/16 3.0 1
SARTI2-T2-FORM 10/13/16 2.2
SARTI2-T3-FORM 10/14/16 2.6 1
SARTI3-T1-FORM 10/12/16 2.0
SARTI3-T2-FORM 10/13/16 2.2
SARTI3-T3-FORM 10/14/16 2.1
SARTI4-T1-FORM 10/12/16 1.8
SARTI4-T2-FORM 10/13/16 2.2
SARTI4-T3-FORM 10/14/16 2.4 1
Field Duplicates
SARTI5-T2-FORM 10/13/16 3.2 1
SARTI5-T3-FORM 10/14/16 2.8 1
Trip Blank
SARTI-TB-FORM 10/14/16 <0.050
Notes:µg = micrograms Italics = Quality assurance/quality control samples< = Less than the respective laboratory test method reporting limits for each tested analyte1 = Reported value may be biased due to apparent matrix interferences.
TABLE 6SUMMARY OF FORMALDEHYDE ANALYTICAL DATA
DTSC METAL SHREDDING FACILITIESSA RECYCLING TERMINAL ISLAND (SARTI)
CONTRACT NO. 15-T4124901 NEW DOCK STREET, TERMINAL ISLAND, CALIFORNIA
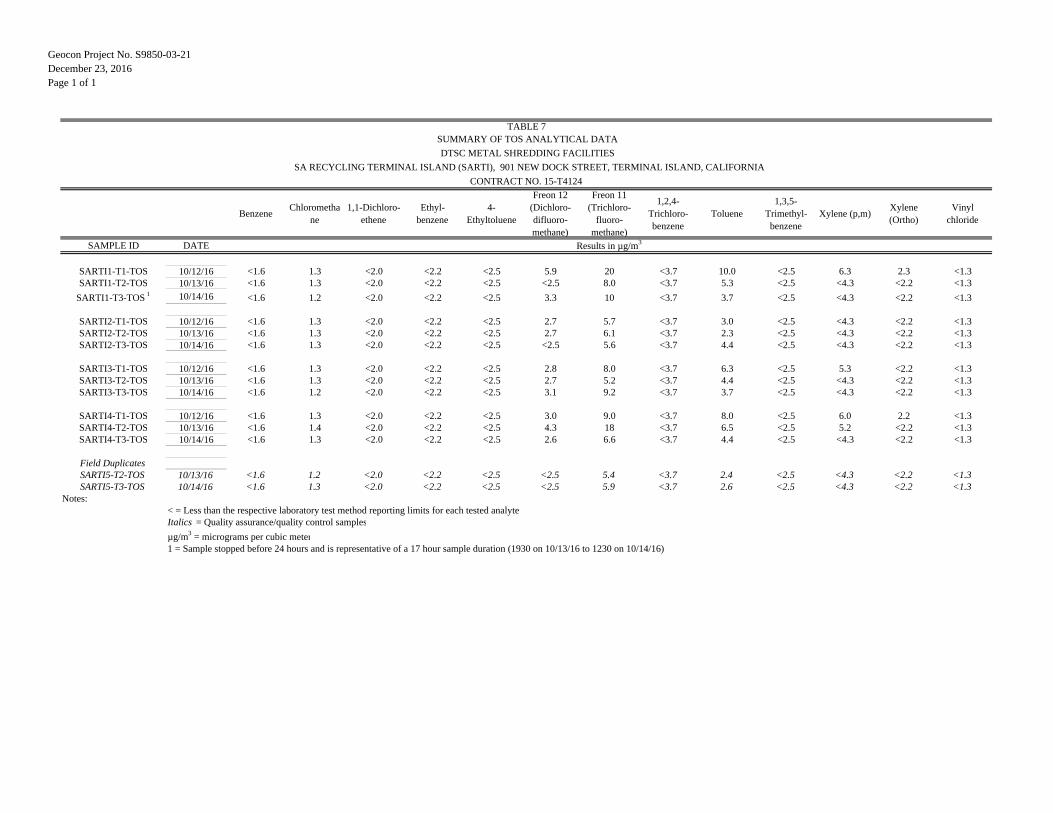
Geocon Project No. S9850-03-21December 23, 2016Page 1 of 1
Benzene Chloromethane
1,1-Dichloro-ethene
Ethyl-benzene
4-Ethyltoluene
Freon 12 (Dichloro-difluoro-methane)
Freon 11 (Trichloro-
fluoro-methane)
1,2,4-Trichloro-benzene
Toluene1,3,5-
Trimethyl-benzene
Xylene (p,m) Xylene (Ortho)
Vinyl chloride
SAMPLE ID DATE
SARTI1-T1-TOS 10/12/16 <1.6 1.3 <2.0 <2.2 <2.5 5.9 20 <3.7 10.0 <2.5 6.3 2.3 <1.3SARTI1-T2-TOS 10/13/16 <1.6 1.3 <2.0 <2.2 <2.5 <2.5 8.0 <3.7 5.3 <2.5 <4.3 <2.2 <1.3
SARTI1-T3-TOS 1 10/14/16 <1.6 1.2 <2.0 <2.2 <2.5 3.3 10 <3.7 3.7 <2.5 <4.3 <2.2 <1.3
SARTI2-T1-TOS 10/12/16 <1.6 1.3 <2.0 <2.2 <2.5 2.7 5.7 <3.7 3.0 <2.5 <4.3 <2.2 <1.3SARTI2-T2-TOS 10/13/16 <1.6 1.3 <2.0 <2.2 <2.5 2.7 6.1 <3.7 2.3 <2.5 <4.3 <2.2 <1.3SARTI2-T3-TOS 10/14/16 <1.6 1.3 <2.0 <2.2 <2.5 <2.5 5.6 <3.7 4.4 <2.5 <4.3 <2.2 <1.3
SARTI3-T1-TOS 10/12/16 <1.6 1.3 <2.0 <2.2 <2.5 2.8 8.0 <3.7 6.3 <2.5 5.3 <2.2 <1.3SARTI3-T2-TOS 10/13/16 <1.6 1.3 <2.0 <2.2 <2.5 2.7 5.2 <3.7 4.4 <2.5 <4.3 <2.2 <1.3SARTI3-T3-TOS 10/14/16 <1.6 1.2 <2.0 <2.2 <2.5 3.1 9.2 <3.7 3.7 <2.5 <4.3 <2.2 <1.3
SARTI4-T1-TOS 10/12/16 <1.6 1.3 <2.0 <2.2 <2.5 3.0 9.0 <3.7 8.0 <2.5 6.0 2.2 <1.3SARTI4-T2-TOS 10/13/16 <1.6 1.4 <2.0 <2.2 <2.5 4.3 18 <3.7 6.5 <2.5 5.2 <2.2 <1.3SARTI4-T3-TOS 10/14/16 <1.6 1.3 <2.0 <2.2 <2.5 2.6 6.6 <3.7 4.4 <2.5 <4.3 <2.2 <1.3
Field DuplicatesSARTI5-T2-TOS 10/13/16 <1.6 1.2 <2.0 <2.2 <2.5 <2.5 5.4 <3.7 2.4 <2.5 <4.3 <2.2 <1.3SARTI5-T3-TOS 10/14/16 <1.6 1.3 <2.0 <2.2 <2.5 <2.5 5.9 <3.7 2.6 <2.5 <4.3 <2.2 <1.3
Notes:< = Less than the respective laboratory test method reporting limits for each tested analyteItalics = Quality assurance/quality control samplesµg/m3 = micrograms per cubic meter1 = Sample stopped before 24 hours and is representative of a 17 hour sample duration (1930 on 10/13/16 to 1230 on 10/14/16)
Results in µg/m3
TABLE 7SUMMARY OF TOS ANALYTICAL DATA DTSC METAL SHREDDING FACILITIES
SA RECYCLING TERMINAL ISLAND (SARTI), 901 NEW DOCK STREET, TERMINAL ISLAND, CALIFORNIACONTRACT NO. 15-T4124
Top Related