


Languages
Pages
Legal


1
Running SQL Server 2008 in a Hyper-V Environment Best Practices and Performance Considerations
SQL Server Technical Article
Writers: Lindsey Allen, Mike Ruthruff, Prem Mehra
Technical Reviewers: Cindy Gross, Burzin Petal, Denny Lee, Michael Thomassy, Sanjay
Mishra, Savitha Padmanabhan, Tony Voellm, Bob Ward
Published: October 2008
Applies to: SQL Server 2008
Summary:
Hyper-V in Windows Server 2008 is a powerful virtualization technology that can be used by
corporate IT to consolidate under-utilized servers, lowering TCO and maintaining or improving
Quality of Service. Through a series of test scenarios that are representative of SQL Server
application fundamentals, this document provides best practice recommendations on running
SQL Server in Windows Hyper-V environment.

2
Copyright
The information contained in this document represents the current view of Microsoft Corporation
on the issues discussed as of the date of publication. Because Microsoft must respond to
changing market conditions, it should not be interpreted to be a commitment on the part of
Microsoft, and Microsoft cannot guarantee the accuracy of any information presented after the
date of publication.
This white paper is for informational purposes only. MICROSOFT MAKES NO WARRANTIES,
EXPRESS, IMPLIED, OR STATUTORY, AS TO THE INFORMATION IN THIS DOCUMENT.
Complying with all applicable copyright laws is the responsibility of the user. Without limiting the
rights under copyright, no part of this document may be reproduced, stored in, or introduced into
a retrieval system, or transmitted in any form or by any means (electronic, mechanical,
photocopying, recording, or otherwise), or for any purpose, without the express written
permission of Microsoft Corporation.
Microsoft may have patents, patent applications, trademarks, copyrights, or other intellectual
property rights covering subject matter in this document. Except as expressly provided in any
written license agreement from Microsoft, the furnishing of this document does not give you any
license to these patents, trademarks, copyrights, or other intellectual property.
Unless otherwise noted, the example companies, organizations, products, domain names, e-
mail addresses, logos, people, places, and events depicted herein are fictitious, and no
association with any real company, organization, product, domain name, e-mail address, logo,
person, place, or event is intended or should be inferred.
© 2008 Microsoft Corporation. All rights reserved.
Microsoft, Hyper-V, SQL Server, Windows, and Windows Server are trademarks of the
Microsoft group of companies.
All other trademarks are property of their respective owners.

3
Contents
Introduction .................................................................................................................................................. 4
Setup and Configuration of Hyper-V Configurations .................................................................................... 4
Hyper-V Preinstall Checklist and Considerations ...................................................................................... 4
Storage Configuration Recommendations ................................................................................................ 5
Test Methodology and Workloads ................................................................................................................ 5
Test Workloads ....................................................................................................................................... 65
Monitoring SQL Server on Hyper-V Configurations .................................................................................. 7
Test Results, Observations, and Recommendations ................................................................................... 10
Performance Overhead of Running SQL Server in Hyper-V .................................................................... 10
Pass-Through Disks I/O Overhead - SQLIO ...................................................................................... 1110
Virtual Machine Performance Overhead: OLTP Workload ............................................................. 1312
Reporting Query Performance Comparison ................................................................................... 1716
Database Operations ...................................................................................................................... 1817
SQL Server Consolidation Scenarios Using Hyper-V ........................................................................... 2221
Comparing Storage Configurations in Consolidation Environment ................................................ 2322
Virtual Instance Scalability .............................................................................................................. 2524
Virtual Instance Performance with Overcommitted CPU Resources.............................................. 2726
Comparing Consolidation Options .................................................................................................. 2827
Conclusion ............................................................................................................................................... 2928
Observations: ...................................................................................................................................... 2928
Recommendations: ............................................................................................................................. 3029
For More Information ............................................................................................................................. 30
Appendix 1: Hyper-V Architecture .......................................................................................................... 3231
Appendix 2 Hardware requirements ...................................................................................................... 3534
Memory ............................................................................................................................................... 3534
Processors ........................................................................................................................................... 3534
Networking.......................................................................................................................................... 3635
Storage ................................................................................................................................................ 3635
Appendix 3 Hardware Configuration ...................................................................................................... 3736

4
Introduction
Based on hypervisor technology, the Hyper-V™ virtualization feature in the Windows Server®
2008 operating system is a thin layer of software between the hardware and the operating system
that allows multiple operating systems to run, unmodified, on a host computer at the same time.
Hyper-V is a powerful virtualization technology that can be used by corporate IT to consolidate
under-utilized servers, lowering total cost of ownership (TCO) and maintaining or improving
quality of service (QoS). Hyper-V opens more potential development and test environment types
that otherwise might be constrained by hardware availability.
It is challenging enough in general to right-size the hardware to consolidate current workloads
and provide headroom for growth. Adding virtualization to the mix increases the potential
capacity planning challenges. The goal of this document is to help address these by focusing on
two key areas of running Microsoft® SQL Server® in a Hyper-V environment:
System resource overhead imposed by running SQL Server in a Hyper-V environment
How well Hyper-V scales running SQL Server 2008
This white paper describes a series of test configurations we ran, which represented a variety of
possible scenarios involving SQL Server running in Hyper-V. The paper discusses our results
and observations, and it also presents our recommendations. Our test results showed that SQL
Server 2008 on Hyper-V provides stable performance and scalability. We believe Windows
Server 2008 Hyper-V is a solid platform for SQL Server 2008 for the appropriate workload. It is
practical to run production workloads under a Hyper-V environment, as long as the workload is
within the capacity of your Hyper-V guest virtual machine.
Setup and Configuration of Hyper-V Configurations
This section contains a simplified Hyper-V installation checklist. For more information about
Hyper-V, see the list of additional white papers at the end of this white paper and Appendix 3,
where we describe the hardware we used for the testing.
Hyper-V Preinstall Checklist and Considerations
Use a server processor that supports hardware-assisted virtualization. There are two to
choose from:
o Inter VT
o AMD virtualization (AMD-V)
Ensure that hardware-assisted virtualization and Data Execution Prevention (DEP) are
present and enabled. (You can verify this in the BIOS setting.)
Run the Hyper-V server role on the root partition only of the Windows® operating
system.

5
Set any disks that will be configured as pass-through disks for the guest virtual machine
as offline in root partition using DISKPART or Volume Manager.
Ensure that the integration components (―enlightenments‖) are installed on the guest
virtual machine.
Use a network adapter instead of a legacy network adapter when configuring networking
for the virtual machine.
Avoid emulated devices for SQL Server deployments when possible. These devices can
result in significantly more CPU overhead when compared to synthetic devices.
Storage Configuration Recommendations
As with any SQL Server deployment, properly sized and configured I/O is critical for
performance. Configuring storage in virtualized environments is no exception, and the storage
hardware should provide sufficient I/O throughput as well as storage capacity to meet the current
and future needs of the virtual machines planned. Make sure to follow all predeployment storage
best practices when you configure your storage.
Hyper-V supports several different types of storage options. Each of the storage options can be
attached via an IDE or SCSI controller. For SQL Server data and log files, we used the virtual
SCSI controller configuration option. SQL Server is I/O intensive, so we recommend you limit
your choices to the two best-performing options:
Pass-through disk
Fixed-size Virtual Hard Disks (VHDs) Dynamic VHDs are not recommended for performance
reasons. This is because for dynamic VHD, the blocks in the disk start as zeroed blocks, but they
are not backed by any actual space in the file. Reads from such blocks return a block of zeros.
When a block is first written to, the virtualization stack must allocate space within the VHD file
for the block and then update the metadata. In addition to this, every time an existing block is
referenced, the block mapping must be looked up in the metadata. This increases both the
number of disk I/Os for read and write activities and CPU usage. The dynamic growth also
requires the server administrator to monitor disk capacity to ensure that there is sufficient disk
storage as the storage requirements increase. Fixed-size VHDs can be expanded if needed, but
this requires that the guest virtual machine be shut down during the operation.
We used both pass-through and fixed-size VHD storage configurations in the test scenarios for
this paper. In all configurations synthetic SCSI controllers were used for the guest virtual
machines. For more information about the hardware we used for these tests, see Appendix 3.
(Note: Synthetic IDE was not tested.)
Test Methodology and Workloads
We chose a series of test scenarios to determine best practices and performance considerations
for running SQL Server 2008 applications in a Hyper-V environment. Our first set of test

6
scenarios are designed to understand the performance overhead of native environment vs. Hyper-
V guest virtual machine environment. Our second set of test scenarios are designed to understand
the characteristics of scaling a guest virtual machine on one host server.
Test Workloads
Several workloads were used to measure performance of the different scenarios. In this white
paper, native refers to a Windows installation without Hyper-V enabled; root refers to the parent
partition within a Windows Hyper-V configuration with Hyper-V enabled; and guest virtual
machine refers to the guest virtual machine hosted on the root (or parent) partition of Windows.
The main focus of these scenarios was the following:
Compare the performance of SQL Server running on the root vs. within a guest
virtual machine.
Compare the performance of multiple SQL Server instances running on a native
Windows instance with SQL Server running single instances within multiple guest
virtual machines.
Observe the scalability of SQL Server workload throughput as the number of guest
virtual machines running on a single root partition is increased.
Workloads used for this testing, their characteristics, and targeted scenarios for each workload
are described in the following table.
Table 1: Workloads and Scenarios
Workload General characteristics Targeted scenarios SQLIO
Generates IO workload. Comparing I/O performance on
native vs. guest virtual
machine.
OLTP
workload
OLTP type workload simulating a
customer-facing brokerage
application. For more information
about hardware configuration, see
Appendix 3.
Workload performance
comparison between native,
root, and guest virtual machine.
Comparing multiple SQL
Server instances running on a
native instance of Windows vs.
multiple guest virtual machines,
each running a single SQL
Server instance.
Workload throughput scaling as
number of guests is increased.
Reporting
workload
Reporting queries, which
consume large amounts of CPU
and I/O resources.
Comparing reporting query
performance between native,
root, and guest virtual machine.

7
SQL Server
operational
workload
Backup/restore, index rebuild,
DBCC CHECKDB. Comparing performance of
database operations between
native, root, and guest virtual
machine.
The following list contains more specific information about the scenarios targeted by each of the
workloads run:
SQLIO test: SQLIO is a tool for determining the I/O capacity of a given configuration.
This test scenario was designed to determine the I/O overhead when running a guest
virtual machine using pass-through disks for the storage configuration.
OLTP workload. This test scenario:
o Compares performance of SQL Server running natively on Windows to the
performance running under a guest virtual machine. For this comparison, both the
native instance and guest virtual machine were configured with equivalent
hardware configurations.
o Compares the performance of SQL Server using various storage configurations
for data and log files. Comparisons of pass-through disks configuration vs. VHD
configurations as well as different underlying storage array configurations (i.e.,
shared vs. dedicated storage configurations).
o Compares the performance of multiple SQL Server instances running natively on
Windows to an equivalent number of guest virtual machines, each configured
with a single instance of SQL Server.
o Observes workload scaling as more guest virtual machines are added to the root
partition of a single physical server. In this case, we observed cases where:
The number of physical CPU cores was equal to the sum of logical CPU
cores for all guest virtual machines.
The number of physical CPU cores was less than the sum of all logical
CPU cores across all guest virtual machines (referred to as CPU resources
being ―overcommitted‖).
Reporting workload: This scenario compares the performance of SQL Server running
natively on Windows to the performance of SQL Server running within a guest virtual
machine with on an equivalent hardware configuration.
Database operations: This scenario compares the performance of SQL Server running
natively on Windows to the performance of SQL Server running within a guest virtual
machine with on an equivalent hardware configuration.
For the scenarios that used the OLTP workload, several different workload levels were used to
observe behavior differences under differing CPU levels. Details of these different workload
levels will be discussed later in this white paper.
Monitoring SQL Server on Hyper-V Configurations
There are several considerations when you monitor the performance of SQL Server workloads
running in Hyper-V configurations using Windows System Monitor (often referred to as

8
perfmon). To get a true measure of resource usage, it is necessary to use Hyper-V counters
exposed by Windows in the root partition. An in depth discussion of Hyper-V monitoring is
beyond the scope of this paper. For more information, see Appendix 3.
During this testing we made several observations with respect to performance monitoring. The
majority of the considerations are related to measurements of CPU use. When monitoring CPU
utilization on a server running Hyper-V, you should use the Hyper-V Processor counters exposed
on the root partition. Hyper-V exposes three primary counters that relate to CPU utilization:
Hyper-V Hypervisor Logical Processor: Provides the most accurate of total CPU
resources consumed across the entire physical server.
Hyper-V Hypervisor Root Virtual Processor: Provides the most accurate measure of CPU
resources consumed by the root partition.
Hyper-V Hypervisor Virtual Processor: Provides the most accurate measure of CPU
consumption for specific guest virtual machines.
The traditional % Processor Time counters can be monitored within the root partition; however,
due to the fact there are layers of virtualization not exposed to these processor counters, they
may not reflect accurate CPU resources utilized. When you monitor performance, measure CPU
use using Hyper-V counters on any server running the Hyper-V role with the hypervisor enabled.
More details can be found in Tony Voellm‘s blog series on Hyper-V performance monitoring.
Figure 1 illustrates each of these counters. In this picture, the top set of counters (\\SQLBP08R900)
is monitored on the root partition, and the bottom set (\\sqlhv1) is counters monitored from the
perspective of the guest. Keep in mind that for this example, there are 16 physical CPU cores
visible to the root partition and four logical CPU cores visible to the guest virtual machine. Also
note that although there were two guest virtual machines running on the root, for space reasons
only one is shown in the graphic. The four logical processor counters for the second virtual
machine continue on right side of the graph.

9
Figure 1: Hyper-V perfmon counters
For more information about monitoring and these specific issues, see the virtualization section of
the Windows 2008 performance tuning guidelines and the Hyper-V performance counters blogs.
When it comes to monitoring SQL Server, there are no special considerations when running
within a guest virtual machine. SQL Server counters are generally either a measure of
consumption (SQL Server-specific resources) or throughput. In addition, SQL Server counters
are not exposed to the root partition when they run within a guest virtual machine; they must be
monitored from within the guest virtual machine.
Measuring I/O performance is different depending on how the guest storage is configured.
Latency is a measure of the elapsed time, and it can be measured with reasonable accuracy from
either the root or the guest. Some general considerations with monitoring disk performance
follow:
You can use either the logical or physical disk counters within the guest virtual machine
to monitor I/O performance. We noticed very little difference between the values
reported by the counters from the root partition and those reported within the guest virtual
machine; however, we did see slightly higher latency values (Avg. Disk/sec Read and
Write) when we monitored from within the guest virtual machine than we did when we
monitored from the root. This is because I/O may take slightly longer to complete from
the perspective of the virtual machine.
If the guest virtual machine storage is configured as pass-through, the disk will be offline
at the root partition level and will not show up under the logical disk counters within the
root partition. To monitor performance of pass-through disks at the root partition, the
physical disk counters must be used. At the time of the tests, there are known issues
within Windows Server 2008 physical disk counters when multi-pathing solutions are
used. The issues have been corrected in latest GDR of System Center Virtual Machine
Manager.
When guest virtual machines are configured to use VHD files for storage and those VHD
files reside on common physical disks, monitoring the disk counters from the guest
virtual machine will provide details about I/O for the specific VHD. Monitoring the
volume containing all of the VHD files at the root partition will provide aggregate values
for all I/O issued against the disk or volume.
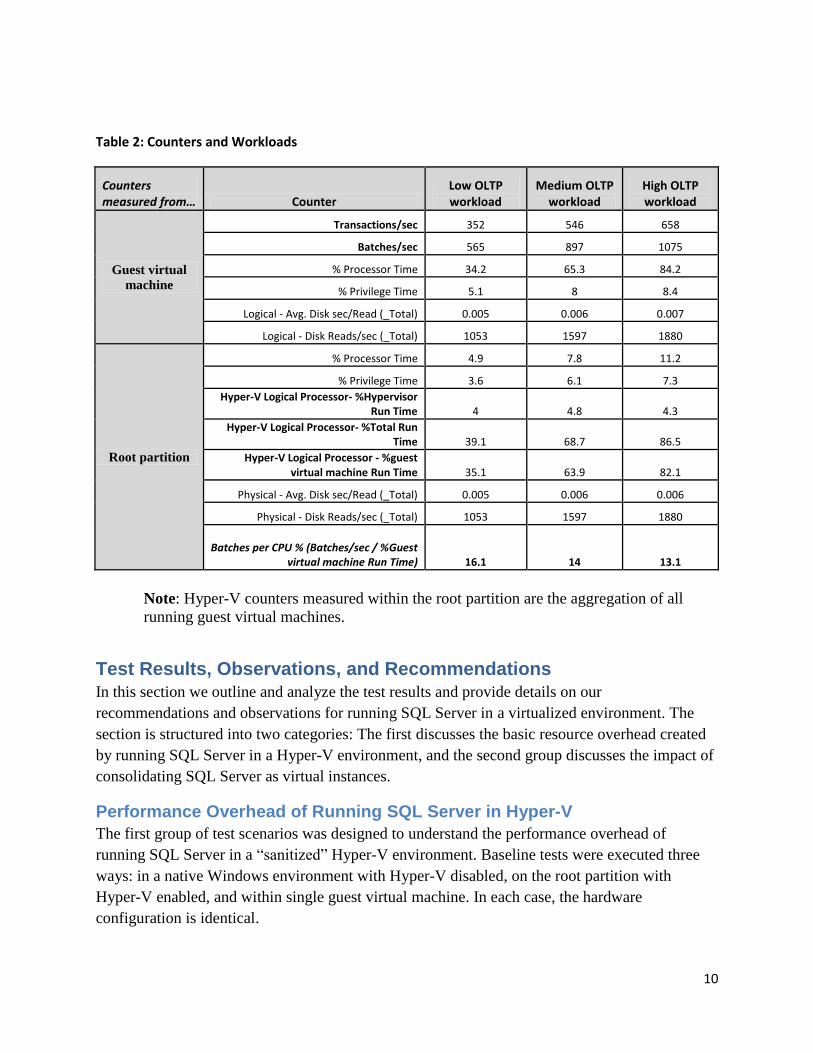
Table 2 show the types of counters collected during workload runs for the OLTP workload
portion of our tests. It illustrates the differences reported in the performance counters when
monitoring from the guest virtual machine vs. the root partition.
10
Table 2: Counters and Workloads
Counters measured from… Counter
Low OLTP workload
Medium OLTP workload
High OLTP workload
Guest virtual
machine
Transactions/sec 352 546 658
Batches/sec 565 897 1075
% Processor Time 34.2 65.3 84.2
% Privilege Time 5.1 8 8.4
Logical - Avg. Disk sec/Read (_Total) 0.005 0.006 0.007
Logical - Disk Reads/sec (_Total) 1053 1597 1880
Root partition
% Processor Time 4.9 7.8 11.2
% Privilege Time 3.6 6.1 7.3
Hyper-V Logical Processor- %Hypervisor Run Time 4 4.8 4.3
Hyper-V Logical Processor- %Total Run Time 39.1 68.7 86.5
Hyper-V Logical Processor - %guest virtual machine Run Time 35.1 63.9 82.1
Physical - Avg. Disk sec/Read (_Total) 0.005 0.006 0.006
Physical - Disk Reads/sec (_Total) 1053 1597 1880
Batches per CPU % (Batches/sec / %Guest virtual machine Run Time) 16.1 14 13.1
Note: Hyper-V counters measured within the root partition are the aggregation of all
running guest virtual machines.
Test Results, Observations, and Recommendations In this section we outline and analyze the test results and provide details on our
recommendations and observations for running SQL Server in a virtualized environment. The
section is structured into two categories: The first discusses the basic resource overhead created
by running SQL Server in a Hyper-V environment, and the second group discusses the impact of
consolidating SQL Server as virtual instances.
Performance Overhead of Running SQL Server in Hyper-V
The first group of test scenarios was designed to understand the performance overhead of
running SQL Server in a ―sanitized‖ Hyper-V environment. Baseline tests were executed three
ways: in a native Windows environment with Hyper-V disabled, on the root partition with
Hyper-V enabled, and within single guest virtual machine. In each case, the hardware
configuration is identical.

11
Note: Native instance refers to a SQL Server instance running in a native Windows environment,
and virtual instance refers to a SQL Server instance running in guest virtual machine.
This section includes the following test scenarios:
Determine I/O overhead of pass-through disks using SQLIO
Compare OLTP workload performance in a single native instance and a virtual instance
Compare reporting query performance comparison in a native instance and a virtual
instance
Observe virtualization impact on common database operations:
o Compressed backup and restore
o Index rebuild
o DBCC CHECKDB
Pass-Through Disks I/O Overhead - SQLIO
I/O overhead used to be a challenge in virtualized environments. It could be a showstopper for
I/O intensive applications like SQL Server. With Hyper-V, the technology is different. To
understand the best-case scenario, our first test scenario looked at I/O overhead using the most
optimized I/O configuration – dedicated pass-through disks. We chose pass-through disk
configuration because it has the shortest code path from host to I/O subsystem. In the tests, the
same number of physical spindles was allocated to the root partition and the guest virtual
machine. Through repeated tests of various random and sequential I/O, we found the I/O
overhead of Hyper-V using pass-through disks is from none to minimal. For more information,
including an in-depth performance analysis of pass-through disk and virtual hard disk, see the
upcoming white paper by Tony Voellm and Liang Yang, ―Windows Server 2008 Hyper-V
Virtual Hard Disk and Pass-through Disk Performance.‖ More details on Hyper-V storage
performance analysis could also be found here
(http://blogs.msdn.com/tvoellm/archive/2008/09/24/what-hyper-v-storage-is-best-for-you-show-me-
the-numbers.aspx).
Storage Configuration
The pass-through disk configuration for the root and the virtual machine were identical. Each
configuration was presented with logical unit numbers (LUNs) from the storage array that used
the same number of physical disk resources. There was no sharing at the disk level between any
of the LUNs; in another words, there is no spindle sharing among the LUNs. Figure 2 shows the
configuration presented to each.

12
Figure 2: Storage configuration pass-through
Performance of Pass-Through Configuration
To baseline the throughput, the same SQLIO tests were run on all guest virtual machines and the
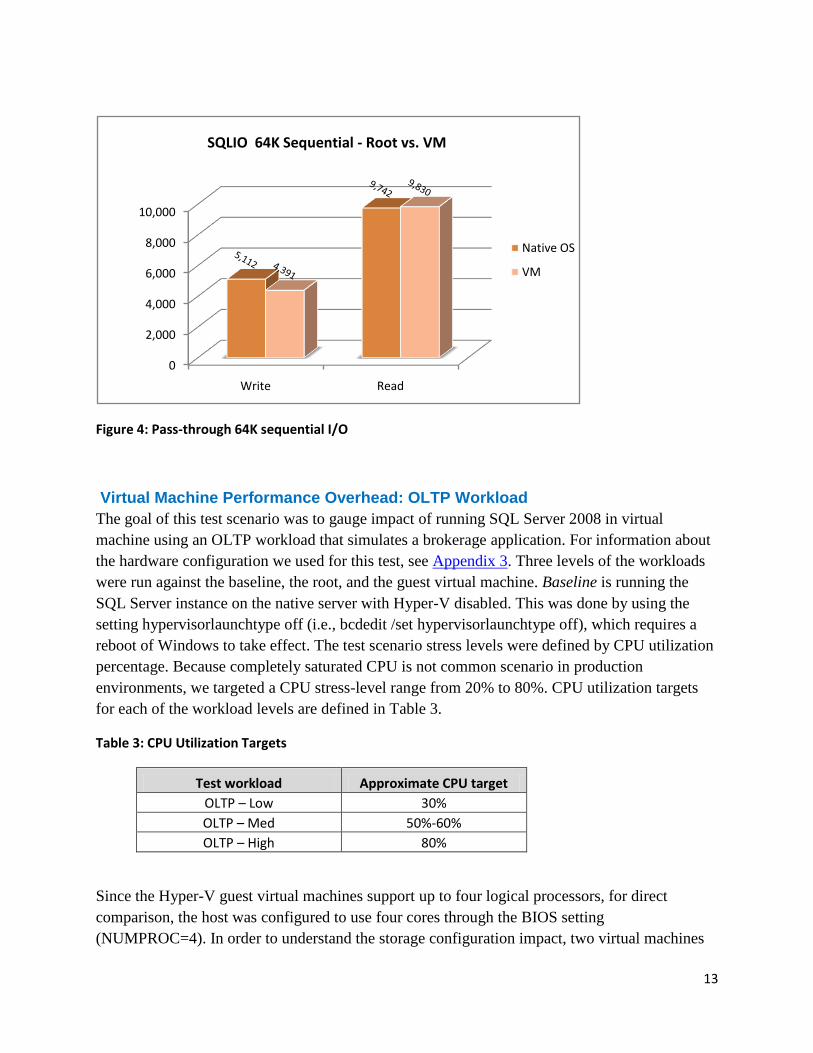
root. Figures 3 and 4 illustrate the test results of random and sequential I/O tests using SQLIO.
We choose the two common SQL IO sizes (8K, and 64K) for this test scenario.
Figure 3: Pass-through 8K random I/O
0
500
1,000
1,500
2,000
2,500
3,000
3,500
4,000
Write Read
IO's
pe
r Se
con
d
8K Random - Root vs. VM
Native OS
VM
13
Figure 4: Pass-through 64K sequential I/O
Virtual Machine Performance Overhead: OLTP Workload
The goal of this test scenario was to gauge impact of running SQL Server 2008 in virtual
machine using an OLTP workload that simulates a brokerage application. For information about
the hardware configuration we used for this test, see Appendix 3. Three levels of the workloads
were run against the baseline, the root, and the guest virtual machine. Baseline is running the
SQL Server instance on the native server with Hyper-V disabled. This was done by using the
setting hypervisorlaunchtype off (i.e., bcdedit /set hypervisorlaunchtype off), which requires a
reboot of Windows to take effect. The test scenario stress levels were defined by CPU utilization
percentage. Because completely saturated CPU is not common scenario in production
environments, we targeted a CPU stress-level range from 20% to 80%. CPU utilization targets
for each of the workload levels are defined in Table 3.
Table 3: CPU Utilization Targets
Test workload Approximate CPU target
OLTP – Low 30%
OLTP – Med 50%-60%
OLTP – High 80%
Since the Hyper-V guest virtual machines support up to four logical processors, for direct
comparison, the host was configured to use four cores through the BIOS setting
(NUMPROC=4). In order to understand the storage configuration impact, two virtual machines
0
2,000
4,000
6,000
8,000
10,000
Write Read
Native OS
VM
SQLIO 64K Sequential - Root vs. VM

14
was configured using the two types of Hyper-V storage configuration recommended for SQL
Server workload (pass-through disks and fixed VHD).
Throughput and Processor Impact
The baseline tests of three load levels were run in a Windows Server 2008 native
environment with the Hyper-V role disabled. The same set of workloads were run against the
root partition with Hyper-V enabled, a guest virtual machine configured using pass-through
disk storage, and then a guest virtual machine using fixed VHD storage.
Table 4 shows the relative batch requests per CPU% and overhead across all test cases. The
system scaled very well with all test cases in this scenario; each configuration achieved the
same throughput, with the virtual machine incurring a higher CPU cost to achieve the same
throughput. Pass-through disks and fixed VHD performance were very similar with less than
a percentage point of overhead variance.
Table 4 also shows the CPU overhead incurred by running the OLTP workload in the virtual
machine. We observed that the overhead as a percentage was higher at the lower workload.
There is a certain amount of fixed work and CPU that is associated with the virtual machine.
If that is distributed over a smaller amount of work, then as a percentage the overhead will be
larger. We used the following formula as a performance measure:
Batch/CPU% = Batch Requests/sec divided by percentage CPU utilization
Table 4: Virtual machine CPU overhead running OLTP workloads
Low Medium High
Batch req/s
Batch/CPU% Overhead
Batch req./s
Batch/CPU% Overhead
Batch req./s
Batch/CPU% Overhead
5
Baseline1 566 19.2 0.00% 908 16 0.00% 1069 14.8 0.00%
Root2 566 17.5 8.85% 907 14.8 7.50% 1113 13.5 8.78%
VM_PT3 565 16.1 16.15% 897 14 12.50% 1075 13.1 11.49%
VM_VHD4 563 15.7 18.23% 876 13.9 13.13% 1029 13.2 10.81%
1. Baseline: a native Windows Server 2008 environment with Hyper-V role disabled. The virtual network
switch is not turned off.
2. Root partition: a root partition in Windows Server 2008 with Hyper-V enabled.
3. VM_PT: a guest virtual machine configured with pass-through disks, four logical processors, and 14 GB
RAM.
4. VM_VHD: guest virtual machine configured with fixed-VHD disks, four logical processors, and 14 GB
RAM.
5. Overhead is calculated by comparing with Baseline ((Baseline Batches/CPU – VM Batches/CPU)/ Baseline
Batches/CPU)

15
Figure 5: Relative throughput – batch request per CPU%
Storage Configuration and Performance
Both guest virtual machines used the same underlying disk configuration for SQL Server data
and log files, so these are directly comparable (the details of the physical configuration for each
can be found earlier in this document, and they are the same as used for the SQLIO testing). In
the case of VHD files, they were the only files placed on the physical disks exposed at the root
partition. We observed a slight latency increase when we used VHDs for SQL Server data and
log file storage, which translated into a small impact on workload throughput as shown in Figure
5.
Using VHD for guest virtual machine configurations has both provisioning and management
advantages. From a throughput/performance perspective, in a low-stress case, there is no
difference between pass-through and fixed VHD. As the workload increases, a pass-through disk
starts to show a slight performance advantage. Figure 6 depicts Read performance recorded in
this OLTP test scenario.
0.0
2.0
4.0
6.0
8.0
10.0
12.0
14.0
16.0
18.0
20.0
Low OLTP Workload Med OLTP Workload High OLTP Workload
Re
leat
ive
Th
rou
ghp
ut
(Bat
che
s/se
c /
%P
roce
sso
r Ti
me
)Relative Throughput - Batches per CPU %
(Batches per second / Total % Processor Time)
Native OS - Hyper-V Disabled
Root Partition - Hyper-V Enabled
Single VM (Passthrough Disks)
Single VM (Fixed Size VHD)
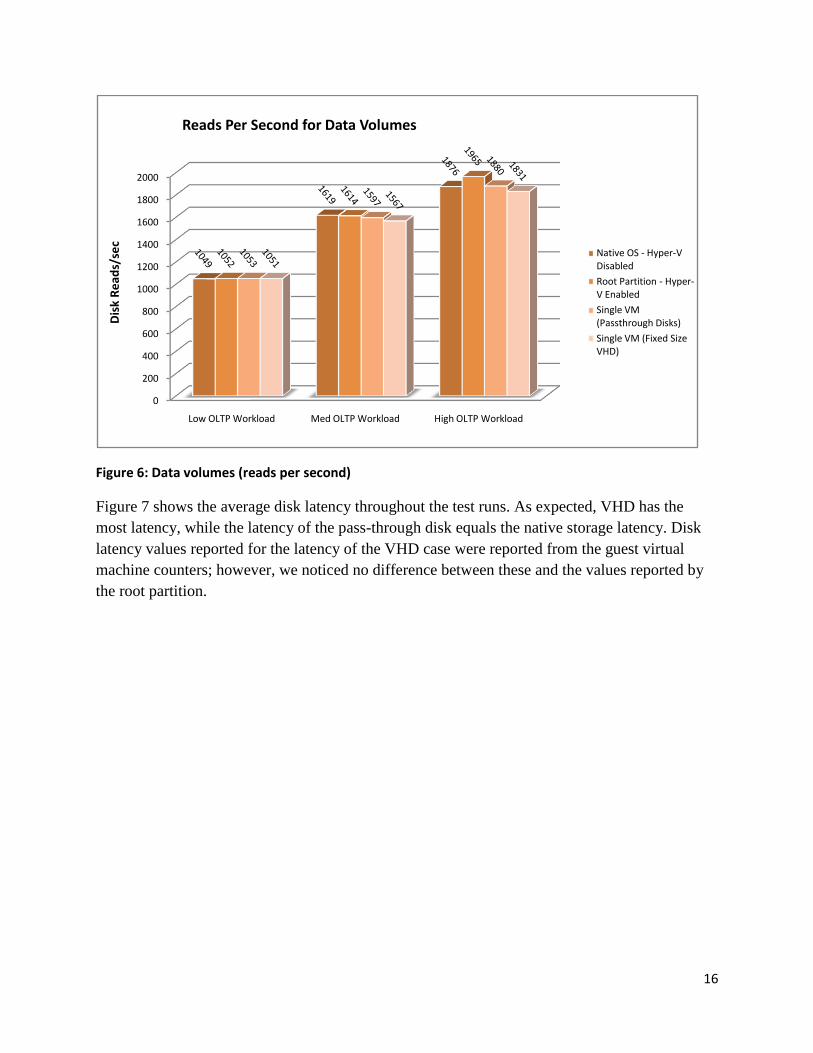
16
Figure 6: Data volumes (reads per second)
Figure 7 shows the average disk latency throughout the test runs. As expected, VHD has the
most latency, while the latency of the pass-through disk equals the native storage latency. Disk
latency values reported for the latency of the VHD case were reported from the guest virtual
machine counters; however, we noticed no difference between these and the values reported by
the root partition.
0
200
400
600
800
1000
1200
1400
1600
1800
2000
Low OLTP Workload Med OLTP Workload High OLTP Workload
Dis
k R
ead
s/se
cReads Per Second for Data Volumes
Native OS - Hyper-V Disabled
Root Partition - Hyper-V Enabled
Single VM (Passthrough Disks)
Single VM (Fixed Size VHD)

17
Figure 7: Average disk latency
Reporting Query Performance Comparison
Reporting queries are generally long-running, read-only queries that consume a large amount of
CPU and I/O resources. Compared to OLTP workloads, queries of this type generally are issued
under low user concurrency. In this test scenario, four reporting queries were executed
sequentially to measure resource consumption and time to completion. These four queries are I/O
intensive and consume significant CPU utilization due to aggregations. The sp_configure setting
‗max degree of parallelism‘ is set to 0 so that the queries utilize all available CPU resources.
The difference between running the queries in guest virtual machines and running them natively
or on the root partition was minimal; we observed a relatively small performance overhead
increase with the guest virtual machines. Figure 8 shows the time to completion and the CPU
consumption of the queries.
0
0.001
0.002
0.003
0.004
0.005
0.006
0.007
0.008
0.009
Low OLTP Workload
Med OLTP Workload
High OLTP Workload
Avg
. Dis
k/se
c R
ead
Average Disk Latency in Seconds
Native OS - Hyper-V Disabled
Root Partition -Hyper-V Enabled
Single VM (Passthrough Disks)
Single VM (Fixed Size VHD)

18
Figure 8: Reporting query performance
Database Operations
Some common database operations are relatively CPU intensive. The test results in this section
cover the virtualization impact on database operations such as backup and restore with
compression, index rebuild, and DBCC CHECKDB.
Backup and Restore
Backup and restore operations were performed using a file share on a different physical server as
a target for the backup files. In this case, the backup and restore were bound by the bandwidth of
the network, not the disk or the processor. We used SQL Server 2008 native backup compression
for the backup operation test.
Compared with the same operation on a native operating system, there was a10-15%
performance degradation in backup throughput with a noticeable CPU increase. Similar
degradation was observed with restore throughput. This degradation in throughput is explained
by the network overhead incurred when operations from within the guest virtual machine make
heavy use of network resources. In our testing we found this to be the area of most concern when
considering the overhead introduced by running SQL Server from within a Hyper-V guest virtual
machine. It was much more significant than any overhead observed for I/O or CPU operations.
In this test scenario, we observed that the network throughput was in the range of 50-60 MB per
second during backup and restore operation. There was a single 1Gbs/sec network adapter in
both the server used for SQL Server and the server that exposed the network file share for the
backup destination. Backup and restore throughput is awasround 100 MB per second. The
600 605620 630
0
10
20
30
40
50
60
70
300
350
400
450
500
550
600
650
700
Native OS -Hyper-V Disabled
Root Partition -Hyper-V Enabled
Guest (Passthrough)
Guest (VHD)Tim
e t
o C
om
ple
teio
n (
seco
nd
s)Reporting Queries with MAXDOP 0
Total time vs. % CPU Consumed
Total Time (seconds)
Hyper-V -%Guest Run Time
%G
ue
stR
un
Tim
e
19
measures are from SQL Server backup and restore output. Compression was used during this
operation, which explains why the throughput reported is significantly higher than the network
throughput that can be supported given the network configuration.
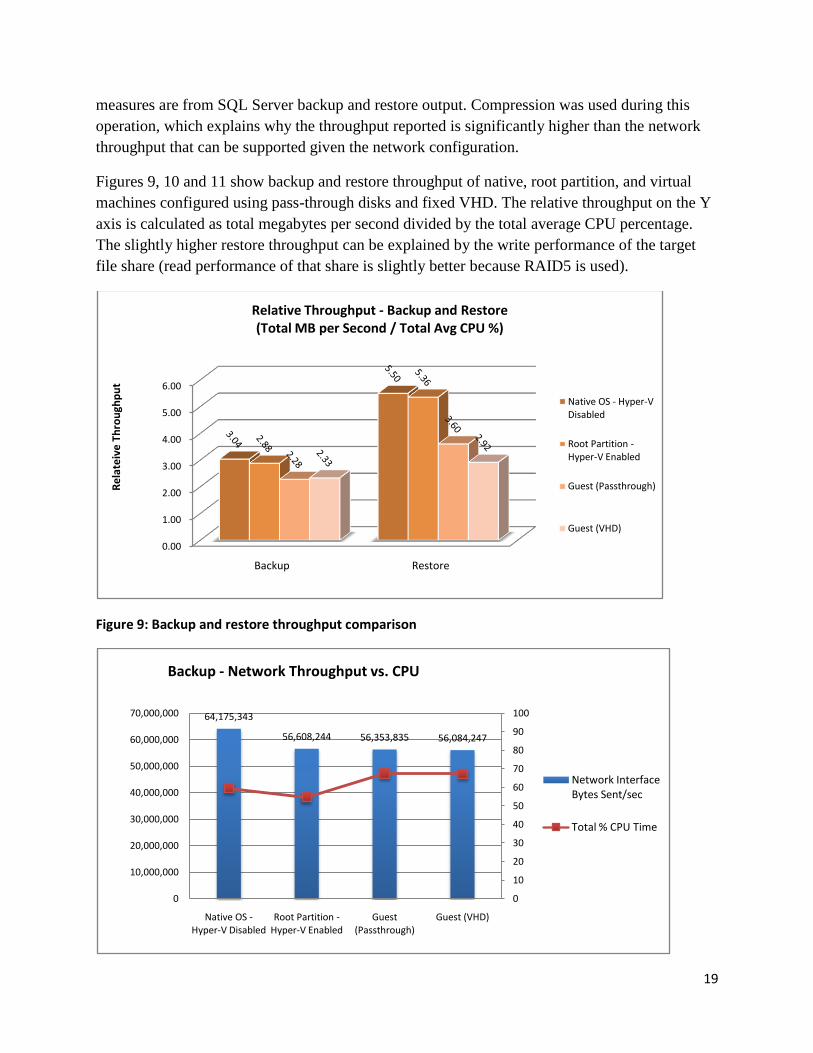
Figures 9, 10 and 11 show backup and restore throughput of native, root partition, and virtual
machines configured using pass-through disks and fixed VHD. The relative throughput on the Y
axis is calculated as total megabytes per second divided by the total average CPU percentage.
The slightly higher restore throughput can be explained by the write performance of the target
file share (read performance of that share is slightly better because RAID5 is used).
Figure 9: Backup and restore throughput comparison
0.00
1.00
2.00
3.00
4.00
5.00
6.00
Backup Restore
Re
late
ive
Th
rou
ghp
ut
Relative Throughput - Backup and Restore(Total MB per Second / Total Avg CPU %)
Native OS - Hyper-V Disabled
Root Partition -Hyper-V Enabled
Guest (Passthrough)
Guest (VHD)
64,175,343
56,608,244 56,353,835 56,084,247
0
10
20
30
40
50
60
70
80
90
100
0
10,000,000
20,000,000
30,000,000
40,000,000
50,000,000
60,000,000
70,000,000
Native OS -Hyper-V Disabled
Root Partition -Hyper-V Enabled
Guest (Passthrough)
Guest (VHD)
Backup - Network Throughput vs. CPU
Network Interface Bytes Sent/sec
Total % CPU Time
20
Figure 10: Backup network utilization and CPU utilization
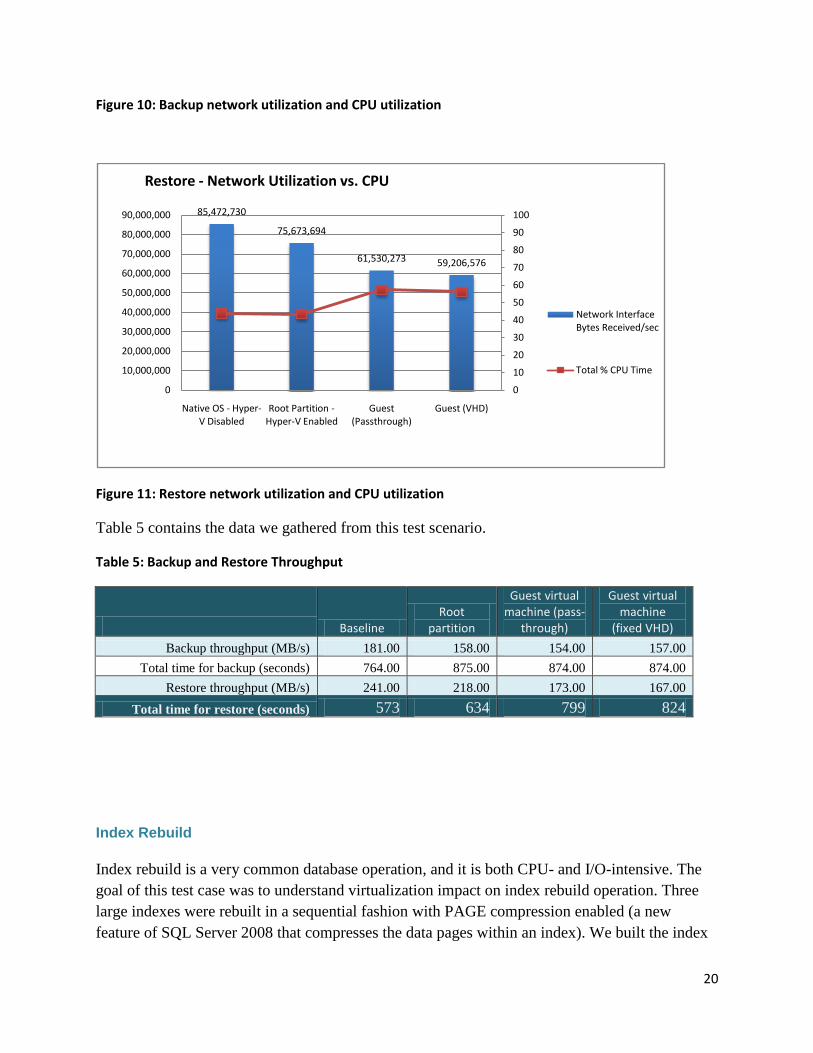
Figure 11: Restore network utilization and CPU utilization
Table 5 contains the data we gathered from this test scenario.
Table 5: Backup and Restore Throughput
Baseline Root
partition
Guest virtual machine (pass-
through)
Guest virtual machine
(fixed VHD)
Backup throughput (MB/s) 181.00 158.00 154.00 157.00
Total time for backup (seconds) 764.00 875.00 874.00 874.00
Restore throughput (MB/s) 241.00 218.00 173.00 167.00
Total time for restore (seconds) 573 634 799 824
Index Rebuild
Index rebuild is a very common database operation, and it is both CPU- and I/O-intensive. The
goal of this test case was to understand virtualization impact on index rebuild operation. Three
large indexes were rebuilt in a sequential fashion with PAGE compression enabled (a new
feature of SQL Server 2008 that compresses the data pages within an index). We built the index
85,472,730
75,673,694
61,530,273 59,206,576
0
10
20
30
40
50
60
70
80
90
100
0
10,000,000
20,000,000
30,000,000
40,000,000
50,000,000
60,000,000
70,000,000
80,000,000
90,000,000
Native OS - Hyper-V Disabled
Root Partition -Hyper-V Enabled
Guest (Passthrough)
Guest (VHD)
Restore - Network Utilization vs. CPU
Network Interface Bytes Received/sec
Total % CPU Time

21
with PAGE compression to increase CPU pressure. Resource utilization and time to completion
were captured.
Very little overhead was observed when the same operation was run within the virtual machines.
Figure 12 shows the index build time vs. percentage CPU on the native OS, the root partition,
and within the guest virtual machines.
Figure 12: Three indexes sequentially rebuilt with PAGE compression
DBCC CHECKDB
We also tested DBCC CHECKDB, another CPU- and I/O- intensive operation. It takes longer to
complete the operation in the guest virtual machine than in the base operating system. Figure 13
shows the time to completion vs. the total CPU resources consumed by the operation. As with
the index rebuild tests, we found relatively little increase in time to completion.
2160 21762220 2220
0
10
20
30
40
50
60
70
80
90
100
1500
1600
1700
1800
1900
2000
2100
2200
2300
2400
2500
Root OS - Hyper-V Disabled
Root OS - Hyper-V Enabled
Guest (Passthrough)
Guest (VHD)
Tim
e t
o C
om
ple
tio
n (
seco
nd
s)
Index Rebuild Response Time and % CPU
Total Time (seconds)
Hyper-V -%Guest Run Time
% G
ue
st C
PU
Tim
e

22
Figure 13: DBCC CHECKDB with MAXDOP 0
SQL Server Consolidation Scenarios Using Hyper-V
This group of test scenarios was designed to answer some of the key questions around
consolidating SQL Server into Hyper-V environment:
Performance impact of storage configuration of multiple instances
The goal of this test scenario was to understand the performance impact of dedicated vs.
shared storage in a consolidation environment.
Virtual instance scalability
The goal of this test scenario was to understand the scalability of the virtual instance
when there was enough physical processor to support 1:1 mapping to logical processor
configured for the guest virtual machine.
Virtual instance performance with overcommitted CPU resources
The goal of this test scenario was to understand the performance impact when the number
of total logical processors configured for the virtual instances was greater than that of the
physical processors available on the server.
15601590
1680 1700
0
10
20
30
40
50
60
70
80
90
100
1000
1100
1200
1300
1400
1500
1600
1700
1800
1900
2000
Root OS - Hyper-V Disabled
Root OS - Hyper-V Enabled
Guest (Passthrough)
Guest (VHD)
Tim
e t
o C
om
ple
tio
n (
seco
nd
s)DBCC CHECKDB with MAXDOP 0
Total time and % CPU
Total Time (seconds)
Hyper-V -%Guest Run Time
% G
ue
st C
PU
Tim
e
23
Comparing Storage Configurations in Consolidation Environment
So far we have established that pass-through disks and fixed VHD are both good storage
configurations for SQL Server workload. To further understand the impact of these two different
storage configurations on OLTP workload, we set up two sets of tests to compare the following
storage methods:
Dedicated storage (i.e., no sharing at the disk level) using pass-through disks
A common pool of disk resources with VHD files for SQL Server data and log files
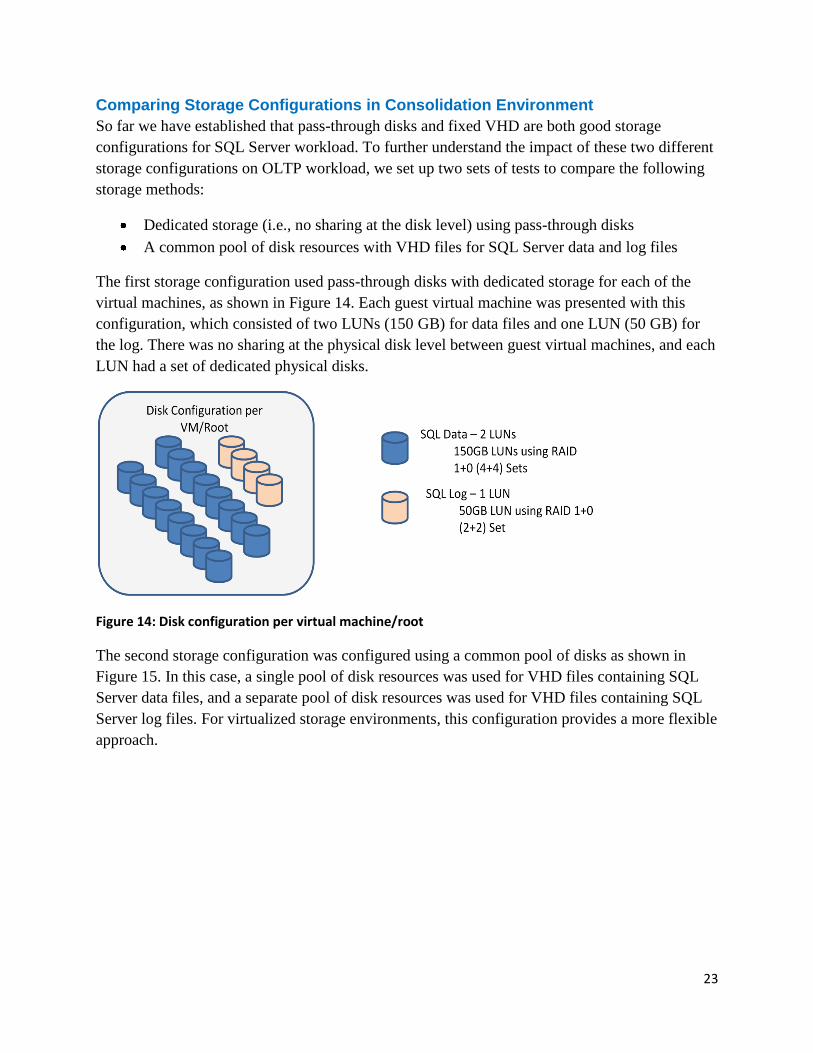
The first storage configuration used pass-through disks with dedicated storage for each of the
virtual machines, as shown in Figure 14. Each guest virtual machine was presented with this
configuration, which consisted of two LUNs (150 GB) for data files and one LUN (50 GB) for
the log. There was no sharing at the physical disk level between guest virtual machines, and each
LUN had a set of dedicated physical disks.
Figure 14: Disk configuration per virtual machine/root
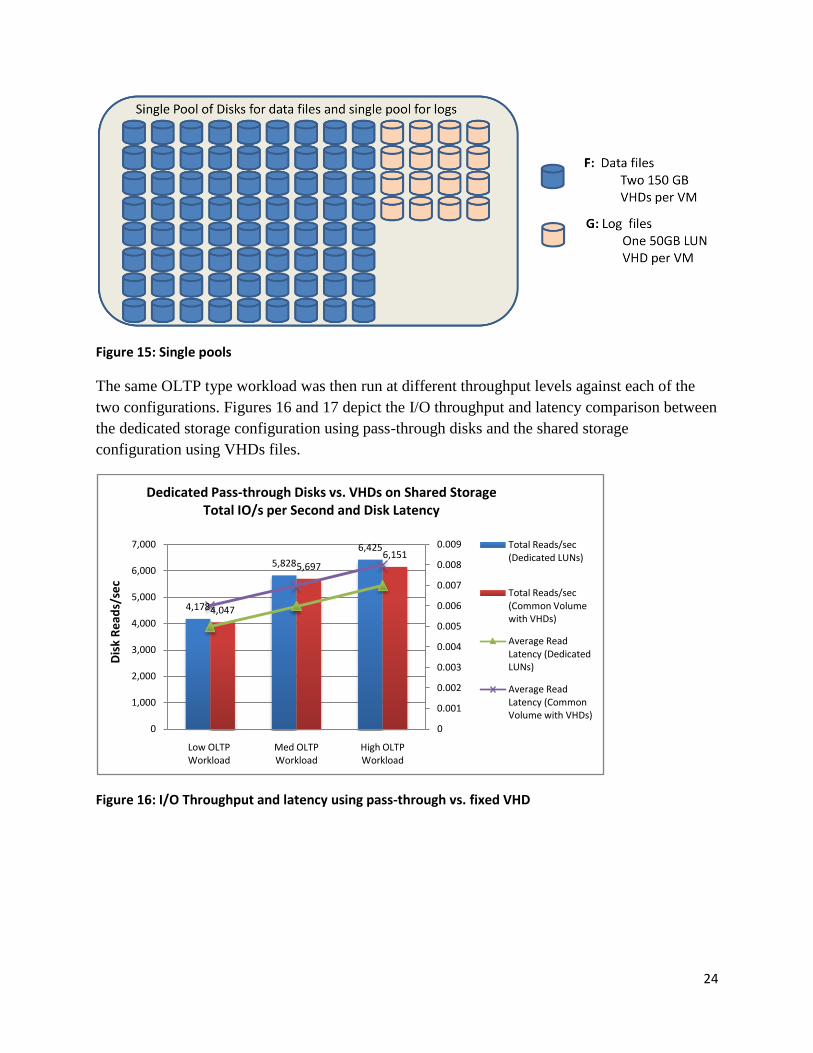
The second storage configuration was configured using a common pool of disks as shown in
Figure 15. In this case, a single pool of disk resources was used for VHD files containing SQL
Server data files, and a separate pool of disk resources was used for VHD files containing SQL
Server log files. For virtualized storage environments, this configuration provides a more flexible
approach.
24
Figure 15: Single pools
The same OLTP type workload was then run at different throughput levels against each of the
two configurations. Figures 16 and 17 depict the I/O throughput and latency comparison between
the dedicated storage configuration using pass-through disks and the shared storage
configuration using VHDs files.
Figure 16: I/O Throughput and latency using pass-through vs. fixed VHD
4,178
5,828
6,425
4,047
5,6976,151
0
0.001
0.002
0.003
0.004
0.005
0.006
0.007
0.008
0.009
0
1,000
2,000
3,000
4,000
5,000
6,000
7,000
Low OLTP Workload
Med OLTP Workload
High OLTP Workload
Dis
k R
ead
s/se
c
Dedicated Pass-through Disks vs. VHDs on Shared StorageTotal IO/s per Second and Disk Latency
Total Reads/sec (Dedicated LUNs)
Total Reads/sec (Common Volume with VHDs)
Average Read Latency (Dedicated LUNs)
Average Read Latency (Common Volume with VHDs)
25
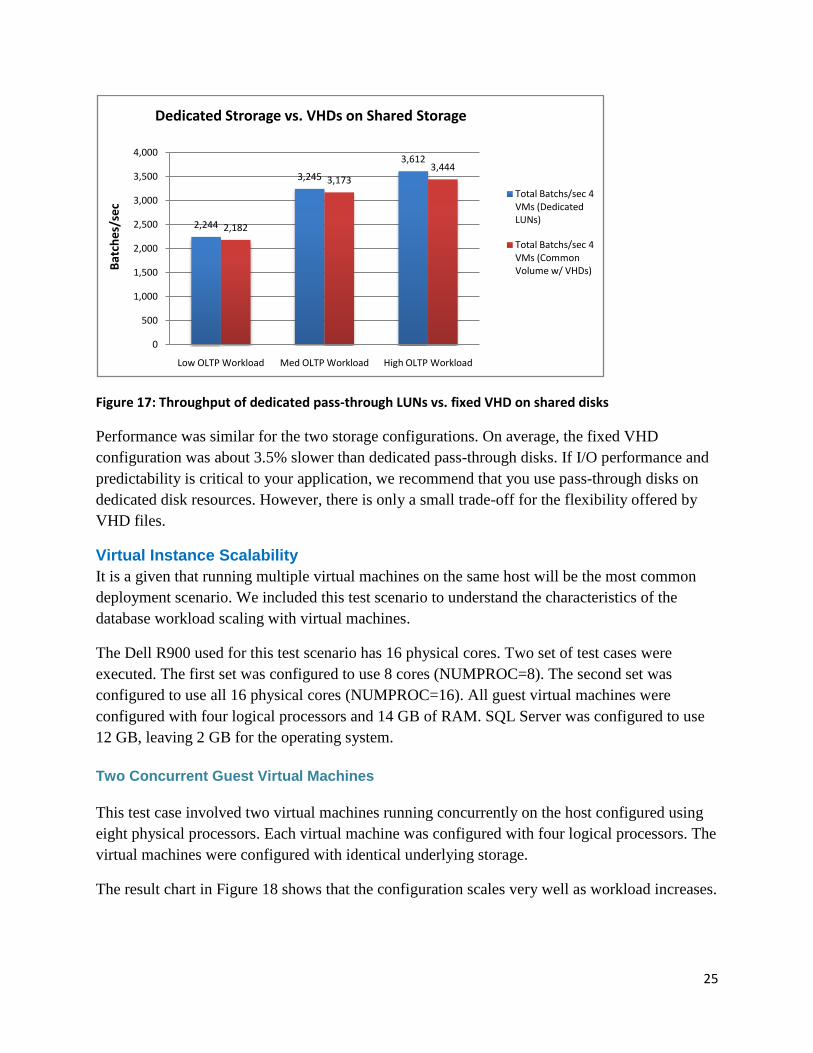
Figure 17: Throughput of dedicated pass-through LUNs vs. fixed VHD on shared disks
Performance was similar for the two storage configurations. On average, the fixed VHD
configuration was about 3.5% slower than dedicated pass-through disks. If I/O performance and
predictability is critical to your application, we recommend that you use pass-through disks on
dedicated disk resources. However, there is only a small trade-off for the flexibility offered by
VHD files.
Virtual Instance Scalability
It is a given that running multiple virtual machines on the same host will be the most common
deployment scenario. We included this test scenario to understand the characteristics of the
database workload scaling with virtual machines.
The Dell R900 used for this test scenario has 16 physical cores. Two set of test cases were
executed. The first set was configured to use 8 cores (NUMPROC=8). The second set was
configured to use all 16 physical cores (NUMPROC=16). All guest virtual machines were
configured with four logical processors and 14 GB of RAM. SQL Server was configured to use
12 GB, leaving 2 GB for the operating system.
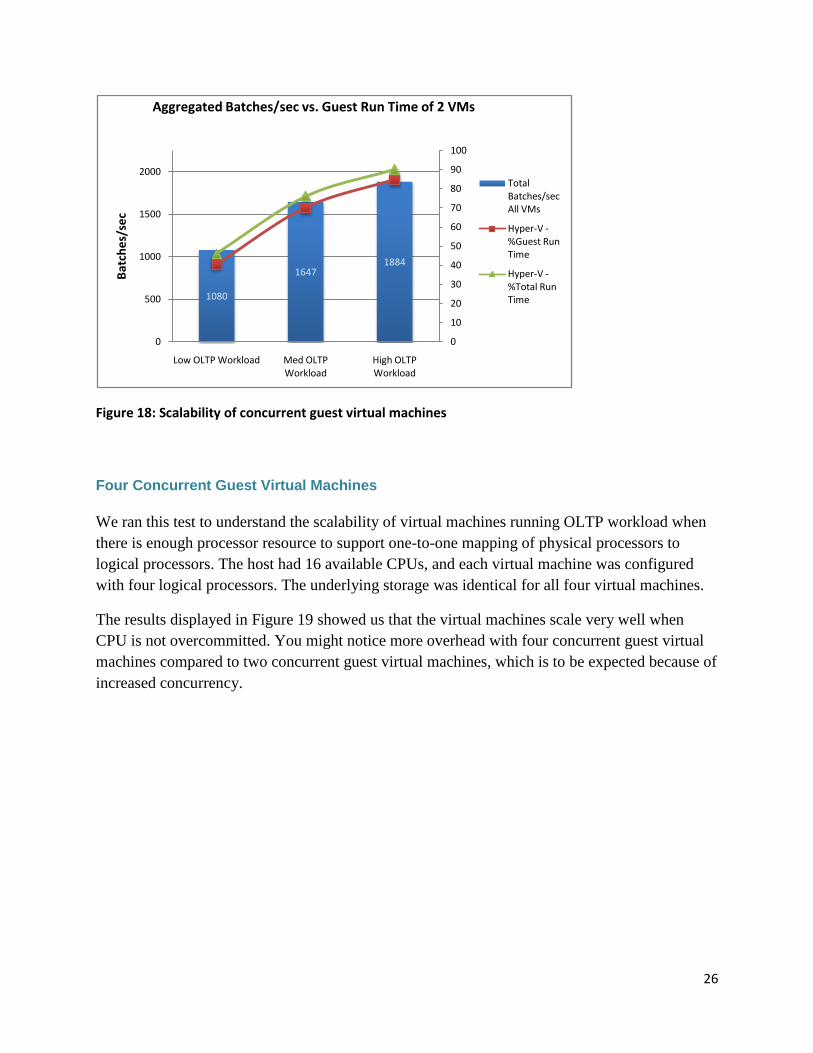
Two Concurrent Guest Virtual Machines
This test case involved two virtual machines running concurrently on the host configured using
eight physical processors. Each virtual machine was configured with four logical processors. The
virtual machines were configured with identical underlying storage.
The result chart in Figure 18 shows that the configuration scales very well as workload increases.
2,244
3,245
3,612
2,182
3,1733,444
0
500
1,000
1,500
2,000
2,500
3,000
3,500
4,000
Low OLTP Workload Med OLTP Workload High OLTP Workload
Bat
che
s/se
cDedicated Strorage vs. VHDs on Shared Storage
Total Batchs/sec 4 VMs (Dedicated LUNs)
Total Batchs/sec 4 VMs (Common Volume w/ VHDs)
26
Figure 18: Scalability of concurrent guest virtual machines
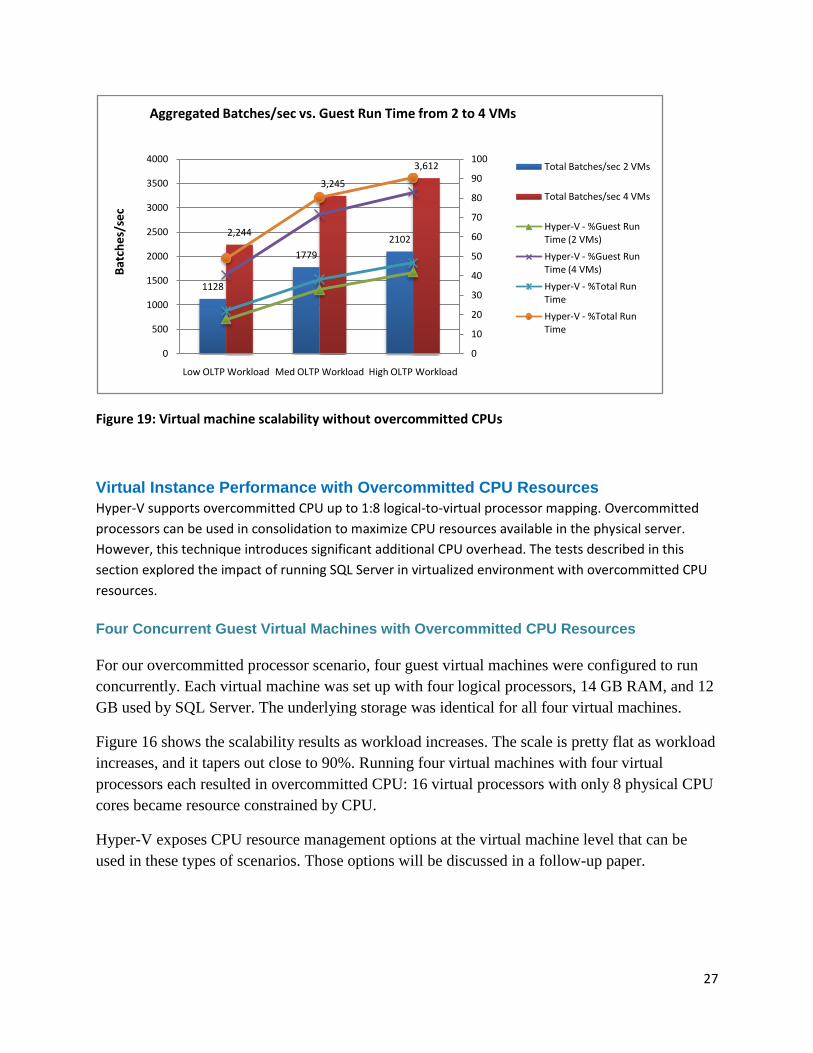
Four Concurrent Guest Virtual Machines
We ran this test to understand the scalability of virtual machines running OLTP workload when
there is enough processor resource to support one-to-one mapping of physical processors to
logical processors. The host had 16 available CPUs, and each virtual machine was configured
with four logical processors. The underlying storage was identical for all four virtual machines.
The results displayed in Figure 19 showed us that the virtual machines scale very well when
CPU is not overcommitted. You might notice more overhead with four concurrent guest virtual
machines compared to two concurrent guest virtual machines, which is to be expected because of
increased concurrency.
1080
16471884
0
10
20
30
40
50
60
70
80
90
100
0
500
1000
1500
2000
Low OLTP Workload Med OLTP Workload
High OLTP Workload
Bat
che
s/se
cAggregated Batches/sec vs. Guest Run Time of 2 VMs
Total Batches/sec All VMs
Hyper-V -%Guest Run Time
Hyper-V -%Total Run Time
27
Figure 19: Virtual machine scalability without overcommitted CPUs
Virtual Instance Performance with Overcommitted CPU Resources
Hyper-V supports overcommitted CPU up to 1:8 logical-to-virtual processor mapping. Overcommitted
processors can be used in consolidation to maximize CPU resources available in the physical server.
However, this technique introduces significant additional CPU overhead. The tests described in this
section explored the impact of running SQL Server in virtualized environment with overcommitted CPU
resources.
Four Concurrent Guest Virtual Machines with Overcommitted CPU Resources
For our overcommitted processor scenario, four guest virtual machines were configured to run
concurrently. Each virtual machine was set up with four logical processors, 14 GB RAM, and 12
GB used by SQL Server. The underlying storage was identical for all four virtual machines.
Figure 16 shows the scalability results as workload increases. The scale is pretty flat as workload
increases, and it tapers out close to 90%. Running four virtual machines with four virtual
processors each resulted in overcommitted CPU: 16 virtual processors with only 8 physical CPU
cores became resource constrained by CPU.
Hyper-V exposes CPU resource management options at the virtual machine level that can be
used in these types of scenarios. Those options will be discussed in a follow-up paper.
1128
1779
21022,244
3,245
3,612
0
10
20
30
40
50
60
70
80
90
100
0
500
1000
1500
2000
2500
3000
3500
4000
Low OLTP Workload Med OLTP Workload High OLTP Workload
Bat
che
s/se
cAggregated Batches/sec vs. Guest Run Time from 2 to 4 VMs
Total Batches/sec 2 VMs
Total Batches/sec 4 VMs
Hyper-V - %Guest Run Time (2 VMs)
Hyper-V - %Guest Run Time (4 VMs)
Hyper-V - %Total Run Time
Hyper-V - %Total Run Time

28
Figure 20: Scalability of four concurrent guest virtual machines with overcommitted CPU
Comparing Consolidation Options
Virtualization introduces many benefits for consolidation scenarios. One of the top benefits is
that virtual machines provide multiple isolated environments on the same host computer.
Performance-wise, your mileage will vary depend the application, workload, and hardware. It is
important to thoroughly test and evaluate the pros and cons of using a native instance vs. a
virtual instance for your consolidation project. Table 6 compares the options for native instances
and virtual instances as they pertain to consolidation.
Table 6: Consolidation Options
Multiple SQL Server
instances
Multiple virtual machines
Isolation Shared Windows instance Dedicated Windows instance
CPU resources Number of CPUs visible to
the Windows instance
Maximum
• Windows 2008 – up to 4 virtual CPUs
• Windows 2003 – up to 2 virtual CPUs
Memory Server limit
flexible (max server memory)
Statically allocated to the virtual machine
• Offline changes only
• No ability to overcommit memory resources
64 GB limit per virtual machine
2 terabyte (TB) limit per host
Storage SQL Server data files with
standard storage options
SQL Server data files using
pass-through or virtual hard disks exposed to the virtual
machine
Resource
management
WSRM (process level) Hyper-V guest virtual machine
1893
21042203
0
10
20
30
40
50
60
70
80
90
100
0
500
1000
1500
2000
2500
Low OLTP Workload Med OLTP Workload High OLTP Workload
Bat
che
s/se
cAggregated Batches / sec vs. Guest Run Time of 4 VM
Total Batches/sec All VMs
Hyper-V -%Guest Run Time
Hyper-V -%Total Run Time

29
Number of
instances
50 Practical limit determined by physical resources
Support Normal rules apply SQL Server 2008 and SQL Server 2005
High
availability
Normal rules apply Guest clustering not supported
Database Mirroring, log shipping (supported)
Conclusion
From a performance perspective, Hyper-V is a viable option for SQL Server consolidation
scenarios. The overall performance of SQL Server running in a Hyper-V virtualized
environment is reasonable compared with the equivalent native Windows Server 2008
environment.
With proper I/O capacity and configuration, the I/O overhead is minimal. For best
performance, you should have enough physical processors to support number of virtual
processors configured on the server to avoid overcommit CPU resources. The CPU overhead
increases significantly when the CPU resources are overcommitted. It is important to test
each application thoroughly before you deploy it to a Hyper-V environment in production.
Some of our general considerations and recommendations when running SQL Server in
Hyper-V environments follow.
Observations
• Hyper-V guest virtual machines are limited to a maximum of four CPU cores;
therefore, you should run SQL Server within Hyper-V guest virtual machines only if
your workload performance can be satisfied by no more than four CPUs.
• When compared against native configurations with comparable hardware resources,
the same throughput can be achieved within a guest virtual machine at a cost of
slightly increased CPU utilization. It is possible with Hyper-V to overcommit CPU
resources when the total number of logical CPU cores configured across all guest
virtual machines is more than the actual number of physical CPU cores available on
the server. In these cases, we observed more CPU overhead and performance
overhead when we ran SQL Server workloads. Proper hardware sizing is critical to
SQL Server performance. You should ensure that cumulative physical CPU resources
on a server are adequate to meet the needs the guest virtual machines by testing your
workload in the planned virtualized environment
• Networking-intensive workloads will see higher CPU overhead and thus more
performance impact.
• The information captured so far is specific to performance considerations; for your
deployment, take functional considerations (i.e., supported configurations, options to

30
achieve high availability, and so on) into account. There is more information in the
appendix section of this paper, which covers general Hyper-V functionality and
current support policies related to running SQL Server within Hyper-V
configurations.
• We found that there was minimal overhead of I/O performance when running SQL
Server from within a guest virtual machine. Pass-through disk configuration provided
the best I/O performance; however, we observed minimal overhead when we ran
using fixed-size VHDs. The decision of which storage configuration to use should be
made based on what makes sense for the particular deployment; virtual machines
using VHDs are easier to move around than pass-through disks.
• For consolidation scenarios, the amount of storage resources available as well as the
scenario will drive your decision. In our testing, we found acceptable performance in
both the shared and dedicated configurations. In either case, you should size your
storage with your workload and response time requirements in mind. Always follow
best practices with respect to the underlying storage in Hyper-V environments, just as
you would with any SQL Server deployment. For more information, see
Predeployment I/O Best Practices for SQL Server.
Recommendations
Utilize either pass-through disks or fixed VHDs for your guest virtual machine
storage. These are the best option for performance, and they should provide the best
results for SQL Server workloads. Dynamic VHDs are not recommended due to
performance reasons.
Avoid using emulated devices and instead ensure that integration components for
Hyper-V have been installed and synthetic devices are being used for I/O, network,
and so on. Synthetic devices will provide the best performance with lowest amount of
CPU overhead.
The ability to use some of these techniques will depend on the hardware capabilities.
For workloads that make heavy use of network resources, refer to the Virtualization
and Network sections of the Windows Performance Tuning guide for best practices
on optimizing network for your particular configuration. Test the performance with of
your workload, as workload characteristics can vary greatly.
For More Information
Windows Server Hyper-V
Hyper-V Deployment and Planning Guide
Microsoft Assessment and Planning Toolkit 3.1 for Hyper-V
Step by Step Guide to Getting Started with Hyper-V
31
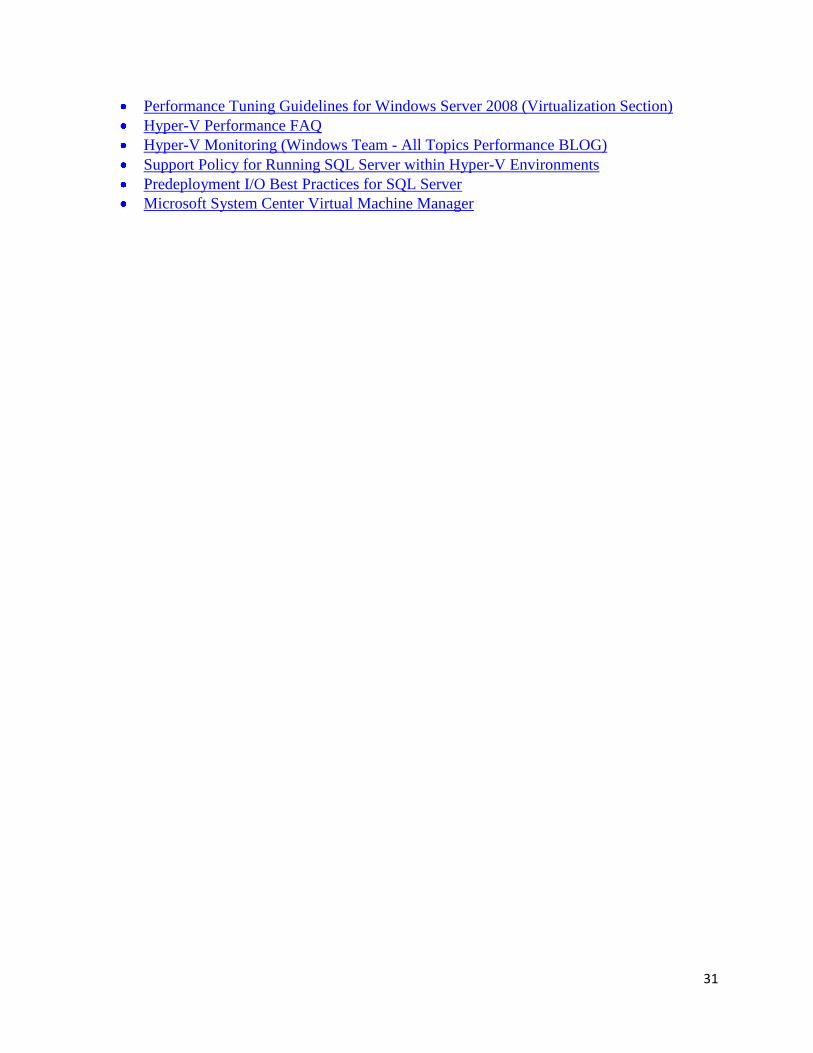
Performance Tuning Guidelines for Windows Server 2008 (Virtualization Section)
Hyper-V Performance FAQ
Hyper-V Monitoring (Windows Team - All Topics Performance BLOG)
Support Policy for Running SQL Server within Hyper-V Environments
Predeployment I/O Best Practices for SQL Server
Microsoft System Center Virtual Machine Manager

32
Appendix 1: Hyper-V Architecture
Hyper-V is a hypervisor-based virtualization technology for Windows Server 2008. The
hypervisor is the processor-specific virtualization platform that allows multiple isolated
operating systems to share a single hardware platform.
Hyper-V supports isolation in terms of a partition. A partition is a logical unit of isolation,
supported by the hypervisor, in which operating systems execute. The Microsoft hypervisor must
have at least one parent, or root, partition, running Windows Server 2008 64-bit Edition. The
virtualization stack runs in the parent partition and has direct access to the hardware devices. The
root partition then creates the child partitions which host the guest operating systems. A root
partition creates child partitions using the hypercall application programming interface (API).
Partitions do not have access to the physical processor, nor do they handle the processor
interrupts. Instead, they have a virtual view of the processor and run in a virtual memory address
region that is private to each guest partition. The hypervisor handles the interrupts to the
processor, and redirects them to the respective partition. Hyper-V can also hardware accelerate
the address translation between various guest virtual address spaces by using an Input Output
Memory Management Unit (IOMMU) which operates independent of the memory management
hardware used by the CPU. An IOMMU is used to remap physical memory addresses to the
addresses that are used by the child partitions.
Child partitions also do not have direct access to other hardware resources and are presented a
virtual view of the resources, as virtual devices (VDevs). Requests to the virtual devices are
redirected either via the VMBus or the hypervisor to the devices in the parent partition, which
handles the requests. The VMBus is a logical inter-partition communication channel. The parent
partition hosts Virtualization Service Providers (VSPs) which communicate over the VMBus to
handle device access requests from child partitions. Child partitions host Virtualization Service
Consumers (VSCs) which redirect device requests to VSPs in the parent partition via the
VMBus. This entire process is transparent to the guest operating system.
Virtual Devices can also take advantage of a Windows Server Virtualization feature, named
Enlightened IO, for storage, networking, graphics, and input subsystems. Enlightened IO is a
specialized virtualization-aware implementation of high level communication protocols (such as
SCSI) that utilize the VMBus directly, bypassing any device emulation layer. This makes the
communication more efficient but requires an enlightened guest that is hypervisor and VMBus
aware. Hyper-V enlightened I/O and a hypervisor aware kernel is provided via installation of
Hyper-V integration services. Integration components, which include virtual server client (VSC)
drivers, are also available for other client operating systems. Hyper-V requires a processor that
includes hardware assisted virtualization, such as is provided with Intel VT or AMD
Virtualization (AMD-V) technology.
33
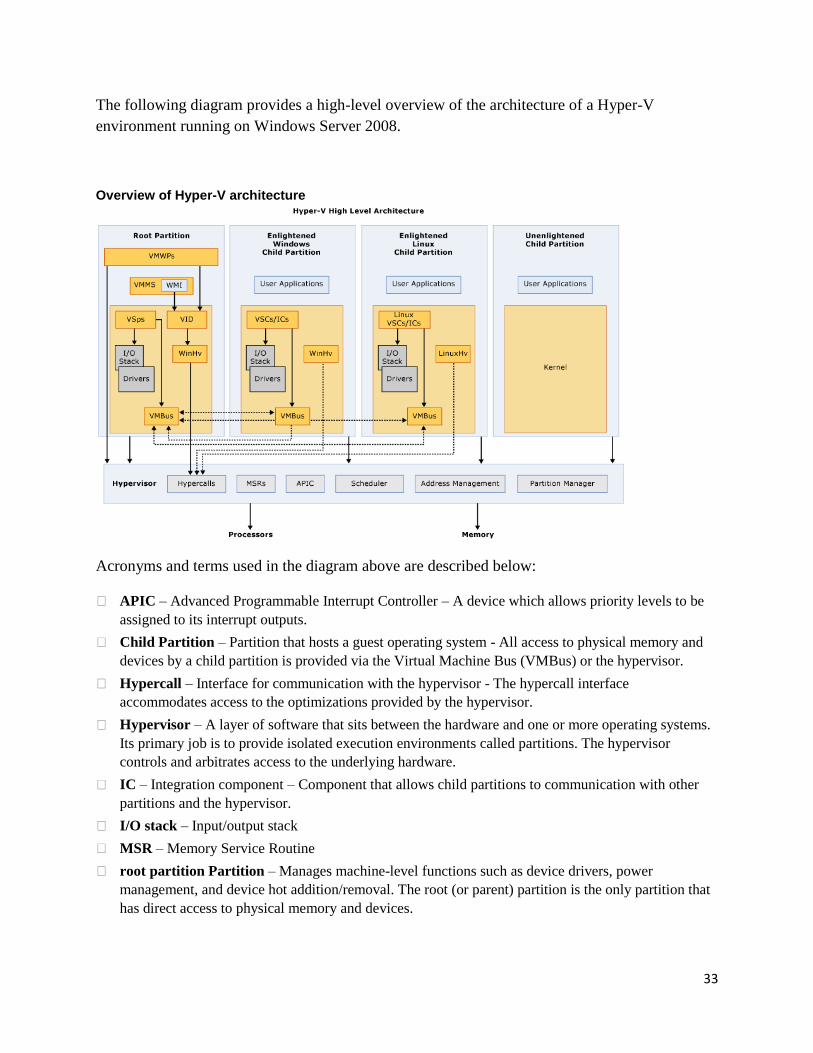
The following diagram provides a high-level overview of the architecture of a Hyper-V
environment running on Windows Server 2008.
Overview of Hyper-V architecture
Acronyms and terms used in the diagram above are described below:
APIC – Advanced Programmable Interrupt Controller – A device which allows priority levels to be
assigned to its interrupt outputs.
Child Partition – Partition that hosts a guest operating system - All access to physical memory and
devices by a child partition is provided via the Virtual Machine Bus (VMBus) or the hypervisor.
Hypercall – Interface for communication with the hypervisor - The hypercall interface
accommodates access to the optimizations provided by the hypervisor.
Hypervisor – A layer of software that sits between the hardware and one or more operating systems.
Its primary job is to provide isolated execution environments called partitions. The hypervisor
controls and arbitrates access to the underlying hardware.
IC – Integration component – Component that allows child partitions to communication with other
partitions and the hypervisor.
I/O stack – Input/output stack
MSR – Memory Service Routine
root partition Partition – Manages machine-level functions such as device drivers, power
management, and device hot addition/removal. The root (or parent) partition is the only partition that
has direct access to physical memory and devices.
34
VID – Virtualization Infrastructure Driver – Provides partition management services, virtual
processor management services, and memory management services for partitions.
VMBus – Channel-based communication mechanism used for inter-partition communication and
device enumeration on systems with multiple active virtualized partitions. The VMBus is installed
with Hyper-V Integration Services.
VMMS – Virtual Machine Management Service – Responsible for managing the state of all virtual
machines in child partitions.
VMWP – Virtual Machine Worker Process – A user mode component of the virtualization stack. The
worker process provides virtual machine management services from the Windows Server 2008
instance in the parent partition to the guest operating systems in the child partitions. The Virtual
Machine Management Service spawns a separate worker process for each running virtual machine.
VSC – Virtualization Service Client – A synthetic device instance that resides in a child partition.
VSCs utilize hardware resources that are provided by Virtualization Service Providers (VSPs) in the
parent partition. They communicate with the corresponding VSPs in the parent partition over the
VMBus to satisfy a child partitions device I/O requests.
VSP – Virtualization Service Provider – Resides in the root partition and provide synthetic device
support to child partitions over the Virtual Machine Bus (VMBus).
WinHv – Windows Hypervisor Interface Library - WinHv is essentially a bridge between a
partitioned operating system‘s drivers and the hypervisor which allows drivers to call the hypervisor
using standard Windows calling conventions
WMI – The Virtual Machine Management Service exposes a set of Windows Management
Instrumentation (WMI)-based APIs for managing and controlling virtual machines.
35
Appendix 2: Hardware Requirements
Hyper-V requires specific hardware. You can identify systems that support the x64 architecture
and Hyper-V by searching the Windows Server catalog for Hyper-V as an additional
qualification (see http://go.microsoft.com/fwlink/?LinkId=111228).
To install and use the Hyper-V role, you will need the following:
An x64-based processor. Hyper-V is available in 64-bit editions of Windows Server 2008—
specifically, the 64-bit editions of Windows Server 2008 Standard, Windows Server 2008 Enterprise,
and Windows Server 2008 Datacenter. Hyper-V is not available for 32-bit (x86) editions or Windows
Server 2008 for Itanium-Based Systems. However, the Hyper-V management tools are available for
32-bit editions.
Hardware-assisted virtualization. This is available in processors that include a virtualization
option—specifically processors with Intel Virtualization Technology (Intel VT) or AMD
Virtualization (AMD-V) technology.
Hardware-enforced Data Execution Prevention (DEP) must be available and enabled.
Specifically, you must enable Intel XD bit (execute disable bit) or AMD NX bit (no execute bit).
Tip
The settings for hardware-assisted virtualization and hardware-enforced DEP are available in the
BIOS. However, the names of the settings may differ from the names identified above. For more
information about whether a specific processor model supports Hyper-V, check with the
manufacturer of the computer. If you modify the settings for hardware-assisted virtualization or
hardware-enforced DEP, you may need to turn off the power to the computer and then turn it
back on. Restarting the computer may not apply the changes to the settings.
Memory
The maximum amount of memory that can be used is determined by the operating system, as
follows:
For Windows Server 2008 Enterprise and Windows Server 2008 Datacenter, the physical computer
can be configured with up to 1 TB of physical memory, and virtual machines that run either of those
editions can be configured with up to 64 GB of memory per virtual machine.
For Windows Server 2008 Standard, the physical computer can be configured with up to 32 GB of
physical memory, and virtual machines that run either of those editions can be configured with up to
31 GB of memory per virtual machine.
Processors
Hyper-V is supported on physical computers with up to 16 logical processors. A logical
processor can be a core processor or a processor using hyper-threading technology. You can
configure up to 4 virtual processors on a virtual machine. However, the number of virtual
processors supported by a guest operating system might be lower. For more information, see
About Virtual Machines and guest VM Operating Systems.
36
The following are some examples of supported systems and the number of logical processors
they provide:
A single-processor/dual-core system provides 2 logical processors.
A single-processor/quad-core system provides 4 logical processors.
A dual-processor/dual-core system provides 4 logical processors.
A dual-processor/quad-core system provides 8 logical processors.
A quad-processor/dual-core system provides 8 logical processors.
A quad-processor/dual-core, hyper-threaded system provides 16 logical processors.
A quad-processor/quad-core system provides 16 logical processors.
Networking
Hyper-V provides the following networking support:
Each virtual machine can be configured with up to 12 virtual network adapters—8 can be the
―network adapter‖ type and 4 can be the ―legacy network adapter‖ type. The network adapter type
provides better performance and requires a virtual machine driver that is included in the integration
services packages.
Each virtual network adapter can be configured with either a static or dynamic MAC address.
Each virtual network adapter offers integrated virtual local area network (VLAN) support and can be
assigned a unique VLAN channel.
You can have an unlimited number of virtual networks with an unlimited number of virtual machines
per virtual network. For more information about virtual networks, see Configuring Virtual Networks.
Note
You cannot connect a virtual network to a wireless network adapter. As a result, you cannot
provide wireless networking capabilities to virtual machines.
Storage
Hyper-V supports a variety of storage options. You can use the following types of physical
storage with a server that runs Hyper-V:
Direct-attached storage: You can use Serial Advanced Technology Attachment (SATA), external
Serial Advanced Technology Attachment (eSATA), Parallel Advanced Technology Attachment
(PATA), Serial Attached SCSI (SAS), SCSI, USB, and Firewire.
Storage area networks (SANs): You can use Internet SCSI (iSCSI), Fibre Channel, and SAS
technologies.
Network-attached storage
You can configure a virtual machine to use the following types of virtual storage.
Virtual hard disks of up to 2040 GB. You can use fixed virtual hard disks, dynamically expanding
virtual hard disks, and differencing disks.
37
Virtual IDE devices. Each virtual machine supports up to 4 IDE devices. The startup disk
(sometimes referred to as the boot disk) must be attached to one of the IDE devices. The startup disk
can be either a virtual hard disk or a physical disk.
Virtual SCSI devices. Each virtual machine supports up to 4 virtual SCSI controllers, and each
controller supports up to 64 disks. This means that each virtual machine can be configured with as
many as 256 virtual SCSI disks.
Physical disks. Physical disks attached directly to a virtual machine (sometimes referred to as pass-
through disks) have no size limitation other than what is supported by the guest operating system.
Virtual machine storage capacity. Using virtual hard disks, each virtual machine supports up to 512
TB of storage. Using physical disks, this number is even greater depending on what is supported by
the guest operating system.
Virtual machine snapshots. Hyper-V supports up to 50 snapshots per virtual machine.
Note
Although a virtual machine must use a virtual IDE device as the startup disk to start the guest
operating system, you have many options to choose from when selecting the physical device that
will provide the storage for the virtual IDE device. For example, you can use any of the types of
physical storage identified in the preceding list.
Appendix 3: Hardware Configuration
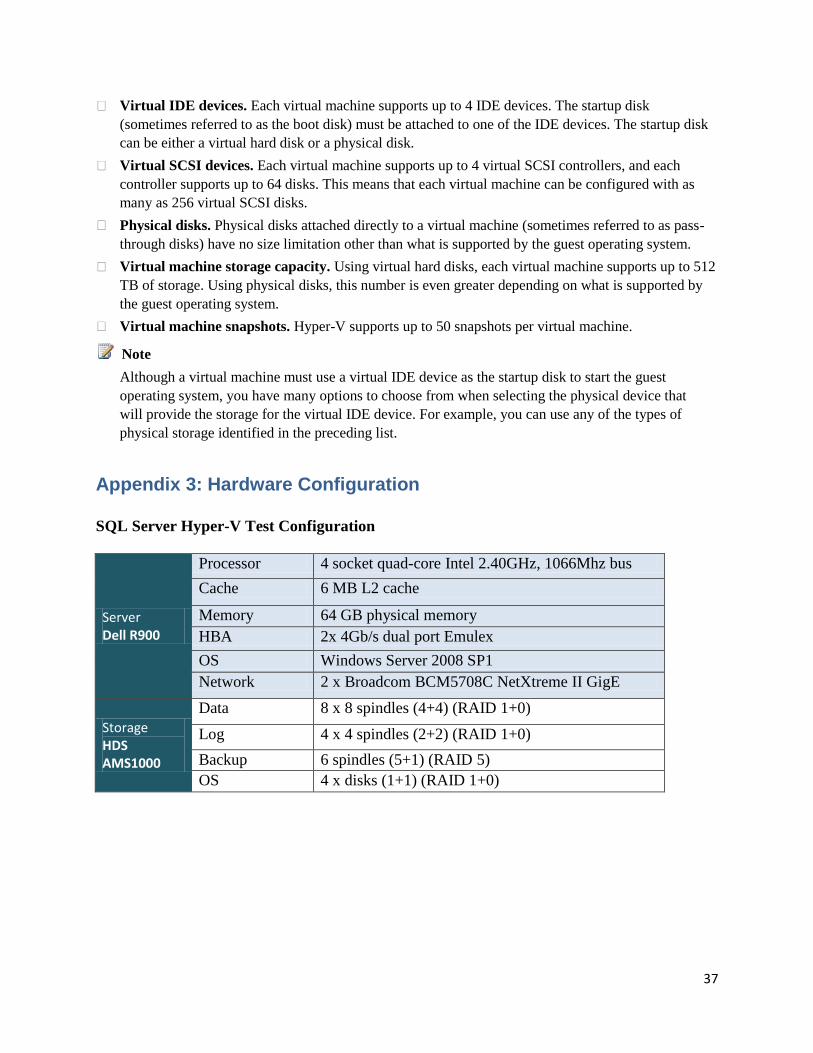
SQL Server Hyper-V Test Configuration
Server Dell R900
Processor 4 socket quad-core Intel 2.40GHz, 1066Mhz bus
Cache 6 MB L2 cache
Memory 64 GB physical memory
HBA 2x 4Gb/s dual port Emulex
OS Windows Server 2008 SP1
Network 2 x Broadcom BCM5708C NetXtreme II GigE
Storage HDS AMS1000
Data 8 x 8 spindles (4+4) (RAID 1+0)
Log 4 x 4 spindles (2+2) (RAID 1+0)
Backup 6 spindles (5+1) (RAID 5)
OS 4 x disks (1+1) (RAID 1+0)
Top Related