


Languages
Pages
Legal

Running Head: GENDER DIFFERENCES RISK TOLERANCE 1
Gender Differences in Financial Risk Tolerance
Patti J. Fisher, Ph.D.* Virginia Tech
Rui Yao, Ph.D.
University of Missouri
Abstract
The purpose of this research is to explore gender differences in financial risk tolerance using a large, nationally representative dataset, the Survey of Consumer Finances. The impact of the
explanatory variables in the model is allowed to differ between men and women to decompose gender differences in financial risk tolerance. The results indicate that gender differences in financial risk
tolerance are explained by gender differences in the individual determinants of financial risk tolerance, and that the disparity does not result from gender in and of itself. The individual variables that
moderate the relationship between gender and high risk tolerance are income uncertainty and net worth, with income uncertainty moderating the relationship between gender and some risk tolerance. Financial fiduciaries should understand the differences in income uncertainty and net worth between
men and women and how those differences relate to risk tolerance.
Keywords: Risk tolerance; Gender differences; Household behavior; Personal finance
PsycINFO Classification codes: 3920, 2970
JEL Classification code: D10
GENDER DIFFERENCES RISK TOLERANCE 2
Gender Differences in Financial Risk Tolerance
1. Introduction
Risk taking is a fundamental dimension that economists investigate to explain individual
differences in behavior (Bucciol & Zarri, 2015). Risk tolerance, which indicates the degree to
which a person is willing to take risks, plays an important role in household portfolio decisions
(Sung & Hanna, 1996) and has implications for both individuals and financial service providers
(Hallahan, Faff, & McKenzie, 2004). Financial risk tolerance is the level of discomfort that an
individual is willing to accept while risking current wealth for future growth (Gibson,
Michayluk, & Van de Venter, 2013).
In efficient markets, investors can expect a higher return for a higher level of risk. As
such, investors with higher levels of risk tolerance tend to invest in assets with greater levels of
risk, such as stocks, to obtain greater returns in the long term (Yao, Hanna, & Lindamood, 2004)
and build greater wealth (Neelakantan, 2010). An investor with lower risk tolerance requires
added compensation to accept uncertainty when faced with an investment that has a variable
payout (Hanna, Waller, & Finke, 2008). Thus, investors with low levels of risk tolerance may
have greater difficulty reaching their financial goals and building adequate retirement wealth
because they are unlikely to invest in stocks (Yao et al., 2004).
Understanding investors’ financial risk tolerance is important for financial service
providers in a post global financial crisis environment that includes a recent fiduciary rule issued
by the U.S. Department of Labor (DOL; 2016, April). Previously, sales-oriented advisors were
held to a suitability standard. With this change in regulations, more advisors are being held to a
higher fiduciary standard of care for a broader range of advisory services. This means that the
personal recommendations provided must be in the best interest of the client, and adequate
GENDER DIFFERENCES RISK TOLERANCE 3
understanding of investors’ risk tolerance is a necessary condition to meet this requirement.
However, research shows that financial advisors may not fully understand the financial risk
tolerance of women, underestimating women’s risk tolerance (Roszkowski & Grable, 2005).
There is a need for advisors to better understand and assess women’s risk tolerance through
reliable and valid methods in order to provide recommendations in the best interest of the client.
Ho, Milevsky, and Robinson (1994) stated that women should hold riskier portfolios than
men because of their longer life expectancies, assuming otherwise identical preferences.
However, researchers have found generally that women have lower financial risk tolerance and
invest financial resources more conservatively than do men (Bajtelsmit, Bernasek, &
Jianakoplos, 1996; Embrey & Fox, 1997; Faff, Mulino, & Chai, 2008; Grable, McGill, & Britt,
2009; Hallahan et al., 2004; Hinz, McCarthy, & Turner, 1997; Neelakantan, 2010). Among
common stock investors, Barber and Odean (2001) found that men are overconfident and trade
more frequently than women, thereby reducing their returns relative to those of women.
Lemaster and Strough (2014) investigated gender differences in risk tolerance, and found
that gender identification, or identifying as one’s biological sex and viewing it as a positive part
of the self, was important in explaining the differences. Using experimental methods, D’Acunto
(2015) also found that gender identity helped explain the gender differences in risk attitudes and
beliefs. Gender is the social distinction between men and women, while sex is the biological
difference (Helgeson, 2008). In the current study, we use the respondent’s sex, male or female,
as a measure of gender, as no additional measures in the data set allowed us to distinguish gender
or gender identity.
Gender differences in risk tolerance have critical implications for women. Variations in
risk preferences between men and women may lead to differences in portfolio allocations that
GENDER DIFFERENCES RISK TOLERANCE 4
result in wealth inequality (Yao, Sharpe, & Wang, 2011). For example, women with lower
levels of risk tolerance may not be prepared adequately for retirement given their longevity and
the individual responsibility placed on retirement saving today. Financial advisers also have
reported that women hold portfolios that are more conservative and yield lower returns (Wang,
1994). Conservative investments can lead to lower levels of wealth accumulation that contribute
to the gender gap in wealth.
Although many researchers have investigated whether gender is related to financial risk
tolerance (e.g., Sung & Hanna, 1996; Cupples, Rasure, & Grable, 2013; Yao et al., 2011), the
contribution of this study is the identification of factors that contribute to gender differences in
risk tolerance. The purpose of this study was to identify the factors related to risk tolerance
among men and women using a decomposition technique. This will help us understand better
whether the gender differences observed are due to gender itself, or because the factors related to
risk tolerance affect men and women differently and thus lead to differences in their risk
tolerance. The decomposition technique allows us to determine the way in which these factors
affect men and women independently, and provides information about which variables differ
significantly between men and women in terms of their relationship to risk tolerance. Existing
research has shown that a number of demographic, socioeconomic, and attitudinal factors affect
risk tolerance, and it is necessary to examine these relationships in more detail (Sung & Hanna,
1996).
1.1 Review of Literature
Early research in psychology often presumed that risk attitudes, or a person’s place on the
continuum from risk averse to risk seeking, is a personality trait (Plax & Rosenfeld, 1976). Risk
tolerance levels were a function of the specific task, decision frames, and information processing
GENDER DIFFERENCES RISK TOLERANCE 5
strategies (Schoemaker, 1990; Weber & Milliman, 1997). Individual financial risk tolerance was
assumed to be a main determinant of asset allocation choices, security choices, and goal planning
strategies (Grable & Lytton, 2001). Van de Venter, Michayluk, and Davey (2010) found that
financial risk tolerance is relatively stable over time. Today, the assessment of financial risk
tolerance as an attitudinal component of the financial decision-making process is a factor of
interest to researchers, practitioners, and policymakers (Gilliam, Chatterjee, & Grable, 2010).
1.1.1 Gender and Risk Tolerance
Self-reported gender differences in risk tolerance have been examined widely. Empirical
findings agree generally that women are, on average, less risk tolerant in their financial decisions
than men (Byrnes, Miller, & Schafer, 1999; Gibson et al., 2013; Grable & Lytton, 2001; Hawley
& Fujii, 1993; Jianakoplos & Bernasek, 1998; Olsen & Cox, 2001; Palsson, 1996). Hallahan et
al. (2004) found that gender was a significant determinant of risk tolerance, such that women
were significantly more risk averse. Cupples et al. (2013) found that women exhibit a risk-
averse profile, with education serving as a mediator and reducing the gender difference in risk
tolerance.
Several researchers have explored the link between marital status, gender, and risk
tolerance. Sung and Hanna (1996) showed that single women are less risk tolerant than are
single men or married couples. Similarly, Sunden and Surrette (1998) found single women to be
less risk tolerant than are single men. The results of Yao et al.’s (2004) study showed that both
married and unmarried females have lower risk tolerance than do married men, while unmarried
males exhibit the greatest risk tolerance. Yao and Hanna (2005) found that risk tolerance was
highest among married men, followed by unmarried men, unmarried women, and finally,
married women. Yao et al. (2011) found a negative relationship between being an unmarried
GENDER DIFFERENCES RISK TOLERANCE 6
female and risk tolerance. However, in contrast to the findings above, Grable and Joo (1999)
and Hanna, Gutter, and Fan (1998) did not find that gender was a significant predictor of
financial risk tolerance.
Researchers also have examined gender differences in financial risk-taking behavior.
Xiao (1995) found that women were less likely than men to hold stocks and more likely to hold
certificates of deposit in their portfolios. Dwyer, Gilkenson, and List’s (2002) study showed that
women take fewer risks in mutual fund investment decisions than do men. Bajtelsmit et al.
(1996) examined gender differences in defined contribution pension allocations and found that
women invested their holdings more conservatively. Generally, research shows that women are
less risk tolerant than men; however, there have been exceptions. For example, Zhong and Xiao
(1995) did not find a gender difference in the dollar holdings of stocks, and Arano, Parker, and
Terry (2010) found no gender difference in the proportion of stocks held in retirement accounts
among a group of university faculty in Kansas.
Using data from the Health and Retirement Study (HRS), which focuses on older
Americans, Neelakantan (2010) showed that gender differences in risk tolerance accounted for
approximately 10% of the gender difference in accumulated wealth. Cupples et al. (2013) found
that the total effect of gender on risk tolerance was reduced when education was included as a
mediator. These results indicate that a number of other factors mediate the gender difference in
financial risk tolerance. Limited research has investigated whether the gender difference in risk
tolerance is due to gender itself, or due to other factors that moderate the link between risk
tolerance and gender. Therefore, this study adds to the literature by decomposing the gender
difference in risk tolerance using a large, nationally representative data set.
GENDER DIFFERENCES RISK TOLERANCE 7
The prior literature has provided some indication of the factors that interact with gender
in affecting risk tolerance. However, our study is the first to conduct specific close examinations
of the effect of gender on risk tolerance with respect to whether such an effect is due to gender
only, or to other factors moderating the effect of gender on risk tolerance. Based on the previous
literature, we developed the following hypotheses:
H1: Women have lower risk tolerance than men.
H2: The gender difference in financial risk tolerance is driven by variables that affect risk
tolerance in men and women differentially.
1.1.2 Economic Characteristics Related to Risk Tolerance
1.1.2.1 Financial knowledge
In addition to gender, other variables have been found to be important in explaining risk
tolerance and thus must be controlled for in an empirical model. Financial or investment
knowledge has been shown to be related positively to financial risk tolerance (Fan & Xiao, 2006;
Gibson et al., 2013; Grable, 2000; Grable & Joo, 2000, 2004; Hallahan et al., 2004; Yao et al.,
2004). Sachse, Jungermann, and Belting (2012) found that financial literacy is important in
predicting investment risk perceptions. Researchers have shown that women are generally less
financially knowledgeable than are men, which affects their portfolio choices (Lusardi &
Mitchell, 2007). Dwyer et al. (2002) found that the effect of gender on risk taking in mutual
fund investment decisions was reduced significantly when the individual’s financial knowledge
was controlled. However, according to DeVaney and Su (1997), the determinants of retirement
planning knowledge are similar for men and women. Using data from the Rand American Life
Panel, Fonseca, Mullen, Zamarro, and Zissimopoulos (2010) found that the gender gap in
financial literacy results from the role of household marital specialization and division of labor

GENDER DIFFERENCES RISK TOLERANCE 8
among couples. Although the results regarding gender differences in financial knowledge are
mixed, the results of previous studies indicate that financial knowledge is important in explaining
financial behaviors and risk tolerance.
1.1.2.2 Income, income uncertainty, and net worth
Higher financial risk tolerance has been reported among individuals with higher income
and wealth (Chaulk, Johnson, & Bulcroft, 2003; Finke & Huston, 2003; Gibson et al., 2013;
Grable, 2000; Hallahan et al., 2004; Hawley & Fujii, 1993; Yao et al., 2004). Sung and Hanna
(1996) found a positive relationship between non-investment income and risk tolerance, while
Hochguertel (2003) found that income uncertainty was associated with reduced financial risk-
taking. Sung and Hanna (1996) also demonstrated a positive relationship between risk tolerance
and liquid assets in excess of 3 or 6 months of income. In Yao et al.’s (2004) study, the level of
non-financial assets was associated positively with higher risk tolerance. In contrast, Gibson et
al. (2013) did not find a significant relationship between wealth and financial risk tolerance, and
Hawley and Fujii (1993) found a negative relationship between wealth and risk tolerance.
Financial liabilities often affect risk taking. Leibowitz (1987), Leibowitz and Henriksson (1988),
and Sharpe and Tint (1990) described a foundation for investors to account for liabilities when
making portfolio allocation decisions, and Grable and Joo (1999) found a significantly positive
relationship between financial risk tolerance and level of financial solvency. Existing research
shows that an increase in income is associated with higher levels of risk tolerance, while income
uncertainty appears to be associated with lower levels of risk tolerance. The relationship
between wealth and financial risk tolerance is undetermined.
1.1.2.3 Use of a financial planner
GENDER DIFFERENCES RISK TOLERANCE 9
Gibson et al. (2013) found a positive relationship between using a financial advisor and
risk tolerance, and Bernasek and Shwiff (2001) reported that individuals tended to increase the
level of risk in their retirement savings after consulting with a financial advisor. However, Van
de Venter and Michayluk (2007) found no statistically significant effect of consulting with a
financial advisor on financial risk tolerance. The literature on the link between use of a financial
planner and financial risk tolerance is mixed.
1.1.2.4 Employment status
Self-employment has been found to affect risk tolerance, with Sung and Hanna (1996)
identifying a positive relationship between self-employment and higher risk tolerance. However,
Halek and Eisenhauer (2001) concluded that self-employment decreased risk tolerance. Brown,
Dietrich, Ortiz-Nuñez, and Taylor (2011) stated that there is a causal relationship between
attitudes toward risk and the probability of future self-employment. Yao et al. (2005) found
employment status to be significant in explaining financial risk tolerance. Previous research
shows that employment status is important to control for in studies of financial risk tolerance.
1.1.3 Demographic Characteristics Related to Risk Tolerance
Several demographic variables have been found to be related to risk tolerance. Age is
one of the factors associated with financial risk tolerance studied most widely (Grable & Lytton,
2001; Grable et al., 2009; Levy, 2015). The general consensus is that older adults are less risk
tolerant than younger adults, and there is moderate support for this idea in the literature (Gibson
et al., 2013; Grable, 2000, 2008; Hawley & Fujii, 1993; McInish, 1982; Morin & Suarez, 1983;
Palsson, 1996; Wallach & Kogan, 1961; Yao et al., 2004; Yao et al., 2011). Other research
provides evidence of a positive relationship between age and risk tolerance or fails to detect any
relationship between the two (Grable, 2000; Hanna et al., 1998; Wang & Hanna, 1997).

GENDER DIFFERENCES RISK TOLERANCE 10
Hallahan et al. (2004) and Faff, Hallahan, and McKenzie (2009) demonstrated a positive
relationship between age and risk tolerance, and a negative relationship between age-squared and
risk tolerance. These results indicate that risk tolerance first increases with age and then
decreases.
Chaulk et al. (2003) and Hallahan et al. (2004) found a negative relationship between
financial risk tolerance and the number of dependents in the household. Faff et al. (2009)
proposed a nonlinear relationship between financial risk tolerance and the number of dependents.
Education also has received moderate support in the literature as a factor related to risk tolerance,
with higher levels of education associated with greater risk tolerance (Chang, DeVaney, &
Chiremba, 2004; Chaulk et al., 2003; Grable, 2000; Grable et al., 2009; Hawley & Fujii, 1993;
Sung & Hanna, 1996; Yao et al., 2011). Individuals with a bachelor’s degree or higher were
found to be more risk tolerant than others, with the lowest educated individuals (high school
diploma or less) having the lowest risk tolerance (Grable, 2008; Halek & Eisenhauer, 2001).
Education is thought to increase a person’s capacity to evaluate risks inherent to the investment
process and therefore provides them with a higher financial risk tolerance (Hallahan et al., 2004).
However, Gibson et al. (2013) did not find a significant relationship between education and
financial risk tolerance.
Racial and ethnic background also have been found to be important in explaining risk
tolerance (Weber & Hsee, 1998). Hawley and Fujii (1993) found that whites were more risk
tolerant than were other racial/ethnic groups. Yao, Gutter, and Hanna (2005) found that,
compared with their white counterparts, black and Hispanic respondents were more likely to take
substantial financial risk (versus high, some, or no risk), but significantly less likely to take some
financial risk (versus no risk). Barsky, Juster, Kimball, and Shapiro (1997) showed that blacks
GENDER DIFFERENCES RISK TOLERANCE 11
have higher mean risk tolerance levels than do white respondents, while all studies based on the
Survey of Consumer Finances (SCF) dataset showed that black respondents were less willing
than white respondents to take investment risk (Hanna & Lindamood, 2008).
1.1.4 Expectations Related to Risk Tolerance
Previous research has shown that inheritance expectations positively affect investors’
tolerance for risk. Embrey and Fox (1997) and Gutter and Fontes (2006) concluded that
investors who expect to receive an inheritance were more likely to invest in stocks. Harness,
Finke, and Chatterjee (2009) found that expecting an inheritance appeared to contribute to
having a higher proportion of net worth in investment assets. Considerable prior research has
confirmed the influence of investment horizons on portfolio allocation. Butler and Domian
(1991) indicated that investment horizon plays a vital role in asset allocation, as “time
diversification” reduces the risks for investors with a long horizon. Zhong and Xiao (1995) and
Hariharan, Chapman, and Domian (2000) found that investors with a longer financial planning
horizon invested more in stocks and bonds. Most studies have shown that investors with poor
health favor less risky assets (Coile & Milligan, 2009; Edwards, 2008; Fan & Zhao, 2009; Love
& Smith, 2010; Rosen & Wu, 2004). Poor health also has been found to have a negative effect
on the shares of stock holdings in retirement portfolios (Yogo, 2009). Gandelman and
Hernandez-Murillo (2013) found that health satisfaction is important in explaining relative risk
aversion.
1.2 Conceptual Model
Previous studies have indicated that gender influences financial risk tolerance. However,
the literature also indicates that a household’s economic characteristics, and the respondent’s
demographic characteristics and expectations also influence financial risk tolerance. We propose
GENDER DIFFERENCES RISK TOLERANCE 12
that the independent variables may serve as moderating factors in the relationship between
gender and risk tolerance. A diagram of the empirical model for the study is provided in
Figure 1.
Insert Figure 1 here
2. Methodology
2.1 Data
This study used the 2013 Survey of Consumer Finances (SCF) dataset, which is
sponsored by the Federal Reserve Board and collected in cooperation with the Department of the
Treasury. The SCF provides information on the assets, liabilities, and financial attitudes and
characteristics of individuals and families. There are two elements in the SCF sample design: (1)
an area-probability sample, a geographically-based random sample intended to provide
information on assets that are distributed broadly in the population, such as home ownership; and
(2) a list sample, a supplemental sample that includes a disproportionate number of wealthy
families that hold a relatively large share of assets held less commonly, such as non-corporate
businesses and tax-exempt bonds. Weights are critical in interpreting the SCF data because the
sample is not an equal-probability design (Board of Governors of the Federal Reserve System,
2014).
The Federal Reserve Board also employs multiple imputation techniques to handle
missing data (Kennickell, 1997), and generates five complete datasets or “implicates” (Board of
Governors of the Federal Reserve System, 2014). When imputation techniques are used to fill in
missing data, extra variability is introduced in the data, and this variability can be incorporated
into empirical estimates using repeated-imputation inference (RII) techniques (Montalto & Sung,
1996). The coefficients and estimates of variance derived through RII techniques allow for more
GENDER DIFFERENCES RISK TOLERANCE 13
valid inferences and tests of significance (Rubin, 1987). Therefore, we used RII techniques for
the logistic regression analyses in this study.
In the personal finance research community, individual financial risk tolerance is
measured in a number of ways, and many researchers use the Survey of Consumer Finance’s
(SCF) measure of risk tolerance (e.g., Gilliam et al., 2010; Hanna et al., 2008; Yao et al., 2011).
The SCF question pertaining to risk tolerance is the only risk tolerance question that has been
asked of national samples representing all adults (Yao et al., 2004) and is used widely in the risk
tolerance literature (Gilliam et al., 2010). The SCF risk tolerance question is: “Which of the
statements on this page comes closest to the amount of financial risk that you and your
(spouse/partner) are willing to take when you save or make investments?” Respondents’ choices
include: (1) take substantial financial risks expecting to earn substantial returns; (2) take above
average financial risks expecting to earn above average returns; (3) take average financial risks
expecting to earn average returns, or (4) not willing to take any financial risks. The papers by
Yao et al. (2004, 2011) provide additional information about this question. Grable and Lytton
(2001) reported that the SCF risk tolerance question is a useful measure of financial risk
tolerance.
In the 2013 SCF dataset, 2,246 households had a household head who was not married or
partnered. Households with a married or partnered head were excluded to eliminate the
influence of the financial attitudes of a spouse or partner, following the methods of previous
researchers investigating gender differences in financial behaviors (e.g., Embrey & Fox, 1997;
Fisher, 2010). Focusing on this sample allowed us to isolate any differences in risk tolerance
that may exist between men and women. As mentioned above, there is moderate support in the
literature that marital status is a factor that affects risk tolerance, with married and non-married
GENDER DIFFERENCES RISK TOLERANCE 14
individuals exhibiting different levels of risk tolerance (Grable & Lytton, 2001; Grable et al.,
2009). For households with a married or partnered respondent, it would be impossible to
identify the primary investment decision-maker, and responses would reflect the decision-
making process of the partners, masking gender differences that may exist (Embrey & Fox,
1997).
2.2 Empirical Model
The dependent variable was financial risk tolerance. Following Yao et al. (2004), risk
tolerance categories were created using the responses to the SCF question. An additional reason
to create risk tolerance categories is that the distribution of this variable is skewed. In contrast to
the three risk tolerance categories used by Yao et al. (2004), we created two categories. We did
not use the substantial risk variable (the household is willing to take substantial financial risk)
because of the small sample size in this group. The first dichotomous variable, high risk,
combined the responses to the substantial and above average SCF risk tolerance categories
(1=substantial or above average risk; 0=average or no risk). The second dichotomous variable,
some risk, combined the responses to the substantial, above average, and average SCF risk
tolerance categories (1=substantial, above average, or average risk; 0=no risk).
The independent variables in the multivariate analysis included the respondent’s gender
(1=female; 0=male), the household’s economic characteristics, other demographic characteristics
of the respondent, and the respondent’s expectations. The economic variables included income,
income uncertainty, net worth, financial knowledge, use of a financial advisor for saving and
investment decisions, and employment status. Demographic variables included age, education,
race/ethnicity, and presence of dependent children. Expectations included expecting to receive a
GENDER DIFFERENCES RISK TOLERANCE 15
substantial amount of asset transfers including inheritance, savings horizon, and self-perceived
health status.
Income was included as a log-transformed continuous variable because of its skewed
distribution. The lowest income value was $0, so $1 was added to all values of income. This
shifted the income distribution, but did not change its shape. A dichotomous variable was
included for income uncertainty, and took a value of 1 if the household did not have a good idea
of its income in the next year, 0 otherwise. Assets and liabilities also were log-transformed
because of their skewed distributions, with negative values set to $0, and $1 added to all values.
There is no direct financial knowledge question on the SCF, so the question asking interviewers
to rate the respondent’s understanding of the survey questions was used as a proxy. The
financial knowledge variable had three categories: poor to fair (reference group), good, and
excellent. The dichotomous variable for use of a financial advisor took a value of 1 if the
household listed a financial planner as a source of information for saving and investment
decisions, and 0 otherwise. For employment status, four groups were included: unemployed
(reference group), working, self-employed, and retired.
Age was included as a continuous variable. Education categories included less than high
school diploma (reference group), high school diploma or GED, some college, bachelor’s degree,
and graduate or professional degree. Respondents were grouped into four categories of
race/ethnicity: non-Hispanic white (reference group), non-Hispanic black, Hispanic, and other.
The dichotomous variable for the presence of dependent children took a value of 1 if at least one
child under the age of 18 was part of the household, and 0 otherwise.
For the expectations variables, expecting to receive a substantial amount of asset
transfers, including an inheritance, was a dichotomous variable, with a value of 1 for expecting a
GENDER DIFFERENCES RISK TOLERANCE 16
substantial asset transfer and 0 otherwise. Three categories were included for saving horizon:
short (reference group), medium, and long. The short saving horizon variable included those
with a saving horizon of the next few months to a year, while the medium included those with a
horizon of the next few years, and the long was for those with a horizon of five years or longer.
The self-perceived health status variable included two categories: poor/fair health (reference
group), and good/excellent health.
2.3 Method of Analysis
We followed Jackson and Lindley’s (1989) method to test for statistical differences
between men and women, and decomposed those differences. A full interaction model was
estimated to evaluate the potential separate and decomposed effects of gender on risk tolerance.
This decomposition technique allows the effects of other independent variables in the model to
vary by gender, and isolates the separate effects of being female on risk tolerance. This method
was used by Gutter, Fox, and Montalto (1999) to examine racial differences in investor decision-
making, by Fisher (2010) to investigate racial differences in saving behaviors, by Fontes and
Kelly (2013) to explore ethnic differences in stock and home asset use, and by a number of other
researchers. For the full interaction model, the dependent variable for financial risk tolerance is
regressed on an intercept, the independent variables, an indicator for gender, and interacted
variables created by multiplying each independent variable by the gender variable. The
decomposition involved estimating two additional models: a reduced model that omitted the set
of interaction variables and the gender indicator, and an intermediate model that included the
gender indicator, but omitted the interaction terms.
The interaction and reduced models were compared using a likelihood ratio test to
determine whether there was a gender difference in risk tolerance (Hypothesis 1). If the
GENDER DIFFERENCES RISK TOLERANCE 17
likelihood ratio test was significant, the difference between men and women was decomposed
into the coefficient and constant effects to test Hypothesis 2. To assess whether a significant
coefficient effect existed, the interaction and intermediate models were compared using a
likelihood ratio test. In addition, the significance of χ2 statistics for individual interaction
variables was used to identify the specific coefficients that differed between men and women.
The constant effect was the part of the total difference that could not be accounted for by
differential endowments or responses. The estimated coefficient for the gender indicator
variable in the interaction model was used to assess whether a significant constant effect existed.
A significant coefficient effect provides evidence of a gender difference in the effect of the
independent variables on risk tolerance, while a significant constant effect provides evidence of a
gender difference in risk tolerance beyond the factors controlled for in the model.
3. Results
3.1 Descriptive Statistics
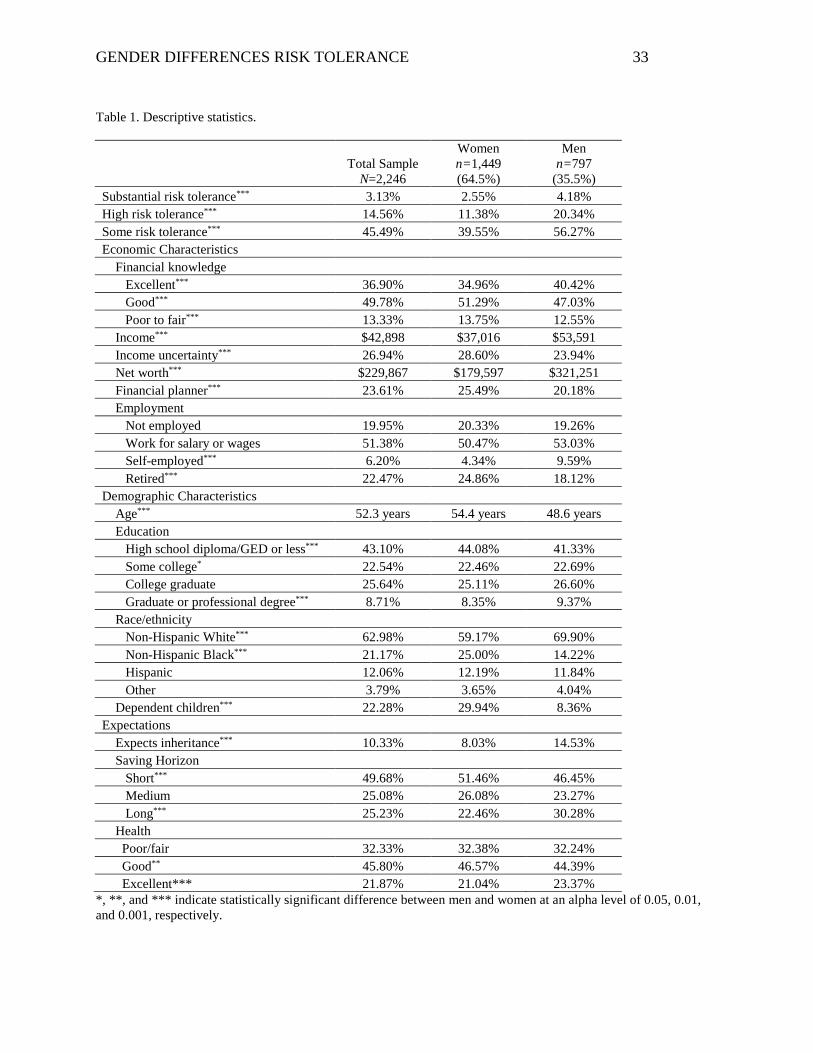
Descriptive statistics for the total sample and the tests for significant differences in the
independent variables between men and women are presented in Table 1. The sample was
composed of 64.5% women and 35.5% men (n=1,449 women, n=797 men). A significantly
greater proportion of men in the sample reported high risk tolerance (20.3%) or some risk
tolerance (56.3%) in comparison with women (high=11.4%; some=39.6%). Significant
differences between men and women were found for income, income uncertainty, net worth,
financial knowledge, and using a financial planner for saving and investment decisions. Self-
employment, being retired, average age, education, race/ethnicity, the presence of dependent
child in the household also differed significantly for men and women. In the group of variables
GENDER DIFFERENCES RISK TOLERANCE 18
related to expectations, men and women differed significantly in the following variables;
expecting an inheritance, saving horizon, and health status.
[Insert Table 1 here]
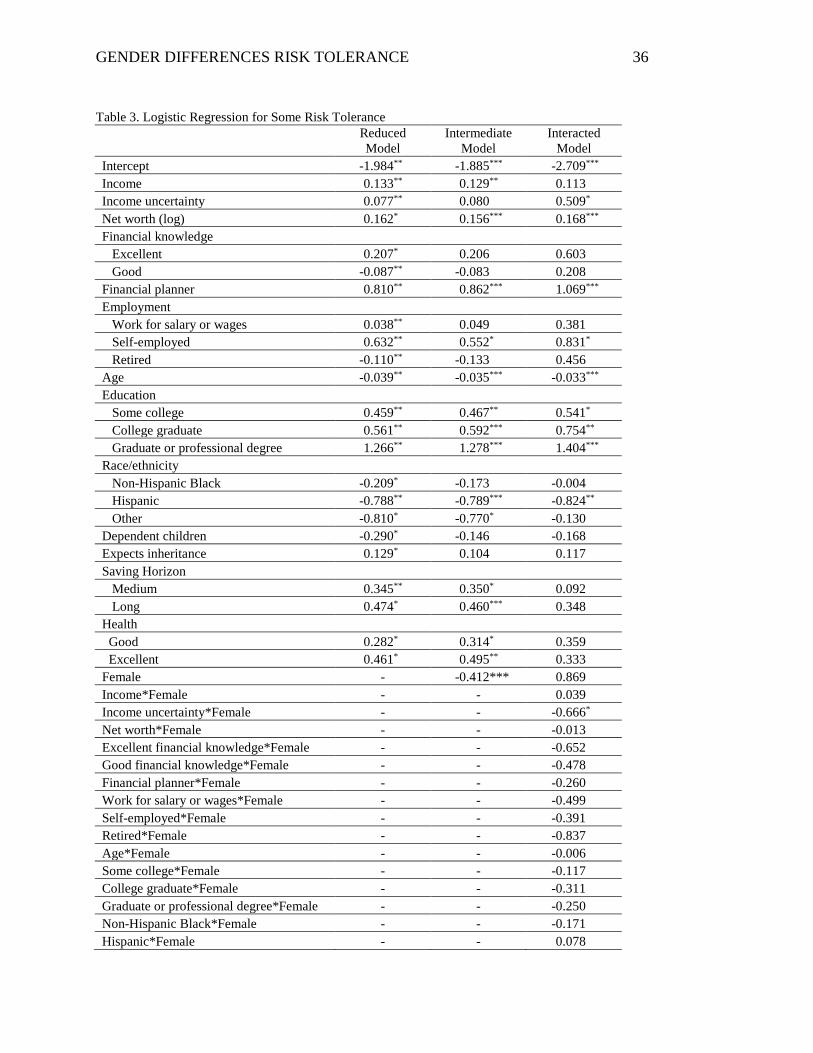
3.2 Logistic Regression Results
The results of the logistic regression for the two dependent variables, high risk tolerance
and some risk tolerance, are shown in Tables 2 and 3, respectively. The female indicator
variable in the intermediate model for both high and some risk tolerance was significant and
negative, indicating that women were significantly less likely than were men to report tolerance
for high and some risk. This result supports Hypothesis 1. The joint test of the female indicator
variable and the set of interaction terms in both risk tolerance models was highly significant
(p<0.001). This shows that a gender difference in risk tolerance exists, and these significant
results led us to decompose the total between-group difference.
[Insert Tables 2 and 3 here]
The decomposition of the between-group difference showed an insignificant constant
effect (p=0.54 for the high-risk tolerance model and p=0.44 for the some risk tolerance model)
and a significant coefficient effect (p<0.001 for both models), thereby supporting a significant
difference in the response of the dependent variable to changes in the independent variables
between the two groups. This supports Hypothesis 2, which posited that the gender difference in
risk tolerance is related to gender differences in the determinants of risk tolerance, rather than to
gender itself. The female indicator variable in the interaction model was insignificant for both
high and some risk tolerance, which does not support a constant effect, or indicates that part of
the total gender difference cannot be accounted for by differential endowments or responses.
GENDER DIFFERENCES RISK TOLERANCE 19
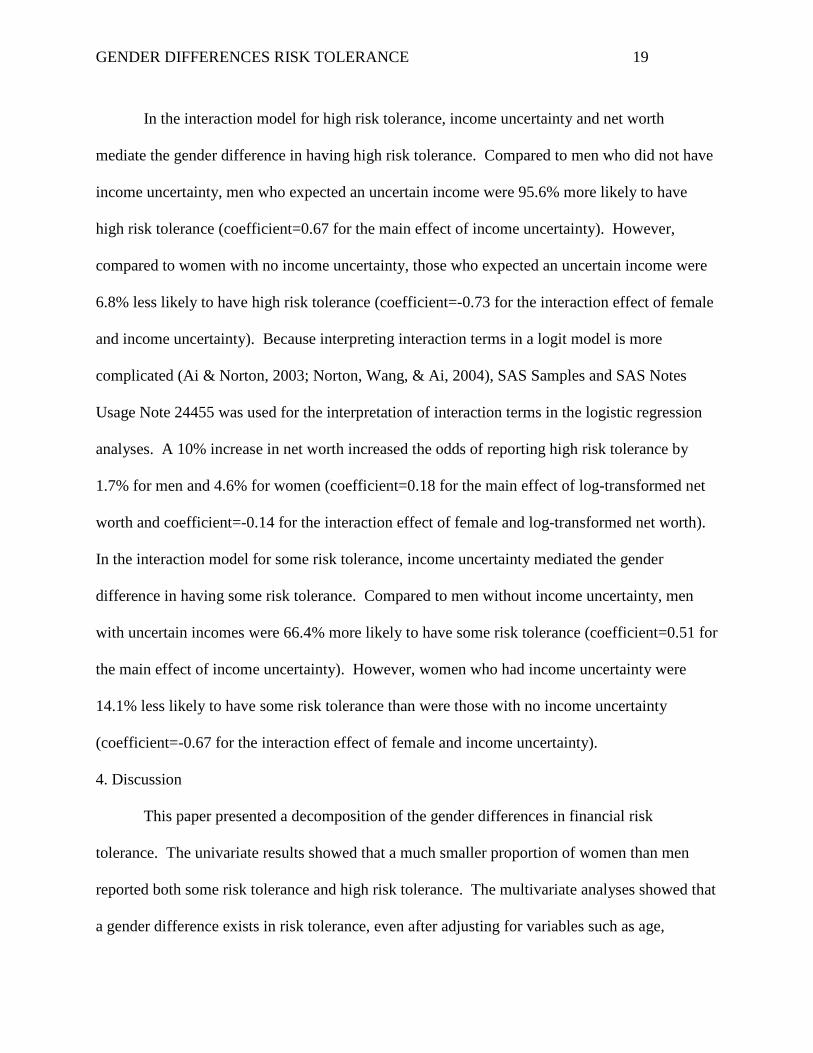
In the interaction model for high risk tolerance, income uncertainty and net worth
mediate the gender difference in having high risk tolerance. Compared to men who did not have
income uncertainty, men who expected an uncertain income were 95.6% more likely to have
high risk tolerance (coefficient=0.67 for the main effect of income uncertainty). However,
compared to women with no income uncertainty, those who expected an uncertain income were
6.8% less likely to have high risk tolerance (coefficient=-0.73 for the interaction effect of female
and income uncertainty). Because interpreting interaction terms in a logit model is more
complicated (Ai & Norton, 2003; Norton, Wang, & Ai, 2004), SAS Samples and SAS Notes
Usage Note 24455 was used for the interpretation of interaction terms in the logistic regression
analyses. A 10% increase in net worth increased the odds of reporting high risk tolerance by
1.7% for men and 4.6% for women (coefficient=0.18 for the main effect of log-transformed net
worth and coefficient=-0.14 for the interaction effect of female and log-transformed net worth).
In the interaction model for some risk tolerance, income uncertainty mediated the gender
difference in having some risk tolerance. Compared to men without income uncertainty, men
with uncertain incomes were 66.4% more likely to have some risk tolerance (coefficient=0.51 for
the main effect of income uncertainty). However, women who had income uncertainty were
14.1% less likely to have some risk tolerance than were those with no income uncertainty
(coefficient=-0.67 for the interaction effect of female and income uncertainty).
4. Discussion
This paper presented a decomposition of the gender differences in financial risk
tolerance. The univariate results showed that a much smaller proportion of women than men
reported both some risk tolerance and high risk tolerance. The multivariate analyses showed that
a gender difference exists in risk tolerance, even after adjusting for variables such as age,

GENDER DIFFERENCES RISK TOLERANCE 20
income, and saving horizon. We demonstrated that the gender difference in risk tolerance
resulted from differences in the relationship between the independent variables and risk tolerance
for men and women, rather than gender itself. Thus, the results indicated that the economic
characteristics, demographic characteristics, and expectations serve as moderating variables in
the relationship between gender and risk tolerance.
Among the variables, two of the economic variables had significantly different
relationships with financial risk tolerance among men and women. Income uncertainty had a
negative effect on having some or high risk tolerance among women, but a positive effect on
men’s likelihood of having high or some risk tolerance. It is possible that the types of income
uncertainty experienced by men and women differ. Further, higher net worth was positively
associated with men having high risk tolerance. In the logistic regression analyses, which
adjusted for income, education, and other variables, none of the demographic or expectations
variables differed significantly between men and women.
The findings in this study increase our understanding of the reasons why women are less
risk tolerant than men. Most previous research showing that women are more risk averse did not
explain the source of the gender difference, so simply telling women to be more risk tolerant
would be ineffective. On the contrary, it might encourage women to take more financial risks
than they can tolerate, which could lead to more problems in the future. We found that
differences in the relationship between individual characteristics and risk tolerance, rather than
gender itself, lead to the existing gender difference.
One limitation of the current study is that the risk tolerance measure was based on a
single question. Grable and Lytton (2001) stated that the SCF risk tolerance question does not
represent the full spectrum of financial risk tolerance, but might reflect investment choice
GENDER DIFFERENCES RISK TOLERANCE 21
attitudes or experience. Although the SCF question provides useful information, an additional
question on risk perception or other risk constructs could also offer valuable information.
The findings of this study have implications for individuals and financial fiduciaries. The
uncertain prospects for Social Security and employers’ transition from defined benefit to defined
contribution plans make individuals increasingly responsible for managing their own finances
and retirement savings. We know that women need to take higher risks to obtain higher returns
and build more wealth because of their longevity, and these results indicate that financial
fiduciaries should focus on gender differences in the relationship between income uncertainty,
net worth, and risk tolerance. This may be challenging given that financial advisors
underestimate women’s risk tolerance (Roszkowski & Grable, 2005) and may give women more
conservative investment advice than men (Bajtelsmit & Bernasek, 1996).
Our results indicated that women have lower incomes, on average, and a higher
percentage have uncertain incomes from year to year. Women may need to keep funds in
accounts with low returns to buffer the risk of negative income shocks. This has a negative
effect on women’s accumulation of wealth over time and reduces their standard of living in old
age. On average, women also have lower net worth than men. While net worth increased risk
tolerance for both men and women, it did not affect women as much as it did men. With lower
average incomes, lower net worth, and more years of retirement, women may be served best by
following Ho et al.’s (1994) recommendation to hold riskier portfolios. However, as shown in
the prior literature, this is not the case in reality. On the other hand, men with income
uncertainty were more risk tolerant at both levels (high and some) than were those with certain
incomes. This indicates that men with uncertain incomes may need to review their portfolio
GENDER DIFFERENCES RISK TOLERANCE 22
allocation and determine whether the risks they are taking are appropriate, given the degree of
certainty of their future income and net worth.
The difference in investment advice received by men and women (e.g., Bajtelsmit &
Bernasek, 1996; Roszkowski & Grable, 2005) requires further investigation, particularly given
the new fiduciary standard for financial advisors. Approximately one quarter of women and one
fifth of men in the sample reported using a financial planner for saving and investment decisions,
but the advice given to women may not be in their best interest. Investment risk-taking and
portfolio allocation affect wealth accumulation directly, which determines one’s standard of
living during retirement. The results of this study showed that women are less risk tolerant than
men not due to gender itself, but because of the gender difference in other factors that are related
to risk tolerance. When conducting financial analyses and developing investment
recommendations, financial planning fiduciaries thus need to understand the differences in
income uncertainty and net worth between men and women and the way in which these
differences relate to risk tolerance and other financial behaviors. Financial advisors must
understand the unique financial needs of women in order to provide advice that is in the client’s
best interest.
GENDER DIFFERENCES RISK TOLERANCE 23
References
Arano, K., Parker, C., & Terry, R. (2010). Gender-based risk aversion and retirement asset
allocation. Economic Inquiry, 48, 147-155.
Bajtelsmit, V. L. & Bernasek, A. (1996). Why do women invest differently than men? Journal of
Financial Counseling and Planning, 7, 1-10.
Bajtelsmit, V. L., Bernasek, A., & Jianakopolos, N. A. (1996). Gender effects in pension
investment allocation decisions. Center for Pension and Retirement Research, 145-156.
Barber, B. M., & Odean, T. (2001). Boys will be boys: Gender, overconfidence, and common
stock investment. The Quarterly Journal of Economics, 116, 261-291.
Barsky, R. B., Juster, F. T., Kimball, M. S., & Shapiro, M. D. (1997). Preference parameters and
behavioral heterogeneity: An experimental approach in the Health and Retirement Study.
Quarterly Journal of Economics, 112, 537-79.
Bernasek, A., & Shwiff, S. (2001). Gender, risk, and retirement. Journal of Economic Issues, 35,
345-356.
Board of Governors of the Federal Reserve System. (2014). Codebook for 2013 Survey of
Consumer Finances. Division of Research and Statistics. Retrieved from
https://www.federalreserve.gov/econresdata/scf/files/codebk2013.txt
Brown, S., Dietrich, M., Ortiz-Nuñez, A., Taylor, K. (2011). Self-employment and attitudes
toward risk: Timing and unobserved heterogeneity. Journal of Economic Psychology, 32,
425-433.
Bucciol, A., & Zarri, L. (2015). The shadow of the past: Financial risk taking and negative life
events. Journal of Economic Psychology, 48, 1-16.

GENDER DIFFERENCES RISK TOLERANCE 24
Butler, K. C., & Domian, D. L. (1991). Risk, diversification, and the investment horizon. The
Journal of Portfolio Management, 17(3), 41-47.
Byrnes, J. P., Miller, D. C., & Schafer, W. D. (1999). Gender differences in risk taking: A meta-
analysis. Psychological Bulletin, 125, 367–383.
Chang, C., DeVaney, S. A., & Chiremba, S. T. (2004). Determinants of subjective and objective
risk tolerance. Journal of Personal Finance, 3, 53-67.
Chaulk, B., Johnson, P. J., & Bulcroft, R. (2003). Effects of marriage and children on financial
risk tolerance: A synthesis of family development and prospect theory. Journal of Family
and Economic Issues, 24, 257-279.
Coile, C., & Milligan, K. (2009). How household portfolios evolve after retirement: The effect of
aging and health shocks. Review of Income and Wealth, 55(2), 226-248.
Cupples, S., Rasure, E., & Grable, J. E. (2013). Educational achievement as a mediator between
gender and financial risk tolerance: An exploratory study. Ewha Journal of Social
Sciences, 6, 151-180.
D’Acunto, F. (2015). Identity, overconfidence, and investment decisions. Working Paper.
Retrieved from http://papers.ssrn.com/sol3/papers.cfm?abstract_id=2641182
DeVaney, S., & Su, Y. (1997). Factors predicting the most important source of retirement
income. Compensation & Working Conditions, 2, 25-51.
Dwyer, P. D., Gilkenson, J. H., & List, J. A. (2002). Gender differences in revealed risk taking:
Evidence from mutual fund investors. Economics Letters, 76, 151-158.
Edwards, R. D. (2008). Health risk and portfolio choice. Journal of Business & Economic
Statistics, 26(4), 472-485.
GENDER DIFFERENCES RISK TOLERANCE 25
Embrey, L., & Fox, J. (1997). Gender differences in the investment decision-making process.
Journal of Financial Counseling and Planning, 8(2), 33-40.
Fan, J. X., & Xiao, J. J. (2006). Cross-cultural differences in risk tolerance: A comparison
between Chinese and Americans. Journal of Personal Finance, 5, 54-75.
Fan, E., & Zhao, R. (2009). Health status and portfolio choice: Causality or heterogeneity?
Journal of Banking & Finance, 33(6), 1079-1088.
Faff, R., Hallahan, T., & McKenzie, M. (2009). Nonlinear linkages between financial risk
tolerance and demographic characteristics. Applied Economics Letters, 16, 1329-1332.
Faff, R., Mulino, D, & Chai, D. (2008). On the linkage between financial risk tolerance and risk
aversion. Journal of Financial Research, 31, 1-23.
Finke, M. S., & Huston, S. J. (2003). The brighter side of financial risk: Financial risk tolerance
and wealth. Journal of Family and Economic Issues, 24, 233-256.
Fisher, P. J. (2010). Black-white differences in saving behavior. Financial Services Review, 19,
1-16.
Fonseca, R., Mullen, K., Zamarro, G., & Zissimopoulos, J. (2010). What explains the gender gap
in financial literacy? The role of household decision-making. Rand Labor and Population
Working Paper Series, WR-762.
Fontes, A., & Kelly, N. (2013). Factors affecting wealth accumulation in Hispanic households: A
comparative analysis of stock and home asset utilization. Hispanic Journal of Behavioral
Sciences, 35(4), 565-587.
Gandelman, N., & Hernandez-Murillo, R. (2013). What do happiness and health satisfaction data
tell us about relative risk aversion? Journal of Economic Psychology, 39, 301-312.
GENDER DIFFERENCES RISK TOLERANCE 26
Gibson, R., Michayluk, D., & Van de Venter, G. (2013). Financial risk tolerance: An analysis of
unexplored factors. Financial Services Review, 22(1), 23-50.
Gilliam, J., Chatterjee, W., & Grable, J. (2010). Measuring the perception of financial risk
tolerance: A tale of two measures. Journal of Financial Counseling and Planning, 21, 30-
43.
Grable, J. E. (2000). Financial risk tolerance and additional factors that affect risk taking in
everyday money matters. Journal of Business and Psychology, 14, 625-630.
Grable, J. E. (2008). Risk tolerance. In J. J. Xiao (Ed.), Advances in consumer financial behavior
research (pp. 1-20). New York, NY: Springer.
Grable, J. E., & Joo, S. (1999). Factors related to risk tolerance: A further examination.
Consumer Interests Annual, 45, 53-58.
Grable, J. E., & Joo, S. (2000). A cross-disciplinary examination of financial risk tolerance.
Consumer Interests Annual, 46, 151-157.
Grable, J. E., & Joo, S. (2004). Environmental and biopsychosocial factors associated with risk
tolerance. Journal of Financial Counseling and Planning, 15, 73-82.
Grable, J. E., & Lytton, R. H. (2001). Investor risk tolerance: Testing the efficacy of
demographics as differentiating and classifying factors. Journal of Financial Counseling
and Planning, 9, 61-74.
Grable, J. E., McGill, S., & Britt, S. (2009). Risk tolerance estimation bias: The age effect.
Journal of Business and Economics Research, 7(7), 1-12.
Gutter, M. S., & Fontes, A. (2006). Racial differences in risky asset ownership: A two-stage
model of the investment decision-making process. Journal of Financial Counseling and
Planning, 17(2), 64-78.

GENDER DIFFERENCES RISK TOLERANCE 27
Gutter, M. S., Fox, J. J., & Montalto, C. P. (1999). Racial differences in investor decision
making. Financial Services Review, 8, 149-163.
Halek, M., & Eisenhauer, J. G. (2001). Demography of risk aversion. The Journal of Risk and
Insurance, 68, 1-24.
Hallahan, T. A., Faff, R. W., & McKenzie, M. D. (2004). An empirical investigation of personal
financial risk tolerance. Financial Services Review, 13, 57-78.
Hanna, S. D., Gutter, M., & Fan, J. (1998). A theory based measure of risk tolerance.
Proceedings of the Academy of Financial Services, 10-11.
Hanna, S. D., & Lindamood, S. (2008). The decrease in stock ownership by minority households.
Journal of Financial Counseling and Planning, 19, 46-58.
Hanna, S. D., Waller, W., Finke, M. (2008). The concept of risk tolerance in personal financial
planning. Journal of Personal Finance, 7, 96-108.
Hariharan, G., Chapman, K. S., & Domian, D. L. (2000). Risk tolerance and asset allocations for
investors nearing retirement. Financial Services Review, 9, 159-170.
Harness, N., Finke, M. S., & Chatterjee, S. (2009). The effects of the capital accumulation ratio
on wealth. Journal of Financial Counseling and Planning, 20, 44-57.
Hawley, C. B., & Fujii, E. T. (1993). An empirical analysis of preferences for financial risk:
Further evidence on the Friedman-Savage model. Journal of Post Keynesian Economics,
16, 197-204.
Hinz, R. P., McCarthy, D. D., & Turner, J. A. (1997). Are women more conservative investors?
Gender differences in participant-directed pension investments. In M. S. Gordon, O. S.
Mitchell, & M. M. Twinney (Eds.), Positioning pensions for the twenty-first century.
Philadelphia, PA: University of Pennsylvania Press.
GENDER DIFFERENCES RISK TOLERANCE 28
Ho, K., Milevsky, M. A., & Robinson, C. (1994). Asset allocation, life expectancy, and shortfall.
Financial Services Review, 3, 109-126.
Hochguertel, S. (2003). Precautionary motives and portfolio decisions. Journal of Applied
Econometrics, 18, 61-77.
Jackson, J. D., & Lindley, J. T. (1989). Measuring the extent of wage discrimination: A
statistical test and a caveat. Applied Economics, 21, 515-540.
Jianakoplos, N. A., & Bernasek, A. (1998). Are women more risk averse? Economic Inquiry, 36,
620-630.
Kennickell, A. (1997). Multiple imputation and disclosure protection: The case of the 1995
Survey of Consumer Finances. Board of Governors of the Federal Reserve System,
Washington, D.C.
Leibowitz, M. L. (1987). Pension asset allocation through surplus management. Financial
Analysts Journal, 43, 29-40.
Leibowitz, M. L., & Henriksson, R. D. (1988). Portfolio optimization within a surplus
framework. Financial Analysts Journal, 44, 43-51.
Lemaster, P., & Strough, J. (2014). Beyond Mars and Venus: Understanding gender differences
in financial risk tolerance. Journal of Economic Psychology, 42, 148-160.
Levy, M. (2015). An evolutionary explanation for risk aversion. Journal of Economic
Psychology, 46, 51-61.
Love, D. A., & Smith, P. A. (2010). Does health affect portfolio choice? Health Economics, 19,
1441-1460.
Lusardi, A., & Mitchell, L. (2007). Financial literacy and retirement preparedness: Evidence and
implications for financial education. Business Economics, 42, 35-44.
GENDER DIFFERENCES RISK TOLERANCE 29
McInish, T. H. (1982). Individual investors and risk-taking. Journal of Economic Psychology, 2,
125-136.
Montalto, C. P., & Sung, J. (1996). Multiple imputation in the 1992 Survey of Consumer
Finances. Journal of Financial Counseling and Planning, 7, 133-146.
Morin, R. A., & Suarez, A. F. (1983). Risk aversion revisited. Journal of Finance, 38, 1201-
1216.
Neelakantan, U. (2010). Estimation and impact of gender differences in risk tolerance. Economic
Inquiry, 48, 228-233.
Olsen, R. A., & Cox, C. M. (2001). The influence of gender on the perception and response to
investment risk: The case of professional investors. Journal of Psychology and Financial
Markets, 2, 29-36.
Palsson, A. M. (1996). Does the degree of risk aversion vary with household characteristics?
Journal of Economic Psychology, 18, 605-628.
Plax, T. G., & Rosenfeld, L. B. (1976). Correlates of risky decision making. Journal of
Personality Assessment, 40, 413-418.
Riley, W. B., & Chow, K. W. (1992). Asset allocation and individual risk aversion. Financial
Analysts Journal, 48, 32-37.
Rosen, H. S., & Wu, S. (2004). Portfolio choice and health status. Journal of Financial
Economics, 72, 457-484.
Roszkowski, M. J., & Grable, J. (2005). Gender stereotypes in advisors’ clinical judgments of
financial risk tolerance: Objects in the mirror are closer than they appear to be. The
Journal of Behavioral Finance, 6, 181-191.
Rubin, D. B. (1987). Multiple imputation for nonresponse in surveys. New York, NY: Wiley.
GENDER DIFFERENCES RISK TOLERANCE 30
Sachse, K., Jungermann, H., & Belting, J. M. (2012). Investment risk—The perspective of
individual investors. Journal of Economic Psychology, 33, 437-447.
SAS Samples and SAS Notes. (n.d.). Usage Note 24455: Estimating an odds ratio for a variable
involved in an interaction. Retrieved from http://support.sas.com/kb/24/455.html
Schoemaker, P. J. (1990). Are risk attitudes related across domains and response modes?
Management Science, 36, 1451-1463.
Sharpe, W. F., & Tint, L. G. (1990). Liabilities—a new approach. Journal of Portfolio
Management, 16, 5-10.
Sunden, A. E., & Surrette, B. J. (1998). Gender differences in the allocation of assets in
retirement savings plans. American Economic Review, 88, 207-211.
Sung, J., & Hanna, S. (1996). Factors related to risk tolerance. Journal of Financial Counseling
and Planning, 7, 11-20.
United States Department of Labor (DOL). (2016, April). Federal Register: Definition of the
Term “Fiduciary”. Washington, DC: United States Department of Labor. Retrieved from
http://webapps.dol.gov/FederalRegister/PdfDisplay.aspx?DocId=28806
Van de Venter, G., & Michayluk, D. (2007). Subjectivity in judgments: Further evidence from
the financial planning industry. The Journal of Wealth Management, 10, 17-24.
Van de Venter, G., Michayluk, D., & Davey, G. (2010). A longitudinal study of financial risk
tolerance. Journal of Economic Psychology, 33, 794-800.
Wallach, M. M., & Kogan, N. (1961). Aspects of judgment and decision making:
Interrelationships and changes with age. Behavioral Science, 6, 23-26.
Wang, P. (1994). Brokers still treat men better than women. Money, 23, 108-110.

GENDER DIFFERENCES RISK TOLERANCE 31
Wang, H., & Hanna, S. (1997). Does risk tolerance decrease with age? Journal of Financial
Counseling and Planning, 8, 27-31.
Weber, E. U., & Hsee, C. (1998). Cross-cultural differences in risk perception, but cross-cultural
similarities in attitudes towards perceived risk. Management Science, 44, 1205-1217.
Weber, E. U., & Milliman, R. A. (1997). Perceived risk attitudes: Relating risk perception to
risky choice. Management Science, 43, 123-144.
Xiao, J. J. (1995). Patterns of household financial asset ownership. Journal of Financial
Counseling and Planning, 6, 99-106.
Yao, R., Gutter, M., & Hanna, S. (2005). The financial risk tolerance of Blacks, Hispanics, and
Whites. Journal of Financial Counseling and Planning, 16, 51-62.
Yao, R., & Hanna, S. D. (2005). The effect of gender and marital status on financial risk
tolerance. Journal of Personal Finance, 4, 66-85.
Yao, R., Hanna, S. D., & Lindamood, S. (2004). Changes in financial risk tolerance, 1983-2001.
Financial Services Review, 13, 249-266.
Yao, R., Sharpe, D. L., & Wang, F. (2011). Decomposing the age effect on risk tolerance. The
Journal of Socio-Economics, 40, 879-887.
Yogo, M. (2009). Portfolio choice in retirement: Health risk and the demand for annuities,
housing, and risky assets (No. w15307). National Bureau of Economic Research.
Zhong, L. X., & Xiao, J. J. (1995). Determinants of family bond and stock holdings. Journal of
Financial Counseling and Planning, 6, 107-114.

GENDER DIFFERENCES RISK TOLERANCE 32
Figure 1: Diagram of Empirical Model
Gender
Economic characteristics Demographic characteristics
Expectations
Risk tolerance
GENDER DIFFERENCES RISK TOLERANCE 33
Table 1. Descriptive statistics.
Total Sample
N=2,246
Women n=1,449 (64.5%)
Men n=797
(35.5%) Substantial risk tolerance*** 3.13% 2.55% 4.18% High risk tolerance*** 14.56% 11.38% 20.34% Some risk tolerance*** 45.49% 39.55% 56.27% Economic Characteristics Financial knowledge Excellent*** 36.90% 34.96% 40.42% Good*** 49.78% 51.29% 47.03% Poor to fair*** 13.33% 13.75% 12.55% Income*** $42,898 $37,016 $53,591 Income uncertainty*** 26.94% 28.60% 23.94% Net worth*** $229,867 $179,597 $321,251 Financial planner*** 23.61% 25.49% 20.18% Employment Not employed 19.95% 20.33% 19.26% Work for salary or wages 51.38% 50.47% 53.03% Self-employed*** 6.20% 4.34% 9.59% Retired*** 22.47% 24.86% 18.12% Demographic Characteristics Age*** 52.3 years 54.4 years 48.6 years Education High school diploma/GED or less*** 43.10% 44.08% 41.33% Some college* 22.54% 22.46% 22.69% College graduate 25.64% 25.11% 26.60% Graduate or professional degree*** 8.71% 8.35% 9.37% Race/ethnicity Non-Hispanic White*** 62.98% 59.17% 69.90% Non-Hispanic Black*** 21.17% 25.00% 14.22% Hispanic 12.06% 12.19% 11.84% Other 3.79% 3.65% 4.04% Dependent children*** 22.28% 29.94% 8.36% Expectations Expects inheritance*** 10.33% 8.03% 14.53% Saving Horizon Short*** 49.68% 51.46% 46.45% Medium 25.08% 26.08% 23.27% Long*** 25.23% 22.46% 30.28% Health Poor/fair 32.33% 32.38% 32.24% Good** 45.80% 46.57% 44.39% Excellent*** 21.87% 21.04% 23.37%
*, **, and *** indicate statistically significant difference between men and women at an alpha level of 0.05, 0.01, and 0.001, respectively.

GENDER DIFFERENCES RISK TOLERANCE 34
Table 2. Logistic Regression for High Risk Tolerance
Reduced Model
Intermediate Model
Interacted Model
Intercept -2.172*** -2.045*** -2.830***
Income -0.035 -0.042 -0.092 Income uncertainty 0.315* 0.310* 0.671** Net worth (log) 0.112*** 0.102** 0.182*** Financial knowledge Excellent 0.355 0.363 0.646 Good -0.086 -0.077 0.030 Financial planner 0.115 0.168 -0.011 Employment Work for salary or wages 0.053 0.062 0.480 Self-employed 0.435 0.352 0.487 Retired -0.623* -0.647* -0.198 Age -0.022*** -0.018** -0.017* Education Some college 0.224 0.240 0.589* College graduate 0.407* 0.459* 0.704** Graduate or professional degree 0.356 0.374 0.322 Race/ethnicity Non-Hispanic Black 0.150 0.211 0.082 Hispanic -0.103 -0.094 -0.113 Other -0.052 -0.022 -0.114 Dependent children -0.429* -0.270 -0.371 Expects inheritance 0.081 0.048 -0.144 Saving Horizon Medium 0.141 0.152 -0.057 Long 0.495** 0.488** 0.448 Health Good 0.312 0.362 0.037 Excellent 0.266 0.315 0.171 Female - -0.462** 0.740 Income*Female - - 0.093 Income uncertainty*Female - - -0.732* Net worth*Female - - -0.143* Excellent financial knowledge*Female - - -0.505 Good financial knowledge*Female - - -0.170 Financial planner*Female - - 0.403 Work for salary or wages*Female - - -0.631 Self-employed*Female - - -0.124 Retired*Female - - -0.746 Age*Female - - -0.000 Some college*Female - - -0.689 College graduate*Female - - -0.524 Graduate or professional degree*Female - - 0.043 Non-Hispanic Black*Female - - 0.248 Hispanic*Female - - 0.052

GENDER DIFFERENCES RISK TOLERANCE 35
Other race*Female - - 0.368 Dependent children*Female - - 0.037 Expects inheritance*Female - - 0.481 Medium saving horizon*Female - - 0.395 Long saving horizon*Female - - 0.099 Good health*Female - - 0.557 Excellent health*Female - - 0.278
*, **, and *** indicate statistical significance at an alpha level of 0.05, 0.01, and 0.001, respectively.
GENDER DIFFERENCES RISK TOLERANCE 36
Table 3. Logistic Regression for Some Risk Tolerance
Reduced Model
Intermediate Model
Interacted Model
Intercept -1.984** -1.885*** -2.709*** Income 0.133** 0.129** 0.113 Income uncertainty 0.077** 0.080 0.509* Net worth (log) 0.162* 0.156*** 0.168*** Financial knowledge Excellent 0.207* 0.206 0.603 Good -0.087** -0.083 0.208 Financial planner 0.810** 0.862*** 1.069*** Employment Work for salary or wages 0.038** 0.049 0.381 Self-employed 0.632** 0.552* 0.831* Retired -0.110** -0.133 0.456 Age -0.039** -0.035*** -0.033*** Education Some college 0.459** 0.467** 0.541* College graduate 0.561** 0.592*** 0.754** Graduate or professional degree 1.266** 1.278*** 1.404*** Race/ethnicity Non-Hispanic Black -0.209* -0.173 -0.004 Hispanic -0.788** -0.789*** -0.824** Other -0.810* -0.770* -0.130 Dependent children -0.290* -0.146 -0.168 Expects inheritance 0.129* 0.104 0.117 Saving Horizon Medium 0.345** 0.350* 0.092 Long 0.474* 0.460*** 0.348 Health Good 0.282* 0.314* 0.359 Excellent 0.461* 0.495** 0.333 Female - -0.412*** 0.869 Income*Female - - 0.039 Income uncertainty*Female - - -0.666* Net worth*Female - - -0.013 Excellent financial knowledge*Female - - -0.652 Good financial knowledge*Female - - -0.478 Financial planner*Female - - -0.260 Work for salary or wages*Female - - -0.499 Self-employed*Female - - -0.391 Retired*Female - - -0.837 Age*Female - - -0.006 Some college*Female - - -0.117 College graduate*Female - - -0.311 Graduate or professional degree*Female - - -0.250 Non-Hispanic Black*Female - - -0.171 Hispanic*Female - - 0.078

GENDER DIFFERENCES RISK TOLERANCE 37
Other race*Female - - -0.972 Dependent children*Female - - -0.079 Expects inheritance*Female - - 0.053 Medium saving horizon*Female - - 0.387 Long saving horizon*Female - - 0.164 Good health*Female - - -0.097 Excellent health*Female - - 0.252
*, **, and *** indicate statistical significance at an alpha level of 0.05, 0.01, and 0.001, respectively.
Top Related