


Languages
Pages
Legal

ROV Market Prospects
Andrew Reid, 6 September 2013, Aberdeen

www.dw‐1.com
LNG
offshore
onshore
downstream
power
LNG
renewables
• Established 1990• Aberdeen, Canterbury, London,
New York, Singapore & Houston
Activity & Service Lines• Business strategy & consulting• Commercial due-diligence• Market research & analysis• Published market studies
Large, Diversified Client Base• 1000 projects, 72 countries• Leading global corporates• Energy majors and their
suppliers• Investment banks & PE firms• Government agencies
Douglas-Westwood: Our Business
Macro Views
ROV Market Drivers
ROV Market Outlook
Conclusions
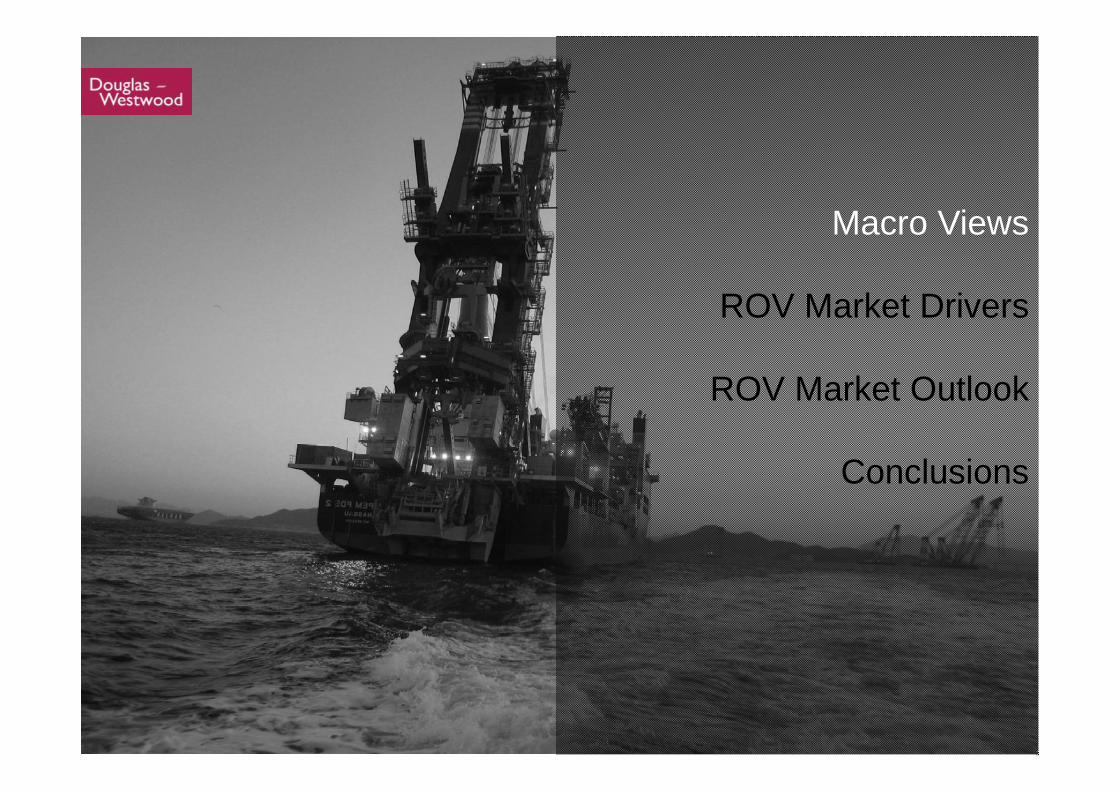
Global Energy Demand Is Expected To Grow….
• Energy intensity reaching/reached limits in many OECD countries• Developing economies will continue to drive global energy demand
Global Oil Consumption (BP)
Source: BP 2013
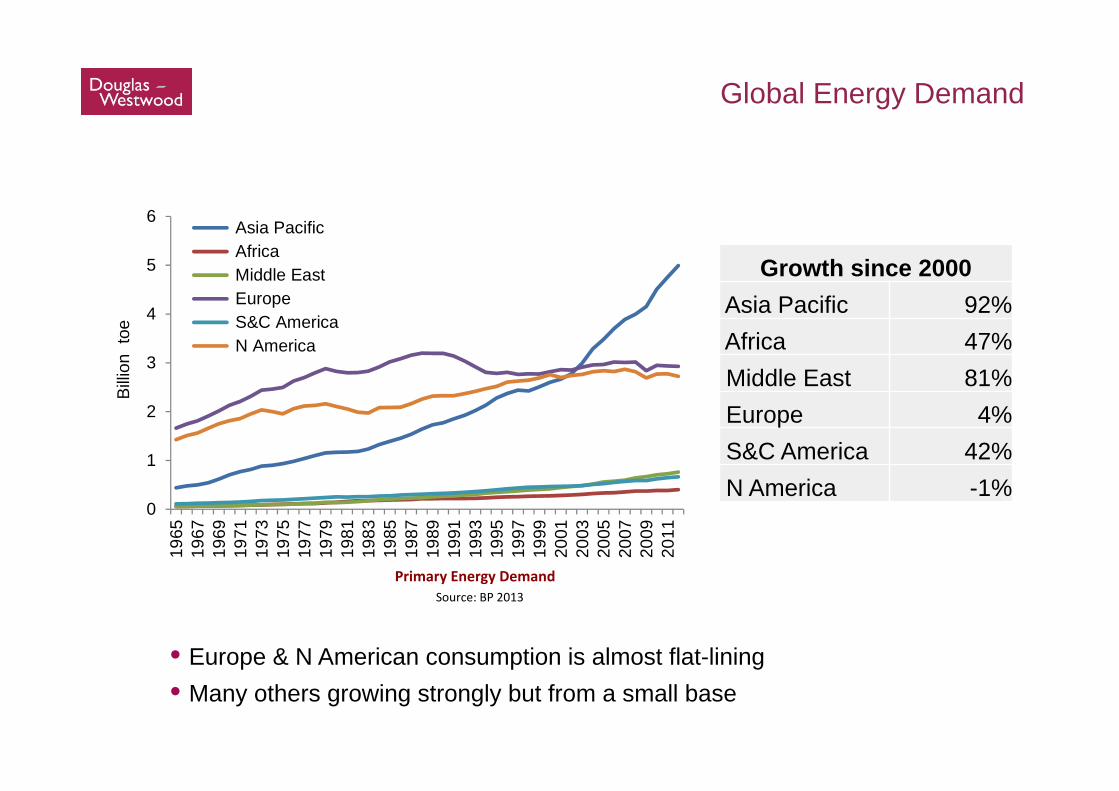
Global Energy Demand
Primary Energy Demand
0
1
2
3
4
5
6
1965
1967
1969
1971
1973
1975
1977
1979
1981
1983
1985
1987
1989
1991
1993
1995
1997
1999
2001
2003
2005
2007
2009
2011
Billio
n to
e
Asia Pacific Africa Middle East Europe S&C America N America
Growth since 2000 Asia Pacific 92%Africa 47%Middle East 81%Europe 4%S&C America 42%N America -1%
• Europe & N American consumption is almost flat-lining• Many others growing strongly but from a small base
Source: BP 2013
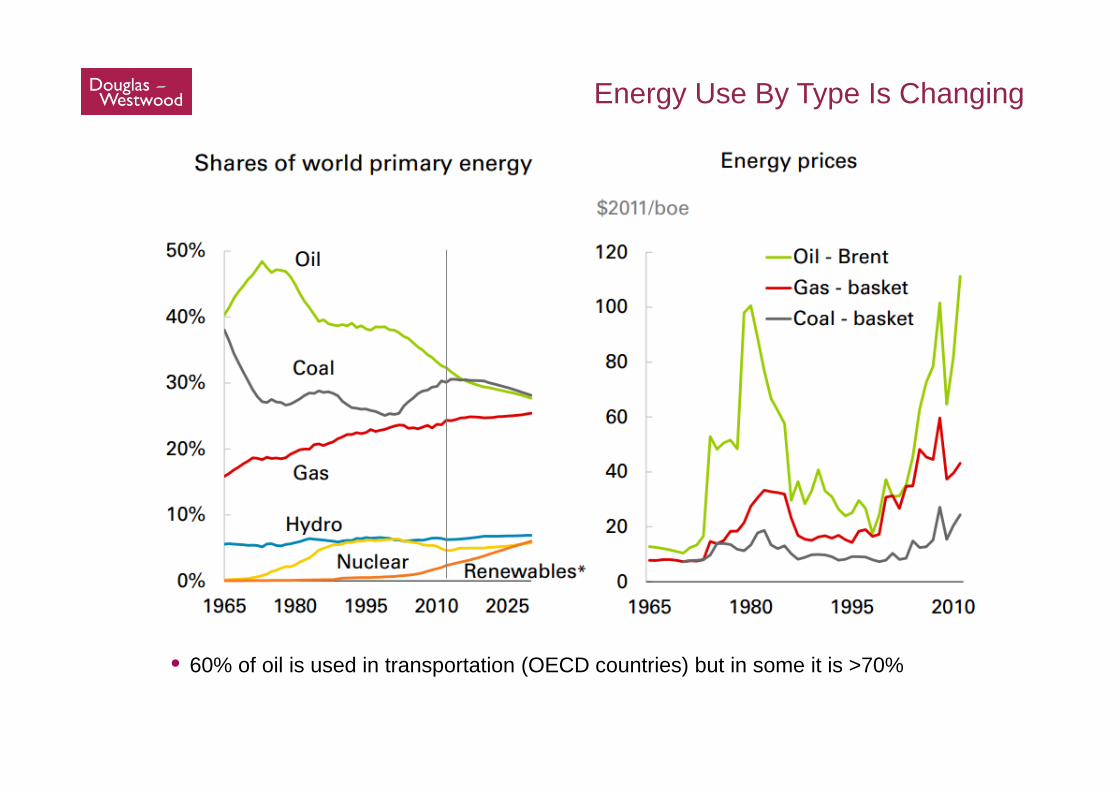
Energy Use By Type Is Changing
• 60% of oil is used in transportation (OECD countries) but in some it is >70%
Macro Views
ROV Market Drivers
ROV Market Outlook
Conclusions
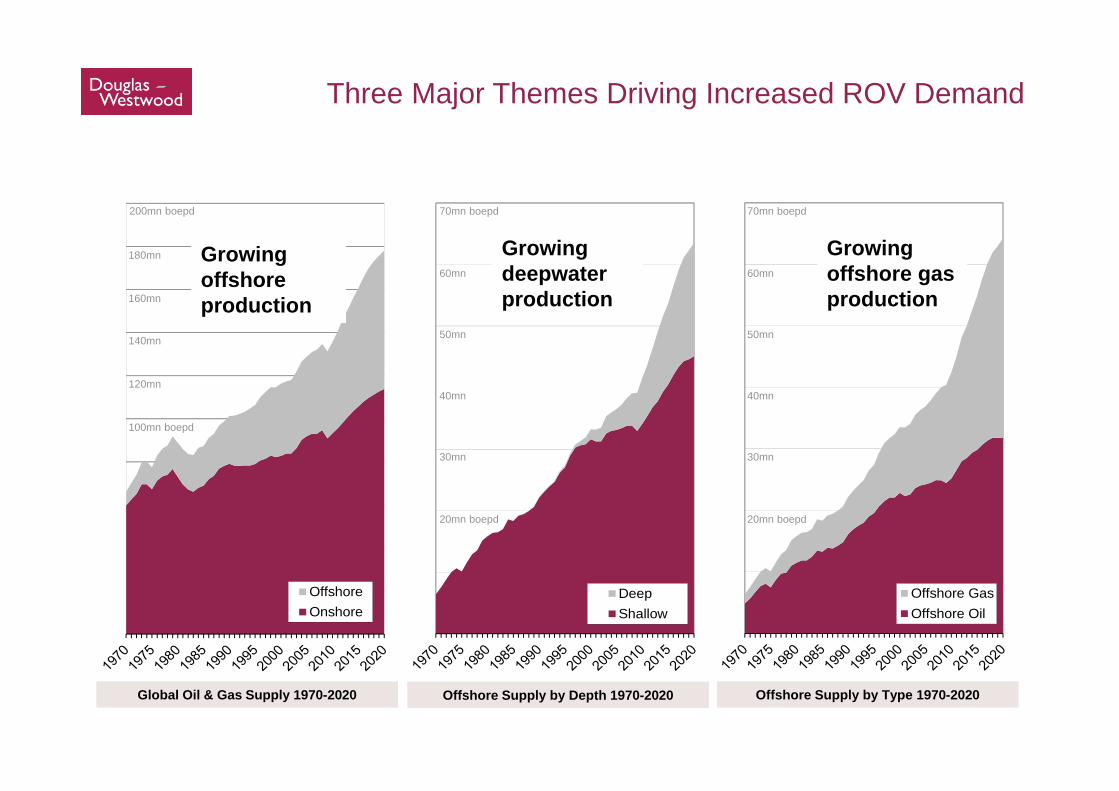
Three Major Themes Driving Increased ROV Demand
Offshore Supply by Type 1970-2020
Offshore GasOffshore Oil
20mn boepd
30mn
40mn
50mn
60mn
70mn boepd
Global Oil & Gas Supply 1970-2020
100mn boepd
120mn
140mn
160mn
180mn
200mn boepd
OffshoreOnshore
Offshore Supply by Depth 1970-2020
DeepShallow
20mn boepd
30mn
40mn
50mn
60mn
70mn boepd
Growing offshore production
Growing deepwater production
Growing offshore gasproduction

2007 2009 2011 2013 2015 2017
Deepwater Drilling (Indexed to 2007)Shallow Water Drilling (Indexed to 2007)
Drilling To Increase In Deepwater
1
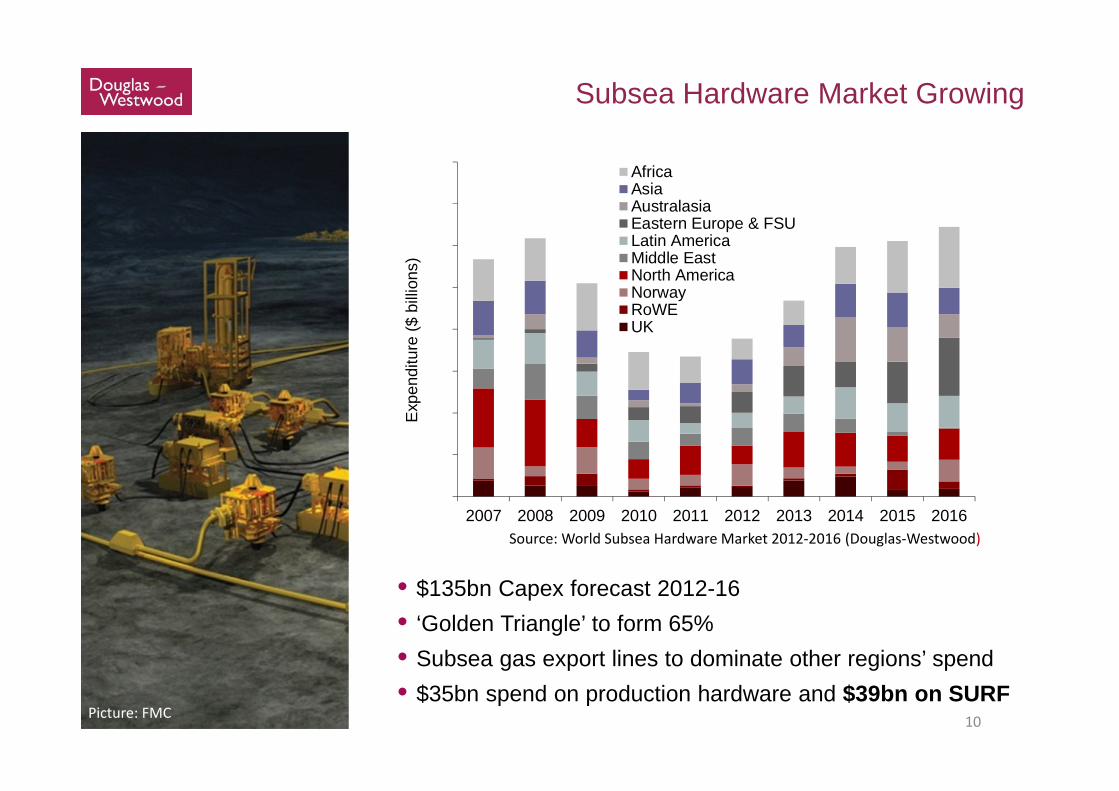
Subsea Hardware Market Growing
• $135bn Capex forecast 2012-16• ‘Golden Triangle’ to form 65%• Subsea gas export lines to dominate other regions’ spend• $35bn spend on production hardware and $39bn on SURF
Source: World Subsea Hardware Market 2012‐2016 (Douglas‐Westwood)
10
0
5
10
15
20
25
30
35
40
2007 2008 2009 2010 2011 2012 2013 2014 2015 2016
Exp
endi
ture
($ b
illio
ns)
AfricaAsiaAustralasiaEastern Europe & FSULatin AmericaMiddle EastNorth AmericaNorwayRoWEUK
Picture: FMC
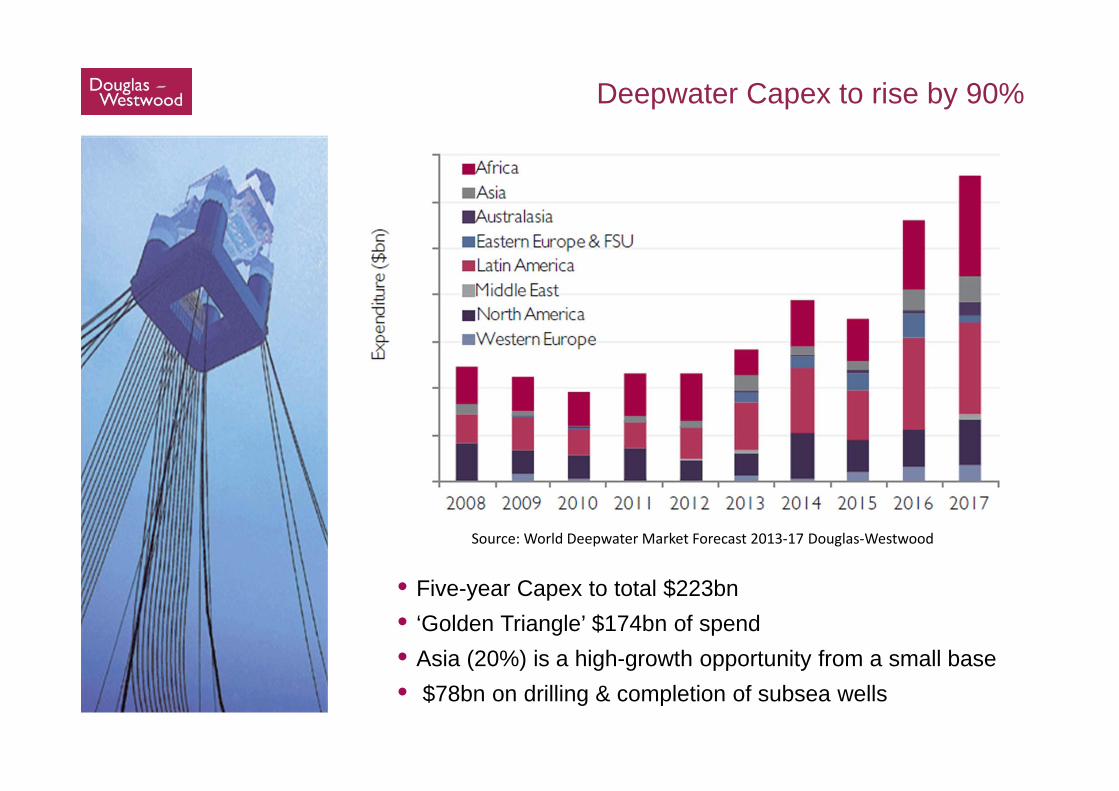
Deepwater Capex to rise by 90%
• Five-year Capex to total $223bn• ‘Golden Triangle’ $174bn of spend• Asia (20%) is a high-growth opportunity from a small base • $78bn on drilling & completion of subsea wells
Source: World Deepwater Market Forecast 2013‐17 Douglas‐Westwood

Major Cost And Margin Challenges For IOCs
Structural costs:• geology (HPHT deep &
complex)• remote locations• extreme conditions (deepwater,
arctic)• marginal fieldsDurable costs:• forex rates (e.g. Aus)Transient costs:• manufacturing bottlenecks• certain labour shortages• elevated drillship dayrates
Combined data for BG, BP, COP, CVX, ENI, OXY, PBR, RDS, STO, TOT, XOMSource: Bloomberg via Phibro Trading LLC
1999
2000
2001
2002
2003
2004
2005
2006
2007
2008
2009
2010
2011
$
mn
b/d
110
60
160
210
260
10
16.5
15.5
15.0
14.5
14.0
13.5
13.0
12.5
16.0
Liquids Production - RHS
CAPEX ($ billion) - LHS
Brent ($/bbl) - LHS
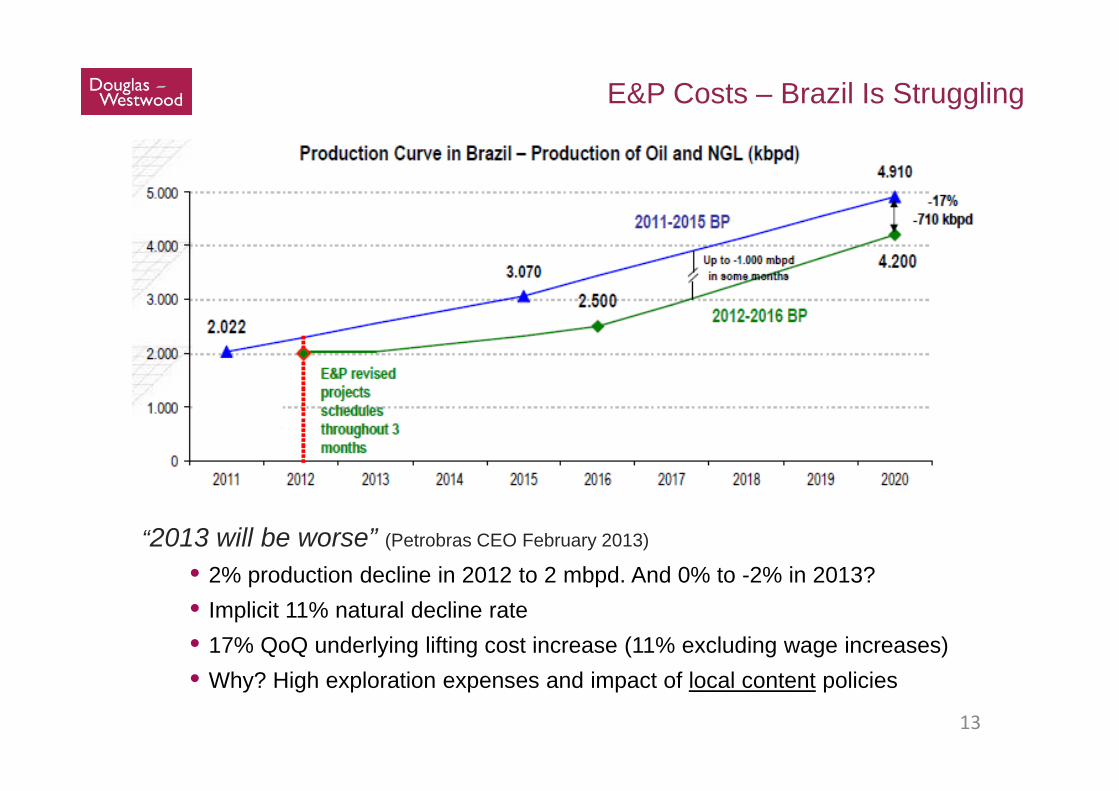
E&P Costs – Brazil Is Struggling
“2013 will be worse” (Petrobras CEO February 2013)
• 2% production decline in 2012 to 2 mbpd. And 0% to -2% in 2013?• Implicit 11% natural decline rate• 17% QoQ underlying lifting cost increase (11% excluding wage increases)• Why? High exploration expenses and impact of local content policies
13
Macro Views
ROV Market Drivers
ROV Market Outlook
Conclusions
Global ROV Expenditure
0
200
400
600
800
1,000
1,200
1,400
1,600
1,800
2,000
0
20
40
60
80
100
120
140
160
2006 2007 2008 2009 2010 2011 2012 2013 2014 2015 2016 2017
Tota
l Exp
endi
ture
($m
illion
s)
RO
V D
ays
by R
egio
n (0
00s)
AfricaAsiaAustralasiaEastern Europe & FSULatin AmericaMiddle EastNorth AmericaNorwayRoWEUKROV Expenditure
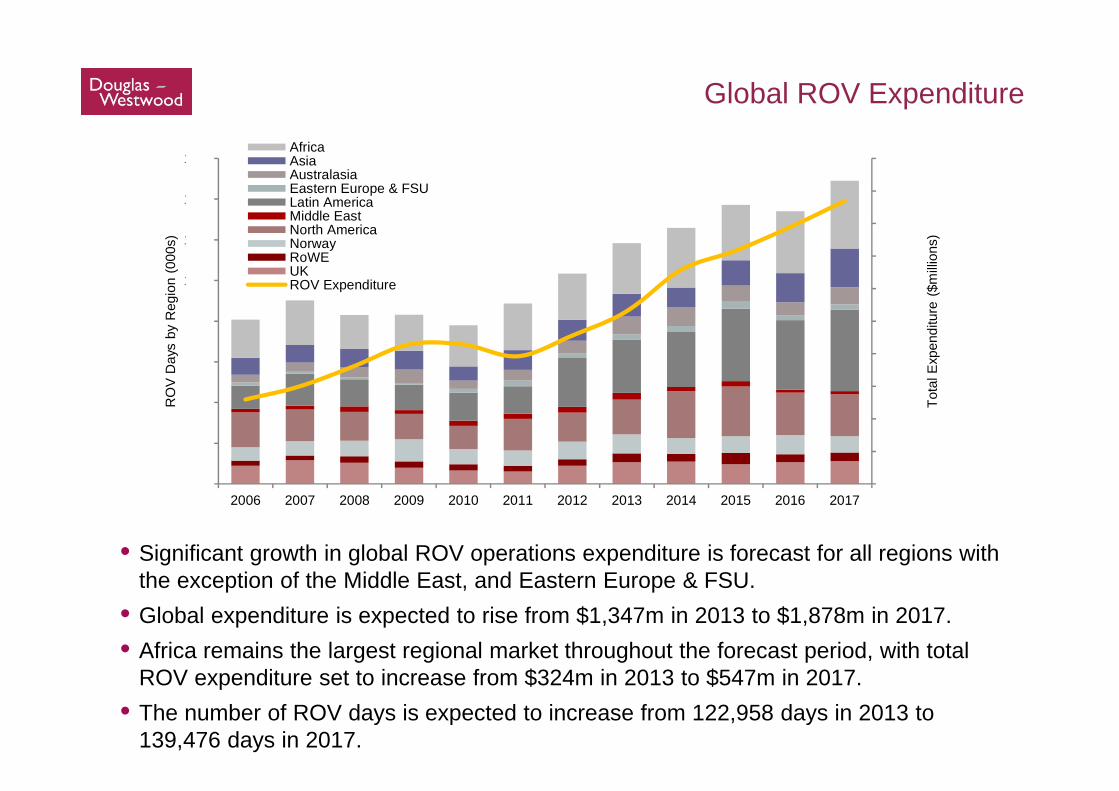
• Significant growth in global ROV operations expenditure is forecast for all regions with the exception of the Middle East, and Eastern Europe & FSU.
• Global expenditure is expected to rise from $1,347m in 2013 to $1,878m in 2017. • Africa remains the largest regional market throughout the forecast period, with total
ROV expenditure set to increase from $324m in 2013 to $547m in 2017.• The number of ROV days is expected to increase from 122,958 days in 2013 to
139,476 days in 2017.

ROV Days by Driver
0
200
400
600
800
1,000
1,200
1,400
1,600
1,800
2,000
0
20
40
60
80
100
120
140
160
180
2006 2007 2008 2009 2010 2011 2012 2013 2014 2015 2016 2017
Tota
l Exp
endi
ture
($m
illio
ns)
RO
V D
ays
by H
ardw
are
(000
s)
RM - Repair & MaintainenceDS - Subsea DV WellsDS - E&A WellsCS - Trunkline InstallationCS - FPSO Mooring & RisersCS - Subsea ProcessingCS - TMFJCS - Umbilicals & FlowlinesCS - Subsea TreesROV Expenditure
• This is driven primarily by E&A and development well drilling support requirements• E&A drilling support contributes the largest proportion of future work for ROVs,
making up almost 41% of demand days over 2013-2017.• Trunkline installation days remain steady during the forecast period, as large
projects in Asia, the Americas and Europe can take years to complete.

Macro Views
ROV Market Drivers
ROV Market Outlook
Conclusions
Conclusions
18
•Macro fundamentals are strong and support continued investment in the energy sector
• Increased investment in offshore and deepwater oil and gas production will support continued ROV demand
• Increasing costs are not sustainable and further delays and potential cancellation of projects are expected

Thank You
Top Related