


Languages
Pages
Legal


© 2005 Hans Schaefer Slide no. 1Risk based testing
Risk based testingHow to choose what to test more and less
by Hans [email protected]
- What is risk- Factors determining damage- Factors determining probability- A simple method to calculate risk- Risk management in test projects: Risks before, during and after the test
© 2005 Hans Schaefer Slide no. 2Risk based testing
The duty of testing
“It shall be the duty of managers to make decisions and the duty of engineers to make them informed ones.”Jukka Talvio, Development Manager, F-Secure
© 2005 Hans Schaefer Slide no. 3Risk based testing
Why this presentation
Because testing is always under pressureTesting is the last thing done in a project (“caboose
effect”)You must be able to cut down the least important
thingsUse optimal amount of resources for testing
© 2005 Hans Schaefer Slide no. 4Risk based testing
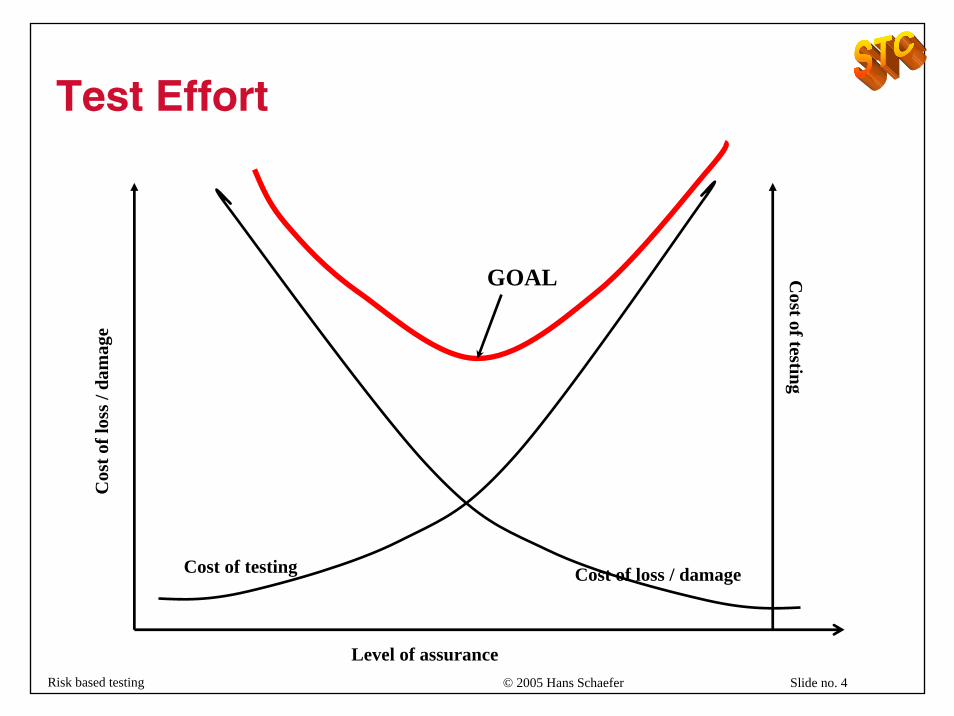
Test Effort
Level of assurance
Cost of testing
Cost of testing Cost of loss / damage
GOAL
Cos
t of l
oss /
dam
age

© 2005 Hans Schaefer Slide no. 5Risk based testing
Strategy
Objective: Find the most important defectsas early as possible at the lowest price
No risk -> No test
Business / user / client based decision

© 2005 Hans Schaefer Slide no. 6Risk based testing
What is risk?
Probability of failure
Usage frequencyQuality
(failure rate / defect density)
Damage(cost of failure)
RISK
Risk:= You don’t know what will happen but you do know the probabilitiesUncertainty = You don’t even know the probabilities.
The product of the probability, that something negative, a failure, will happen, and the cost, (damage) of the consequences which will then happen.
Damage / Use

© 2005 Hans Schaefer Slide no. 7Risk based testing
Determining probability of failure
Probability of failure
Quality(failure rate / defect density)
Functional volume(how much is “in there”)
Probability = defect density / volume
© 2005 Hans Schaefer Slide no. 8Risk based testing
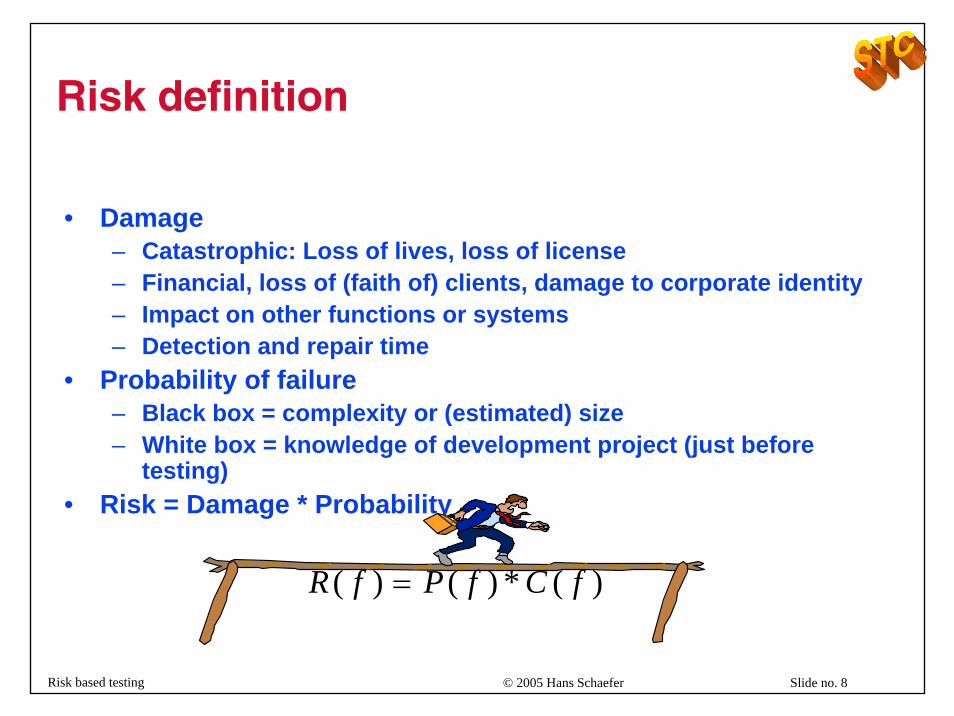
Risk definition
• Damage– Catastrophic: Loss of lives, loss of license– Financial, loss of (faith of) clients, damage to corporate identity– Impact on other functions or systems– Detection and repair time
• Probability of failure– Black box = complexity or (estimated) size– White box = knowledge of development project (just before
testing)• Risk = Damage * Probability
)(*)()( fCfPfR =
© 2005 Hans Schaefer Slide no. 9Risk based testing
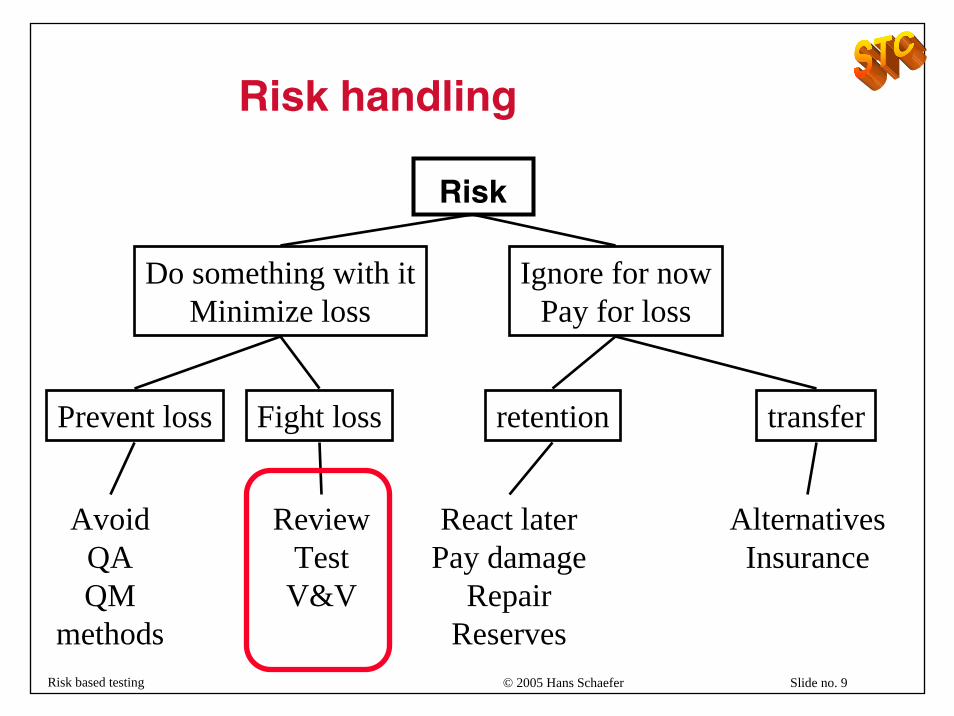
Risk handling
Risk
Do something with itMinimize loss
Ignore for nowPay for loss
Prevent loss Fight loss retention transfer
ReviewTestV&V
AvoidQAQM
methods
React laterPay damage
RepairReserves
AlternativesInsurance
© 2005 Hans Schaefer Slide no. 10Risk based testing
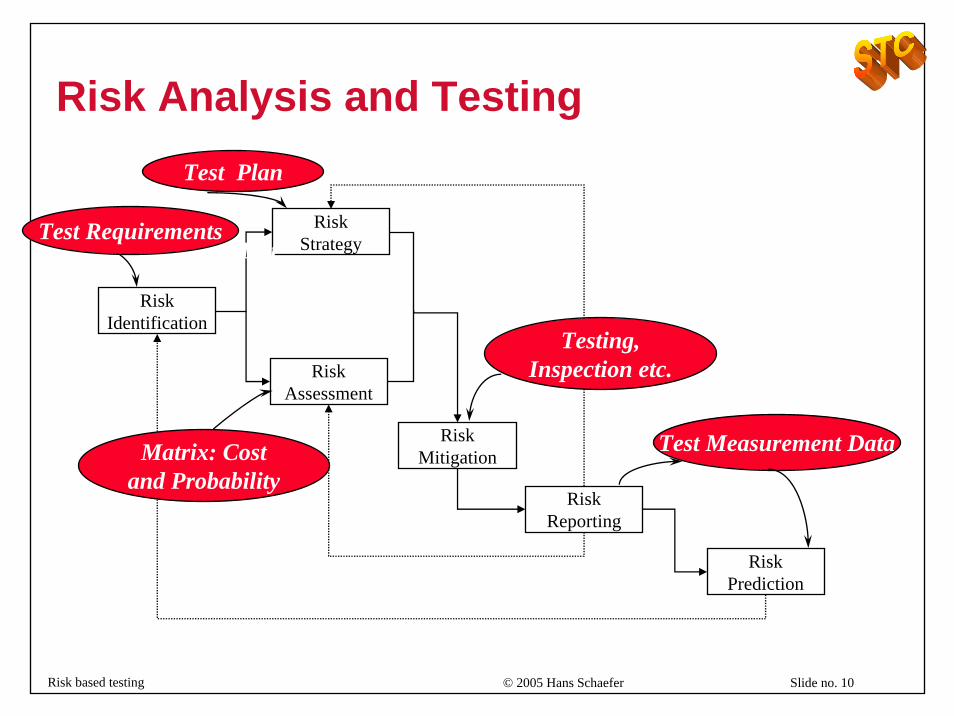
Risk Analysis and Testing
Risk Identification
Risk Strategy
Risk Assessment
Risk Mitigation
Risk Reporting
Risk Prediction
Testing, Inspection etc.
Test Plan
Matrix: Cost and Probability
Test Requirements
Test Measurement Data
List
© 2005 Hans Schaefer Slide no. 11Risk based testing
Risk analysis
• Applicable on ANY level
• Fundamental problems:–Difficult to measure–Failure to account for risk compensation (people
compensate for greater safety by taking more risks)
© 2005 Hans Schaefer Slide no. 12Risk based testing
Risk analysis
• Risk analysis should lead to a limited number ofclasses of approximately equal risks (3-5)
• Quality characteristics: What is the probability that failures will happen and the damage for– functional defects– bad performance– bad usability– low maintainability– ...
ISO/IEC Std 9126 as checklist
© 2005 Hans Schaefer Slide no. 13Risk based testing
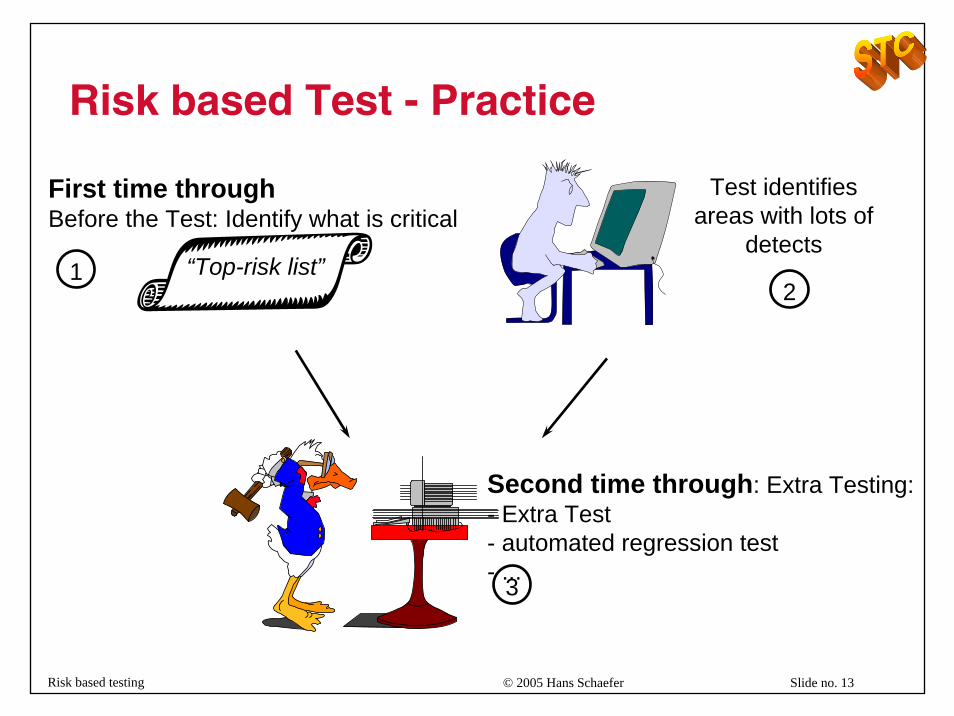
“Top-risk list”
First time throughBefore the Test: Identify what is critical
1
Test identifies areas with lots of
detects
2
Second time through: Extra Testing: - Extra Test- automated regression test- ...3
Risk based Test - Practice

© 2005 Hans Schaefer Slide no. 14Risk based testing
Prioritization for the first test
© 2005 Hans Schaefer Slide no. 15Risk based testing
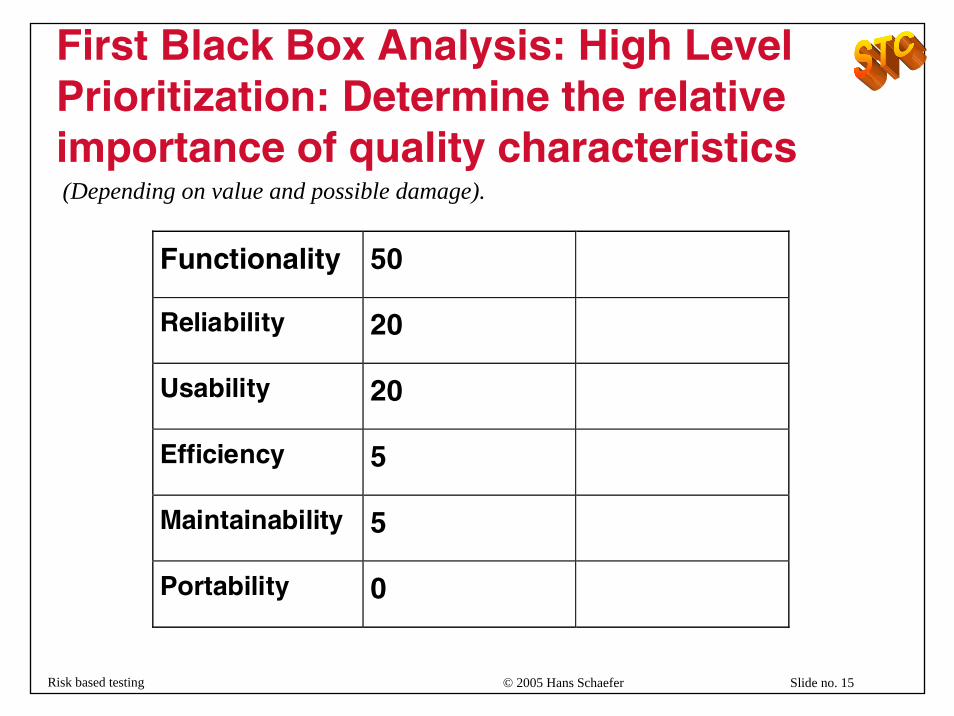
First Black Box Analysis: High Level Prioritization: Determine the relative importance of quality characteristics
Functionality 50
Reliability 20
Usability 20
Efficiency 5
Maintainability 5
Portability 0
(Depending on value and possible damage).
© 2005 Hans Schaefer Slide no. 16Risk based testing
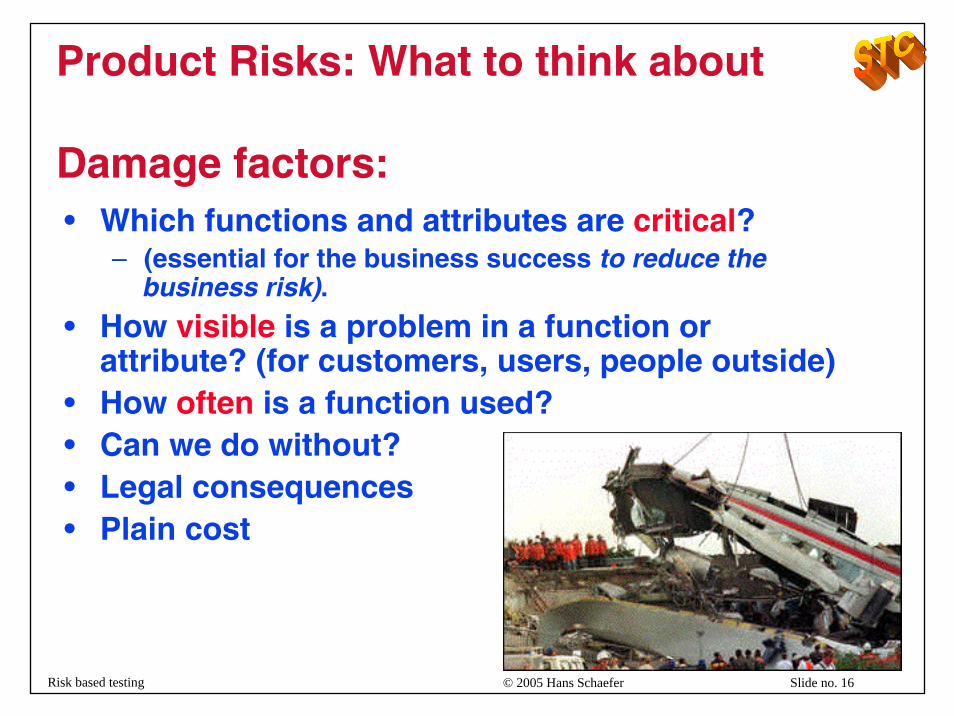
Product Risks: What to think about
Damage factors:• Which functions and attributes are critical?
– (essential for the business success to reduce the business risk).
• How visible is a problem in a function or attribute? (for customers, users, people outside)
• How often is a function used?• Can we do without?• Legal consequences• Plain cost
© 2005 Hans Schaefer Slide no. 17Risk based testing
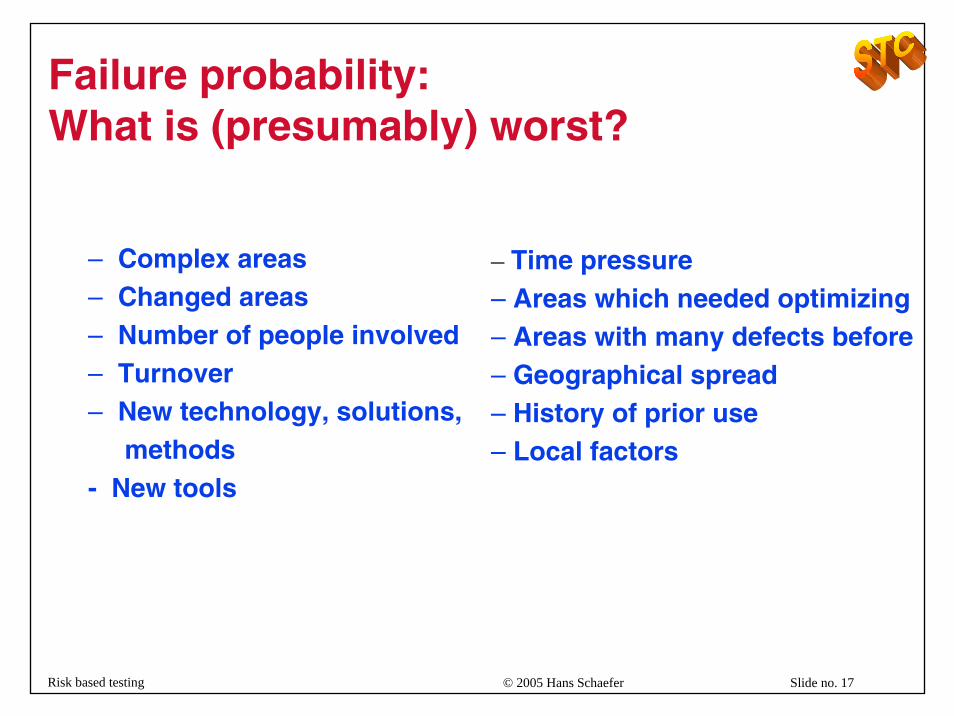
Failure probability: What is (presumably) worst?
– Complex areas– Changed areas– Number of people involved– Turnover – New technology, solutions,
methods- New tools
– Time pressure– Areas which needed optimizing– Areas with many defects before– Geographical spread– History of prior use– Local factors
© 2005 Hans Schaefer Slide no. 18Risk based testing
Do not forget
Can we test ONLY PART of the product?
Other versions later?
© 2005 Hans Schaefer Slide no. 19Risk based testing
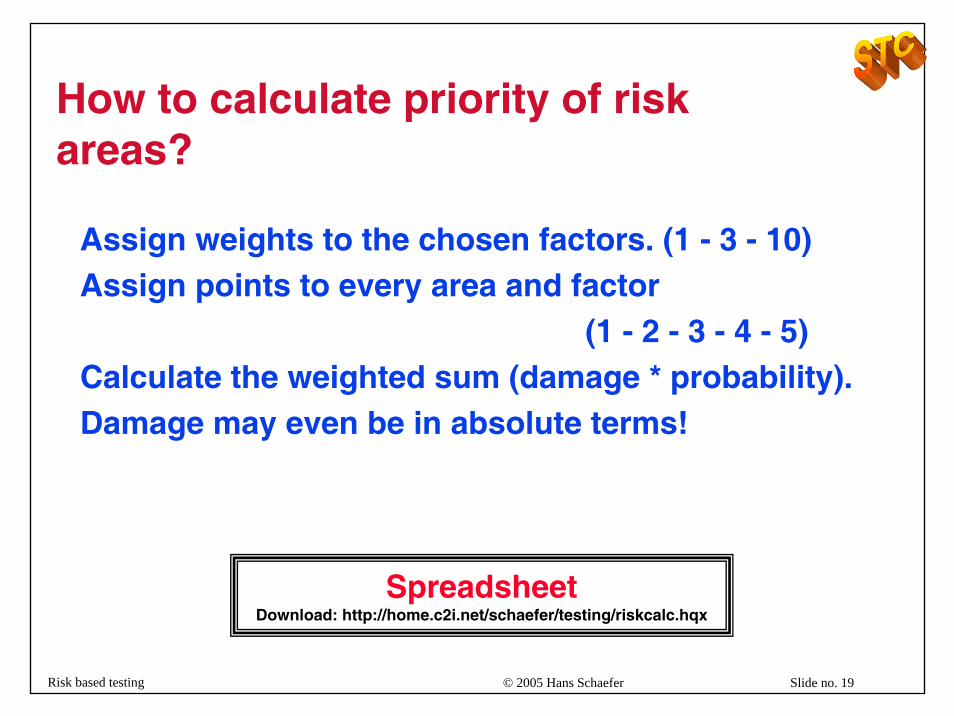
How to calculate priority of risk areas?
Assign weights to the chosen factors. (1 - 3 - 10)Assign points to every area and factor
(1 - 2 - 3 - 4 - 5)Calculate the weighted sum (damage * probability).Damage may even be in absolute terms!
SpreadsheetDownload: http://home.c2i.net/schaefer/testing/riskcalc.hqx
© 2005 Hans Schaefer Slide no. 20Risk based testing
Example
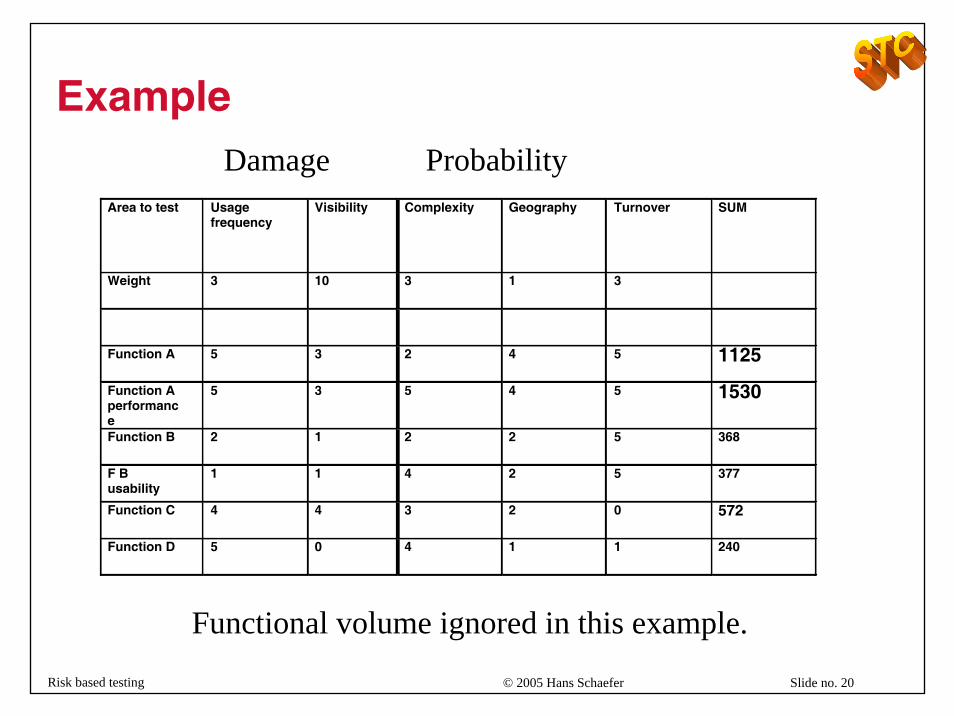
Area to test Usagefrequency
Visibility Complexity Geography Turnover SUM
Weight 3 10 3 1 3
Function A 5 3 2 4 5 1125
Function Aperformance
5 3 5 4 5 1530
Function B 2 1 2 2 5 368
F Busability
1 1 4 2 5 377
Function C 4 4 3 2 0 572
Function D 5 0 4 1 1 240
Damage Probability
Functional volume ignored in this example.
© 2005 Hans Schaefer Slide no. 21Risk based testing
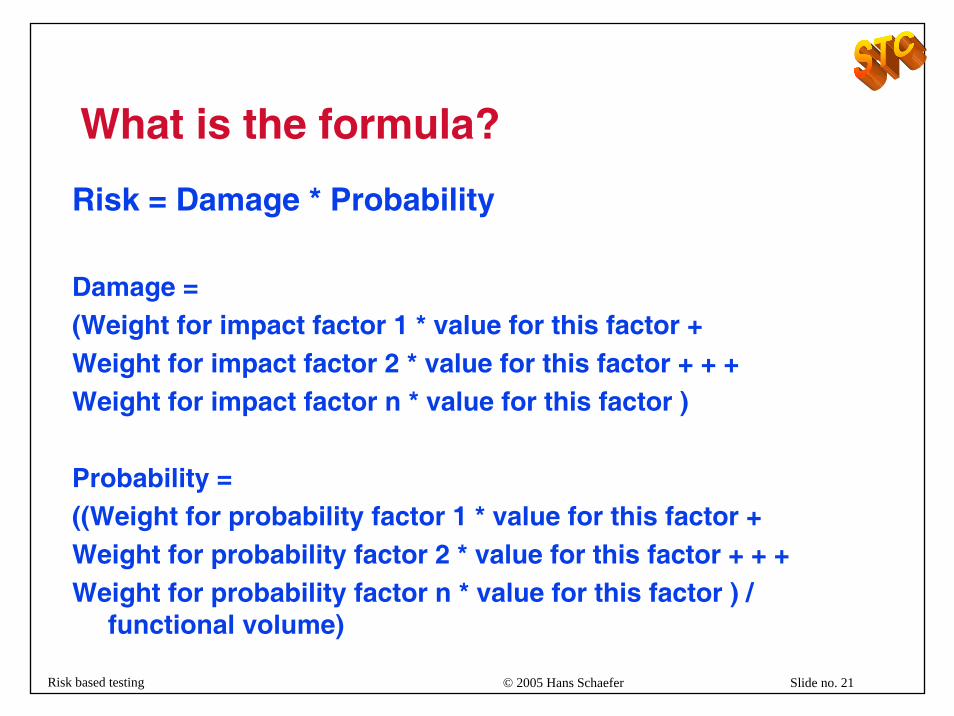
What is the formula?
Risk = Damage * Probability
Damage =(Weight for impact factor 1 * value for this factor +Weight for impact factor 2 * value for this factor + + +Weight for impact factor n * value for this factor )
Probability =((Weight for probability factor 1 * value for this factor +Weight for probability factor 2 * value for this factor + + +Weight for probability factor n * value for this factor ) /
functional volume)
© 2005 Hans Schaefer Slide no. 22Risk based testing
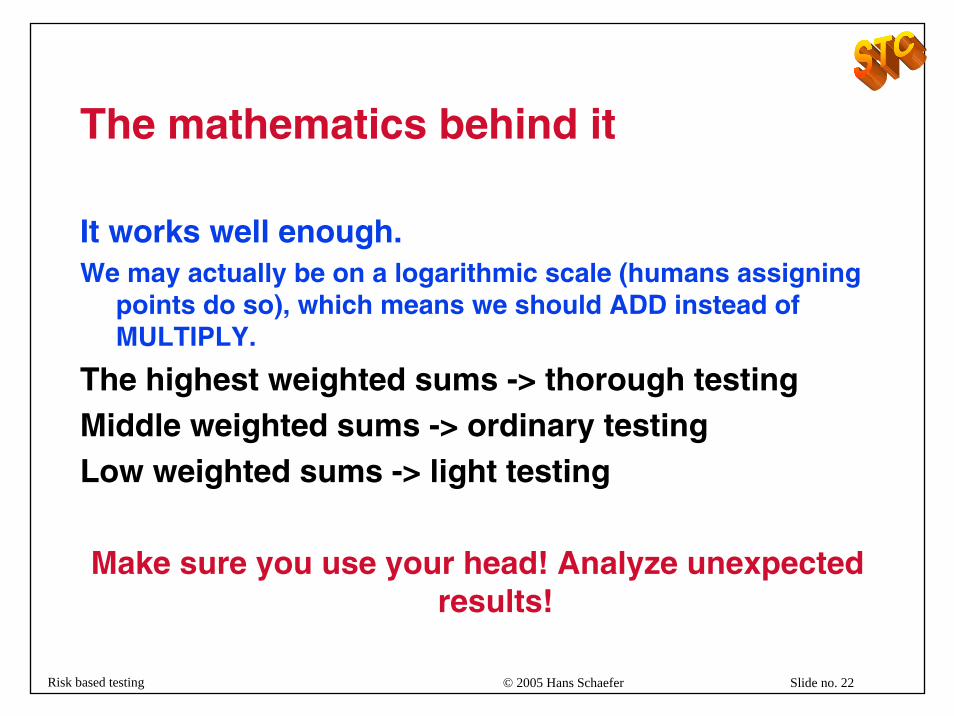
The mathematics behind it
It works well enough.We may actually be on a logarithmic scale (humans assigning
points do so), which means we should ADD instead of MULTIPLY.
The highest weighted sums -> thorough testingMiddle weighted sums -> ordinary testingLow weighted sums -> light testing
Make sure you use your head! Analyze unexpected results!

© 2005 Hans Schaefer Slide no. 23Risk based testing
Selecting test techniques
Reliability high State trans test Boundary value, branch coverage
Reliability low One positive, one negative test case
Efficiency high Reliatic load test, stress test
Efficiency low No test
Subsystem X, Example
© 2005 Hans Schaefer Slide no. 24Risk based testing
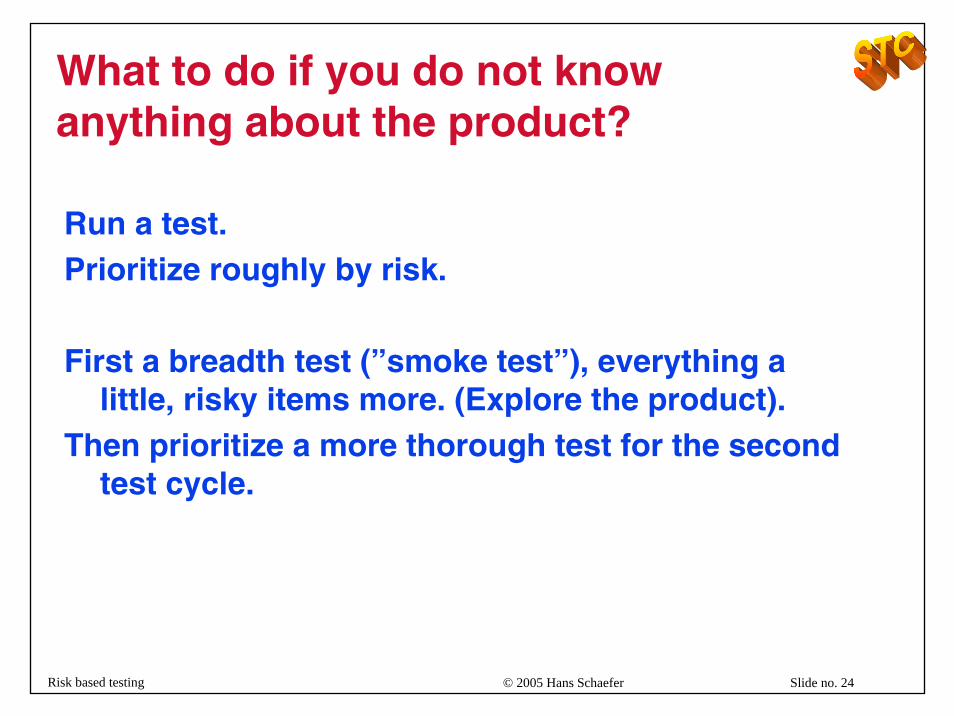
What to do if you do not know anything about the product?
Run a test. Prioritize roughly by risk.
First a breadth test (”smoke test”), everything a little, risky items more. (Explore the product).
Then prioritize a more thorough test for the second test cycle.
© 2005 Hans Schaefer Slide no. 25Risk based testing
Prioritization of further test cycles
Fault- and Coverage analysisAnalysis of defect detection percentage
© 2005 Hans Schaefer Slide no. 26Risk based testing
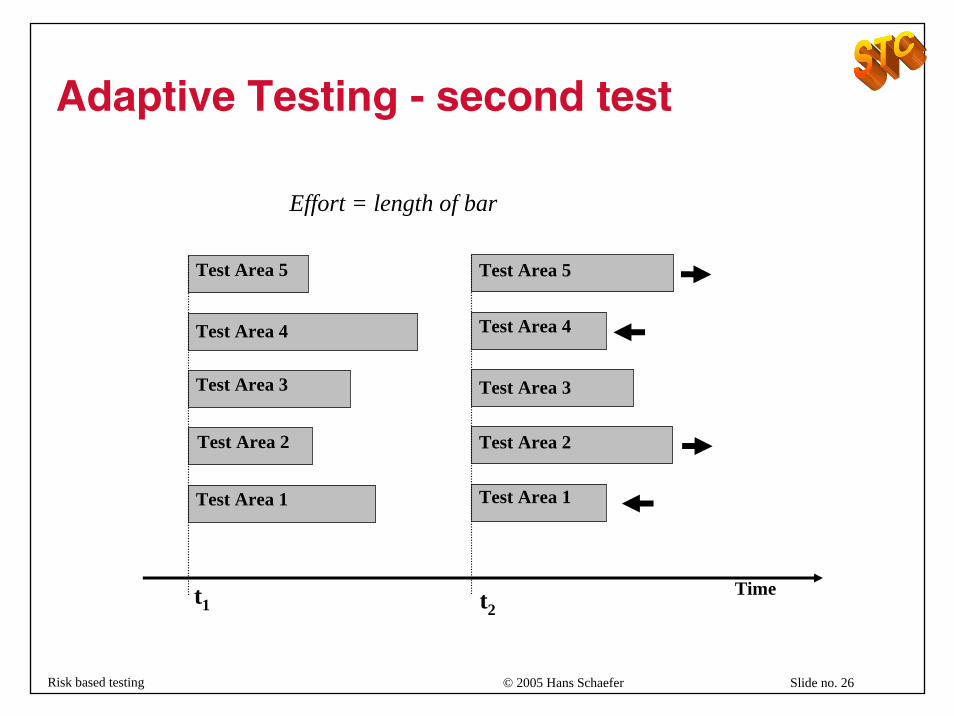
Adaptive Testing - second test
Time
Test Area 5
Test Area 4
Test Area 3
Test Area 2
Test Area 1
t1
Effort = length of bar
Test Area 5
Test Area 4
Test Area 3
Test Area 2
Test Area 1
t2

© 2005 Hans Schaefer Slide no. 27Risk based testing
Analysis of test coverage
Have all (important) functions been covered?Exception handling?States and transitions?Important non functional requirements?
Is test coverage as planned?
Extra Check or Test where coverage differs from expected coverage!
© 2005 Hans Schaefer Slide no. 28Risk based testing
How to analyze your test
Coverage against expected coverage
Is the code coverage under test as expected?
If some area is executed a lot more than expected, is that a symptom for performance problems? Bottleneck, error?
If an area war covered less than expected, is that area superfluous, or was the specification too “thin”?
Do an extra inspection of such areas!
© 2005 Hans Schaefer Slide no. 29Risk based testing
Analysis of fault density
Facts:
Testing does not find all faults.The more you find, the more are left.Post-release fault density correlates with test fault density!
Defect prone units: A Pareto distribution.NSA: 90% of high severity failures come from 2.5% of the units.Others: Typically 80% failures from 20% of the units.
Defects are social creatures, they tend to keep together!
© 2005 Hans Schaefer Slide no. 30Risk based testing
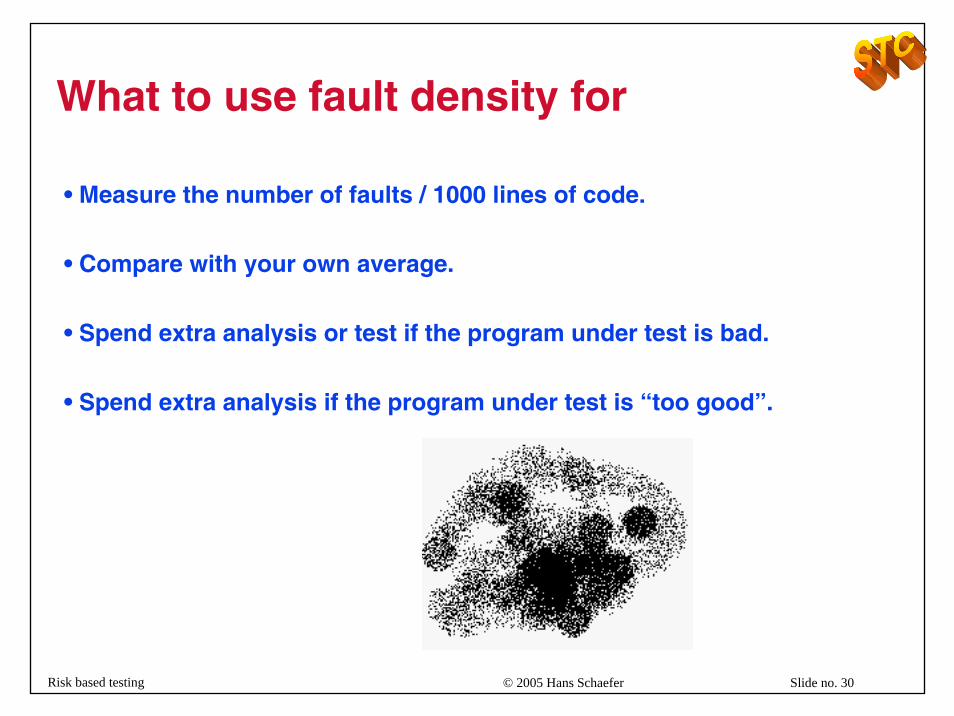
What to use fault density for
• Measure the number of faults / 1000 lines of code.
• Compare with your own average.
• Spend extra analysis or test if the program under test is bad.
• Spend extra analysis if the program under test is “too good”.

© 2005 Hans Schaefer Slide no. 31Risk based testing
Analysis of causes
If you have many defects with the same cause category, think about improving your way of working!
Typical for unit testing:LogicComputationInterfacingData handlingInput data problemDocumentationChange
© 2005 Hans Schaefer Slide no. 32Risk based testing
Analysis of defect detection
How effective is the already planned or done defect detection?Or: How much chance is there that defects survive?
Probability for defects decreases:
New risk = old risk / detection percentage
Defect detection percentage = defects found / defects before detection measure * 100%
© 2005 Hans Schaefer Slide no. 33Risk based testing
Another risk based approach: Project risks for the Tester
Risks BEFORE TestRisks DURING TestRisks AFTER Test

© 2005 Hans Schaefer Slide no. 34Risk based testing
Risks BEFORE Testing
Bad QualityMany faults overlookedBlocking faultsToo many new versions
-> Requirements to, and follow up of quality assurance before test
Delays-> Alternative plans
Lack of knowledge-> Test of earlier versions
© 2005 Hans Schaefer Slide no. 35Risk based testing
Risks AFTER Testing
THESE SHOULD NOT HAPPEN…
Customer finds faults.Customer uses the product in new ways.
Analysis of necessary reliability!
© 2005 Hans Schaefer Slide no. 36Risk based testing
Risks in the Test project itself
Bad managementLack of qualificationToo few or the wrong people, too lateBad coordinationBad cooperationProblems with equipment and tools
Medicine: Normal good project management.

© 2005 Hans Schaefer Slide no. 37Risk based testing
How to make testing cheaper?
Good people save time and moneyGood Prioritization
Try to get rid of part of the task...
© 2005 Hans Schaefer Slide no. 38Risk based testing
Getting rid of work
Get someone else to pay for it or cut it out completely!– Who pays for unit testing?– What about test entry criteria?– Less documentation - more exploratory test
Cutting installation cost - strategies for defect repair– When to correct a defect, when not?– Rule 1: Repair only defects causing important failures!– Rule 2: Change requests to next release!– Rule 3: Install corrections in groups!– Rule 4: Daily build!
Less Test, should the customers pay ????
© 2005 Hans Schaefer Slide no. 39Risk based testing
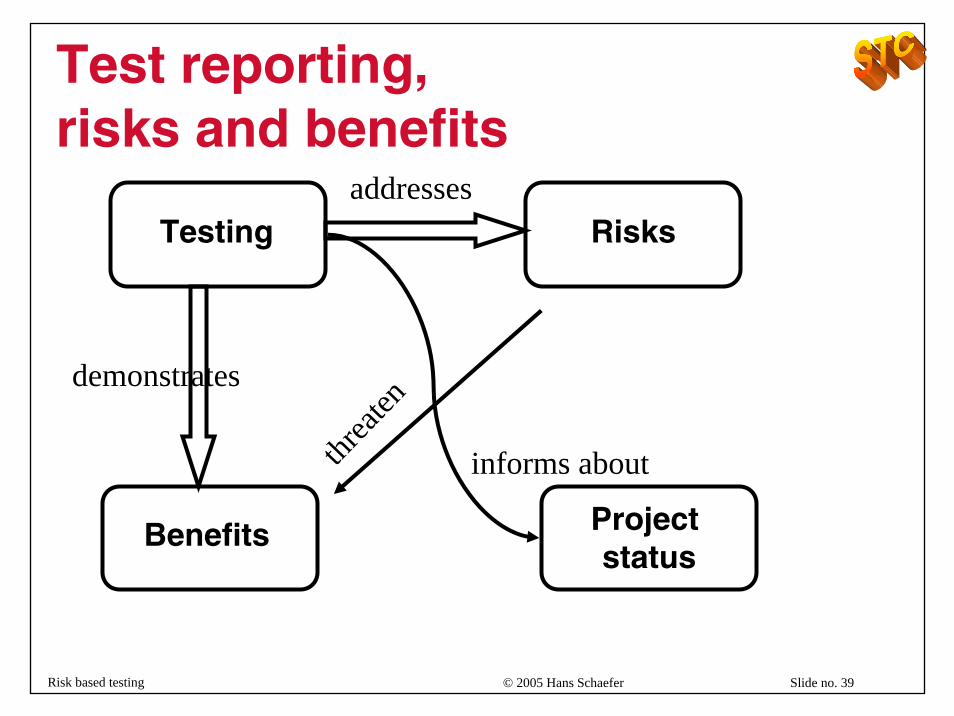
Test reporting, risks and benefits
Testing Risks
Benefits Project status
addresses
demonstrates
informs aboutthreat
en
© 2005 Hans Schaefer Slide no. 40Risk based testing
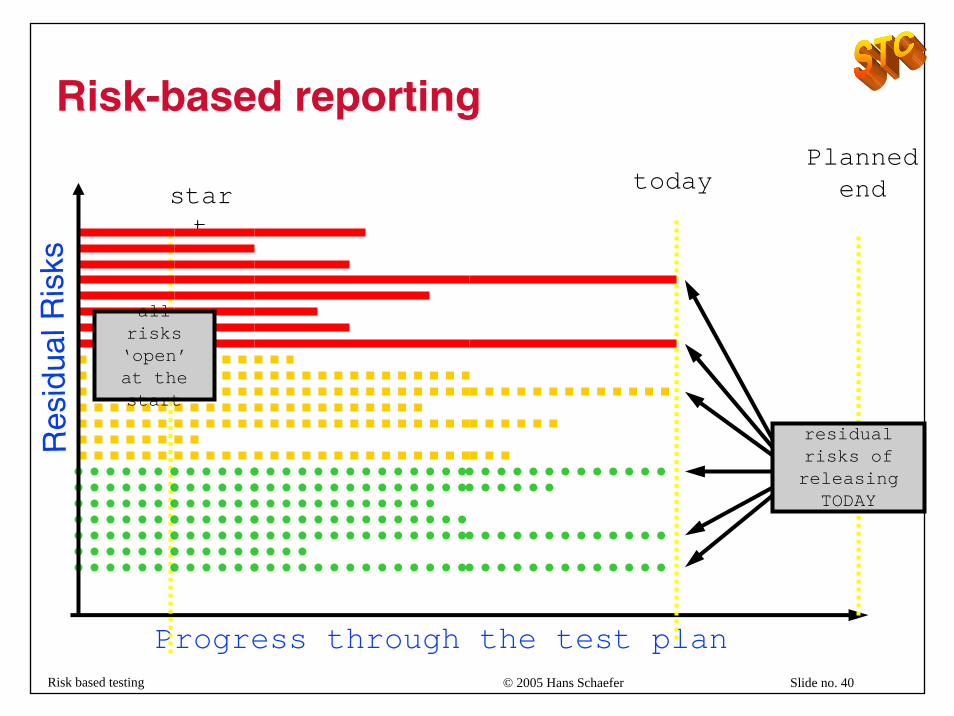
Progress through the test plan
todayPlanned
end
residual risks of releasing TODAY
Res
idua
l Ris
ks
start
all risks ‘open’at the start
Risk-based reporting
© 2005 Hans Schaefer Slide no. 41Risk based testing
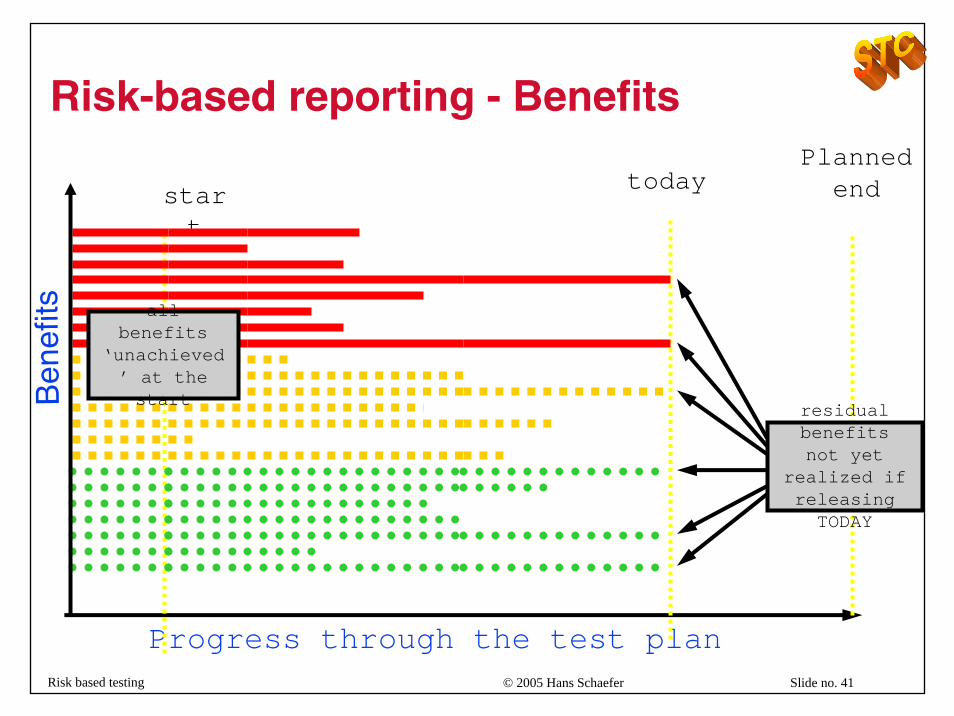
Progress through the test plan
todayPlanned
end
residual benefits not yet
realized if releasing TODAY
Ben
efits
start
all benefits
‘unachieved’ at the start
Risk-based reporting - Benefits
© 2005 Hans Schaefer Slide no. 42Risk based testing
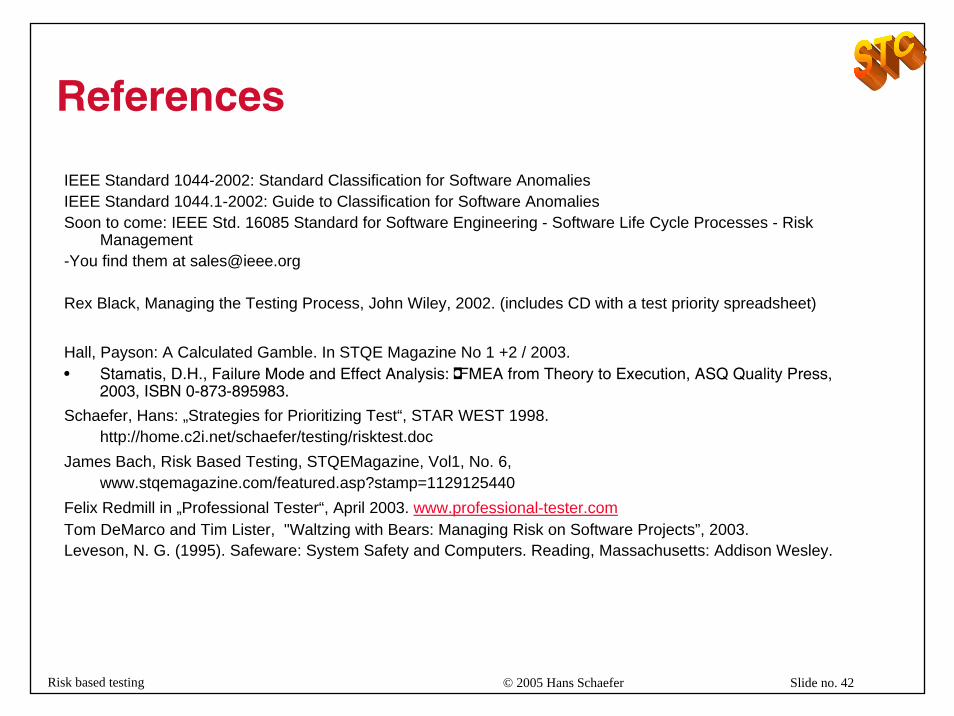
References
IEEE Standard 1044-2002: Standard Classification for Software AnomaliesIEEE Standard 1044.1-2002: Guide to Classification for Software AnomaliesSoon to come: IEEE Std. 16085 Standard for Software Engineering - Software Life Cycle Processes - Risk
Management -You find them at [email protected]
Rex Black, Managing the Testing Process, John Wiley, 2002. (includes CD with a test priority spreadsheet)
Hall, Payson: A Calculated Gamble. In STQE Magazine No 1 +2 / 2003. • Stamatis �, D.H., Failure Mode and Effect Analysis: FMEA from Theory to Execution, ASQ Quality Press,
2003, ISBN 0-873-895983.
Schaefer, Hans: „Strategies for Prioritizing Test“, STAR WEST 1998. http://home.c2i.net/schaefer/testing/risktest.doc
James Bach, Risk Based Testing, STQEMagazine, Vol1, No. 6, www.stqemagazine.com/featured.asp?stamp=1129125440
Felix Redmill in „Professional Tester“, April 2003. www.professional-tester.comTom DeMarco and Tim Lister, "Waltzing with Bears: Managing Risk on Software Projects”, 2003.Leveson, N. G. (1995). Safeware: System Safety and Computers. Reading, Massachusetts: Addison Wesley.
© 2005 Hans Schaefer Slide no. 43Risk based testing
Thank you for listening
Questions?
Top Related