


Languages
Pages
Legal

Ring Blasting Design Modeling and Optimization
Benjamin Cebrián María Rocha Roberto C. Laredo
43th ISEE SymposiumOrlando - January/February 2017
Introduction
Fragmentation Analysis
Damage Analysis
Implementation control
Specific Case: Optimizing Ring Blast, Fragmentation and Damage
Conclusion and Future Work
43th ISEE Symposium – Orlando, January - February 2017
Outline
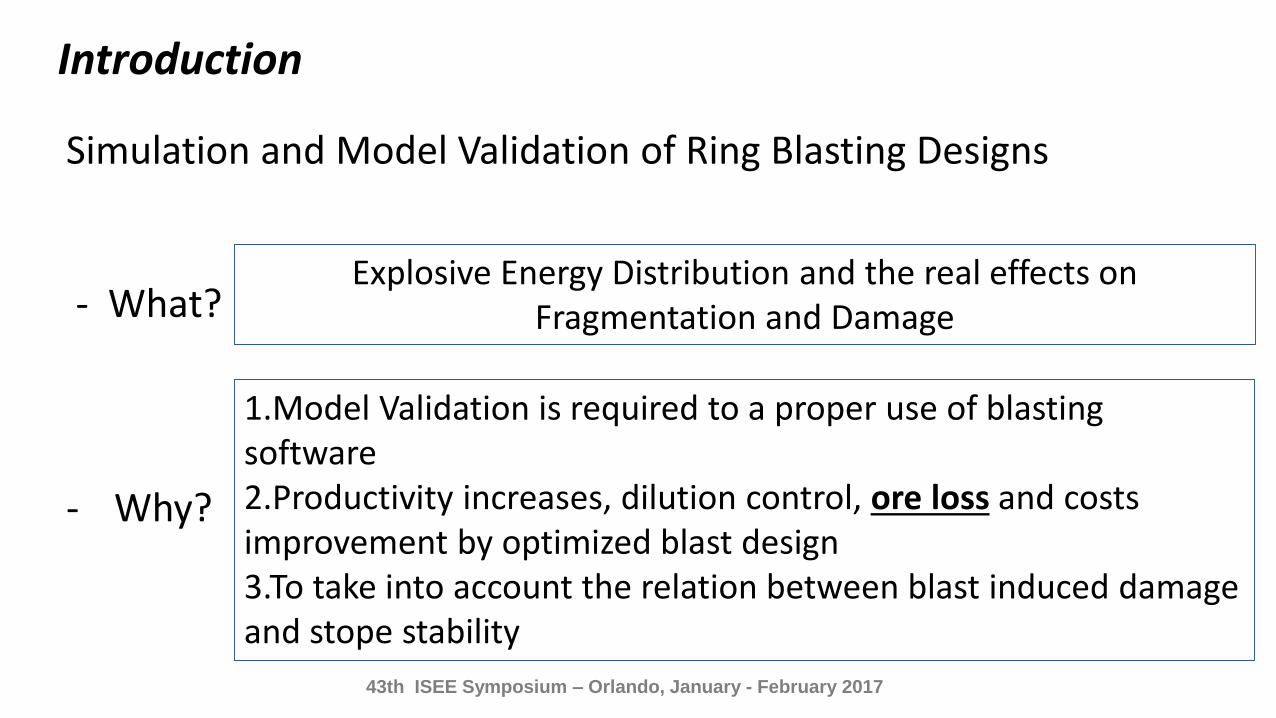
Simulation and Model Validation of Ring Blasting Designs
- What?
- Why?
Explosive Energy Distribution and the real effects on Fragmentation and Damage
1.Model Validation is required to a proper use of blasting software 2.Productivity increases, dilution control, ore loss and costsimprovement by optimized blast design3.To take into account the relation between blast induced damage and stope stability
43th ISEE Symposium – Orlando, January - February 2017
Introduction

Simulation and Model Calibration of Ring Blasting Designs
- How? 1.Using software to simulate blast designs JKSimBlast2.Measuring implementation/results on site Split-Desktop, LaserScan, Measuring tape, etc…3.Comparing results to calibrate model and improve designs
43th ISEE Symposium – Orlando, January - February 2017
Introduction
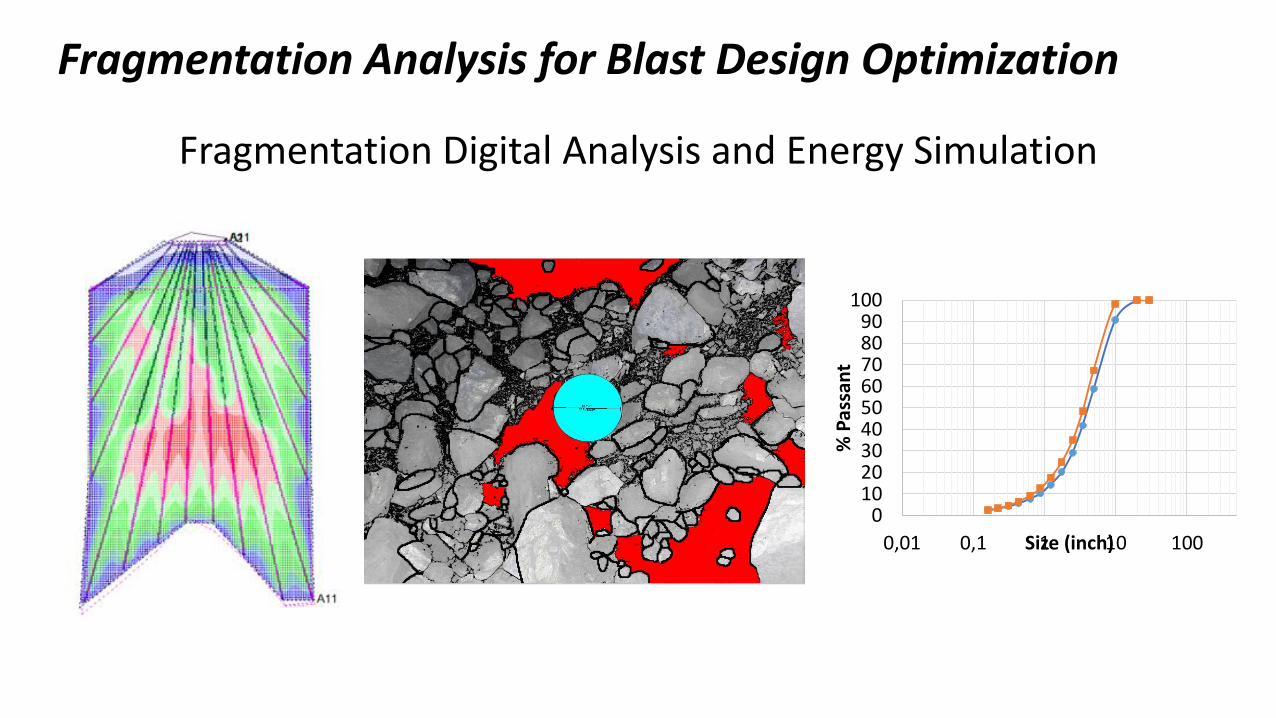
Fragmentation Analysis for Blast Design Optimization
Fragmentation Digital Analysis and Energy Simulation
0102030405060708090
100
0,01 0,1 1 10 100
% P
assa
nt
Size (inch)

Rock informationExplosive
Drill designBlast design
Correct operation
Good fragmentationHigh ore recoveryMinimun damage
43th ISEE Symposium – Orlando, January - February 2017
Damage Analysis for Blast Design Optimization
Factors involved in blast damage:- Rock mass features- Explosive characteristics and energy distribution- Blast design and implementation control

Blast damage
43th ISEE Symposium – Orlando, January - February 2017
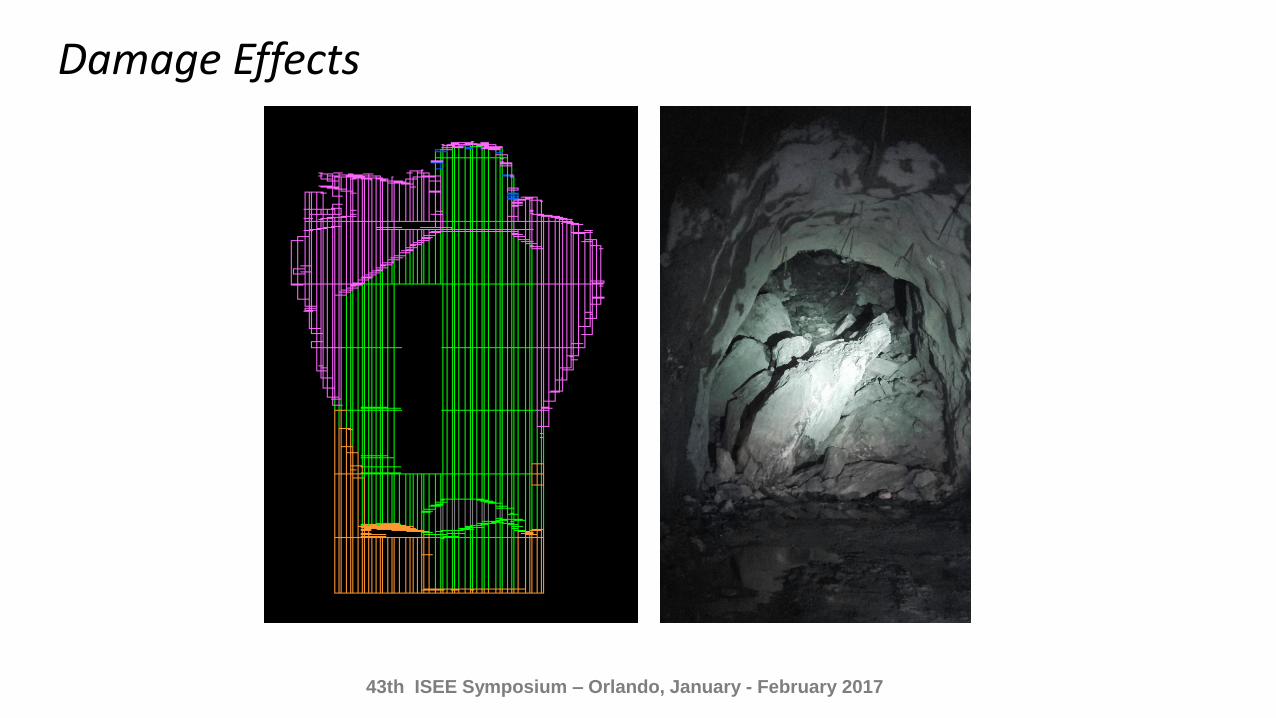
Damage Effects
Inestability
43th ISEE Symposium – Orlando, January - February 2017
Damage Effects
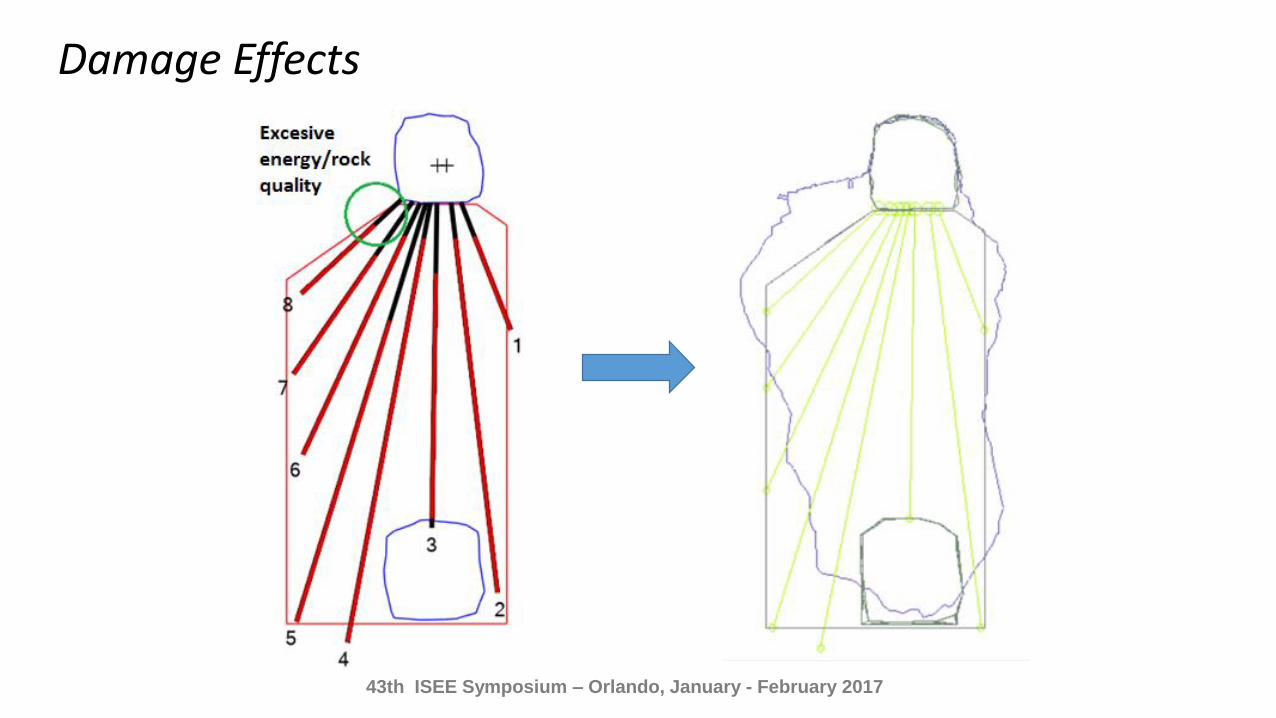
43th ISEE Symposium – Orlando, January - February 2017
Damage Effects
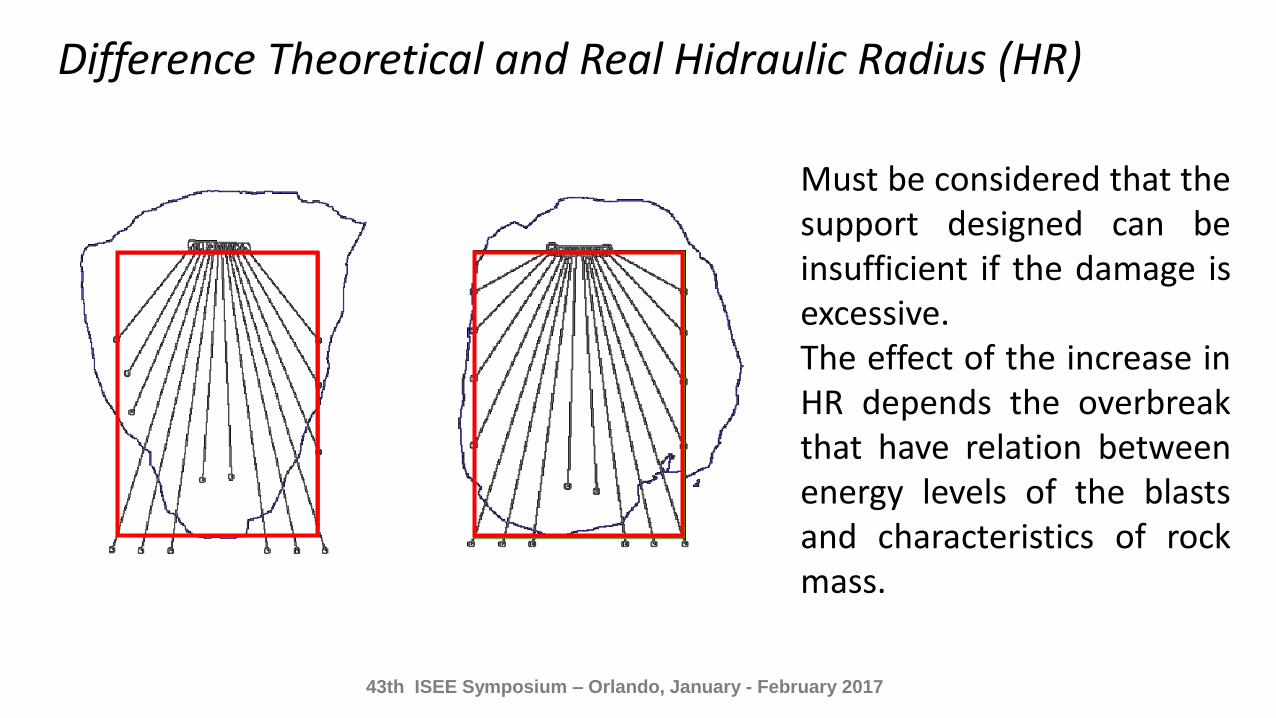
Must be considered that thesupport designed can beinsufficient if the damage isexcessive.The effect of the increase inHR depends the overbreakthat have relation betweenenergy levels of the blastsand characteristics of rockmass.
43th ISEE Symposium – Orlando, January - February 2017
Difference Theoretical and Real Hidraulic Radius (HR)
43th ISEE Symposium – Orlando, January - February 2017
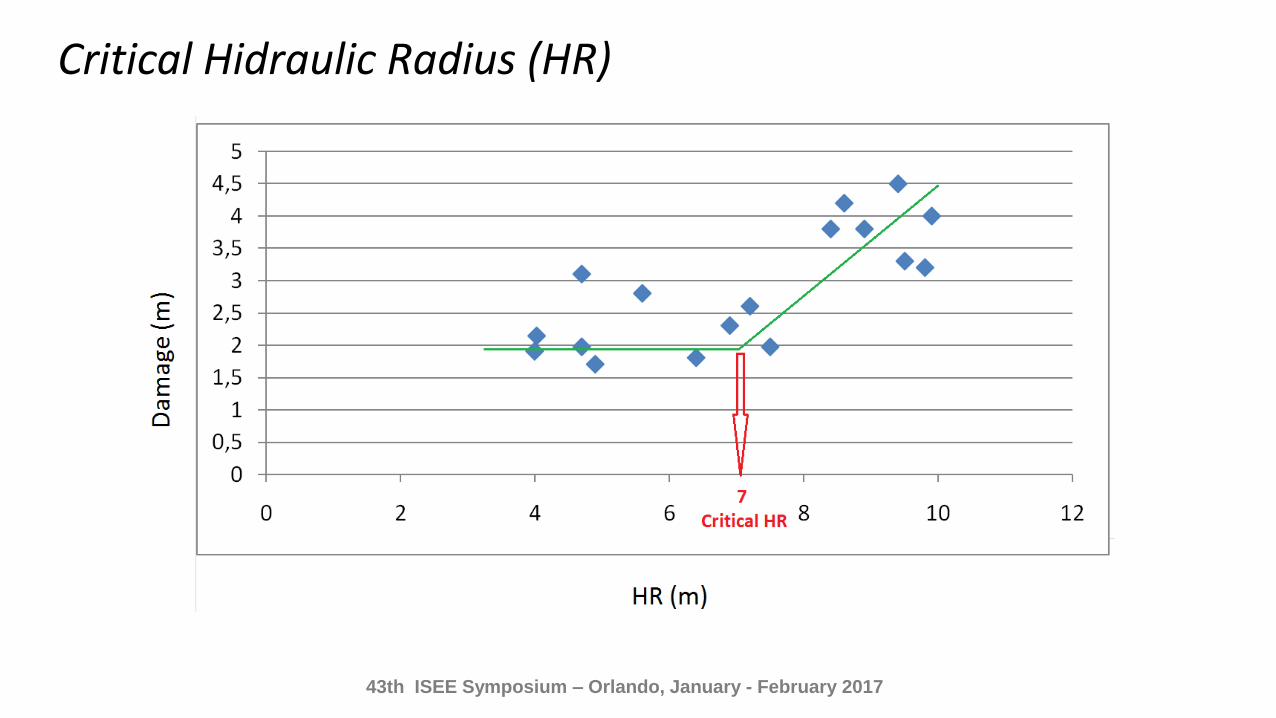
Critical Hidraulic Radius (HR)

Correct Geotechnical Evaluacion / Correct Design - Energy /Correct Implementation
43th ISEE Symposium – Orlando, January - February 2017
Improved Results
Correct Geotechnical Evaluacion / Correct Design - Energy /Correct Implementation

43th ISEE Symposium – Orlando, January - February 2017
Implementation Control
A model is not useful without correct implementation
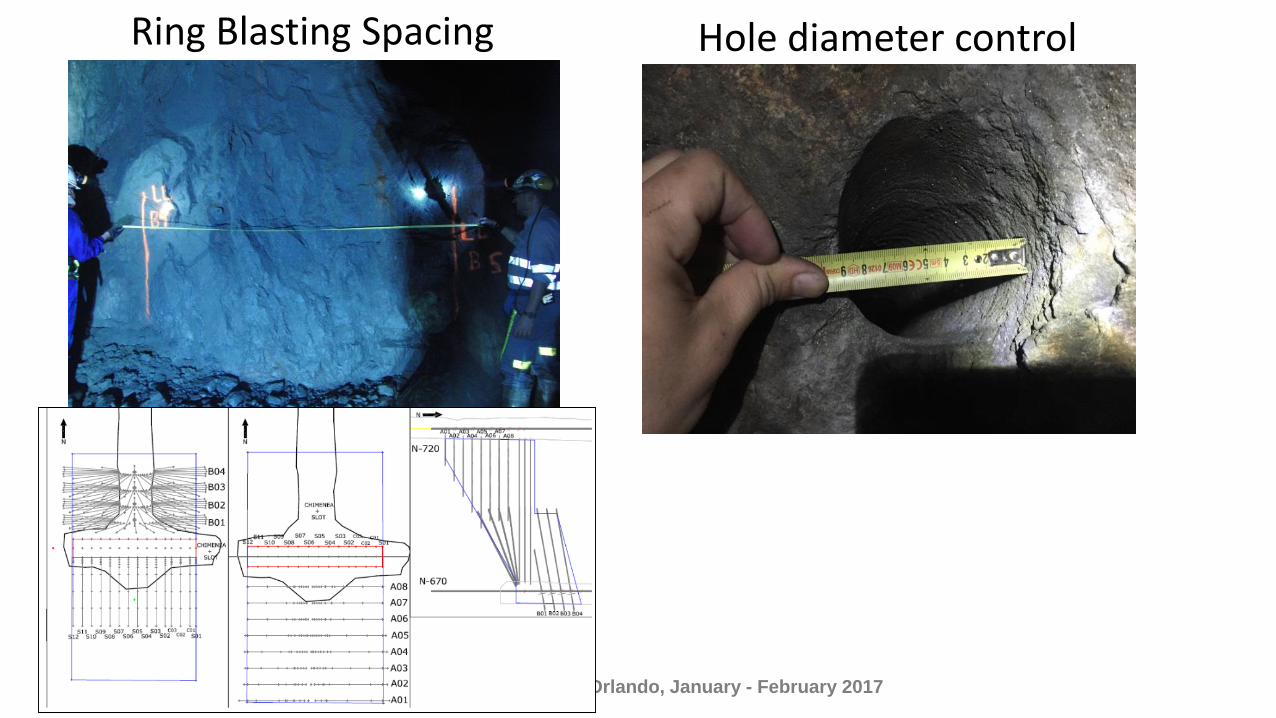
Quality control of ring blasting and model parameters include:
- Collar Accuracy- Hole length + deviation- Explosive density control- Loading accuracy (stemming)

43th ISEE Symposium – Orlando, January - February 2017
Implementation Control
Hole length loaded

Ring B
Design at 102mm Energy distribution at 102 mm Actually loaded (89mm)
Ring A
43th ISEE Symposium – Orlando, January - February 2017
Ring Blasting Spacing Hole diameter control

Implementation Control QA/QC• Correct Timing Control • Hole Collaring- Alignment
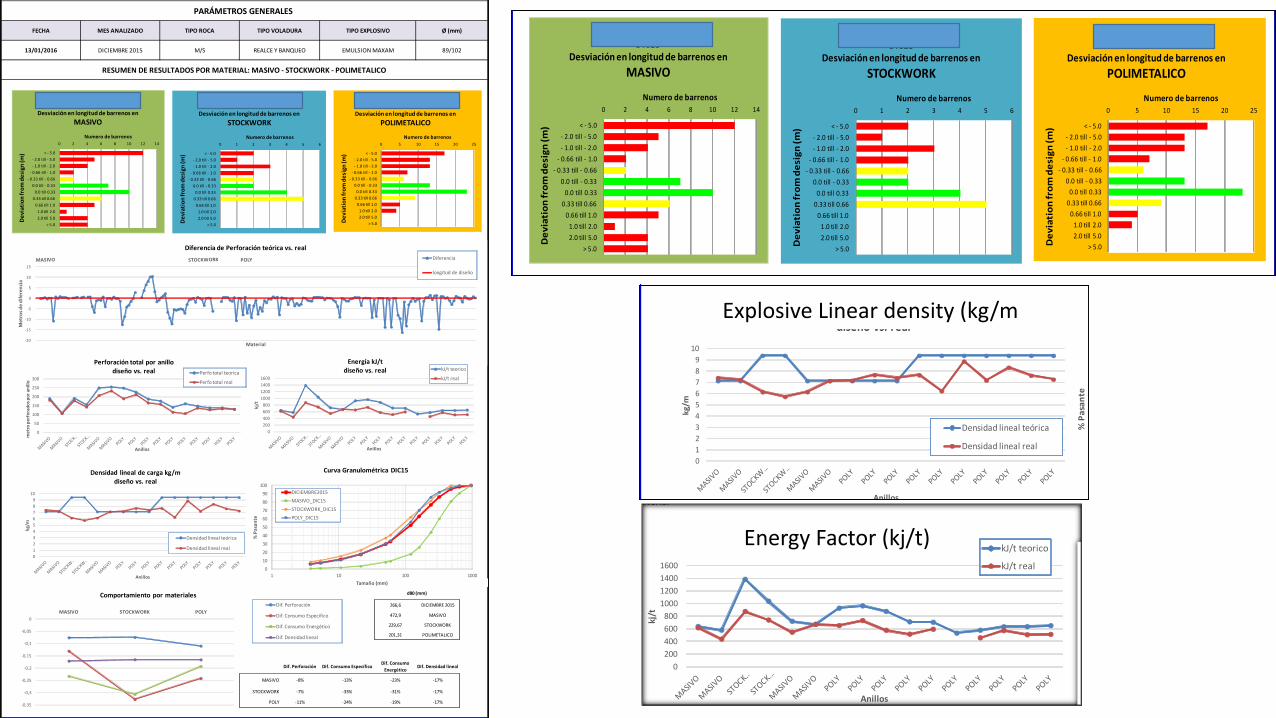
266,6 DICIEMBRE 2015
472,9 MASIVO
229,67 STOCKWORK
201,31 POLIMETALICO
Dif. Perforación Dif. Consumo EspecíficoDif. Consumo
EnergéticoDif. Densidad lineal
MASIVO -8% -13% -23% -17%
STOCKWORK -7% -33% -31% -17%
POLY -11% -24% -19% -17%
REPORTE MENSUAL DE VOLADURAS MINA DE AGUAS TEÑIDAS
PARÁMETROS GENERALES
FECHA MES ANALIZADO TIPO ROCA TIPO VOLADURA TIPO EXPLOSIVO Ø (mm)
RESUMEN DE RESULTADOS POR MATERIAL: MASIVO - STOCKWORK - POLIMETALICO
13/01/2016 DICIEMBRE 2015 M/S REALCE Y BANQUEO EMULSION MAXAM 89/102
d80 (mm)
0 2 4 6 8 10 12 14
< - 5.0
- 2.0 till - 5.0
- 1.0 till - 2.0
- 0.66 till - 1.0
- 0.33 till - 0.66
0.0 till - 0.33
0.0 till 0.33
0.33 till 0.66
0.66 till 1.0
1.0 till 2.0
2.0 till 5.0
> 5.0
Numero de barrenos
De
via
tio
n f
rom
de
sig
n (
m)
Mina Aguas TeñidasDIC15
Desviación en longitud de barrenos en
MASIVO
0 1 2 3 4 5 6
< - 5.0
- 2.0 till - 5.0
- 1.0 till - 2.0
- 0.66 till - 1.0
- 0.33 till - 0.66
0.0 till - 0.33
0.0 till 0.33
0.33 till 0.66
0.66 till 1.0
1.0 till 2.0
2.0 till 5.0
> 5.0
Numero de barrenos
De
via
tio
n f
rom
de
sig
n (
m)
Mina Aguas TeñidasDIC15
Desviación en longitud de barrenos en
STOCKWORK
0 5 10 15 20 25
< - 5.0
- 2.0 till - 5.0
- 1.0 till - 2.0
- 0.66 till - 1.0
- 0.33 till - 0.66
0.0 till - 0.33
0.0 till 0.33
0.33 till 0.66
0.66 till 1.0
1.0 till 2.0
2.0 till 5.0
> 5.0
Numero de barrenos
De
via
tio
n f
rom
de
sig
n (
m)
Mina Aguas TeñidasDIC15
Desviación en longitud de barrenos en
POLIMETALICO
-20
-15
-10
-5
0
5
10
15
Me
tro
s d
e d
ife
ren
cia
Material
Diferencia de Perforación teórica vs. real
Diferencia
longitud de diseño
-0,35
-0,3
-0,25
-0,2
-0,15
-0,1
-0,05
0
MASIVO STOCKWORK POLY
Comportamiento por materiales
Dif. Perforación
Dif. Consumo Específico
Dif. Consumo Energético
Dif. Densidad lineal
0
200
400
600
800
1000
1200
1400
1600
kj/
t
Anillos
Energía kJ/t diseño vs. real kJ/t teorico
kJ/t real
0
1
2
3
4
5
6
7
8
9
10
kg
/m
Anillos
Densidad lineal de carga kg/m diseño vs. real
Densidad lineal teórica
Densidad lineal real
0
50
100
150
200
250
300
me
tro
pe
rfo
rad
os
po
r a
nil
lo
Anillos
Perforación total por anillo diseño vs. real Perfo total teorica
Perfo total real
0
10
20
30
40
50
60
70
80
90
100
1 10 100 1000
% P
asa
nte
Tamaño (mm)
Curva Granulométrica DIC15
DICIEMBRE2015
MASIVO_DIC15
STOCKWORK_DIC15
POLY_DIC15
266,6 DICIEMBRE 2015
472,9 MASIVO
229,67 STOCKWORK
201,31 POLIMETALICO
Dif. Perforación Dif. Consumo EspecíficoDif. Consumo
EnergéticoDif. Densidad lineal
MASIVO -8% -13% -23% -17%
STOCKWORK -7% -33% -31% -17%
POLY -11% -24% -19% -17%
REPORTE MENSUAL DE VOLADURAS MINA DE AGUAS TEÑIDAS
PARÁMETROS GENERALES
FECHA MES ANALIZADO TIPO ROCA TIPO VOLADURA TIPO EXPLOSIVO Ø (mm)
RESUMEN DE RESULTADOS POR MATERIAL: MASIVO - STOCKWORK - POLIMETALICO
13/01/2016 DICIEMBRE 2015 M/S REALCE Y BANQUEO EMULSION MAXAM 89/102
d80 (mm)
0 2 4 6 8 10 12 14
< - 5.0
- 2.0 till - 5.0
- 1.0 till - 2.0
- 0.66 till - 1.0
- 0.33 till - 0.66
0.0 till - 0.33
0.0 till 0.33
0.33 till 0.66
0.66 till 1.0
1.0 till 2.0
2.0 till 5.0
> 5.0
Numero de barrenos
De
viat
ion
fro
m d
esi
gn (m
)
Mina Aguas TeñidasDIC15
Desviación en longitud de barrenos en
MASIVO
0 1 2 3 4 5 6
< - 5.0
- 2.0 till - 5.0
- 1.0 till - 2.0
- 0.66 till - 1.0
- 0.33 till - 0.66
0.0 till - 0.33
0.0 till 0.33
0.33 till 0.66
0.66 till 1.0
1.0 till 2.0
2.0 till 5.0
> 5.0
Numero de barrenos
De
viat
ion
fro
m d
esi
gn (m
)
Mina Aguas TeñidasDIC15
Desviación en longitud de barrenos en
STOCKWORK
0 5 10 15 20 25
< - 5.0
- 2.0 till - 5.0
- 1.0 till - 2.0
- 0.66 till - 1.0
- 0.33 till - 0.66
0.0 till - 0.33
0.0 till 0.33
0.33 till 0.66
0.66 till 1.0
1.0 till 2.0
2.0 till 5.0
> 5.0
Numero de barrenos
De
viat
ion
fro
m d
esi
gn (m
)
Mina Aguas TeñidasDIC15
Desviación en longitud de barrenos en
POLIMETALICO
-20
-15
-10
-5
0
5
10
15
Met
ros
de
dif
eren
cia
Material
Diferencia de Perforación teórica vs. real
Diferencia
longitud de diseño
-0,35
-0,3
-0,25
-0,2
-0,15
-0,1
-0,05
0
MASIVO STOCKWORK POLY
Comportamiento por materiales
Dif. Perforación
Dif. Consumo Específico
Dif. Consumo Energético
Dif. Densidad lineal
0
200
400
600
800
1000
1200
1400
1600
kj/t
Anillos
Energía kJ/t diseño vs. real kJ/t teorico
kJ/t real
0
1
2
3
4
5
6
7
8
9
10
kg/m
Anillos
Densidad lineal de carga kg/m diseño vs. real
Densidad lineal teórica
Densidad lineal real
0
50
100
150
200
250
300
me
tro
pe
rfo
rad
os
po
r an
illo
Anillos
Perforación total por anillo diseño vs. real Perfo total teorica
Perfo total real
0
10
20
30
40
50
60
70
80
90
100
1 10 100 1000
% P
asan
te
Tamaño (mm)
Curva Granulométrica DIC15
DICIEMBRE2015
MASIVO_DIC15
STOCKWORK_DIC15
POLY_DIC15
266,6 DICIEMBRE 2015
472,9 MASIVO
229,67 STOCKWORK
201,31 POLIMETALICO
Dif. Perforación Dif. Consumo EspecíficoDif. Consumo
EnergéticoDif. Densidad lineal
MASIVO -8% -13% -23% -17%
STOCKWORK -7% -33% -31% -17%
POLY -11% -24% -19% -17%
REPORTE MENSUAL DE VOLADURAS MINA DE AGUAS TEÑIDAS
PARÁMETROS GENERALES
FECHA MES ANALIZADO TIPO ROCA TIPO VOLADURA TIPO EXPLOSIVO Ø (mm)
RESUMEN DE RESULTADOS POR MATERIAL: MASIVO - STOCKWORK - POLIMETALICO
13/01/2016 DICIEMBRE 2015 M/S REALCE Y BANQUEO EMULSION MAXAM 89/102
d80 (mm)
0 2 4 6 8 10 12 14
< - 5.0
- 2.0 till - 5.0
- 1.0 till - 2.0
- 0.66 till - 1.0
- 0.33 till - 0.66
0.0 till - 0.33
0.0 till 0.33
0.33 till 0.66
0.66 till 1.0
1.0 till 2.0
2.0 till 5.0
> 5.0
Numero de barrenos
De
viat
ion
fro
m d
esi
gn (m
)
Mina Aguas TeñidasDIC15
Desviación en longitud de barrenos en
MASIVO
0 1 2 3 4 5 6
< - 5.0
- 2.0 till - 5.0
- 1.0 till - 2.0
- 0.66 till - 1.0
- 0.33 till - 0.66
0.0 till - 0.33
0.0 till 0.33
0.33 till 0.66
0.66 till 1.0
1.0 till 2.0
2.0 till 5.0
> 5.0
Numero de barrenos
De
viat
ion
fro
m d
esi
gn (m
)
Mina Aguas TeñidasDIC15
Desviación en longitud de barrenos en
STOCKWORK
0 5 10 15 20 25
< - 5.0
- 2.0 till - 5.0
- 1.0 till - 2.0
- 0.66 till - 1.0
- 0.33 till - 0.66
0.0 till - 0.33
0.0 till 0.33
0.33 till 0.66
0.66 till 1.0
1.0 till 2.0
2.0 till 5.0
> 5.0
Numero de barrenos
De
viat
ion
fro
m d
esi
gn (m
)
Mina Aguas TeñidasDIC15
Desviación en longitud de barrenos en
POLIMETALICO
-20
-15
-10
-5
0
5
10
15
Me
tro
s d
e d
ife
ren
cia
Material
Diferencia de Perforación teórica vs. real
Diferencia
longitud de diseño
-0,35
-0,3
-0,25
-0,2
-0,15
-0,1
-0,05
0
MASIVO STOCKWORK POLY
Comportamiento por materiales
Dif. Perforación
Dif. Consumo Específico
Dif. Consumo Energético
Dif. Densidad lineal
0
200
400
600
800
1000
1200
1400
1600
kj/t
Anillos
Energía kJ/t diseño vs. real kJ/t teorico
kJ/t real
0
1
2
3
4
5
6
7
8
9
10
kg/m
Anillos
Densidad lineal de carga kg/m diseño vs. real
Densidad lineal teórica
Densidad lineal real
0
50
100
150
200
250
300
me
tro
pe
rfo
rad
os
po
r an
illo
Anillos
Perforación total por anillo diseño vs. real Perfo total teorica
Perfo total real
0
10
20
30
40
50
60
70
80
90
100
1 10 100 1000
% P
asa
nte
Tamaño (mm)
Curva Granulométrica DIC15
DICIEMBRE2015
MASIVO_DIC15
STOCKWORK_DIC15
POLY_DIC15
Explosive Linear density (kg/m
266,6 DICIEMBRE 2015
472,9 MASIVO
229,67 STOCKWORK
201,31 POLIMETALICO
Dif. Perforación Dif. Consumo EspecíficoDif. Consumo
EnergéticoDif. Densidad lineal
MASIVO -8% -13% -23% -17%
STOCKWORK -7% -33% -31% -17%
POLY -11% -24% -19% -17%
REPORTE MENSUAL DE VOLADURAS MINA DE AGUAS TEÑIDAS
PARÁMETROS GENERALES
FECHA MES ANALIZADO TIPO ROCA TIPO VOLADURA TIPO EXPLOSIVO Ø (mm)
RESUMEN DE RESULTADOS POR MATERIAL: MASIVO - STOCKWORK - POLIMETALICO
13/01/2016 DICIEMBRE 2015 M/S REALCE Y BANQUEO EMULSION MAXAM 89/102
d80 (mm)
0 2 4 6 8 10 12 14
< - 5.0
- 2.0 till - 5.0
- 1.0 till - 2.0
- 0.66 till - 1.0
- 0.33 till - 0.66
0.0 till - 0.33
0.0 till 0.33
0.33 till 0.66
0.66 till 1.0
1.0 till 2.0
2.0 till 5.0
> 5.0
Numero de barrenos
De
viat
ion
fro
m d
esi
gn (m
)
Mina Aguas TeñidasDIC15
Desviación en longitud de barrenos en
MASIVO
0 1 2 3 4 5 6
< - 5.0
- 2.0 till - 5.0
- 1.0 till - 2.0
- 0.66 till - 1.0
- 0.33 till - 0.66
0.0 till - 0.33
0.0 till 0.33
0.33 till 0.66
0.66 till 1.0
1.0 till 2.0
2.0 till 5.0
> 5.0
Numero de barrenos
De
viat
ion
fro
m d
esi
gn (m
)
Mina Aguas TeñidasDIC15
Desviación en longitud de barrenos en
STOCKWORK
0 5 10 15 20 25
< - 5.0
- 2.0 till - 5.0
- 1.0 till - 2.0
- 0.66 till - 1.0
- 0.33 till - 0.66
0.0 till - 0.33
0.0 till 0.33
0.33 till 0.66
0.66 till 1.0
1.0 till 2.0
2.0 till 5.0
> 5.0
Numero de barrenos
De
viat
ion
fro
m d
esi
gn (m
)
Mina Aguas TeñidasDIC15
Desviación en longitud de barrenos en
POLIMETALICO
-20
-15
-10
-5
0
5
10
15
Met
ros
de
dif
eren
cia
Material
Diferencia de Perforación teórica vs. real
Diferencia
longitud de diseño
-0,35
-0,3
-0,25
-0,2
-0,15
-0,1
-0,05
0
MASIVO STOCKWORK POLY
Comportamiento por materiales
Dif. Perforación
Dif. Consumo Específico
Dif. Consumo Energético
Dif. Densidad lineal
0
200
400
600
800
1000
1200
1400
1600
kj/t
Anillos
Energía kJ/t diseño vs. real kJ/t teorico
kJ/t real
0
1
2
3
4
5
6
7
8
9
10
kg/m
Anillos
Densidad lineal de carga kg/m diseño vs. real
Densidad lineal teórica
Densidad lineal real
0
50
100
150
200
250
300
me
tro
pe
rfo
rad
os
po
r an
illo
Anillos
Perforación total por anillo diseño vs. real Perfo total teorica
Perfo total real
0
10
20
30
40
50
60
70
80
90
100
1 10 100 1000
% P
asan
te
Tamaño (mm)
Curva Granulométrica DIC15
DICIEMBRE2015
MASIVO_DIC15
STOCKWORK_DIC15
POLY_DIC15
Energy Factor (kj/t)

Specific Case:
Optimizing Ring Blast Design,
Fragmentation and Damage
43th ISEE Symposium – Orlando, January - February 2017

Specific Case: Optimizing of Fragmentation
43th ISEE Symposium – Orlando, January - February 2017
BLAST DESIGN OPTIMIZATION-Increasing around 15% energy level
-Implementation Control
Improvement average of 55% in particle size distribution, getting up to 65% in fines
material. Decreasing size below the P80
benchmarking of the mine
Standard Ring Blast Design Optimized Ring Blast Design
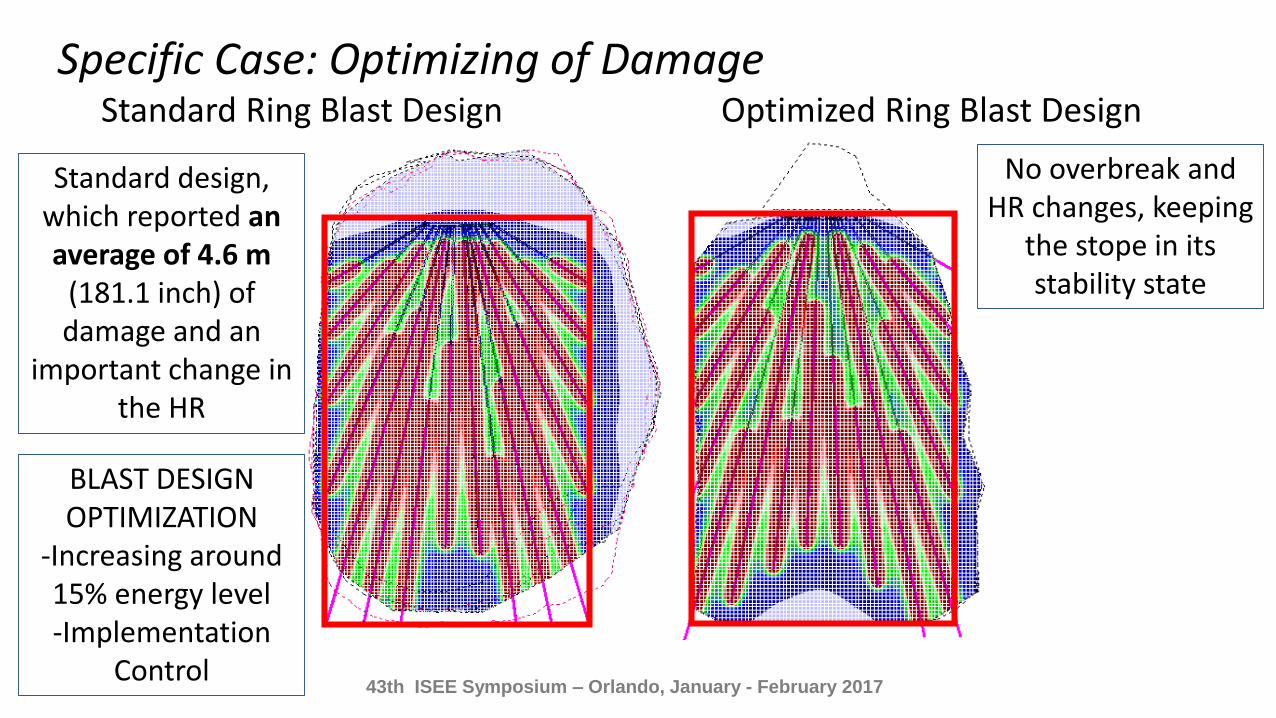
Specific Case: Optimizing of Damage
43th ISEE Symposium – Orlando, January - February 2017
BLAST DESIGN OPTIMIZATION
-Increasing around15% energy level-Implementation
Control
No overbreak and HR changes, keeping
the stope in its stability state
Standard design, which reported an average of 4.6 m
(181.1 inch) of damage and an
important change in the HR
Standard Ring Blast Design Optimized Ring Blast Design
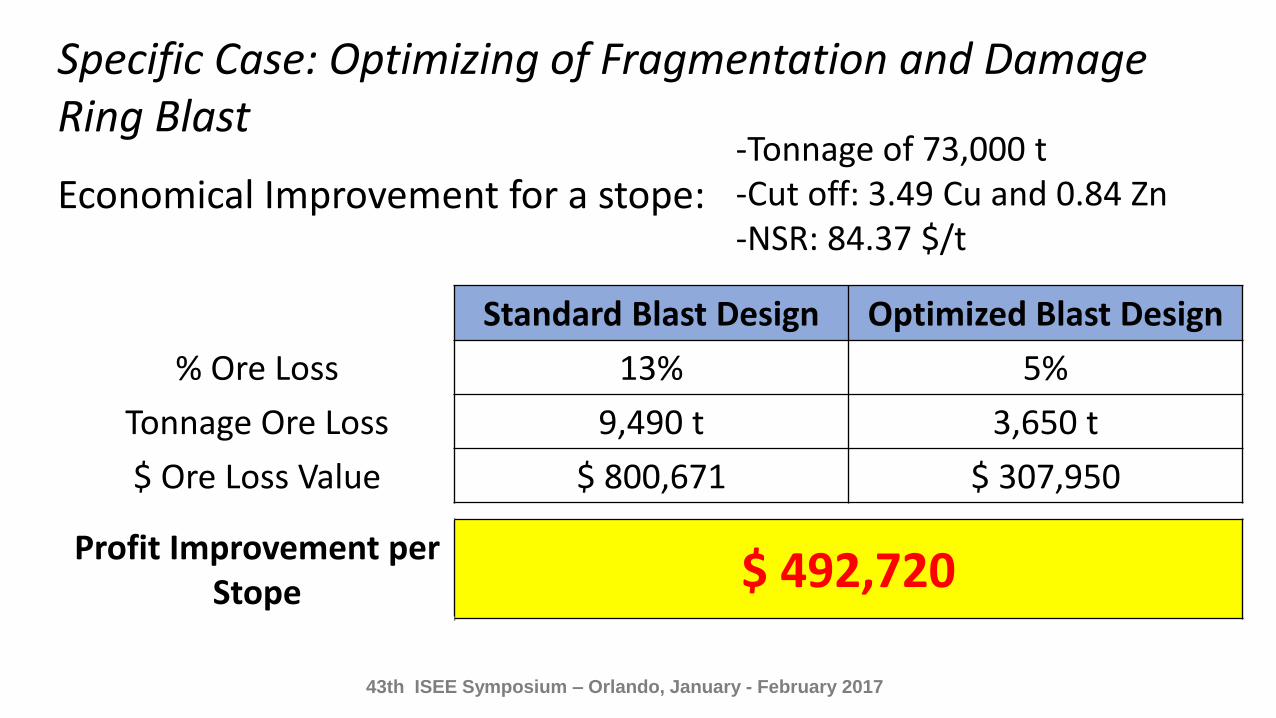
Specific Case: Optimizing of Fragmentation and Damage Ring Blast
Economical Improvement for a stope:
43th ISEE Symposium – Orlando, January - February 2017
Standard Blast Design Optimized Blast Design
% Ore Loss 13% 5%
Tonnage Ore Loss 9,490 t 3,650 t
$ Ore Loss Value $ 800,671 $ 307,950
-Tonnage of 73,000 t-Cut off: 3.49 Cu and 0.84 Zn-NSR: 84.37 $/t
Profit Improvement per Stope $ 492,720
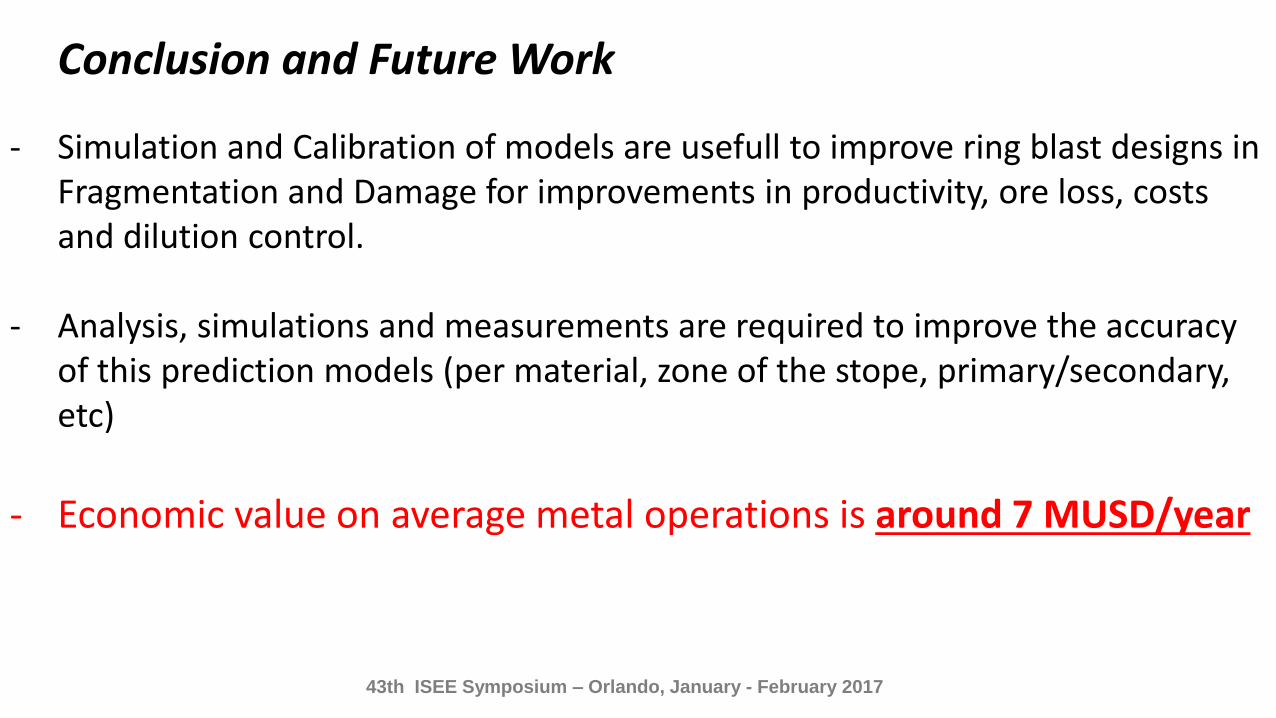
Conclusion and Future Work
43th ISEE Symposium – Orlando, January - February 2017
- Simulation and Calibration of models are usefull to improve ring blast designs in Fragmentation and Damage for improvements in productivity, ore loss, costsand dilution control.
- Analysis, simulations and measurements are required to improve the accuracyof this prediction models (per material, zone of the stope, primary/secondary, etc)
- Economic value on average metal operations is around 7 MUSD/year
Thank you!
43th ISEE Symposium – Orlando, January - February 2017
Top Related