


Languages
Pages
Legal

Review of the Hemostatic ProcessHemostasis Monitoring with the TEG AnalyzerHow the TEG Analyzer Monitors Hemostasis
ParametersTracings
Blood Sample Types and PreparationTest Your Knowledge
Module 2
TEG® Technology
Basic Clinician Training
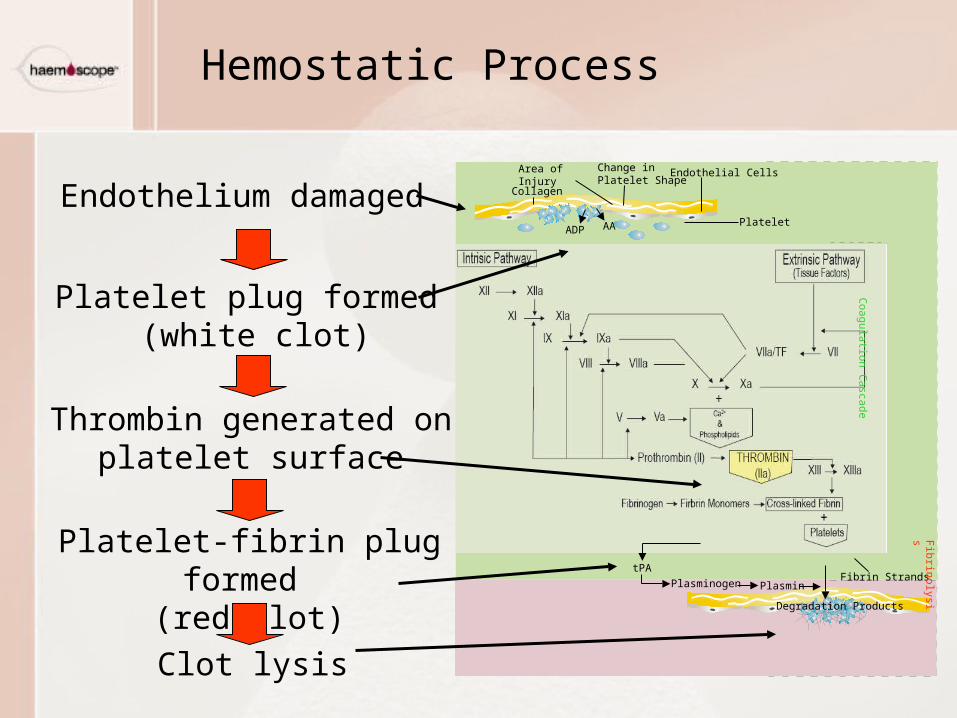
Hemostatic Process
Endothelium damaged
Platelet plug formed (white clot)
Thrombin generated on platelet surface
Platelet-fibrin plug formed (red clot)
Clot lysis
Pr ombin (II) Thr
Ca2+
XI XIa
X
VIIa/TF VII
IX
XII XIIa
XIIIaXIII
+
V V
Platelet
Endothelial CellsChange in Platelet ShapeArea of Injury
Collagen
ADP AA
tPA
Plasminogen PlasminFibrin Strands
Degradation Products
Fibrinolysis
Coagulation C
ascade
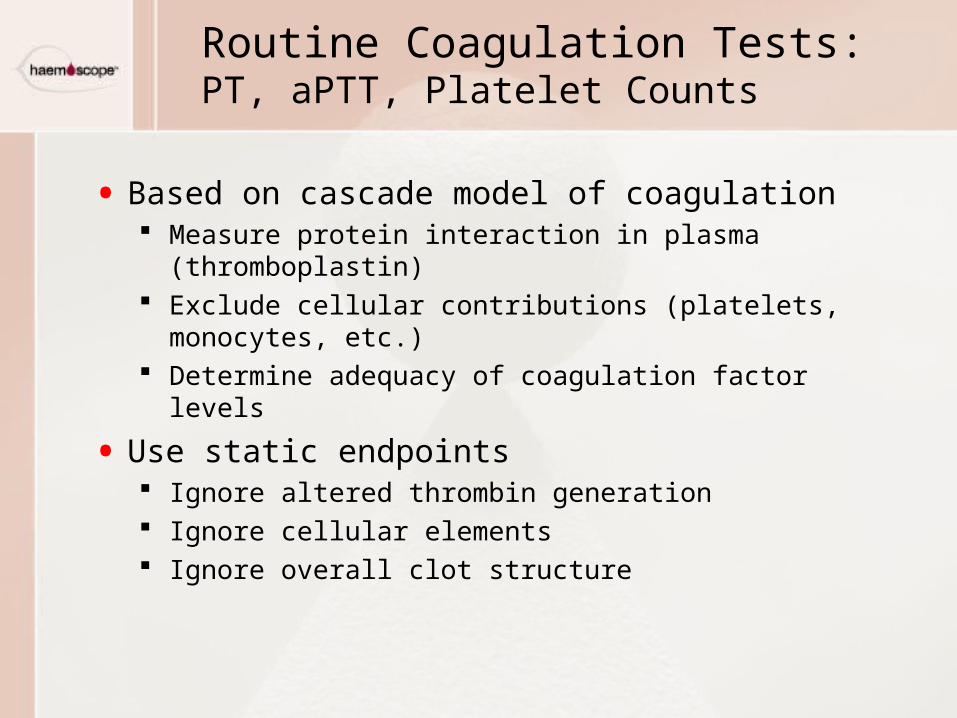
Routine Coagulation Tests: PT, aPTT, Platelet Counts
• Based on cascade model of coagulation Measure protein interaction in plasma (thromboplastin) Exclude cellular contributions (platelets, monocytes, etc.) Determine adequacy of coagulation factor levels
• Use static endpoints Ignore altered thrombin generation Ignore cellular elements Ignore overall clot structure
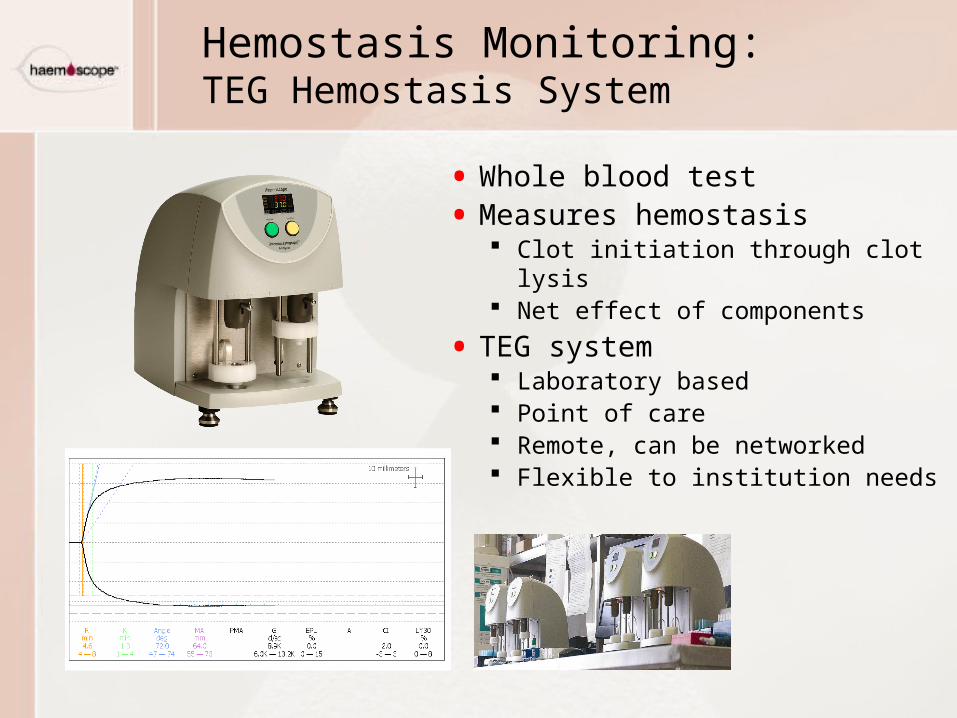
• Whole blood test
• Measures hemostasis Clot initiation through clot lysis Net effect of components
• TEG system Laboratory based Point of care Remote, can be networked Flexible to institution needs
Hemostasis Monitoring:TEG Hemostasis System
The TEG Analyzer:Description
• Reflects balance of the hemostatic system
• Measures the contributions and interactions of hemostatic components during the clotting process
• Uses activated blood to maximize thrombin generation and platelet activation in an in vitro environment Measures the hemostatic potential of the blood at a given
point in time under conditions of maximum thrombin generation
TEG Technology
The TEG Analyzer
How It Works
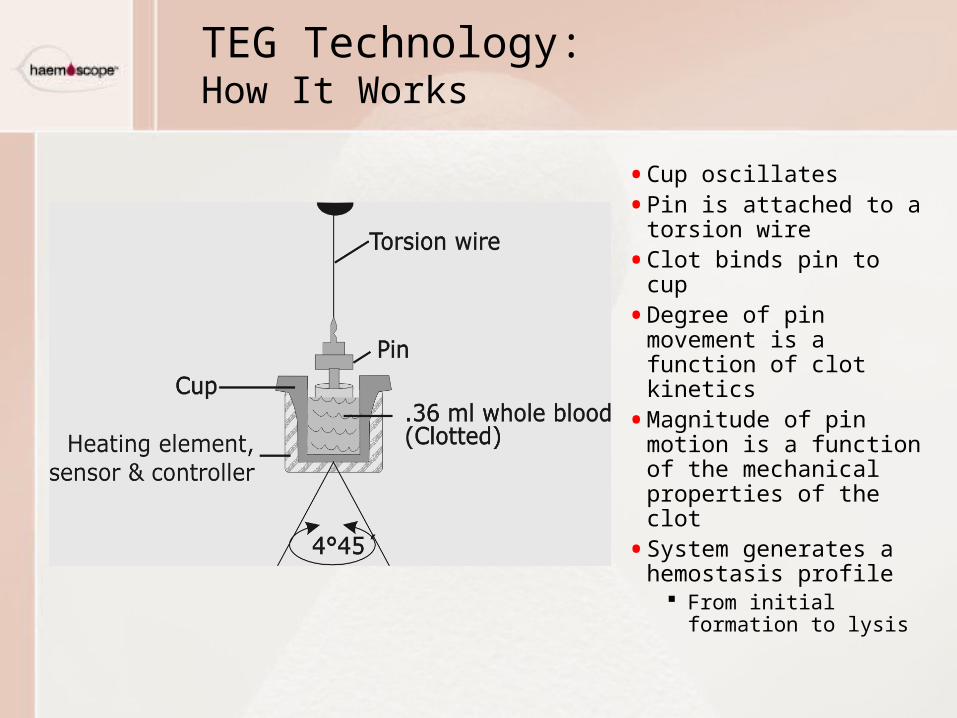
TEG Technology:How It Works
• Cup oscillates
• Pin is attached to a torsion wire
• Clot binds pin to cup
• Degree of pin movement is a function of clot kinetics
• Magnitude of pin motion is a function of the mechanical properties of the clot
• System generates a hemostasis profile
From initial formation to lysis
Utility of TEG Analysis
• Demonstrates all phases of hemostasis Initial fibrin formation Fibrin-platelet plug construction Clot lysis
• Identifies imbalances in the hemostatic system Risk of bleeding Risk of thrombotic event
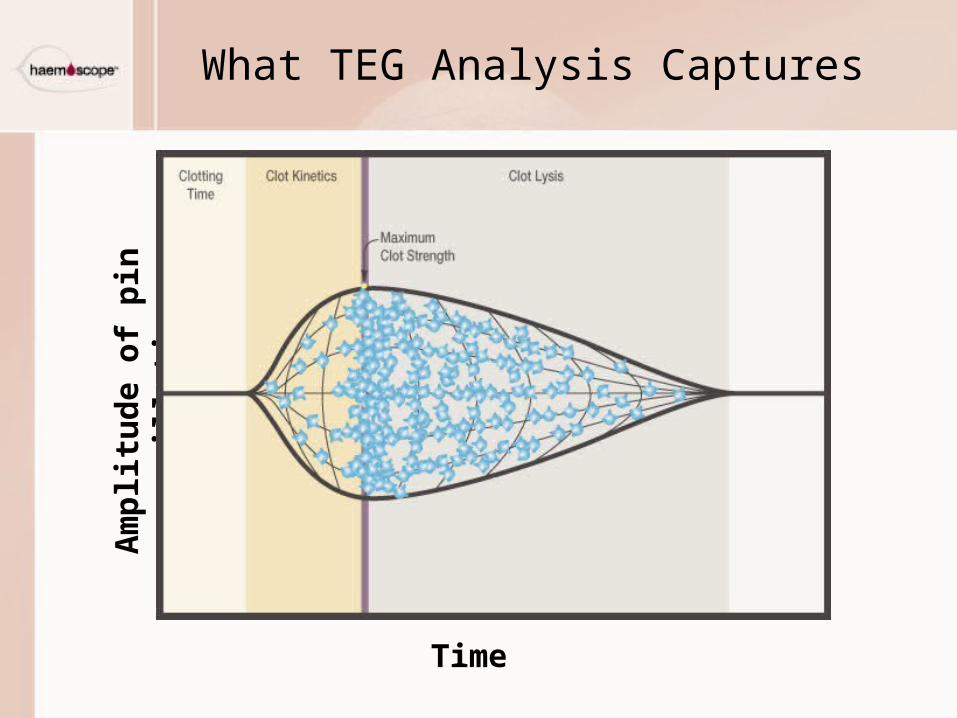
What TEG Analysis CapturesA
mp
litu
de
of
pin
osc
illa
tio
n
Time
TEG Parameters
Identification
Definition
Basic Clinician Training
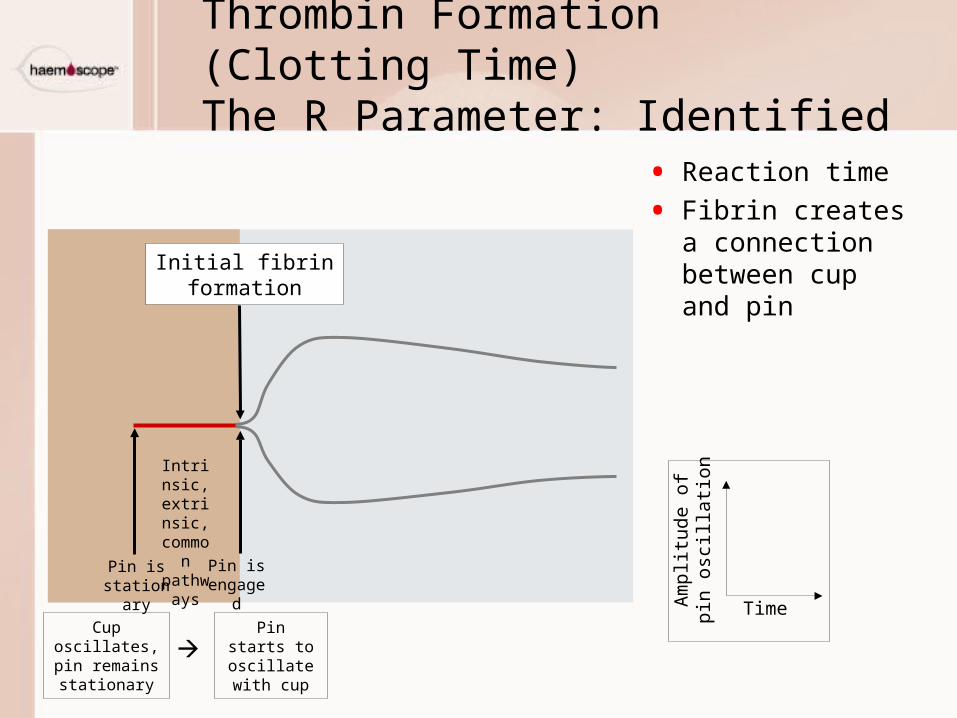
Thrombin Formation (Clotting Time)The R Parameter: Identified
• Reaction time
• Fibrin creates a connection between cup and pin
Cup oscillates, pin remains stationary
Time
Am
plitu
de o
fpi
n os
cilla
tion
Pin starts to oscillate with
cup
Pin is stationary
Pin is engaged
Intrinsic,extrinsic,commonpathways
Initial fibrinformation
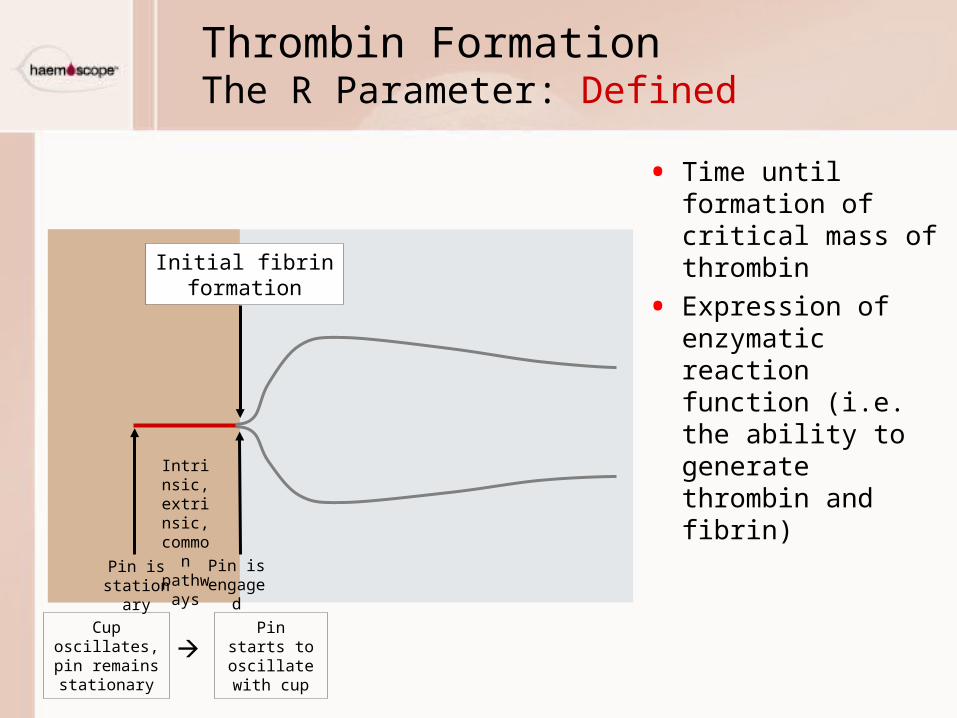
Thrombin FormationThe R Parameter: Defined
• Time until formation of critical mass of thrombin
• Expression of enzymatic reaction function (i.e. the ability to generate thrombin and fibrin)
Cup oscillates, pin remains stationary
Pin starts to oscillate with
cup
Pin is stationary
Pin is engaged
Intrinsic,extrinsic,commonpathways
Initial fibrinformation
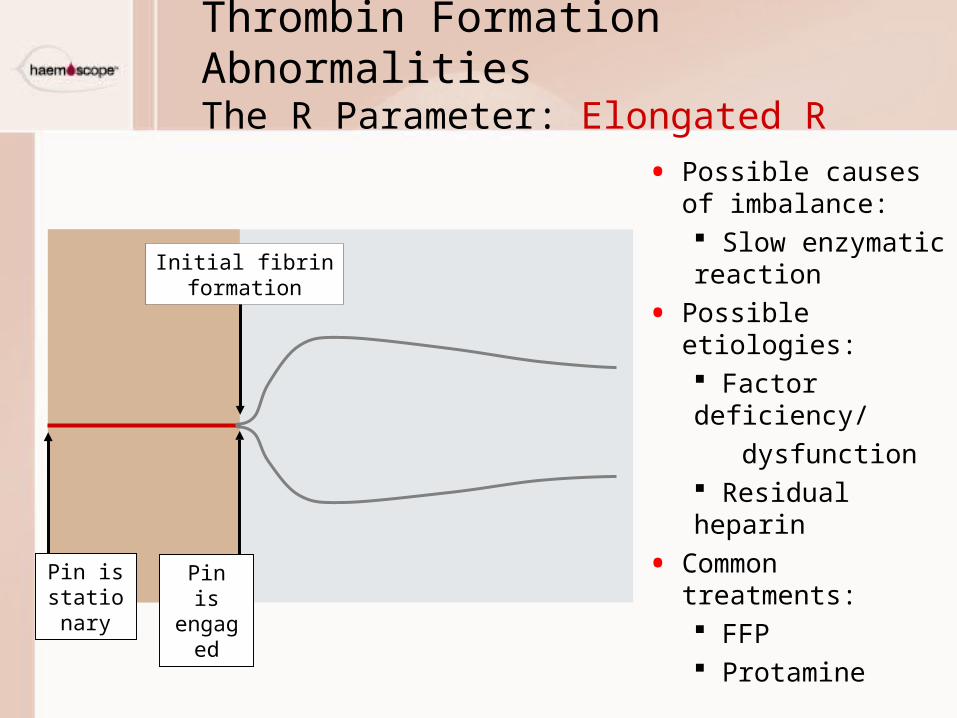
Thrombin Formation AbnormalitiesThe R Parameter: Elongated R
• Possible causes of imbalance: Slow enzymatic reaction
• Possible etiologies: Factor deficiency/
dysfunction Residual heparin
• Common treatments: FFP Protamine
Initial fibrinformation
Pin is stationary
Pin is engaged
Initial fibrinformation
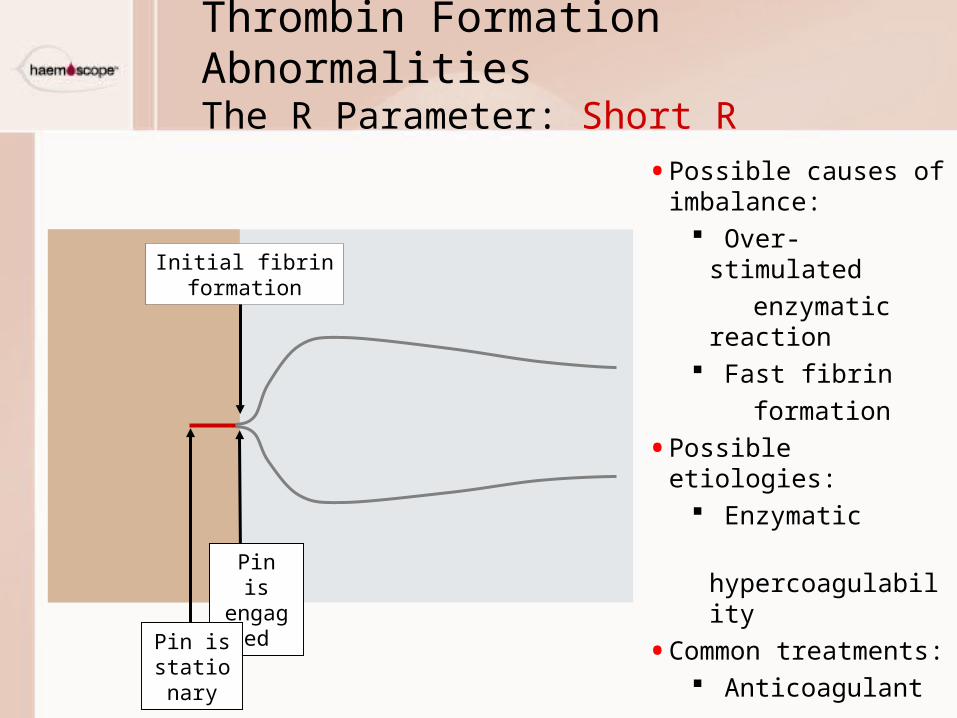
Thrombin Formation AbnormalitiesThe R Parameter: Short R
• Possible causes of imbalance:
Over-stimulated
enzymatic reaction Fast fibrin
formation
• Possible etiologies: Enzymatic
hypercoagulability
• Common treatments: Anticoagulant
Initial fibrinformation
Pin is engaged
Pin is stationary
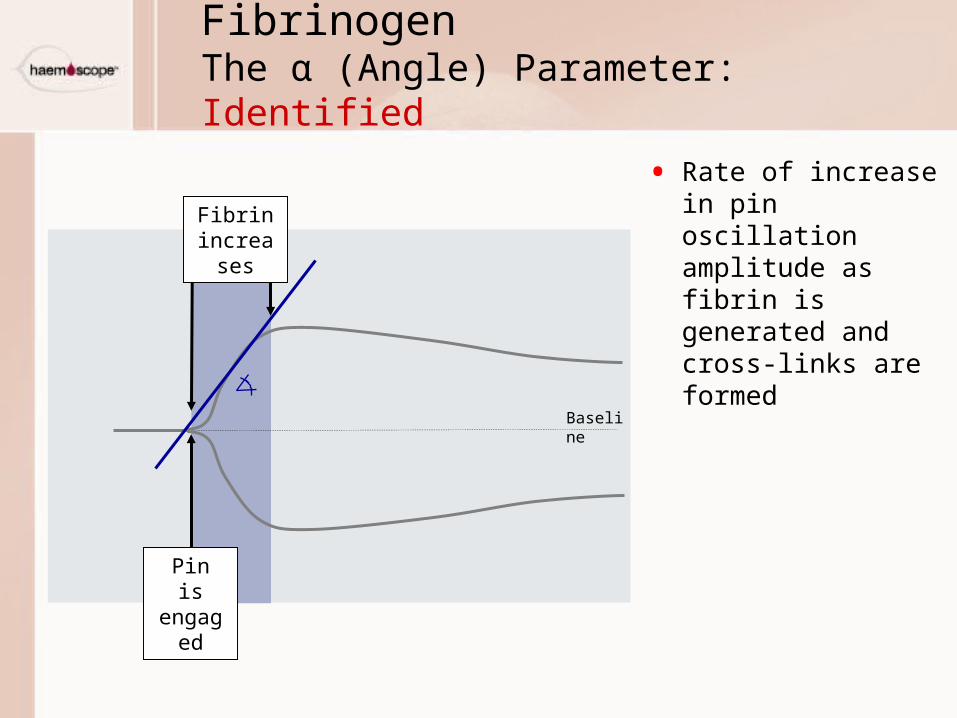
• Rate of increase in pin oscillation amplitude as fibrin is generated and cross-links are formed
FibrinogenThe α (Angle) Parameter: Identified
Baseline
Pin is engaged
Fibrin increases
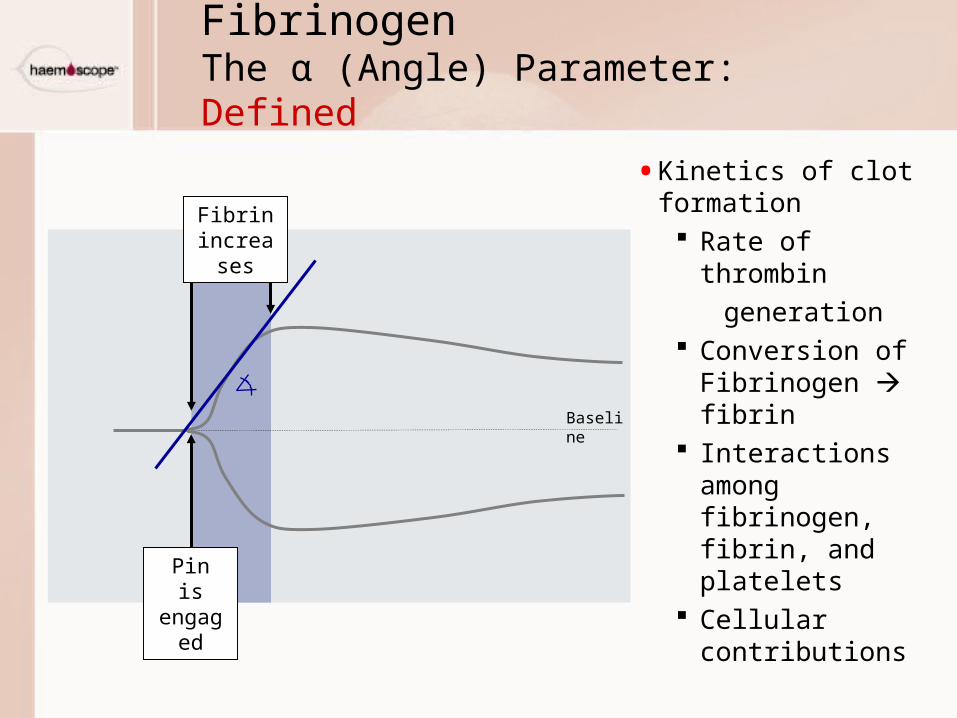
FibrinogenThe α (Angle) Parameter: Defined
• Kinetics of clot formation Rate of thrombin
generation Conversion of
Fibrinogen fibrin
Interactions among fibrinogen, fibrin, and platelets
Cellular contributions
Baseline
Pin is engaged
Fibrin increases
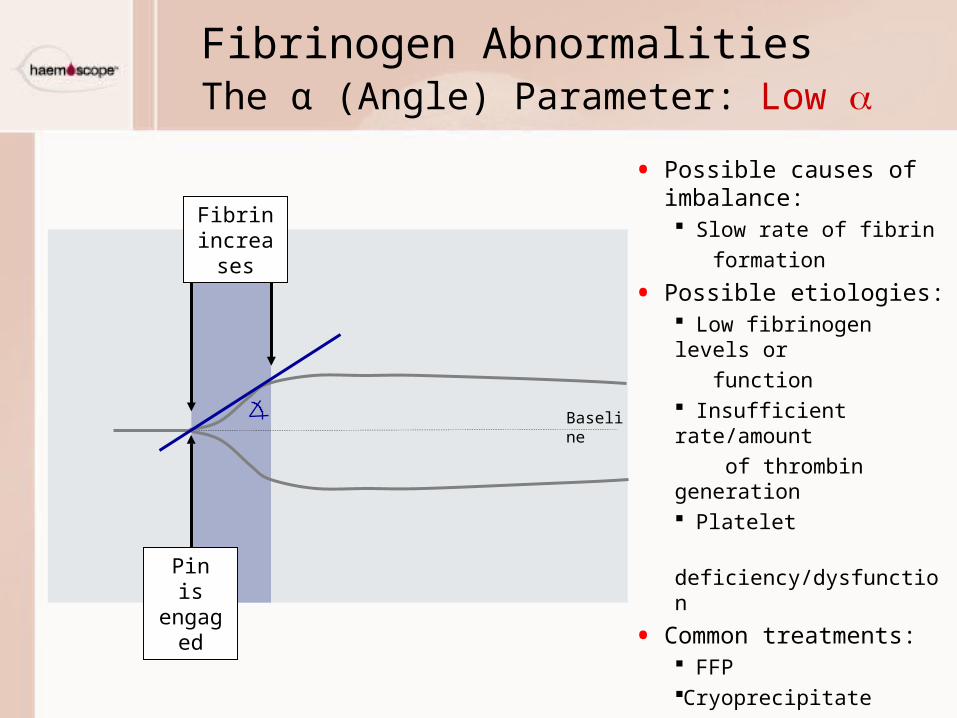
Fibrinogen AbnormalitiesThe α (Angle) Parameter: Low
• Possible causes of imbalance: Slow rate of fibrin
formation
• Possible etiologies: Low fibrinogen levels or
function Insufficient rate/amount
of thrombin generation Platelet
deficiency/dysfunction
• Common treatments: FFPCryoprecipitate
Baseline
Pin is engaged
Fibrin increases
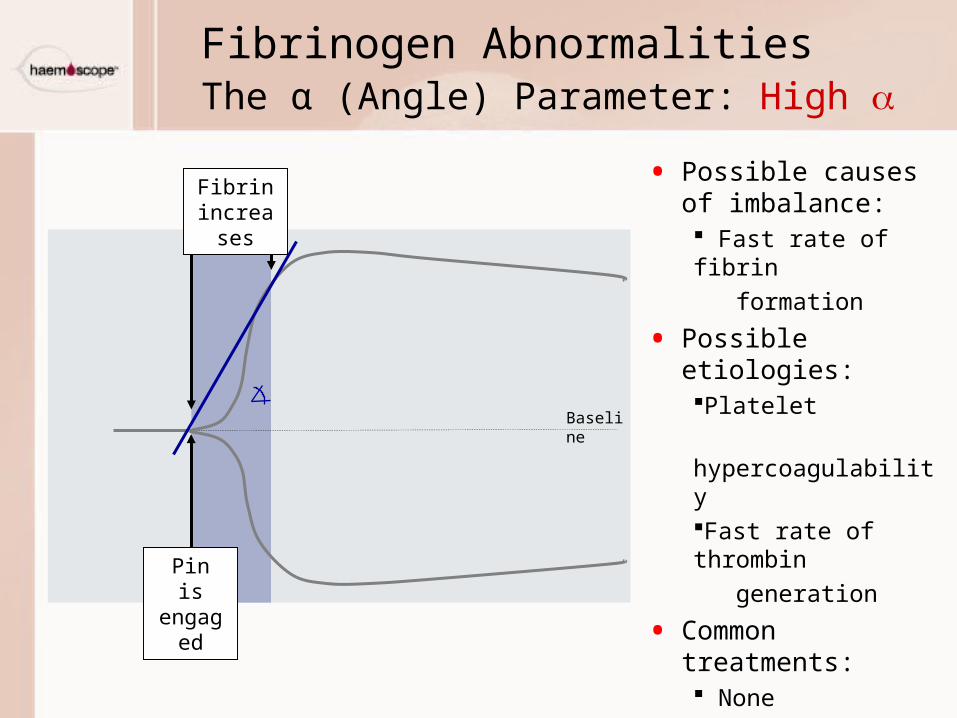
Fibrinogen AbnormalitiesThe α (Angle) Parameter: High
• Possible causes of imbalance: Fast rate of fibrin
formation
• Possible etiologies:Platelet
hypercoagulabilityFast rate of thrombin
generation
• Common treatments: None
Pin is engaged
Fibrin increases
Baseline
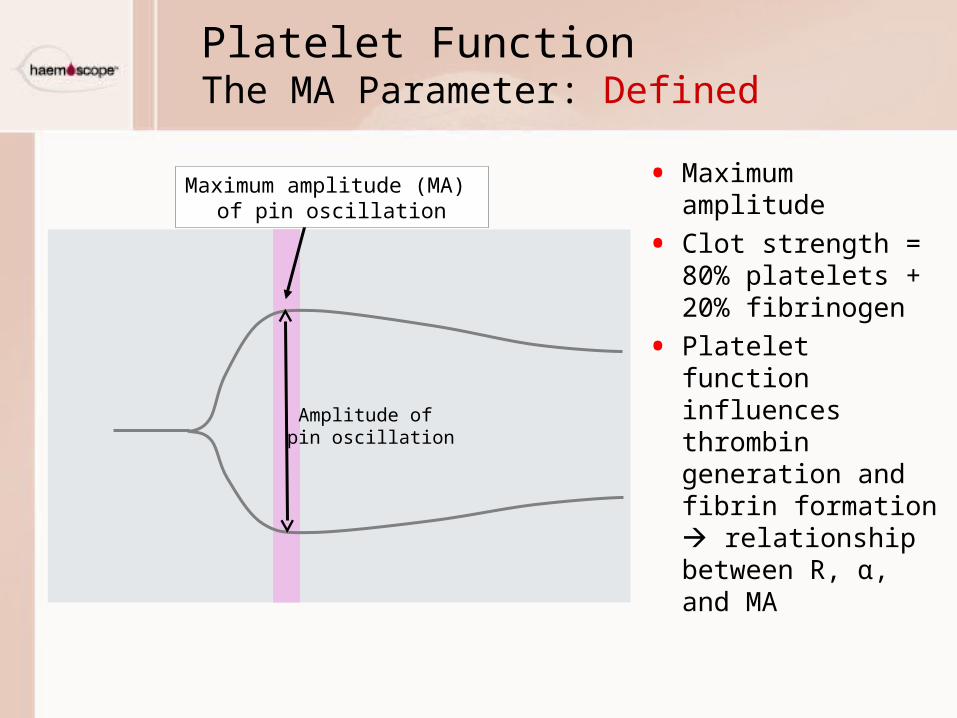
Platelet FunctionThe MA Parameter: Defined
• Maximum amplitude
• Clot strength = 80% platelets + 20% fibrinogen
• Platelet function influences thrombin generation and fibrin formation relationship between R, α, and MA
Amplitude of pin oscillation
Maximum amplitude (MA) of pin oscillation
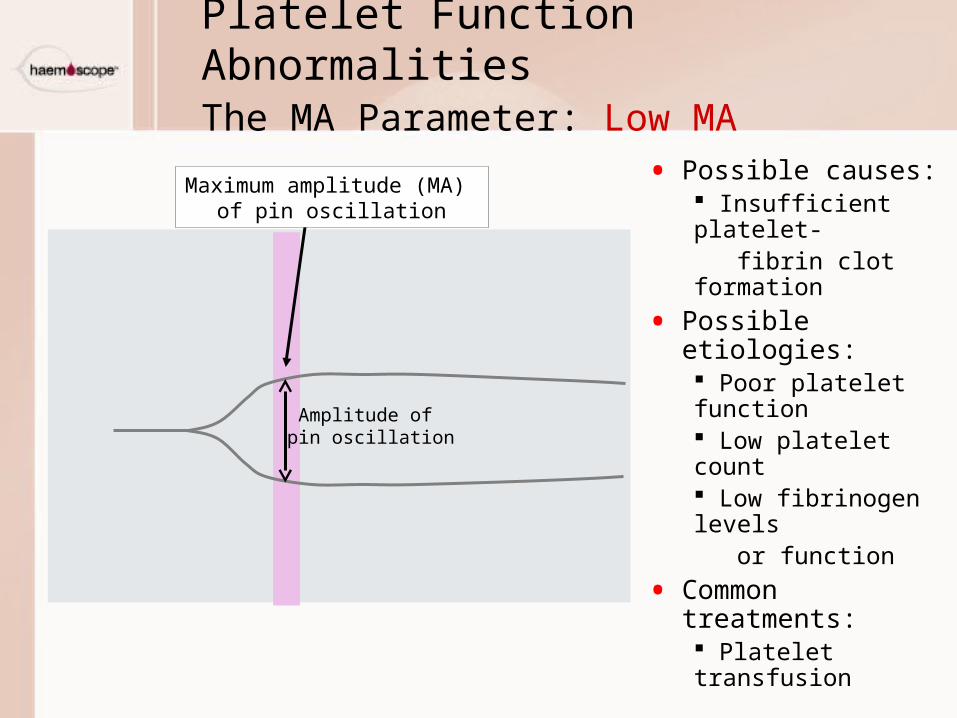
Platelet Function AbnormalitiesThe MA Parameter: Low MA
• Possible causes: Insufficient platelet- fibrin clot formation
• Possible etiologies: Poor platelet function Low platelet count Low fibrinogen levels or function
• Common treatments: Platelet transfusion
Maximum amplitude (MA) of pin oscillation
Amplitude of pin oscillation
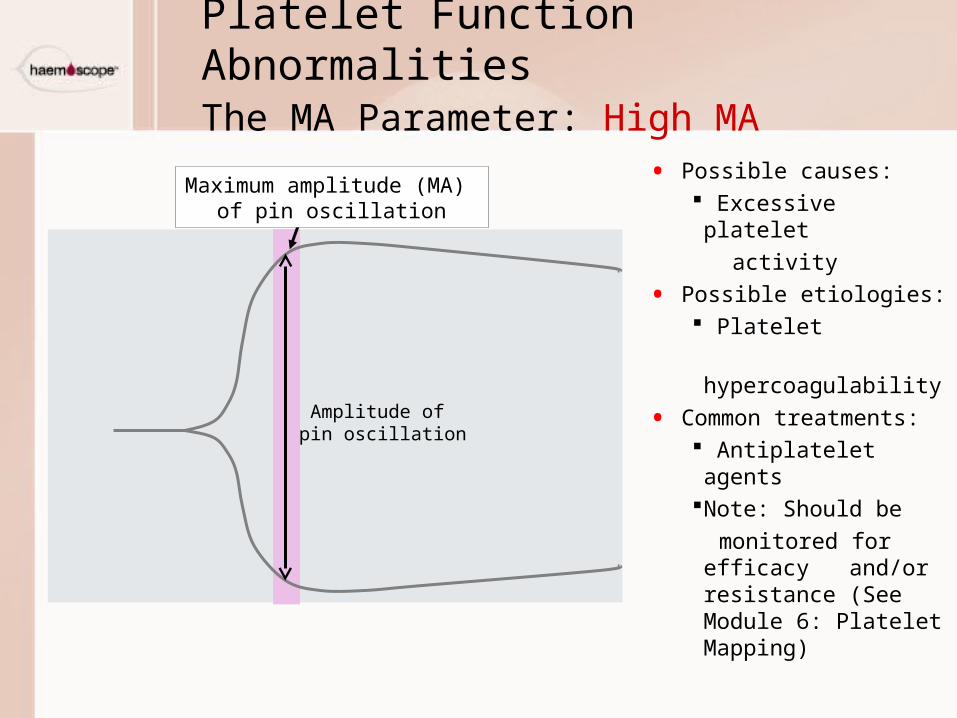
Platelet Function AbnormalitiesThe MA Parameter: High MA
• Possible causes: Excessive platelet
activity
• Possible etiologies: Platelet
hypercoagulability
• Common treatments: Antiplatelet agentsNote: Should be
monitored for efficacy and/or resistance (See Module 6: Platelet Mapping)
Amplitude of pin oscillation
Maximum amplitude (MA) of pin oscillation
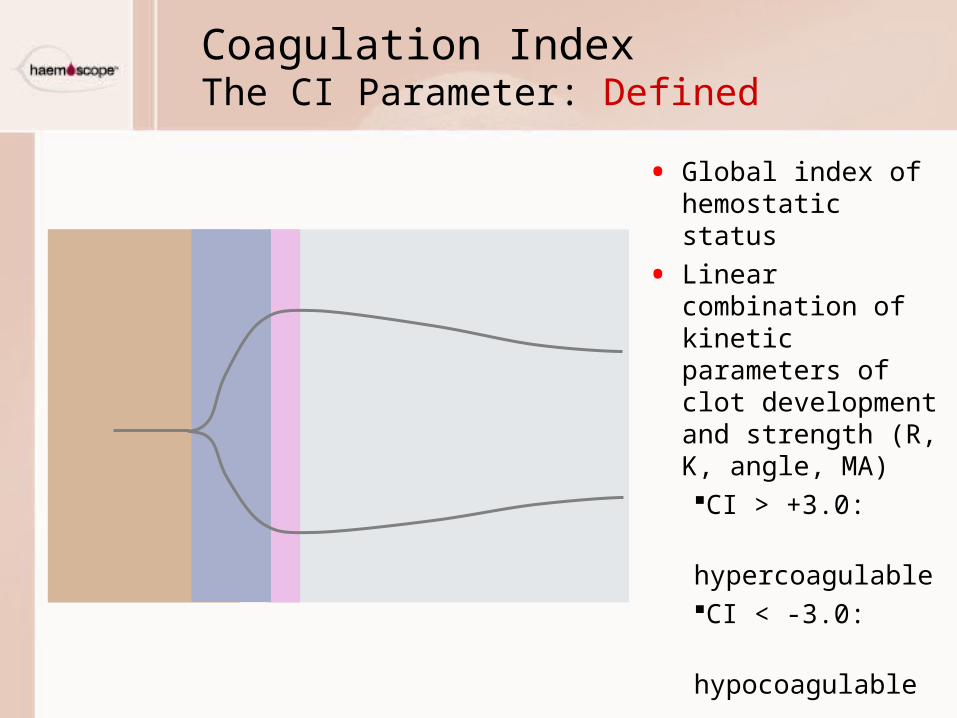
Coagulation IndexThe CI Parameter: Defined
• Global index of hemostatic status
• Linear combination of kinetic parameters of clot development and strength (R, K, angle, MA)CI > +3.0:
hypercoagulableCI < -3.0:
hypocoagulable
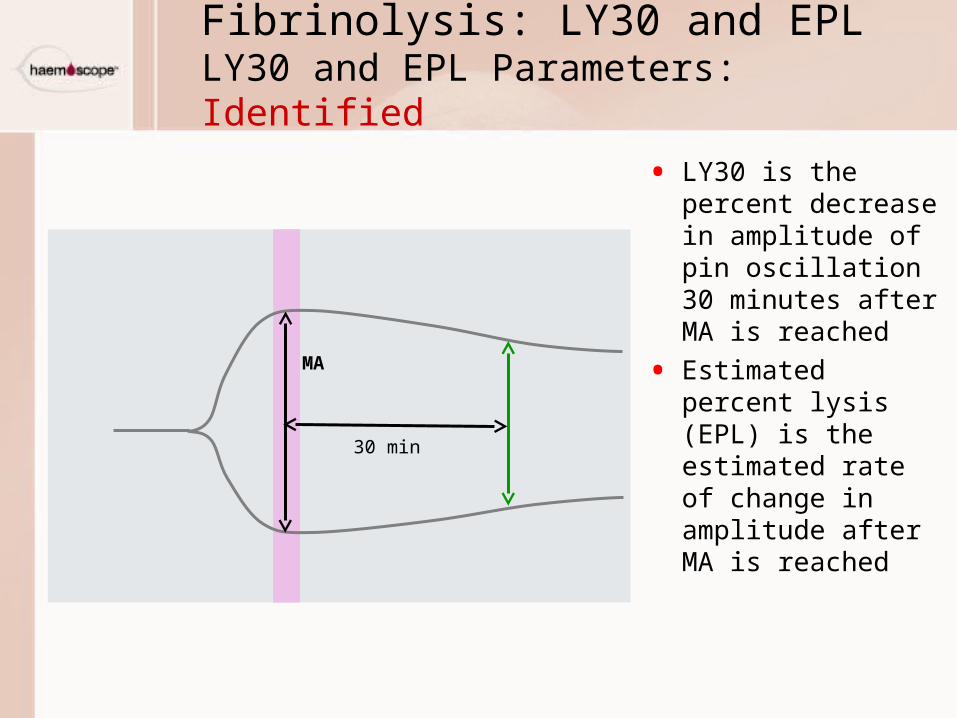
• LY30 is the percent decrease in amplitude of pin oscillation 30 minutes after MA is reached
• Estimated percent lysis (EPL) is the estimated rate of change in amplitude after MA is reached
Fibrinolysis: LY30 and EPLLY30 and EPL Parameters: Identified
MA
30 min
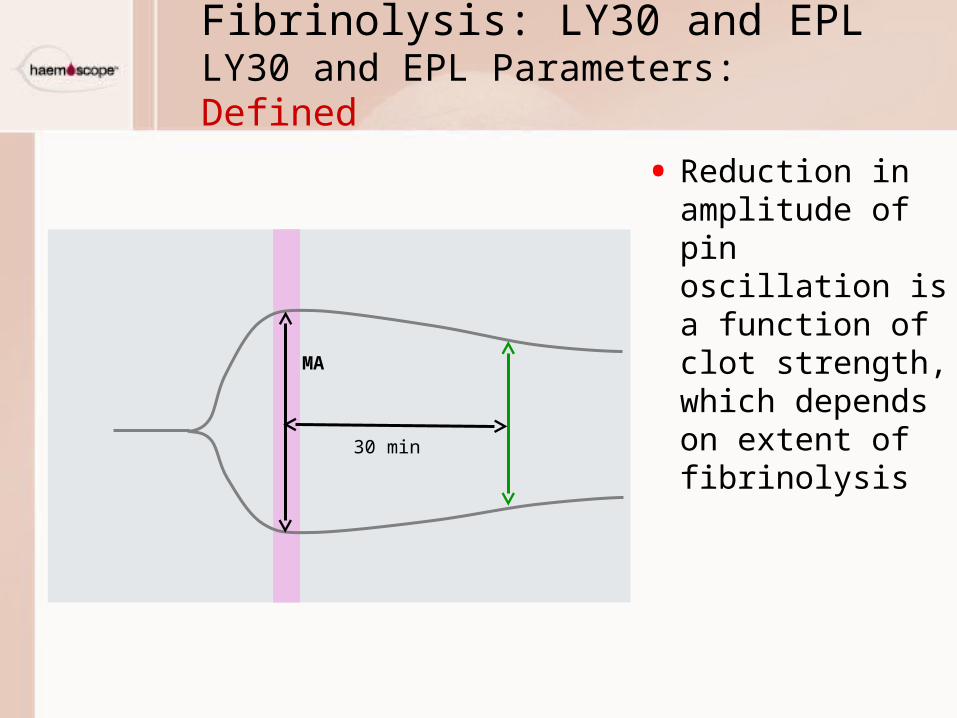
• Reduction in amplitude of pin oscillation is a function of clot strength, which depends on extent of fibrinolysis
Fibrinolysis: LY30 and EPLLY30 and EPL Parameters: Defined
MA
30 min
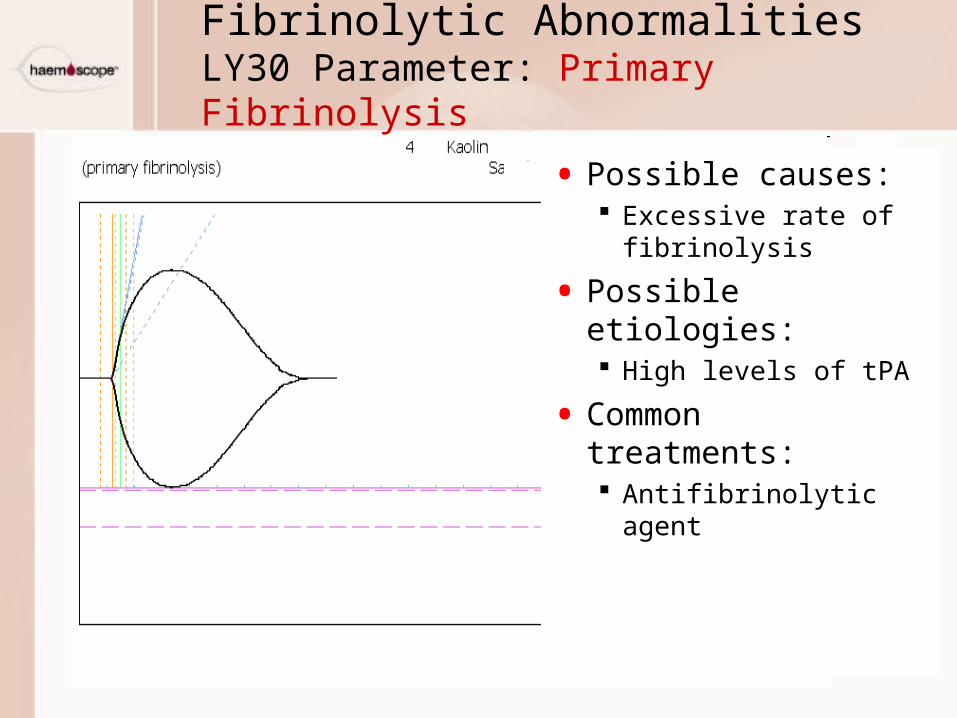
Fibrinolytic AbnormalitiesLY30 Parameter: Primary Fibrinolysis
• Possible causes: Excessive rate of
fibrinolysis
• Possible etiologies: High levels of tPA
• Common treatments: Antifibrinolytic agent
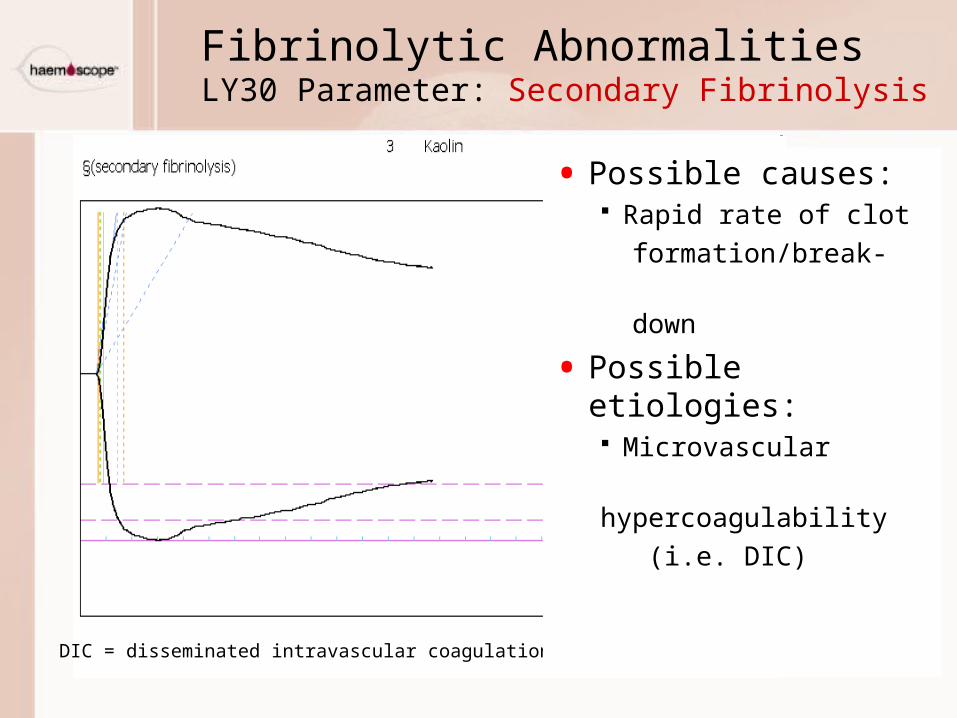
Fibrinolytic AbnormalitiesLY30 Parameter: Secondary Fibrinolysis
DIC = disseminated intravascular coagulation
• Possible causes: Rapid rate of clot
formation/break-
down
• Possible etiologies: Microvascular
hypercoagulability
(i.e. DIC)
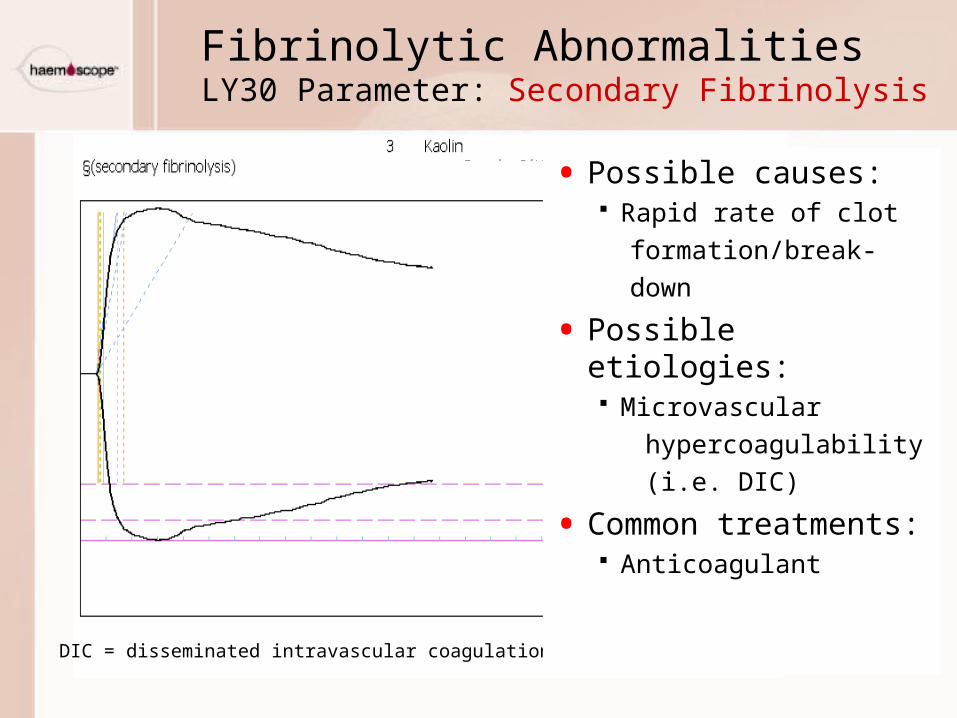
DIC = disseminated intravascular coagulation
Fibrinolytic AbnormalitiesLY30 Parameter: Secondary Fibrinolysis
• Possible causes: Rapid rate of clot
formation/break-
down
• Possible etiologies: Microvascular
hypercoagulability
(i.e. DIC)
• Common treatments: Anticoagulant
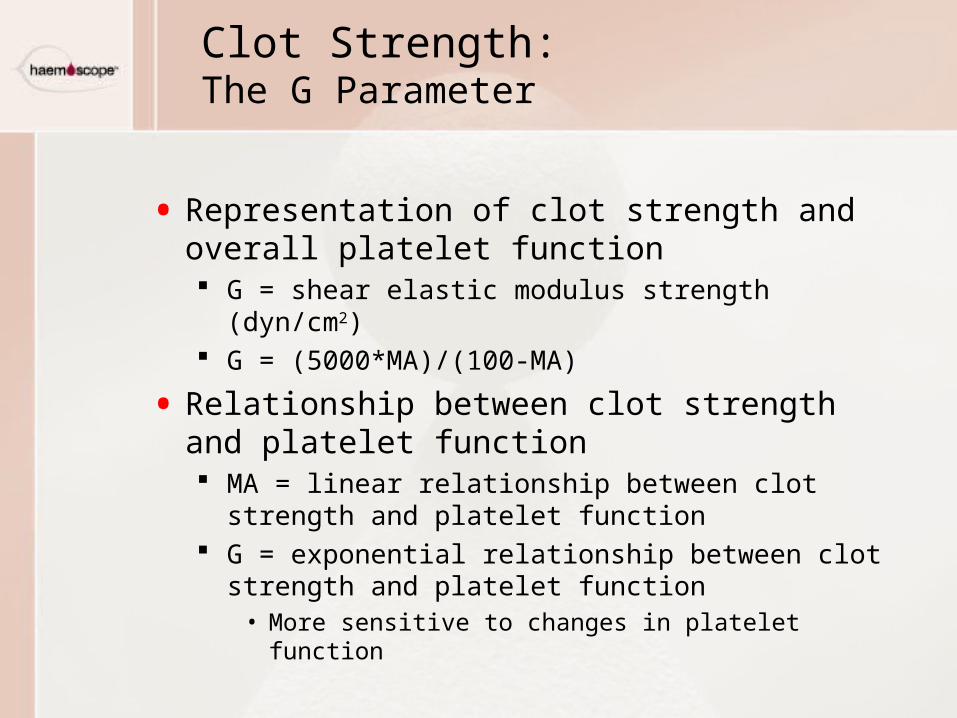
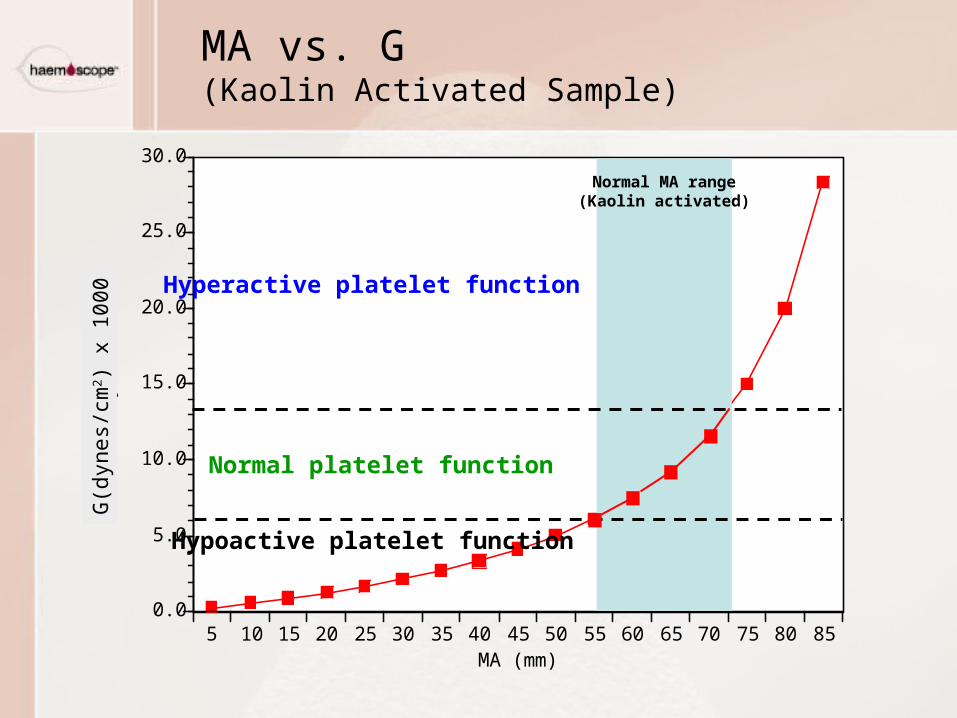
Clot Strength:The G Parameter
• Representation of clot strength and overall platelet function G = shear elastic modulus strength (dyn/cm2) G = (5000*MA)/(100-MA)
• Relationship between clot strength and platelet function MA = linear relationship between clot strength and
platelet function G = exponential relationship between clot strength and
platelet function• More sensitive to changes in platelet function
5 10 15 20 25 30 35 40 45 50 55 60 65 70 75 80 850.0
5.0
10.0
15.0
20.0
25.0
30.0
G (
dyn
s/cm
2)
MA (mm)
MA vs. G(Kaolin Activated Sample)
Hyperactive platelet function
Normal platelet function
Hypoactive platelet function
G(d
ynes
/cm
2 ) x
1000
Normal MA range(Kaolin activated)
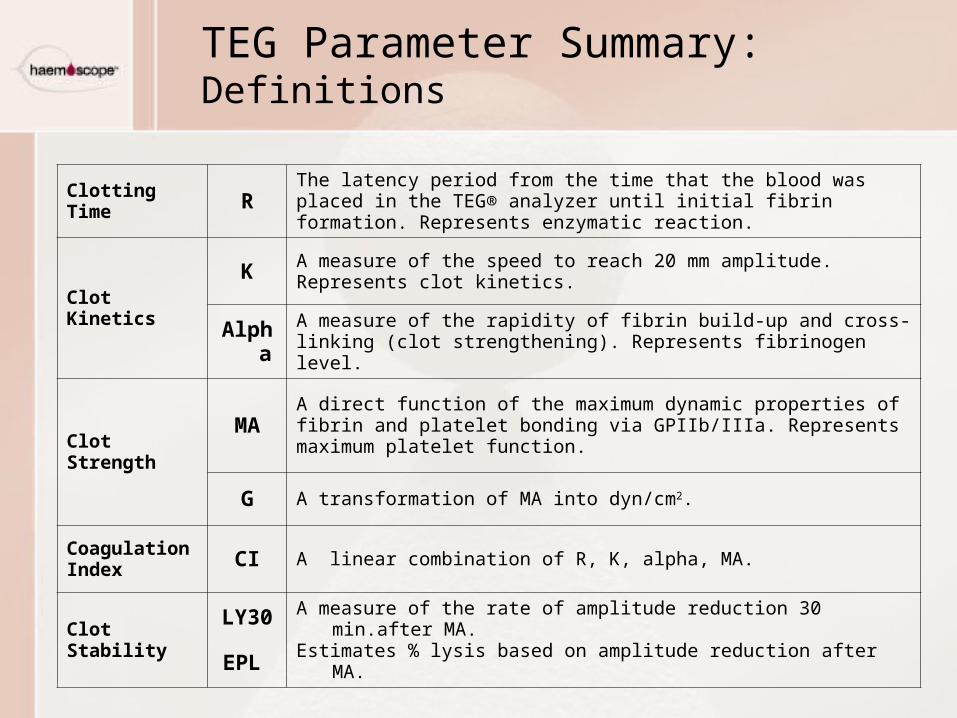
TEG Parameter Summary:Definitions
ClottingTime R The latency period from the time that the blood was placed in the TEG®
analyzer until initial fibrin formation. Represents enzymatic reaction.
ClotKinetics
K A measure of the speed to reach 20 mm amplitude. Represents clot kinetics.
Alpha A measure of the rapidity of fibrin build-up and cross-linking (clot strengthening). Represents fibrinogen level.
Clot Strength
MA A direct function of the maximum dynamic properties of fibrin and platelet bonding via GPIIb/IIIa. Represents maximum platelet function.
G A transformation of MA into dyn/cm2.
Coagulation Index CI A linear combination of R, K, alpha, MA.
Clot Stability
LY30
EPL
A measure of the rate of amplitude reduction 30 min.after MA.Estimates % lysis based on amplitude reduction after MA.
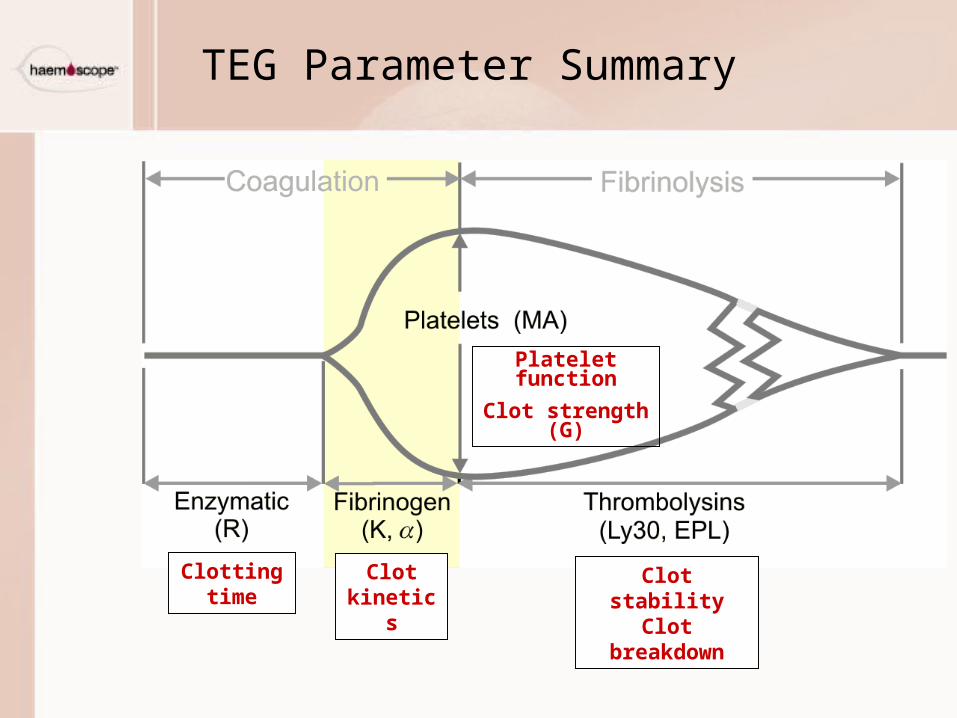
TEG Parameter Summary
Platelet function
Clot strength (G)
Clotting time
Clot kinetics
Clot stability Clot breakdown
TEG Results
Tracings
Data
Decision Tree
Basic Clinician Training
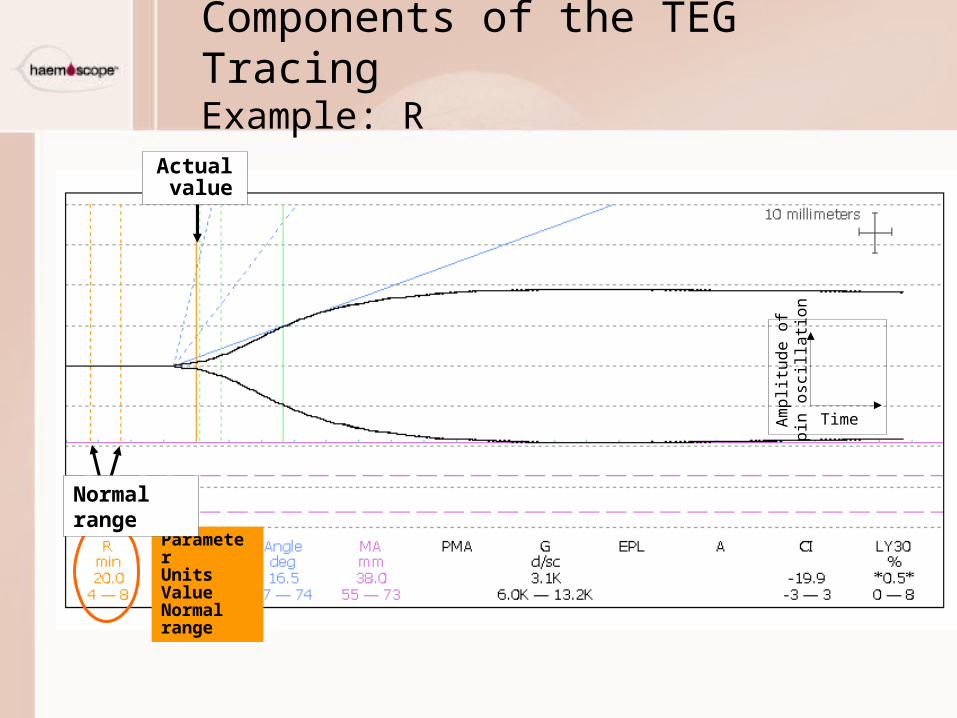
Components of the TEG TracingExample: R
Actual value
ParameterUnitsValueNormal range
Time
Am
plit
ud
e o
fp
in o
scill
atio
n
Normal range
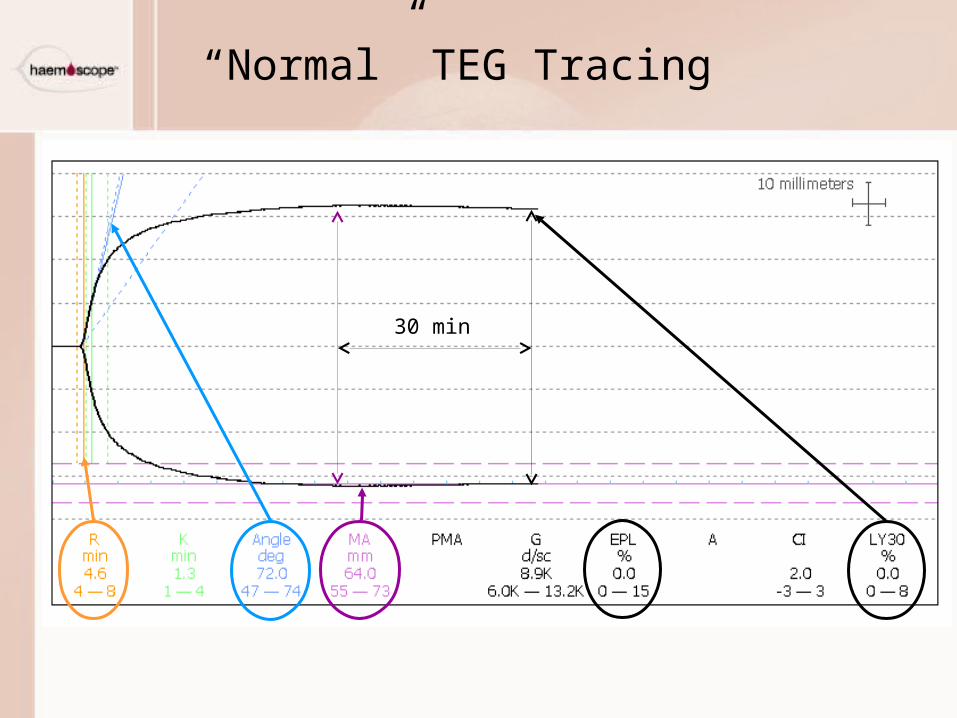
“Normal” TEG Tracing
30 min
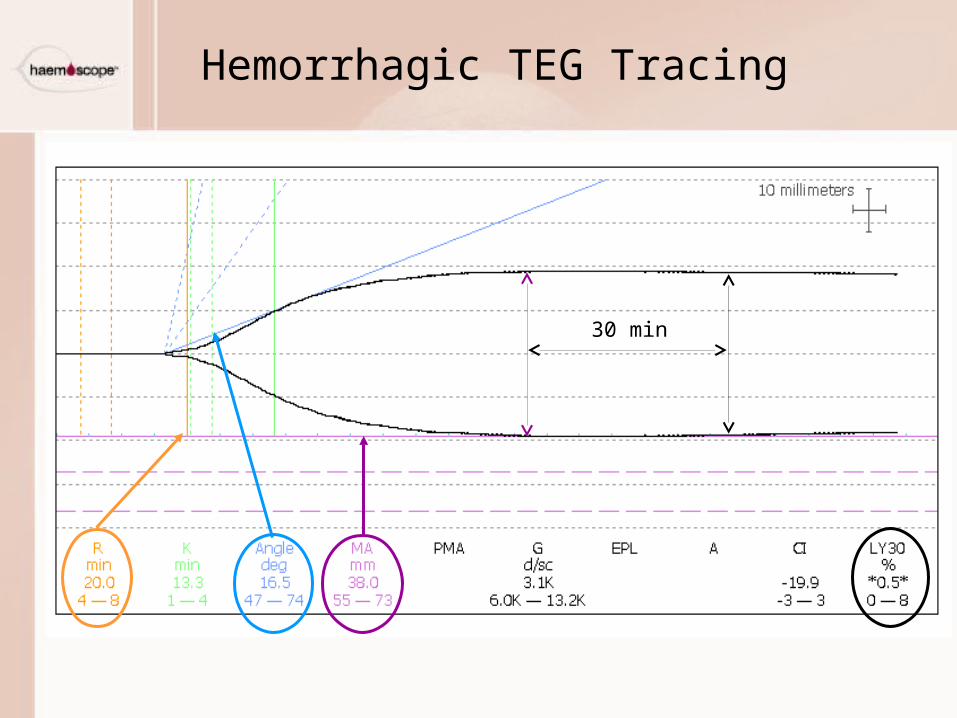
Hemorrhagic TEG Tracing
30 min
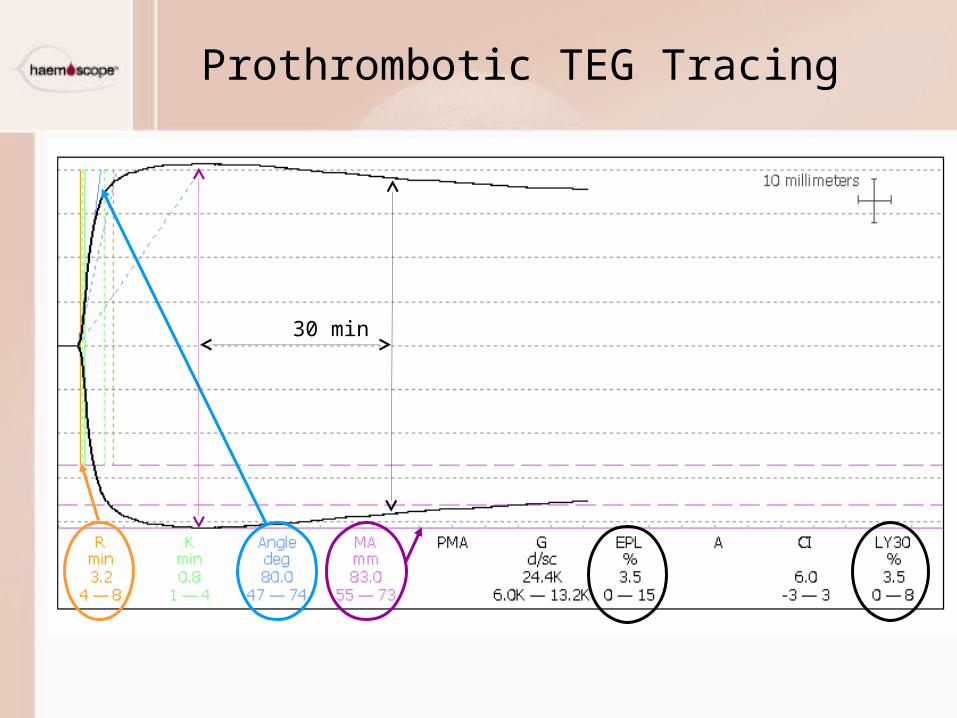
Prothrombotic TEG Tracing
30 min
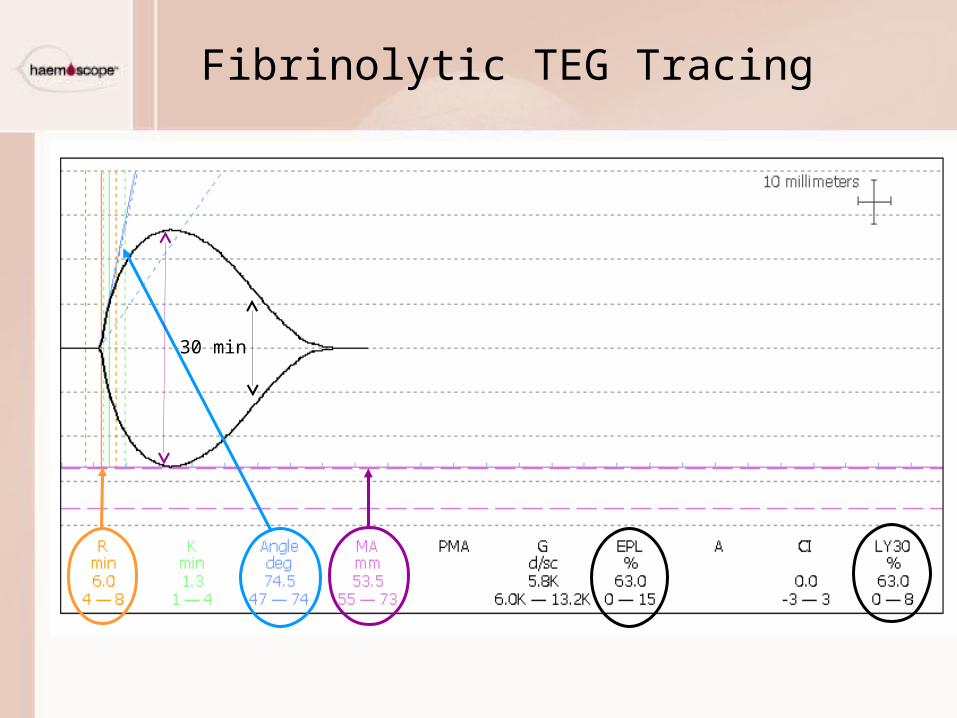
Fibrinolytic TEG Tracing
30 min
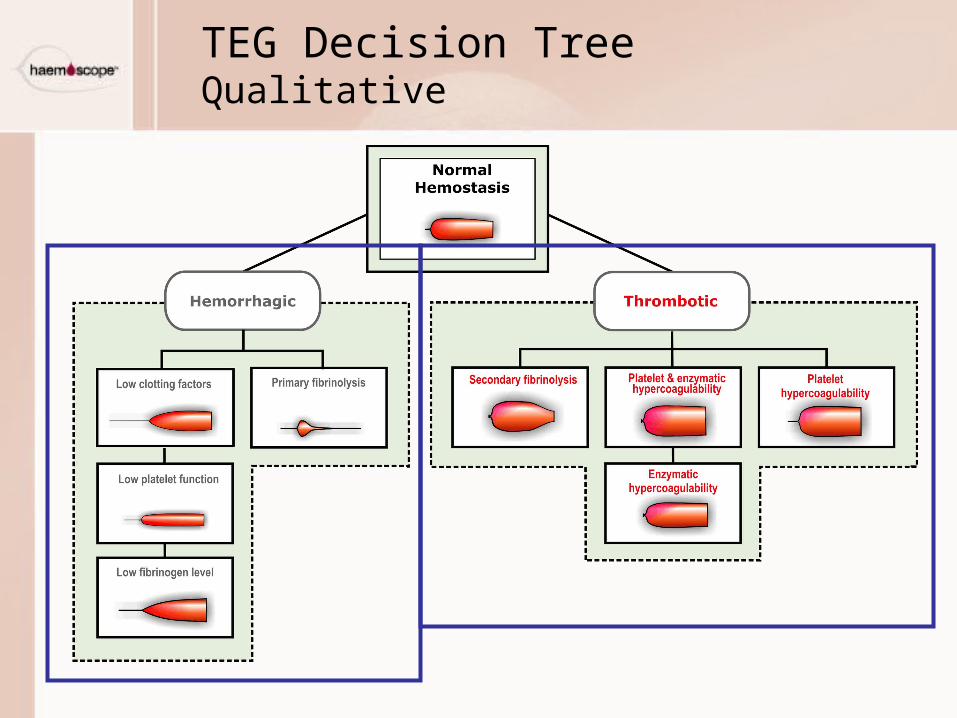
TEG Decision TreeQualitative
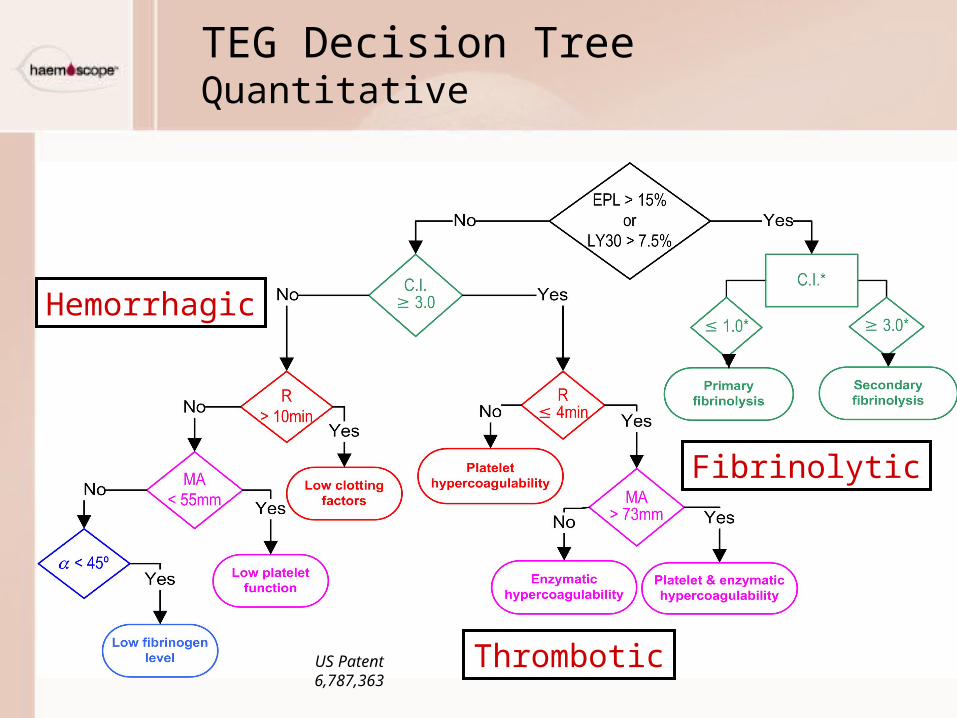
US Patent 6,787,363
Hemorrhagic
Thrombotic
Fibrinolytic
TEG Decision TreeQuantitative
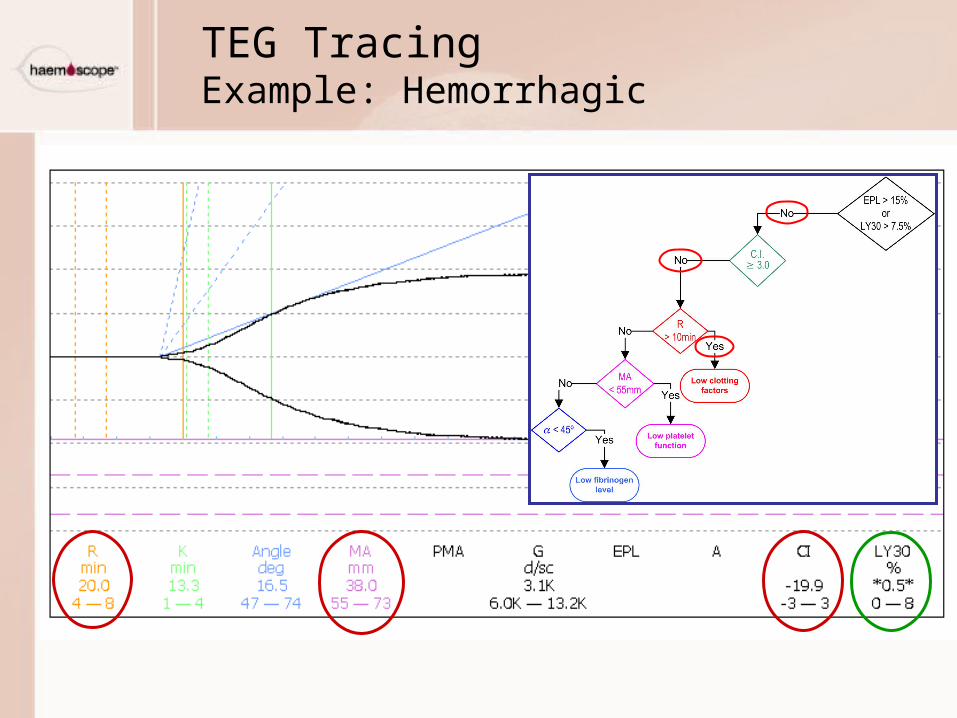
TEG TracingExample: Hemorrhagic
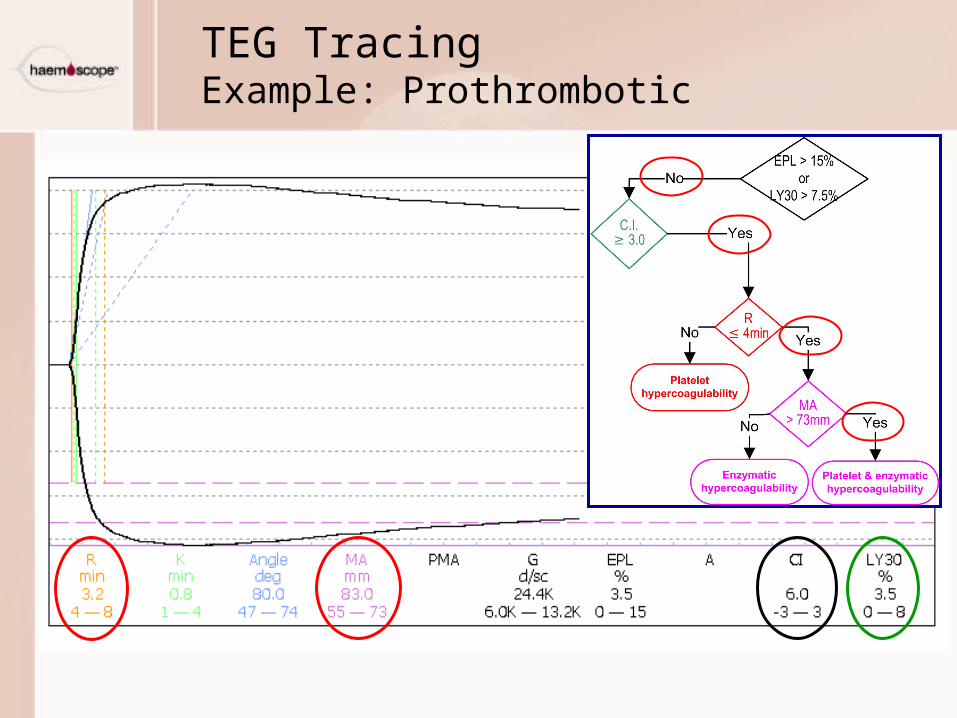
TEG TracingExample: Prothrombotic
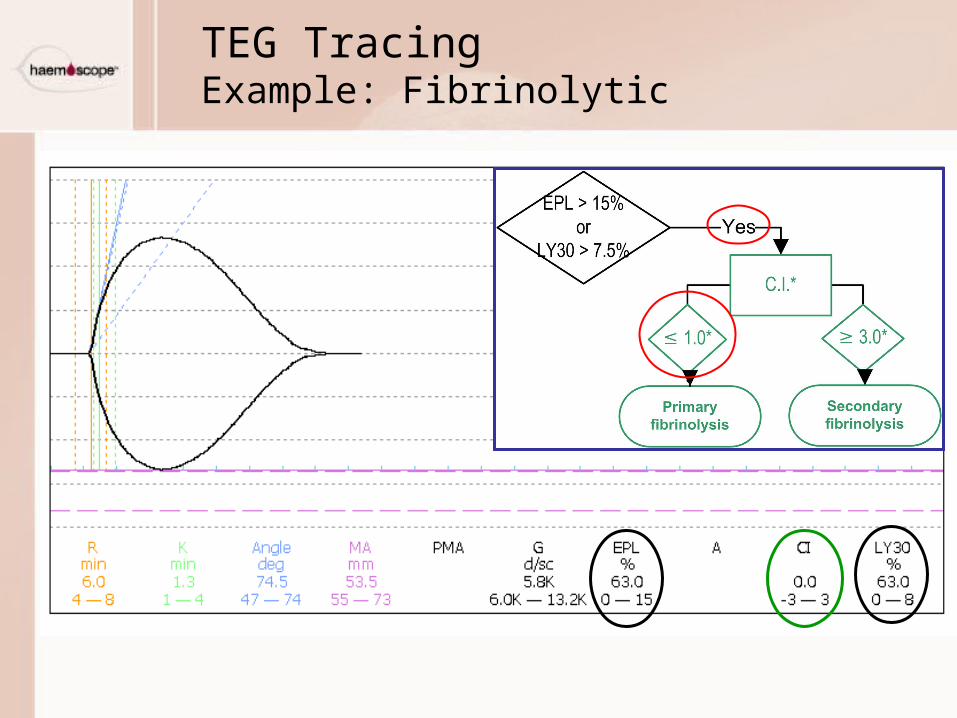
TEG TracingExample: Fibrinolytic
TEG Blood Sampling
Basic Clinician Training
TEG Blood Sampling
• Blood samples Arterial or venous Samples should be consistent
TEG Blood SamplingNative
• Non-modified blood samples Assayed 4 minutes TEG software based upon assay at 4 minutes
TEG Blood Sampling Modified
• Activator Reduces variability Reduces running time Maximizes thrombin generation
• Kaolin Activates intrinsic pathway Used for normal TEG analysis
• Tissue factor Specifically activates extrinsic pathway
TEG Blood SamplingHeparin
• Heparinase Neutralizes heparin Embedded in specialized (blue) cups and pins
TEG Blood SamplingCitrated
• Citrated tubes are used
• Recalcified before analysis
• Standardize time between blood draw and running test
• Specific platelet activators are required to demonstrate effect of antiplatelet agents
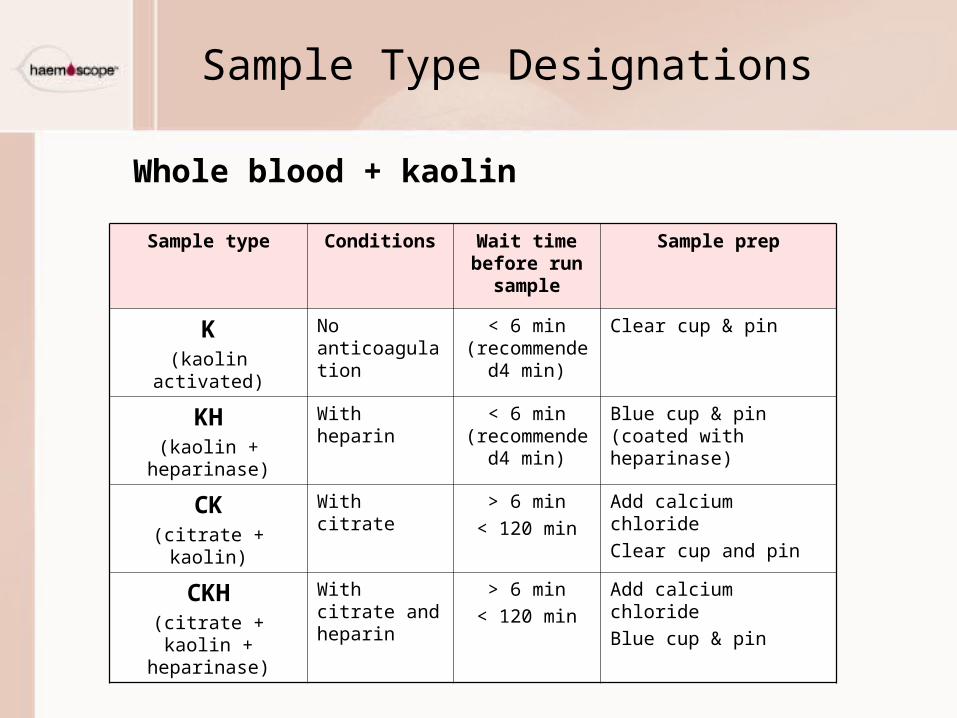
Sample Type Designations
Sample type Conditions Wait time before run
sample
Sample prep
K(kaolin activated)
No anticoagulation
< 6 min(recommended
4 min)
Clear cup & pin
KH(kaolin + heparinase)
With heparin < 6 min(recommended
4 min)
Blue cup & pin (coated with heparinase)
CK(citrate + kaolin)
With citrate > 6 min
< 120 min
Add calcium chloride
Clear cup and pin
CKH(citrate + kaolin +
heparinase)
With citrate and heparin
> 6 min
< 120 min
Add calcium chloride
Blue cup & pin
Whole blood + kaolin
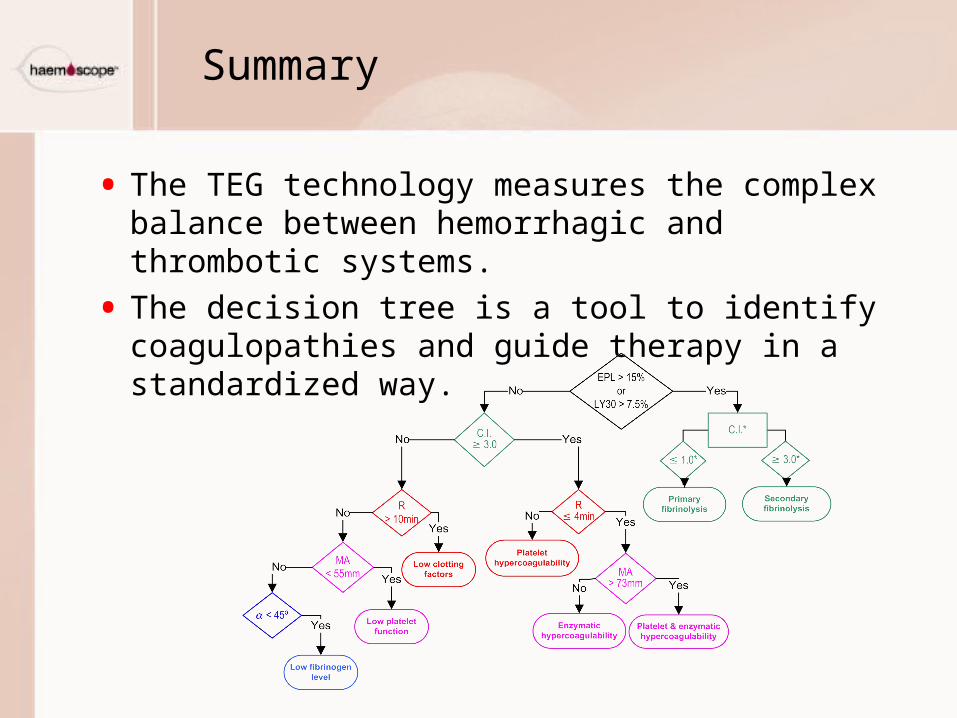
• The TEG technology measures the complex balance between hemorrhagic and thrombotic systems.
• The decision tree is a tool to identify coagulopathies and guide therapy in a standardized way.
Summary
Basic Clinician Training
TEG Parameters
Hemostasis Monitoring
Test your knowledge of TEG parameters and hemostasis monitoring by answering the questions on the slides that follow.
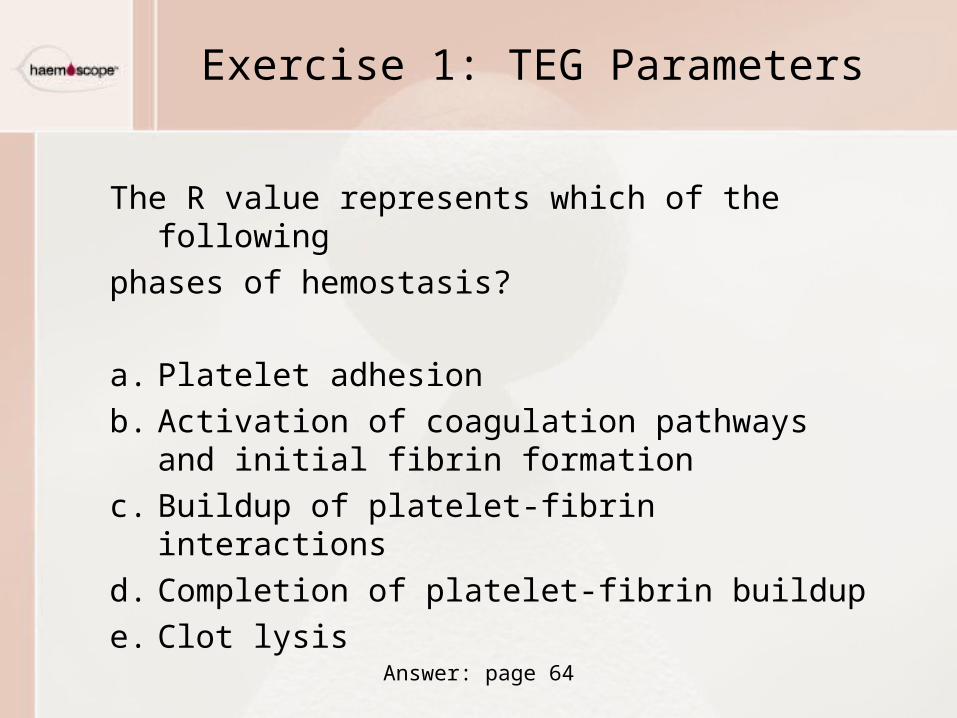
Exercise 1: TEG Parameters
The R value represents which of the following
phases of hemostasis?
a. Platelet adhesion
b. Activation of coagulation pathways and initial fibrin formation
c. Buildup of platelet-fibrin interactions
d. Completion of platelet-fibrin buildup
e. Clot lysis
Answer: page 64
Exercise 2: TEG Parameters
Select the TEG parameters that demonstrate
kinetic properties of clot formation. (Select all that
apply)
a. R
b. Angle ()
c. MA
d. LY30
e. CI
Answer: page 65

Exercise 3: TEG Parameters
The rate of clot strength buildup is demonstratedby which of the following TEG parameters?
a. R
b. Angle ()
c. MA
d. LY30
e. CI
Answer: page 66
Exercise 4: TEG Parameters
Which of the following TEG parameters will best
demonstrate the need for coagulation factors
(i.e. FFP)?
a. R
b. Angle ()
c. MA
d. LY30
e. CI
Answer: page 67
Exercise 5: TEG Parameters
Clot strength is dependent upon which of these
hemostatic components?
a. 100% platelets
b. 80% platelets, 20% fibrin
c. 50% platelets, 50% fibrin
d. 20% platelets, 80% fibrin
e. 100% fibrin
Answer: page 68
Exercise 6: TEG Parameters
Which of the following TEG parameters
demonstrate a structural property of the clot?
(Select all that apply)
a. R
b. Angle ()
c. MA
d. LY30
e. CI
Answer: page 69
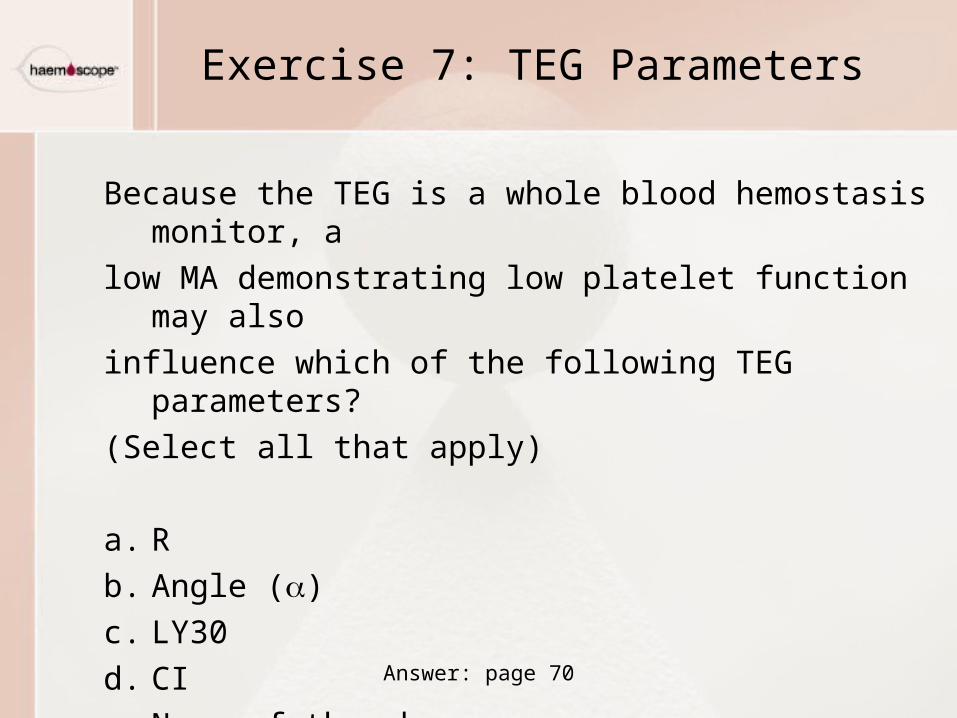
Exercise 7: TEG Parameters
Because the TEG is a whole blood hemostasis monitor, a
low MA demonstrating low platelet function may also
influence which of the following TEG parameters?
(Select all that apply)
a. R
b. Angle ()
c. LY30
d. CI
e. None of the above
Answer: page 70
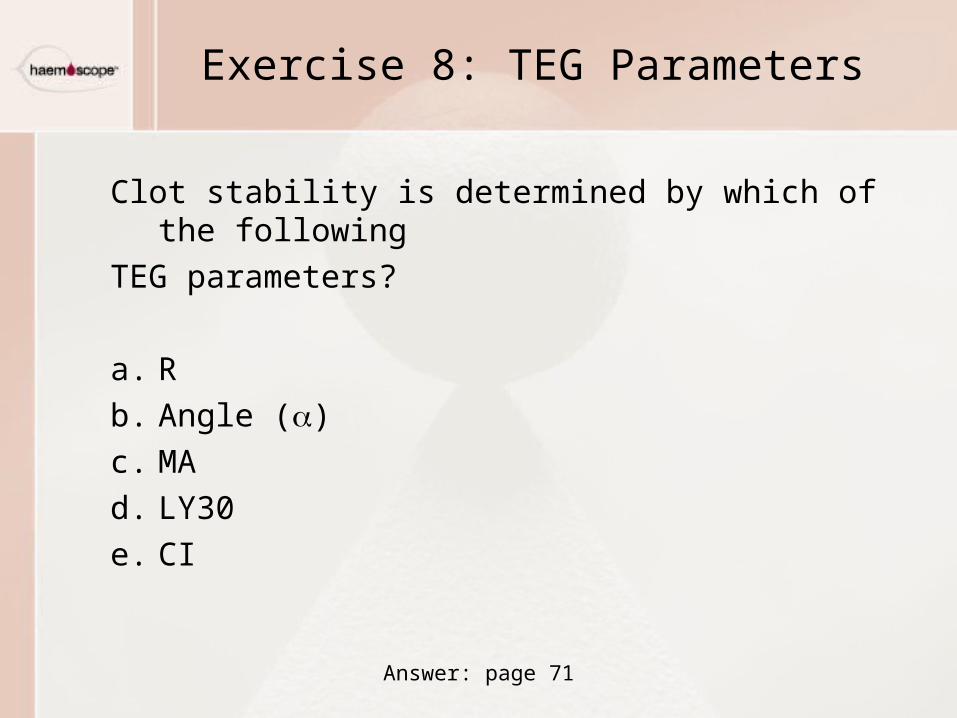
Exercise 8: TEG Parameters
Clot stability is determined by which of the following
TEG parameters?
a. R
b. Angle ()
c. MA
d. LY30
e. CI
Answer: page 71
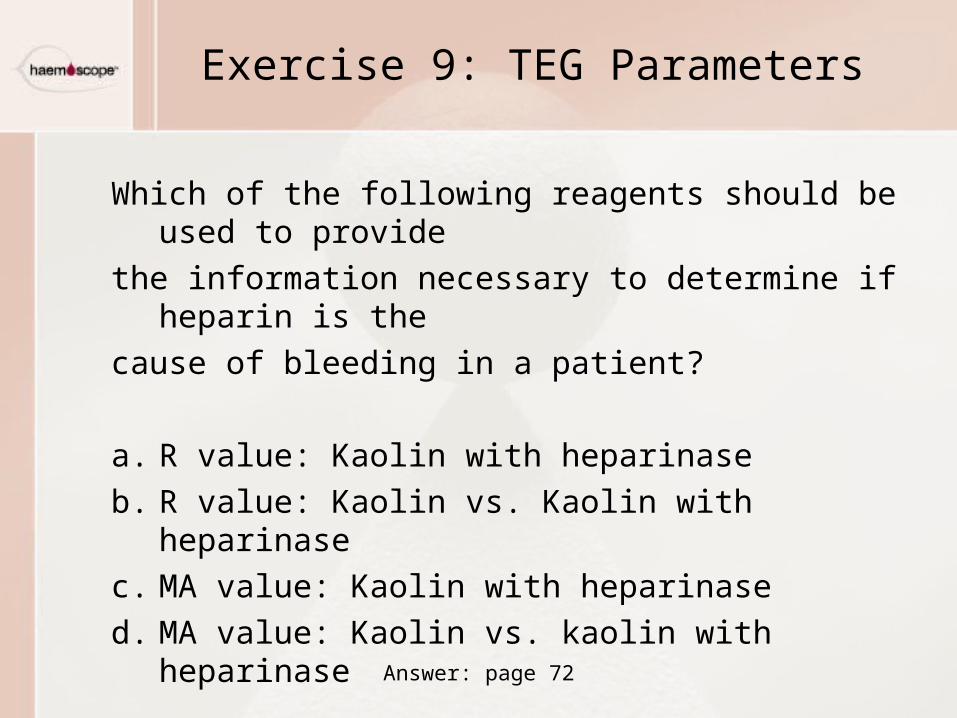
Exercise 9: TEG Parameters
Which of the following reagents should be used to provide
the information necessary to determine if heparin is the
cause of bleeding in a patient?
a. R value: Kaolin with heparinase
b. R value: Kaolin vs. Kaolin with heparinase
c. MA value: Kaolin with heparinase
d. MA value: Kaolin vs. kaolin with heparinase
Answer: page 72
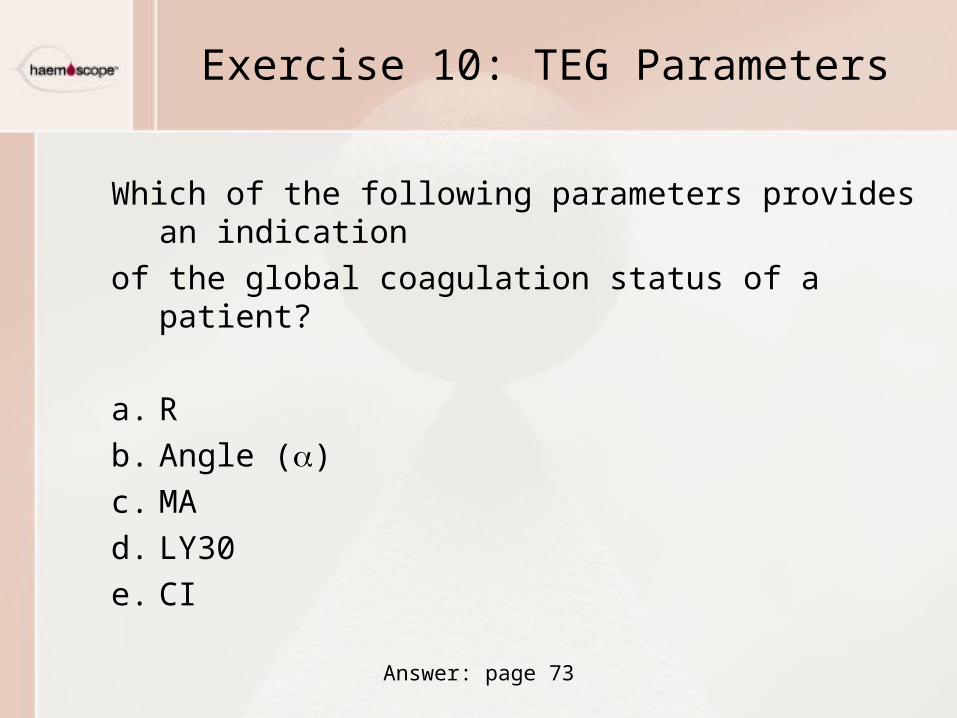
Exercise 10: TEG Parameters
Which of the following parameters provides an indication
of the global coagulation status of a patient?
a. R
b. Angle ()
c. MA
d. LY30
e. CI
Answer: page 73
Exercise 11: TEG Parameters
Which of the following statements are true regarding the
PT and aPTT tests? (select all that apply)
a. Measure coagulation factor interaction in solution
b. Measure platelet contribution to thrombin generation
c. Measure the influence of thrombin generation on platelet function
d. Use fibrin formation as an end point
Answer: page 74
Exercise 12: TEG Parameters
The TEG analyzer can monitor all phases of hemostasis
except which of the following? (select all that apply)
a. Initial fibrin formation
b. Fibrin-platelet plug construction
c. Platelet adhesion
d. Clot lysis
Answer: page 75
Answers to Exercise 1: TEG Parameters
The R value represents which of the following
phases of hemostasis?
a. Platelet adhesion
b. Activation of coagulation pathways and initial fibrin formation
c. Buildup of platelet-fibrin interactions
d. Completion of platelet-fibrin buildup
e. Clot lysis
Answers to Exercise 2: TEG Parameters
Select the TEG parameters that demonstrate
kinetic properties of clot formation. (select all that
apply)
a. R
b. Angle ()
c. MA
d. LY30
e. CI
The rate of clot strength buildup is demonstratedby which of the following TEG parameters?
a. R
b. Angle ()
c. MA
d. LY30
e. CI
Answers to Exercise 3: TEG Parameters
Answers to Exercise 4: TEG Parameters
Which of the following TEG parameters will best
demonstrate the need for coagulation factors
(i.e. FFP)?
a. R
b. Angle ()
c. MA
d. LY30
e. CI
Answers to Exercise 5: TEG Parameters
Clot strength is dependent upon which of these
hemostatic components?
a. 100% platelets
b. 80% platelets, 20% fibrin
c. 50% platelets, 50% fibrin
d. 20% platelets, 80% fibrin
e. 100% fibrin
Answers to Exercise 6: TEG Parameters
Which of the following TEG parameters
demonstrate a structural property of the clot?
(select all that apply)
a. R
b. Angle ()
c. MA (demonstrates maximum clot strength)
d. LY30 (demonstrates clot breakdown or the structural stability of the clot)
e. CI
Because the TEG is a whole blood hemostasis monitor, a low
MA demonstrating low platelet function may also influence
which of the following TEG parameters? (select all that apply)
a. R – Thrombin generation occurs mainly on the surface of platelets; therefore, a defect in platelet function may slow the rate of thrombin generation and fibrin formation.
b. Angle () – A defect in platelet function may slow the rate of formation of platelet-fibrin interactions, thereby slowing the rate of clot buildup.
c. LY30
d. CI
e. None of the above
Answers to Exercise 7: TEG Parameters
Answers to Exercise 8: TEG Parameters
Clot stability is determined by which of the following
TEG parameters?
a. R
b. Angle ()
c. MA
d. LY30
e. CI
Answers to Exercise 9: TEG Parameters
Which of the following reagents should be used to provide
the information necessary to determine if heparin is the
cause of bleeding in a patient?
a. R value: Kaolin with heparinase
b. R value: Kaolin vs. Kaolin with heparinase
c. MA value: Kaolin with heparinase
d. MA value: Kaolin vs. kaolin with heparinase
Answers to Exercise 10: TEG Parameters
Which of the following parameters provides an indication
of the global coagulation status of a patient?
a. R
b. Angle ()
c. MA
d. LY30
e. CI (Coagulation Index — a linear combination of the R, K, angle, and MA)
Answers to Exercise 11: TEG Parameters
Which of the following statements are true regarding the
PT and aPTT tests? (select all that apply)
a. Measure coagulation factor interaction in solution
b. Measure platelet contribution to thrombin generation
c. Measure the influence of thrombin generation on platelet function
d. Use fibrin formation as an end point
Answers to Exercise 12: TEG Parameters
The TEG analyzer can monitor all phases of hemostasis
except which of the following? (select all that apply)
a. Initial fibrin formation
b. Fibrin-platelet plug construction
c. Platelet adhesion — this is a vascular mediated event that occurs in vivo, but not in vitro
d. Clot lysis
End of Module 2
Basic Clinician Training
Top Related