


Languages
Pages
Legal

This is a repository copy of Reverse food logistics during the product life cycle.
White Rose Research Online URL for this paper:http://eprints.whiterose.ac.uk/85805/
Version: Accepted Version
Article:
Vlachos, IP (2014) Reverse food logistics during the product life cycle. International Journal of Integrated Supply Management, 9 (1-2). 1. 49 - 73. ISSN 1477-5360
https://doi.org/10.1504/IJISM.2014.064356
[email protected]://eprints.whiterose.ac.uk/
Reuse
Unless indicated otherwise, fulltext items are protected by copyright with all rights reserved. The copyright exception in section 29 of the Copyright, Designs and Patents Act 1988 allows the making of a single copy solely for the purpose of non-commercial research or private study within the limits of fair dealing. The publisher or other rights-holder may allow further reproduction and re-use of this version - refer to the White Rose Research Online record for this item. Where records identify the publisher as the copyright holder, users can verify any specific terms of use on the publisher’s website.
Takedown
If you consider content in White Rose Research Online to be in breach of UK law, please notify us by emailing [email protected] including the URL of the record and the reason for the withdrawal request.

1
Reverse Food Logistics during the Product Life Cycle
Ilias P. Vlachos
Northumbria University, UK Newcastle Business School Northumbria University City Campus East 1 Newcastle Upon Tyne NE1 8ST United Kingdom
Biographical Note
Dr. Ilias P. Vlachos is Reader in Logistics & Supply Chain Management at Newcastle Business School, Northumbria University, UK. He holds a Ph.D. from Cranfield University, UK.
From 2002 to early 2012, Ilias held the position of Assistant Professor at Agricultural University of Athens while he has been over 10 years adjunct professor at Hellenic Open University, Greece.
His research interests include: supply chain management, technology adoption in supply chains, human capital in supply chains, sustainability and corporate social responsibility. His research interests are focused on the food and beverages, agriculture, and energy sectors. Ilias has been also active in research projects.
Acknowledgements:
The author gratefully acknowledges the constructive comments provided by the Editor and three anonymous reviewers as well as the contribution of Ms. Maria Isabel Cardona in data collection.

2
Reverse Food Logistics during the Product Life Cycle
Abstract
This study aimed to examine reverse logistics across the food product life cycle. The literature
review of reverse logistics factors in food industry produced a set of supply chain performance
measures. Using a survey, questionnaires were sent to 200 practitioners with experience in food
supply chain operations. In total, 48 usable questionnaires were returned, resulting in 24%
response rate. The contribution of this study lies in extending the body of knowledge of reverse
food logistics during product life cycle. It offers practical advice to manage reverse food
logistics. Results indicate that customer expectations are more significant during the
introduction and growth stages. The effectiveness of the return process in the introduction stage
will determine the future of the product and companies need to manage quality problems
effectively. The paper discusses managerial implications and offers recommendations for
future research.
Keywords: Reverse Logistics, Food Industry, Product Life Cycle

3
1. Introduction
Reverse logistics is a relatively new business concept and firms tend to dedicate their assets
and resources on the forward operations, often overlooking reverse logistics operations and the
value they can generate (Bernon, Rossi and Cullen, 2010). Forward logistics strategies cannot
be applied to reverse logistics due to the enormous differences between them. Reverse logistics
are hard to forecast, require more distribution points and specialised equipment, packaging is
often damaged, pricing is vague, product life cycle is not determined, and transparency and
traceability are low (Vaidyanathan and Yadong, 2007; Pokharel and Mutha, 2009). The lack of
strategic view of reverse logistics limits even further the ability of the companies to respond
effectively to customer demands and create value for money. Petersen and Kumar (2009)
estimated return rates to be greater than 25% of total sales which accounts for approximately
$100 billion in lost sales in US and a reduction in profits by 3.8% per retailer or manufacturer.
The strong drive for reverse logistics is fuelled by current patterns of customer behaviour which
result in volatile food markets and shorter product life cycles. Beyond returns of faulty goods,
liberal returns policies shape competition in many markets including online retailing, which is
another indicator of a growing demand for reverse logistics.
The significant of reverse logistics in the food industry is evident in the requirement to provide
quality and safe food to consumers without posing any threat on human health, wellbeing and
the environment. Food industry is far from being efficient. For example, Gustavsson and
Otterdijk (2011) estimated global food losses and waste to 1.3 billion tons of food per year,
corresponding to 95-115 kg/year per capita in Europe and North America and between 6 and
11 kg/year in Sub-Saharan Africa and South/Southeast Asia. Food wastes can be attributed to
a number of factors such as excess buying, premature harvesting, inadequate labelling and
storage instructions, poor storage facilities and transportation, production errors, trial runs,
packaging defects, and wrong weights and sizes (Fotopoulos, Vlachos, and Maglaras, 2010;

4
Gustavsson and Otterdijk, 2011). Household wastes are about 14-26% of food sales in USA
and almost 27% in UK whereas the percentage of food products returns was 1.2% to 1.8% of
total sales in 2010 (Nestle, 2011; Terreri, 2010).
Despite the importance of reverse logistics in handling growing amount of food product returns
reverse operations during the product life cycle have received little attention. This study
examines reverse logistics practices across the different stages of food product life cycle. The
unit of analysis is the firm. Results from a global survey of food professionals shed light on
how reverse food logistics performance indicators (speed, flexibility, reliability, quality, and
sustainability) fluctuate during life cycle stages (introduction, growth, mature, and decline).
The research scope of this study is the food companies and it has several research and practical
contributions. The research contribution of this study is to review the relevant literature and
propose a framework of indicators to test the research objective of this study. The contribution
to practice of this study is that it offers specific managerial implications and suggestions to
manage reverse food logistics that helps reduce waste throughout the food supply chain and
increase value from returned products.
The paper is organized as follows: The next section reviews the literature on reverse logistics
in food industry with a focus on product life cycle. Research methodology is explained in
Section 3 and findings are presented in Section 4. The final Section 5 discusses conclusions,
presents managerial implications and provides recommendations for future research.
2. Literature Review
Firstly, reverse logistics in food industry is described and its main characteristics are outlined.
Then, the product life cycle in reverse food logistics is discussed. Finally, the supply chain
performance metrics are discussed.

5
2.1. Reverse Logistics in Food Industry
The major challenge for reverse logistics in the food industry relies on the perishable nature of
food and agricultural products which have short shelf life and require fast and efficient logistics
operations. Even the smallest deviation in an organoleptic characteristic may create a food
safety incident and subsequently pose a possible threat to consumer’s health. The recent
horsemeat scandal, while there was no absolute threat to consumer health, is a clear indication
that deviations from the promised food quality may harm public confidence and generate
distrust even among loyal customers. Poor reverse logistics can have devastating legal and
economic repercussions. Referring to the horsemeat scandal, on the 15th of January 2013, The
Food Safety Authority of Ireland (FSAI) announced that horse meat was found in frozen beef
burgers at several Irish and British supermarkets, including Tesco, Asda, Dunnes Stores, Lidl,
Aldi and Iceland. On the next day, Tesco dropped 360 million EUR in market value (O’Hora,
2013). Despite the fact that there was no issue of food safety, Tesco immediately withdrew all
of its burgers, both fresh and frozen, from its shelves regardless of whether they contained
traces of horse DNA. In horsemeat case, as in many other instances of food crises, reverse
logistics had to perform effectively to protect consumer trust in a moment of crisis. The
performance of reverse logistics is affected by many factors, which we found useful to review
them under five research streams: food specific features, cost, competitive advantage,
regulation and legislation, and information management.
2.1.1. Food Specific Features
Physical features of food products, such as sensitive sensory and physic-chemical properties,
determine to a large extend how reverse logistics should operate. Food features affect logistics
performance including: Shelf life time, production throughput time, temperature control
transportation, and production seasonality (Vlachos, 2003; Aramyan et al. 2006; Hsiao et al.,

6
2010). Gustavsson and Otterdijk (2011) asserted that mechanical damage or spillage during
harvest and postharvest, processing, distribution and consumption points result in food losses
and waste. Poor handling during logistics operations may result in degradation of food quality
and in turn stimulate “return avoidance” which is a critical factor in reverse logistics process
(Stock and Mulki, 2009). Firms like Nestlé have managed return avoidance by reducing waste
to 3.1% and increasing reuse or recovery to 4.2% (Nestle, 2011). Nevertheless, most companies
are far from achieving high return avoidance rates (Gustavsson and Otterdijk, 2011).
2.1.2. Cost
Coelho, Castro and Gobbo (2011) pointed out that the economic performance of reverse
logistics relies on re-capturing value from raw materials which lowers customer prices due to
recycling and decreased waste costs. Remanufactured products incur 40-60% less costs than
new products and save 85% of the energy needed to start from scratch since remanufacturing
expands the life cycle of the product (Kumar and Putnam, 2008). Optimization of resources
increases supply chain efficiency and reduces reverse logistics costs.
2.1.3. Competitive Advantage
Product return policies and processes differ among supply chain partners. For example,
retailers aim to avoid the risk of unsold goods, yet manufactures may follow liberal return
policies, resulting in high product returns (Bernon and Cullen, 2007; Stock and Mulki, 2009).
Lower product returns contribute directly to competitive advantage since they incur lower
reverse logistics costs. Further, supply chain collaboration contributes to overall supply chain
performance and reverse logistics cannot be an exemption (Karalis and Vlachos, 2004). For
example, H-E-B Grocery Co. reported 50% reduction in unsold products by implementing joint
policies such as “Store Damage Allowance” and “Unsaleables Recovery Program” (Karolefski,
7
2007). Supply chain collaboration is one effective way in reducing logistics costs by making
supply chain partners to join forces in finding and removing waste across the supply chain. For
example, retailers working closely with food manufactures can remove the damaged unit from
the case, and then repack and sell the rest of it (Karolefski, 2007).
2.1.4. Regulation and Legislation
CIAA (2011) reported that the competitiveness of EU food industry is highly influenced by
strict regulations. As a result, legislative factors force companies to adopt reverse logistics
strategies in order to become more sustainable (Nikolaou, Evangelinos and Allan, 2011).
A business-wise regulatory environment would help food companies to deal with unsustainable
business practices, food security, and fair trade. Olugu, Wong and Shaharoun (2011) developed
of a set of holistic measures for evaluating the performance of the automobile green supply
chain and suggested that Different legislations and regulations in most developed countries
such as the European community have made the manufacturers accountable for their products,
throughout their entire product life cycle and beyond. Environmental initiatives include
recycling, reuse, and composting activities. Companies are also motivated to form alliances
with food manufactures to collect defective or returned packaging and transform it into new
products.
.
8
2.1.5. Information Management
The management of information flows in one of the key successful drivers in forward logistics
as well as in reverse logistics operations (Georgiadis, Vlachos, and Iakovou, 2005). Terreri
(2010) argued that poor data measurement and lack of appropriate capturing, using, and
analysing information are the major concerns during the customer return activity. The
implementation of information technology and applications and their integration with reverse
logistics operations contribute significantly in reducing product returns (Vlachos, 2002; Karim,
Smith and Halgamuge, 2008). Karolefski (2007) pointed out that data coding in food labels
constitutes another problem since customers do not fully understand well food dates and
storage information. Confusion on data labels, combined with modern consumer lifestyles
generate about three million tons of food and drink wasted by consumers before ever being
cooked or served (WRAP, 2011). Data and information on food labels can facilitate reverse
processes and reduce waste before and after consumption.
2.1.6. Logistics System
The design or reverse logistics operations depend on the return rates (Stock and Mulki, 2009).
Low return rates force companies to use forward logistics facilities in order to serve reverse
operations. On contrast, high return rates require the development of specialised facilities for
the reverse logistics operations. Srivastava and Srivastava (2006) pointed out that the decisions
about the logistics facilities i.e. warehouse and transportation are based on a number of factors
such as estimated returns, costs, competitors’ behaviour and operations strategies. Capacity
management becomes even more complex as regulatory and consumer demands are becoming
part of the reverse logistics equation.
9
Doughton (2008) pointed out that the sustainable impact of reverse logistics is highly linked to
the design of the distribution networks. A centralized reverse logistics facility may include
benefits such as (i) the elimination of landfill costs, (ii) reduction of carbon footprint by
shipping to regional distribution return centers, (iii) use of economies of scale by maximizing
recovery and (iv) the optimization of other activities such as repacking and refurbishing,
centralized collection of product return data.
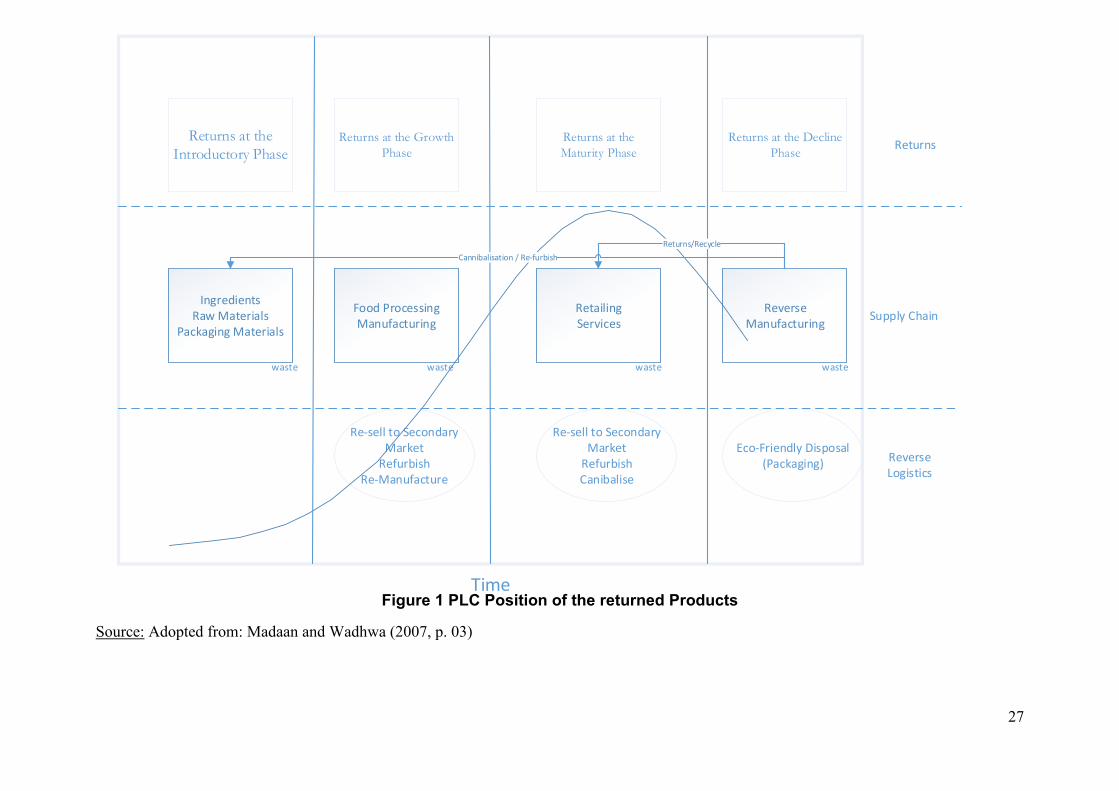
2.2. Product Life Cycle (PLC) in Reverse Food Supply Chains
Madaan and Wadhwa (2007) proposed PLC analysis as a tool to design reverse logistics
operations and extract value from returned prodcuts. Figure 1 illustrates the general
classification of reverse logistics strategies per PLC stage.
Van der Vorst, Tromp and Van der Zee (2009) sustained that food quality management affects
the supply chain performance. Food quality elements are affected by many logistics functions
such as packaging, loading techniques and handling, temperature-controlled transportation and
warehouses. Referring to the food industry, Kumar and Nigmatullin (2011) argued supply
chain performance is dependent on how effectively uncertainty is managed at three levels of
the supply chain: (i) the retailer, which is influenced by demographic changes, competitive
forces and inflation; (ii) the distributor and manufacturer, which are affected by bullwhip effect,
and (iii) customer demand, which can have unpredictable patterns.
De Koster, De Brito and Van de Vendel (2002) suggested that one of the most common
practices in the food sector is using a central distribution centre to receive product returns. A
centralised supply chain design provides suppliers and retailers with a better visibility and
control of return products, thus reducing wastes (Terreri, 2010). Kumar and Putnam (2008)
considered that reverse logistics reserve special attention when products reach the end of their
life because a product with poor quality has value to extract and the reverse logistics add cost

10
than create value (Bernon, Rossi and Cullen, 2010). Food returns from customers to retailers
create higher recovery rates for retailers than the rest supply chain members (Stock and Mulki,
2009). As a result retailers are in better position to govern the reverse logistics operations for
all supply chain members.
2.3. Supply chain performance metrics
Improving supply chain performance has become a challenge for companies aiming to sustain
their competitive advantages (Cai et al., 2009; Estampe et al., 2013). Performance measurement
has evolved during the last decades from accounting and budgeting variables to non-financial
measures such as competition, supplier evaluation, and customer satisfaction (Chae, 2009).
Slack, Chambers, and Johnston (2001) proposed five performance objectives: quality, speed,
dependability, flexibility, and cost. Two widely used performance measurement models are the
supply chain operations reference (SCOR) and the balanced score card (BSC). Bigliardi and
Bottani (2010) applied the BSC model for measuring performance of food company supply
chains using both financial and nonfinancial metrics. Since its introduction in 1996, the SCOR
model has been increasingly adopted by companies to improve their supply chains (Huang et
al. 2005). The SCOR model emphasises the operational process and includes customer
interactions, physical transactions, and market interactions. Blackburn et al. (2004) examined
the reverse supply chains for commercial returns and proposed performance metrics for reverse
logistics, giving emphasis to “time value” of product returns.
Responsive strategies
Richey et al., (2004) argued that responsive firms fix problems proactively and create supply
chain savings by reducing product returns and integrating backward and forward logistics

11
services. Olugu, Wong and Shaharoun (2011) included responsiveness in their supply chain
performance metrics. Aramyan et al. (2007) argued that responsive strategies can eeffectively
manage issues related to product lateness, lead times, and transportation mistakes.
Speed
In general, food products have short product life cycles, which make lead times a critical
parameter of reverse logistics operations (Vaidyanathan and Yadong, 2007). Guide et al. (2006)
argued that delays on reverse logistics can have multiple repercussions such as: making reuse
impossible, reducing returned product value, and generate inventory costs. Bernon, Rossi and
Cullen (2010) suggested that network configuration should be a trade-off between speed and
cost efficiency.
Flexibility
Gonzalez-Benito (2010) defined flexibility as the business ability to change business
operations in order to meet customer expectations including the development of innovative
ways of reverse logistics operations. Flexibility poses a significant challenge for food
companies, especially when one considers the unpredictability of the food business
environment. Madaan and Wadhwa (2007) asserted that In order to develop green process as a
competitive initiative, various elements have been proposed including the calculation of
ecological impacts factor i.e. Green Impact Factor GIF for reverse logistics system. Ecological
impact should be calculated in terms of their resource conservation factor, waste emission
factor, and energy conservation factor (Madaan and Wadhwa, 2007). Wadhwa, Madaan and
Verma (2009) proposed a semi or partially flexible decision process model that facilitates
flexible decision and information sharing (DIS) functions in product returns, which can be
encapsulated by Reverse Enterprise System (RES) to improve firm profitability and system
performance.

12
Food Quality and Reliability
Aramyan et al. (2007) argued that product quality includes all physical attributes dictated by
socio-economical factors, government regulations and consumer behaviour. Gustavsson and
Otterdijk (2011) pointed out that consumers buy products out of appearance and hedonic
attributes as long as it is safe and tastes good. Aramyan et al. (2007) argued that manufacturing
practices strongly impact the relation between quality and management performance, thus, in
turn, they also influence reverse logistics practices as well as the level of product returns.
Sustainability
Despite the various definitions of sustainability, there is a widely acceptance of the ‘triple
bottom line’ of sustainability: economic, environmental and social dimensions of sustainability
(Sarkis, Helms, and Hervani, 2010). Nikolaou, Evangelinos and Allan (2011) argued that firm
performance is related to economic sustainability and offered a number of sustainability
indicators such as: sales of reuse, resalable and recyclable, cost of returned materials, and
subsidies associated to reverse logistics. Coelho, Castro and Gobbo (2011) asserted that the
environmental effect of a reverse logistics system can be evaluated using metrics such as:
energy use, CO2 emissions, water pollution, and urban traffic congestion perspective. From a
social view of reverse logistics, Sarkis, Helms, and Hervani (2010) reviewed social
responsibility studies in reverse logistics and proposed a categorisation of indicators including:
internal human resources, employment stability, employment practices, health and safety, and
human capital of external population. Nikolaou, Evangelinos and Allan (2011) suggested
health and safety, human capital, community capital and stakeholder as KPIs of labour
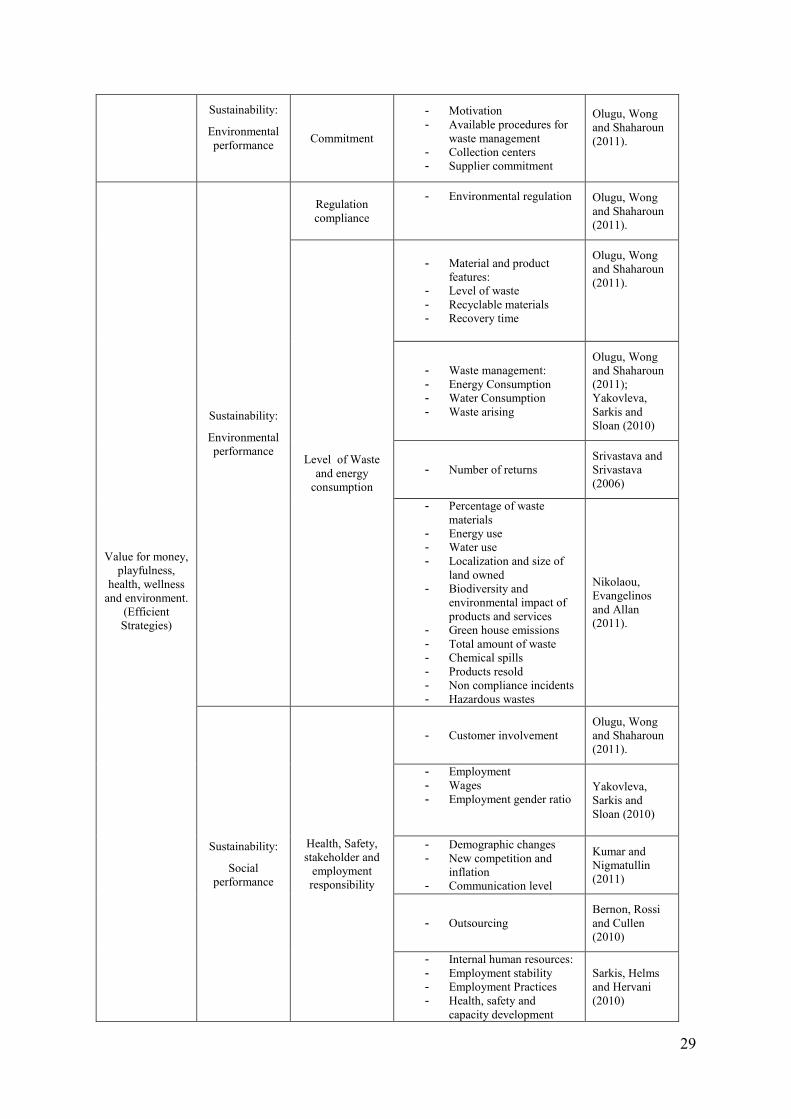
indicators. Table 1 summarises the KPIs listed in the literature review.
13
-------------- Insert Table 1 ---------------- about here
3. Survey Methodology
3.1. Research Design
A survey was conducted to examine the impact of reverse logistics to supply chain performance
moderated by product life-cycle. To build the target group for the survey, first, we randomly
selected food professionals listed in various social and professional groups. We targeted food
managers working on different business functions such as: distribution, purchasing, sales, and
supply chain. We sent a link to the online questionnaire to these managers along with a
personalized message with explaining the aim of the study. The survey took place in mid-2012.
The questionnaire was sent to 200 practitioners and, in total, 48 usable questionnaires were
returned, resulting in 24% response rate. Statistically, a sample size of at least 30 units is
considered as "large sample", thus 48 responses were adequate for the type of data analysis
conducted in this study (Hogg and Tanis, 2013). Table 2 presents sample distribution by the
industry and supply chain.
Non-response bias was assessed. A large number of non-responders may cause bias in the risk
estimation due to confounding factors associated with the tendency to not respond. Many
reasons can contribute to non-participation among respondents, yet not all of these reasons may
contribute to response bias. Questions that address a sensitive subject (e.g., financial
performance) may increase the potential for response bias. Therefore, this study avoided
collecting sensitive data and information. Further, anonymous surveys, such as this one, may
partially assist in minimising non-responses (Marquis, Marquis, & Polich, 1986). In this study,
there was adequate coverage from North America, South America, Asia, Western Europe and
Central America and Australia but other important regions, in terms of business and economic

14
issues like Eastern Europe, and South Africa were not covered. The small sample size was the
reason of under-covering some regions, yet developed regions were adequately covered.
Finally, respondents may not trust the value of the study. For this reason, a cover letter
explaining the value to all contacted respondents was sent. All of these issues were considered
when designing the survey to minimise the systematic non-response bias. After data collection,
to ensure that the respondents were comparable to non-respondents, analyses of variances were
conducted between these groups. The non-response bias was assessed by comparing
demographic variables (region, company size) among non-respondents, early respondents and
late respondents (Armstrong and Overton, 1977). No significant differences were found.
-------------- Insert Table 2 about here ----------------
3.1. Sample Demographics
Regarding the professional profile of the participants, 32% of them were on operations, 14%
on logistics, 11% on various managerial positions and 24% on Research and Development
(R&D). Regarding the type of companies, they included distribution (34%), retailing (27%)
and manufacturing (21%). 42.55% of companies operate in North America, followed by 8.51%
in South America, 6.38% in Asia, 4.26% in Western Europe and 6.38% in Central America
and Australia. 31.82% of the participating companies employed less than 100 employees,
20.45% more than 500 and 13.64% between 100 and 500 personnel. The analysis of company
size vs. job functions and areas of operation delineate a higher percentage of operation
functions from small companies with less than 50 employees, especially in North America.
However, the number of operation functions among company size categories is constant,
followed by managerial functions in companies with less than 50 and managerial and logistics
functions in companies with more than 500 employees. Other categories such as quality, sales
15
and distribution, distributed in other regions like South America, show a particular connotation
of companies smaller than 500 people.
4. Findings
4.1. Forward to Reverse Logistics Comparison
We run a 2-tailed, paired samples test between forward and reverse logistics across the seven
performance measures (Table 3). There were significant differences in all three dimensions of
sustainability (economical, environmental, and social sustainability) (p<0.05). There was no
difference between forward logistics and reverse logistics in the rest performance indications
at 5% confidence interval, yet flexibility and reliability showed significant differences at 1%
level. This finding supports the argument that reverse logistics operations do not receive the
required attention from managers who tend to focus on forward chains (Vaidyanathan and
Yadong (2007).
-----insert Table 3 about here--------------
4.2. KPI in reverse food logistics
Participants were asked to choose the five most important KPIs from a list of indicators that
were found in the literature (Table 1). Results are summarized in Table 4. Customer satisfaction
(20.12%) and product compliance in terms of quality and safety (15.38%) received the higher
scores. Waste and energy consumption (10.65%) as well as supply chain and recycling costs
(10.06%) were also ranked high in the list of key performance indicators for food reverse
operations. Economic performance was found a significant performance goal for the reverse
flow, yet asset recovery (2.37%) received a lower score while social responsibility received the

16
least score (0.01%). This finding was also confirmed by the analysis which associated each
KPI with performance objectives for reverse logistics and the following ranking was obtained:
1. Customer Satisfaction (20.12%) - Flexibility
2. Product compliance (15.38%) – Quality and Reliability
3. Level of waste and energy consumption (10.65%)- Environment
4. Supply chain and recycling costs (10.06%) – Economic performance
5. Lead times (7.10%) – Speed
6. Product information and labelling (7.10%) - Quality and Reliability
--------------Insert Table 4 about here---------------------------
4.3. Reverse Logistics and PLC
In order to evaluate reverse logistics according to product life cycle, respondents were offered
with a common terminology. Each stage of the product life-cycle was described depending on
the volume of returns and sales as follows: (a) Introduction Stage: sales volume start low and
return volume is also low; (b) Growth Stage: Sales increase and customer returns increase as
well; (c) Maturity Stage: Demand starts to level off and customer returns continue to come in;
(d) Decline Stage: New product models start to lead the market and sales are almost null. We
run the Kruskal-Wallis Test and the Jonckheere–Terpstra test for both Monte Carlo and found
asymptotic distributions with no significant differences between the life cycle stages.
Results confirm the relevance of quality and reliability, especially during the introduction and
growth phases of the PLC. The maturity and decline stages on the other hand, were
differentiated by sustainability indicators, especially economic performance, with an

17
interesting resilience of social and environmental performance in the decline phase (Table 5).
Specifically, the performance objectives of reverse logistics during introduction stage are
flexibility (71%) followed by quality and reliability (35%) and speed (31%). During growth
stage, it is quality and reliability (38%) which is more important food reverse logistics
performance objective, followed by sustainability (31%), and flexibility (29%). During
maturity stage companies turn their attention to cost (54%) and speed (50%). Finally, during
decline stage sustainability (69%) becomes important followed by cost (32%) and quality and
reliability (19%).
--------------Insert Table 5 about here---------------------------
5. Discussion and Conclusions
5.1. Discussion
Reverse logistics is a relatively new business concept for most firms whose primary focus is
getting product to the end consumer. However, companies are turning to reverse logistics to
improve the bottom line since return rates are estimated to 25% of total sales which accounts
for approximately $100 billion in lost sales in US (Petersen and Kumar, 2009). In the food and
beverage sector, the majority of product returns are unsaleables like damaged and expired
products. However, food companies are realizing the importance of reverse logistics when they
are faced with a product recall, especially when it attracts public attention and regulatory
oversight. For example, the horsemeat scandal was the cause for food retailers loose significant
amounts in market value. Reverse logistics had to perform effectively to protect consumer
trust in a moment of crisis. Despite the importance of reverse logistics, reverse operations
during the product life cycle have received little attention. This study contributes by proposing
a framework of reverse logistics indicators across the product life cycle. Results from a global
18
survey of food professionals shed light on how reverse food logistics performance indicators
(speed, flexibility, reliability, quality, and sustainability) fluctuate during life cycle stages
(introduction, growth, mature, and decline). This study examined Dairy Products (18.58%),
Bakery (15.93%), Frozen Food (10.62%), Snacks (17.70%), Meat (16.81%), and other food
categories. The research framework is generic enough for the food industry yet due to the nature
of different food products it may needs adaptations when applied to specific food categories
like fresh produce, frozen food, or dietary food. Specifically, the performance of food reverse
logistics is affected by many factors, which were reviewed under five research streams: food
specific features, cost, competitive advantage, regulation and legislation, and information
management. Physical features of food products, which determine to a large extend how
reverse logistics should operate, are not the same across different food categories. For example,
shelf life time and production seasonality vary considerably between dairy products and frozen
food. However, all food products go through the same stages of product life cycle, which
include: Introduction Stage, characterised by low sales and low return rates; (b) Growth Stage,
characterised by increasing sales and customer returns; (c) Maturity Stage, characterised by
steady demand levels as well as customer returns; (d) Decline Stage, characterised by new
products entering the market resulting in decline sales of existing products.
Although performance has been extensively studied in forward logistics, there is scarce
evidence about performance indicators across the product life cycle in reverse logistics
(Tibben-Lembke, 2002; Madaan and Wadhwa, 2007; Kumar and Nigmatullin, 2011; Van der
Vorst, Tromp and Van der Zee, 2009; Terreri, 2010; Bernon, Rossi and Cullen, 2010). This
study contributes by examining the reverse logistics performance. Anecdotal evidence in the
food sector report environmental and economic repercussions of food product recalls. To our
knowledge, this is the first study to report the key reverse logistics indicators across the
19
different stages of food life cycle. We discuss the key reverse logistics indicators empathising
how they are applied across the different stages of food life cycle.
Speed. Speed is critical to products with short shelf life. Products that deteriorate easily
and lose their physical, chemical and/or microbiological attributes need fast reverse
logistics operations. Survey results showed that during the maturity phase speed shows a
higher effect than in the other stages. Products with short shelf-life time need product
design to occur in a fact pace following by similar marketing activities.
Flexibility. Survey results indicate that flexibility is critical especially during the first two
stages of the product life-cycle. During growth stage, flexibility allows companies to
differentiate their products from competitive ones since a growing market attracts more
competition (Olugu, Wong, and Shaharoun, 2011). Bai and Sarkis (2013) argued that an
effective way to manage uncertainty and variance in operational and organizational reverse
logistic systems is by introducing greater flexibility. Bai and Sarkis (2013) proposed two
types of reverse logistics flexibility: operational flexibility, which includes a variety of
dimensions such as product and volume flexibility across various reverse logistics
operational functions and strategic flexibility, which was categorized into network and
organizational design flexibility dimensions. Wadhwa, Madaan and Verma (2009, p.15)
claimed that “with an adequate integration of flexible product recovery activities, in an
economic or environmental context, organizations will be able to notice a double effect
with their reverse supply chain”.
Quality/Reliability. Quality varies during the different PLC stages and is more critical in
the introduction and growth stages. The sooner a company identifies quality problems, the
sooner they can be dealt with. Therefore, an effective logistics system should include
quality monitoring and evaluation as early as from the product design phase (Karim, Smith,
and Halgamuge, 2008). Some organizations already have set up a mechanism in place to

20
improve customer service processes. Reverse logistics cannot work in isolation from
forward logistics and customer service. The reverse logistics mangers can gather comments
and feedback from customers in order to improve product design and functionality as early
as possible. Companies can use technology to gather information in real time from
customers who contact customer service and in this way companies could fix quality issues
early in the product life cycle. The purpose of quality and reliability is to reduce product
returns rather than manage them more efficiently. However, in cases of food product
recalls, customers need to be sure that the fault products have been removed from retailers’
shelves. In this way, customers feel confident and reliable for the companies and brands
they are loyal to.
Sustainability. Findings demonstrate a higher impact of economic performance over
environmental and social factors. For many companies, reverse logistics incur high
operation costs. To effectively reduce costs and achieve better customer service, reverse
logistics should be included in the sustainable strategy. Referring to sustainable reverse
logistics, companies need to seek ways to differentiate themselves from competitors and
thus possess competitive advantage. Since all logistics activities incur costs, the economic
sustainability has become a priority over the environmental and social dimensions of
sustainability (Mollenkopf, Russo, and Frankel, 2007). As product mature to the final stage
of their life cycle, branded products benefit when their product life is lengthened to an
extend that makes them sustainable. Sarkis, Helms and Hervani (2010, p.347) argued that
“Recycling and reuse initiatives help to reclaim recyclable materials, therefore generating
additional revenue streams while simultaneously reducing the level of cost of waste
disposal”.

21
5.2. Limitations and recommendations for future research
One limitation of the findings is the use of self-report questionnaires to collect data on all
measures. This limits our ability to draw conclusions about the causal nature of the
relationships. Another limitation of the study is its focus on the reverse logistics. We suggest
further research to clarify the causal relationship between reverse logistics and product-life-
cycle in other products except food. We used managers’ perceptions about the reverse logistics
concepts and measures we examined. Future research can examined the extent to which
individual perceptions match up with objective organizational reports.
6. References
Aramyan, L., Lansink, A., Vorst, J., and Kooten, O. (2007) ‘Performance measurement in agri-
food supply chains: a case study’, Supply Chain Management: An International Journal, Vol.
12, No. 4, pp. 304-315.
Aramyan, L., Ondersteijn, C., Van Kooten, O., and Lansink, A. (2006) ‘Performance Indicators
in Agri-Food Production Chains’. In: Ondersteijn, C.J. Wijnands, Jo H. M. and Huirne, R. B.
M. (eds.). Quantifying the Agri-food Supply Chain. Dordrecht: Springer, pp. 47-64.
Bai, C. and Sarkis, J., (2013) Flexibility in reverse logistics: a framework and evaluation
approach, Journal of Cleaner Production, Vol. 47, pp. 306-318.
Bernon, M., and Cullen, J. (2007) ‘An integrated approach to managing reverse logistics’,
International Journal of Logistics: Research and Applications, Vol. 10, No. 1, p.p. 41-56.
Bernon, M., Rossi, S. and Cullen, J. (2010) ‘Retail reverse logistics: a call and grounding
framework for research’, International Journal of Physical Distribution & Logistics
Management, Vol. 41, No. 5, pp. 484-510.
Bigliardi, B. and Bottani, E., (2010). Performance measurement in the food supply chain: a
balanced scorecard approach, Facilities, Vol. 28, No. 5/6, pp. 249-260.

22
Blackburn, J.D., Guide, V.D., Souza, G., and Wassenhove, L.V. (2004) ‘Reverse supply chains
for commercial returns, California Management Review, Vol. 46, No. 2, pp. 6-22.
Cai, J., Liu, X., Xiao, Z. & Liu, J., (2009) Improving supply chain performance management:
A systematic approach to analyzing iterative KPI accomplishment, Decision Support Systems,
Vol. 46, No. 2, pp. 512-521
Cardona, M. I. G. (2012) Performance objectives vs product lifecycle: An assessment applied
to identify the Relevant reverse logistics variables and trade-offs in the food industry, The
University of Liverpool, Master of science in operations and supply chain management.
Chae, B., (2009) Developing key performance indicators for supply chain: an industry
perspective, Supply Chain Management: An International Journal, Vol. 14, No. 6, pp. 422 -
428
CIAA (2011) ‘Food Drink Europe Competitiveness Report [Online].:
http://www.fooddrinkeurope.eu/uploads/press-
releases_documents/FoodDrinkEurope_Competitiveness_Report_2011.pdf (Accessed: 28
January 2013).
Coelho, T. M., Castro, R. and Gobbo, J. A. (2011) ‘PET Containers in Brazil: Opportunities
and challenges of a logistics model for post-consumer waste recycling’, Resources,
conservation and recycling, Vol. 55, No. 3, pp. 291-299.
De Koster, R., De Brito, M., and Van de Vendel, M. (2002) ‘Return handling: an exploratory
study with nine retailer warehouses’, International Journal of Retail & Distribution
Management, Vol. 30, No. 8, pp. 407-421.
Doughton, M. (2008) ‘Incorporate reverse logistics into your sustainability goals’, Food
Logistics, p.20.
Estampe, D., Lamouri, S., Paris, J.L. & Djelloul, S.B., (2013) A framework for analysing
supply chain performance evaluation models, International Journal of Production Economics,
Vol. 142, No 2, pp. 247–258.
Fotopoulos, C., Vlachos, I. P. and Maglaras, G. (2010) ‘The process and critical success factors
of evolving from product excellence to market excellence: the case of Mastiha in Chios,
Greece’, In: Market Orientation (Food and Agricultural Marketing), Ed(s), Adam Lindgreen,
Martin Hingley, David Harness, Paul Custance, UK: Gower, pp. 307-324.

23
Georgiadis, P., Vlachos, D., and Iakovou, E. (2005) ‘A system dynamics modeling framework
for the strategic supply chain management of food chains’, Journal of Food Engineering, Vol.
70, No. 3, pp.351-364.
González-Benito, J. (2010) ‘Supply strategy and business performance: an analysis based on
the relative importance assigned to generic competitive objectives’, International Journal of
Operations & Production Management, Vol. 30, No. 8, pp. 774-797.
Guide, V.D., Souza, G., Wassenhove, L.V and Blackburn, J.D. (2006) ‘Time value of
Commercial Product Returns’, Management Science, Vol. 52, No. 8, pp. 1200-1214.
Gustavsson, J., and Otterdijk, R. (2011) ‘Global food losses and food waste: extent, causes and
prevention’, International Congress Save Food!, 12-18 May, Düseldorf, Germany. Rome:
Food and Agriculture Organization of the United Nations, pp. 1-29.
Hobbs, J. E. (2006) ‘Liability and traceability in agri-food supply chains’. In: Ondersteijn, C.J.
Wijnands, Jo H. M. and Huirne, R. B. M. (Eds.). Quantifying the Agri-food Supply Chain.
Dordrecht: Springer, pp. 87-102.
Hogg, R. V. and Tanis, E., (2013) ‘Probability and Statistical Inference’, 8th ed., Pearson,
London.
Hsiao, H.I., Kemp, R.G.M., Van der Vorst, J.G.A.J. and Omta, S.W.F. (2010) ‘A classification
of logistic outsourcing levels and their impact on service performance: Evidence from the food
processing industry’, International Journal of Production Economics, Vol. 124, No. 1, pp. 75-
86.
Huang, S. H. , Sheoran, S. K. & Keskar, H., (2005). Computer-assisted supply chain
configuration based on supply chain operations reference (SCOR) model, Computers &
Industrial Engineering, Vol. 48, No. 2, pp. 377-394.
Karalis, V., and Vlachos, I. P., (2004) ‘Supplier-Retailer Collaboration in Food Networks: A
Typology and Examination of Moderating Factors’, in “Dynamics in Chains and Networks”,
Ed(s) Bremmers H. J., Omta S.W.F., Trienekens, J.H., Wubben, E.F.M. (edrts) Wageningen
Academic Publishers, The Netherlands, pp. 280-287.
Karim, M.A., Smith, A.J.R., and Halgamuge, S. (2008) ‘Empirical relationships between some
manufacturing practices and performance’, International Journal of Production Research, Vol.
46, No. 13, pp. 3583-3613.

24
Karolefski, J., (2007) ‘Cracking Down On Unsealables’ Food Logistics, February 12, 2007,
www.foodlogistics.com/article/10316057/cracking-down-on-unsealables (Accessed: 25
January 2013)
Kumar, S., and Nigmatullin, A. (2011) ‘A system dynamics analysis of food supply chains –
Case study with non-perishable products’, Simulation modeling Practice and theory, Vol.19,
No. 10, pp. 2151-2168.
Kumar, S., and Putnam, V. (2008) ‘Cradle to cradle: Reverse logistics strategies and
opportunities across three industry sectors’, International Journal of Production Economics,
Vol. 115, No. 1, pp. 305-315.
Madaan, J., and Wadhwa, S. (2007) ‘Flexible Process Planning for sustainable decisions in
reverse logistics system’, Global Journal of Flexible Systems Management, Vol. 8, No. 4, pp.
1-8.
Mollenkopf, D., Russo, I., and Frankel, R. (2007) ‘The returns management process in supply
chain strategy’, International Journal of Physical Distribution & Logistics Management, Vol.
37, No. 7, pp. 568-592.
Nestle (2011) Waste and recovery of by-products.
http://www.nestle.com/CSV/WaterAndEnvironmentalSustainability/WasteAndRecovery/Pag
es/WasteAndRecovery.aspx (Accessed: 28 March 2013).
Nikolaou, I.E., Evangelinos, K., and Allan, S. (2011) ‘A reverse logistics social responsibility
evaluation framework based on the triple bottom line approach’, Journal of Cleaner
Production, pp. 1-30.
O’Hora, A. (2013) ‘Horse meat discovery knocks £300m off the value of Tesco shares’,
Independent, The, 16 January 2013, http://www.independent.ie/sport/other-sports/horse-meat-
discovery-knocks-300m-off-the-value-of-tesco-shares-28959295.html (Accessed: 25 July
2013).
Olugu, E.U., Wong, KY. and Shaharoun, A.M. (2011) ‘Development of key performance
measures for the automobile green supply chain’, Resources, Conservation and Recycling, Vol.
55, No. 6, pp. 567-579.
Petersen, J.A., and Kumar, V. (2009) ‘Are product returns a necessary evil? Antecedents and
consequences’, Journal of Marketing, Vol. 73, No. 3, pp. 35-51.

25
Pokharel, S. and Mutha, A. (2009) ‘Perspectives in reverse logistics: A review’, Resources,
conservation and recycling, Vol. 53, No. 4, pp. 175-182.
Richey, R.G., Daugherty, P., Genchev, S., and Autry, C. (2004) ‘Reverse Logistics: the impact
of timing and resources’, Journal of Business Logistics, Vol. 25, No. 2, pp. 229-250.
Sarkis, J., Helms, M., and Hervani, A. (2010) ‘Reverse logistics and social sustainability’,
Corporate Social Responsibility and Environmental Management, Vol. 17, No. 6, pp. 337-354.
Slack, N., Chambers, S., and Johnston, B., (2001) Operations Management, Harlow: Financial
Times Prentice Hall.
Srivastava, S., and Srivastava, R. (2006) ‘Managing product returns for reverse logistics’,
International Journal of Physical Distribution & Logisitcs Management, Vol. 36, No. 7, pp.
524-546.
Stock, J., and Mulki, J.P. (2009) ‘Product returns processing: an examination of practices of
manufacturers, wholesalers/distributors, and retailers’, Journal of Business Logistics, Vol. 30,
No. 1, pp. 33-62.
Terreri, A. (2010) ‘Reverse logistics moves forward’, Food Logistics, January/February issue
[Online]. Available from: http://www.foodlogistics.com/print/Food-Logistics/Reverse-
Logistics-Moves-Forward/1$3458 (Accessed: 25 January 2013).
Tibben-Lembke, R. (2002) ‘Life after death: reverse logistics and the product life cycle’,
International Journal of Physical Distribution & Logistics Management, Vol. 32, No. 3, pp.
223-244.
Vaidyanathan, J., and Yadong, L. (2007) ‘Creating competitive advantages through new value
creation: a reverse logistics perspective’, Academy of Management Perspectives, Vol. 21, No.
2, pp. 56-73.
Van der Vorst, J., Tromp, S.O., and Van der Zee, D. J., (2009) ‘Simulation modeling for food
supply chain redesing, integrated decisión making on product quality, sustainability and
logistics’, International Journal of Production Research, Vol. 47, No. 23, pp. 6611-6631.
Vlachos, I. (2003) ‘Adoption of electronic data interchange by agribusiness organizations’,
Journal of International Food and Agribusiness Marketing, Vol. 15, No. 3, pp. 19-42
26
Vlachos, I. P. (2002) ‘Business-To-Business E-Commerce: An Innovative Tool For Food Chain
Management’, 1st Pan-Hellenic Conference of Hellenic Association of Information and
Communication Technology in Agriculture, Food and Environment, pp. 37-44.
Wadhwa, S., Madaan, J., and Verma, M. (2009) ‘Flexibility focused decision and information
sharing model for product recovery system’, Global Journal of Flexible Systems Management,
Vol. 10, No. 3, pp. 15-22.
WRAP - Waste & Resources Action Programme (2011) ‘Consumer insight: date labels and
storage guidance’.
http://www.wrap.org.uk/downloads/Technical_report_dates_final.fa35a387.11175.pdf
(Accessed: 27 February 2013).
Yakovleva, N., Sarkis, J., and Sloan, T. (2010) ‘Sustainable benchmarking of supply chains:
the case study of the food industry’ [Online]. Available from:
http://faculty.uml.edu/tsloan/papers/YakovlevaSarkisSloan-IJPR-Benchmarking-2010.pdf
(Accessed: 27 February 2013).
Armstrong, J. S., and Overton, T. S. (1977) Estimating nonresponse bias in mail surveys.
Journal of Marketing Research, Vol. 14, No. 3, pp. 396-402.
Marquis, K. H.; Marquis, S., and Polich, J. M. (1986) Response Bias and Reliability in
Sensitive Topic Surveys, Journal of the American Statistical Association, Vol. 81, pp. 381-
389.
Javier González-Benito (2010) Supply strategy and business performance: An analysis based
on the relative importance assigned to generic competitive objectives, International Journal of
Operations & Production Management, Vol. 30, No. 8, pp. 774 – 797.
Coelho, T. M., Castro, R. and Gobbo, J. A. (2011) ‘PET Containers in Brazil: Opportunities
and challenges of a logistics model for post-consumer waste recycling’, Resources,
conservation and recycling, Vol. 55, No. 3, pp. 291-299.
27
Figure 1 PLC Position of the returned Products
Source: Adopted from: Madaan and Wadhwa (2007, p. 03)
Returns at the
Introductory Phase
Returns at the Growth
Phase
Returns at the
Maturity Phase
Returns at the Decline
Phase
Ingredients
Raw Materials
Packaging Materials
Food Processing
Manufacturing
Retailing
Services
Reverse
Manufacturing
Eco-Friendly Disposal
(Packaging)
Re-sell to Secondary
Market
Refurbish
Canibalise
Re-sell to Secondary
Market
Refurbish
Re-Manufacture
Cannibalisation / Re-furbish
Returns/Recycle
waste waste waste waste
Time
Returns
Supply Chain
Reverse
Logistics

28
Table 1 Performance Objectives and KPIs for Reverse Logistics in the Food Industry
Customer
Trends PO KPI’S Sources
Value for money, playfulness,
health, wellness and environment.
(Efficient Strategies)
Sustainability
Economic performance
Supply chain and recycling costs
Greening costs:
- Environmental compliance
- Green materials
Recycling costs:
- Product recovery - Processing - Segregation - Disposal
Supply chain costs:
- Delivery - Inventory - Information sharing - Ordering
Olugu, Wong and Shaharoun (2011).
Costs of used and returned materials
Nikolaou, Evangelinos and Allan (2011).
Total Cost of returns
Cost of quality:
- Prevention costs - Appraisal costs - Internal failure costs - External failure costs
Overall return operations cost:
- Transport, storage, repair, repackaging.
- Cost reporting and control
Bernon, Rossi and Cullen (2010)
Asset recovery - Labor productivity - Market concentration - Import dependency
Yakovleva, Sarkis and Sloan (2010)
- Net sales of reuse, resalable and recyclable
- Percentage of contracts paid as agreed
- Geographic breakdown of markets
- Total payroll and benefits for staff
- Distributions to providers of capital
- Increase/decrease and retained earnings
- Taxes - Subsidies - Donations
Nikolaou, Evangelinos and Allan (2011).
29
Sustainability:
Environmental performance
Commitment
- Motivation - Available procedures for
waste management - Collection centers - Supplier commitment
Olugu, Wong and Shaharoun (2011).
Value for money, playfulness,
health, wellness and environment.
(Efficient Strategies)
Sustainability:
Environmental performance
Regulation compliance
- Environmental regulation
Olugu, Wong and Shaharoun (2011).
Level of Waste and energy
consumption
- Material and product features:
- Level of waste - Recyclable materials - Recovery time
Olugu, Wong and Shaharoun (2011).
- Waste management: - Energy Consumption - Water Consumption - Waste arising
Olugu, Wong and Shaharoun (2011); Yakovleva, Sarkis and Sloan (2010)
- Number of returns Srivastava and Srivastava (2006)
- Percentage of waste materials
- Energy use - Water use - Localization and size of
land owned - Biodiversity and
environmental impact of products and services
- Green house emissions - Total amount of waste - Chemical spills - Products resold - Non compliance incidents - Hazardous wastes
Nikolaou, Evangelinos and Allan (2011).
Sustainability:
Social performance
Health, Safety, stakeholder and
employment responsibility
- Customer involvement Olugu, Wong and Shaharoun (2011).
- Employment - Wages - Employment gender ratio
Yakovleva, Sarkis and Sloan (2010)
- Demographic changes - New competition and
inflation - Communication level
Kumar and Nigmatullin (2011)
- Outsourcing Bernon, Rossi and Cullen (2010)
- Internal human resources: - Employment stability - Employment Practices - Health, safety and
capacity development
Sarkis, Helms and Hervani (2010)

30
Value for money, playfulness,
health, wellness and environment.
(Efficient Strategies)
Sustainability:
Social performance
Health, Safety, stakeholder and
employment responsibility
- External Population: - Human Capital - Productive capital - Community capital
- Stakeholder participation: - Information provision - Stakeholder influence
- Macro social issues: - Socioenvironmental
performance - Socioeconomic
performance
Sarkis, Helms and Hervani (2010)
- Labour indicators: - Breakdown of workforce - Net employment creation - Employment legislation
compliance
- Human resources: - Human rights - Discrimination prevention
- Society: - Customer health and
safety policies - Legislation and regulation
compliance
- Product responsibility: - Healthy and safe use of
products - Product information and
labeling - Number of complaints
Nikolaou, Evangelinos and Allan (2011).
Convenient and simple products
at the right moment
(Responsive Strategies)
Speed Lead times
- Lead times
Olugu, Wong and Shaharoun (2011); Kumar and Nigmatullin (2011); Guide et al. (2006); Bernon, Rossi and Cullen (2010)
- Product development and supply chain cycle times
Olugu, Wong and Shaharoun (2011); Smith, A.J.R. and Halgamuge, S. (2008); Bernon, Rossi and Cullen (2010)

31
Convenient and simple products
at the right moment
(Responsive Strategies)
Speed Lead Times
- Facility Location Bernon, Rossi and Cullen (2010)
- Time value
Guide Jr. et al. (2006); Blackburn et al. (2004)
Flexibility
Fill rate
- Flexibility in demand
- Fill rate
- Production flexibility
Olugu, Wong and Shaharoun (2011).
- Return rates Stock and Mulki (2009)
Customer Satisfaction
- Customer Satisfaction
Nikolaou, Evangelinos and Allan (2011); Olugu, Wong and Shaharoun (2011).
Reliability and Quality
Product compliance in
terms of quality and safety
- Quality of packaging materials
- Quality and completeness of the returned products
Bernon, Rossi and Cullen (2010)
Defined policies and procedures for
returns
- Predefined disposition and return strategies
- Supply chain trust
Bernon, Rossi and Cullen (2010); Bernon and Cullen (2007); Stock and Mulki (2009)
Information management and
supply chain visibility,
traceability and recall
- Information Technology - Supply chain visibility
Bernon, Rossi and Cullen (2010); Hobbs (2006)
Product information and
labeling
- Quality of information
Bernon, Rossi and Cullen (2010)
Return avoidance - Return avoidance
programmes
Stock and Mulki (2009); Olugu, Wong and Shaharoun (2011)
Source: Cardona (2012)

32
Table 2 Percentage of Participation: Product Vs. Supply Chain Links
Product Raw
material
Manufacturing Distribution Retailing Other Total
Dairy
Products
1.77% 5.31% 7.08% 4.42% 0.00% 18.58%
Bakery 0.00% 1.77% 7.08% 6.19% 0.88% 15.93%
Frozen Food 0.00% 0.88% 6.19% 3.54% 0.00% 10.62%
Snacks 0.88% 1.77% 9.73% 5.31% 0.00% 17.70%
Meat 2.65% 2.65% 5.31% 6.19% 0.00% 16.81%
Fruits and
Vegetables
0.88% 0.88% 0.88% 0.88% 0.00% 3.54%
Beverages 0.00% 1.77% 3.54% 0.00% 0.00% 5.31%
Chocolate 0.00% 0.00% 0.88% 0.00% 0.00% 0.88%
Coffee 0.88% 0.88% 0.88% 2.65% 0.00% 5.31%
Other 0.88% 1.77% 1.77% 2.65% 1.77% 8.85%
Total 7.96% 17.70% 43.36% 31.86% 2.65% 100%

33
Table 3 Paired Samples Test between forward and reverse logistics
Paired Differences Mean
Std.
Deviation t-value
Sig. (2-
tailed)
Speed 0.892 1.125 4.822 0
Flexibility 0.324 1.334 1.478 0.148
Reliability 0.405 1.723 1.431 0.161
Quality 1 1.394 4.362 0
Sustainability-Economical 0.135 1.273 0.646 0.523
Sustainability- Environmental 0.081 1.534 0.321 0.75
Sustainability- Social 0.135 1.619 0.508 0.615

34
Table 4 Key Performance Indicators for Food Reverse Logistics
KPI Importance
Customer satisfaction 20.12%
Product compliance in terms of quality and safety 15.38%
Level of waste and energy consumption 10.65%
Supply chain and recycling costs 10.06%
Product information and labelling 7.10%
Lead times 7.10%
Fill rate 6.51%
Regulation compliance 5.33%
Information management and supply chain visibility 5.33%
Defined policies and procedures for returns 5.33%
Return avoidance programmes (GMP, HACCP, etc) 4.73%
Asset recovery 2.37%
Social Responsibility 0.01%

35
Table 5 Reverse Performance by Life-cycle stage
Stage Speed Flexibility Q&R Cost Sustainability
Introduction 31% 71% 35% 0% 0%
Growth 6% 29% 38% 14% 31%
Maturity 50% 0% 8% 54% 0%
Decline 13% 0% 19% 32% 69%
Q&R=Quality and Reliability

36
APPENDIX - QUESTIONNAIRE
1. Name of the Company (Optional): _______________________________________________ 2. Country(ies) where the company operates: ________________________________________ 3. Number of employees: ________________________________________________________ 4. Scope of your business: Raw material ( ) Manufacturing ( ) Distribution ( ) Retailing ( ) Other, Please specify: ______________________________________________________________ 5. Product(s): Dairy products ( ) Bakery ( ) Frozen food ( ) Meat ( ) Snacks ( ) Other, please specify: ___________________ _____________________________________ _____________________________________ 6. Do you measure the effectiveness of your reverse flow of products (returns)? Yes ( ) No ( ) If yes, which indicators do you use? _________________________________ __________________________________________________________________________________________________________________________________________________________________
7. How important are the following indicators on your forward flow of products (from supplier to customer) vs. your
reverse flow (customer returns): 5: Essential 4: Very Important 3: Important 2: Almost Irrelevant 1: Completely irrelevant
PI FORWARD REVERSE
Supply Manufacturing Distribution Retailing Customer return*
Sorting Disposition of returns
Production cost
Profit
Return on investment
Inventory
Customer Satisfaction
Volume flexibility
Delivery flexibility
Fill rate
Product lateness
Lead time
Customer response time
Shipping errors
Sensory properties and shelf life
Product safety and health
Product reliability and convenience
Production system
Environmental aspects
Marketing

37
*Customer return process: the initial process, where the product is returned .It includes data collection, traceability and
recall activities.
8. Is there any other indicator(s) particular to your reverse activities? Please indicate the level of relevance.
5: Essential 4: Very Important 3: Important 2: Almost Irrelevant 1: Completely irrelevant
PI REVERSE Remarks (if any)
Customer return
Sorting Disposition of returns
9. Based on the following concepts: Efficiency: How well the resources are utilized Flexibility: Degree to which the supply chain can respond to a changing environment and extraordinary customer service request Responsiveness: provide the requested products with a short lead time Product quality: product safety and health, sensory properties and shelf life and product reliability and convenience To what extent do you agree that the listed concepts are essential to determine the performance of your reverse activities (customer return, sorting and disposition)?
5: Completely agree 4: Agree 3: Indifferent 2: Disagree 1: Completely disagree
Customers return Sorting Disposition comments (if any)
Efficiency ( ) ( ) ( ) _____________________ Flexibility ( ) ( ) ( ) _____________________ Responsiveness ( ) ( ) ( ) _____________________ Product quality ( ) ( ) ( ) _____________________ 10. Using the same concepts detailed in point number 9, please indicate the relevance of each indicator for the reverse
activities based on the following scenarios:
5: Essential 4: Very Important 3: Important 2: Almost Irrelevant 1: Completely irrelevant
PI Sales are low, but increase slowly and
returns volume is very low and
constant
Sales increase and returns
volume substantially
increase. Different types of defects arise and
firms must allocate
additional disposition
options for the products.
Sales are more constant but
competitors grow and firms must concentrate in
decreasing costs of returns and
creating tax gain through donation
The cost of the product in the market and its
customer demand
decreases steadily. Return
volume also increase.
Product becomes obsolete and the
sales are basically null as
product is replaced by new
model(s). Returns are not
longer requested.
Efficiency
Flexibility
Responsiveness
Quality
Other (if any) please mention it

38
11. How proficient is your firm in the following reverse logistic activities:
5: Expert 4: Proficient 3: Talented 2: barely capable 1: incapable
Remarks (if any)
Traceability ( ) _____________________________________ Recall ( ) _____________________________________ Reception of Customer returns ( ) _____________________________________ Data collection from Customer returns ( ) _____________________________________ Disposition decision ( ) _____________________________________ Refurbishing ( ) _____________________________________ Remanufacturing ( ) _____________________________________ Outlet sales ( ) _____________________________________ Donation ( ) _____________________________________ Recycling ( ) _____________________________________ Landfill ( ) _____________________________________ Other ( ) _____________________________________
Top Related