


Languages
Pages
Legal


How do private equity investors create value?
A study of 2013 North American exits
Returning to safer ground

Exit activity and performance
6
Key findings 10
Outlook 16
About the study 18
Contents
Executive summary 3
Returning to safer ground: how do private equity investors create value? 3
Executive summary
This is our seventh study examining how private equity (PE) investors create value in North America. Covering exits from 2006 to 2013, it highlights the flexibility of the PE model and demonstrates the ability to generate outperformance throughout an economic cycle, from pre-crisis through the downturn and now into the recovery period.
Our results show an acceleration of North American PE exits over the last year both in value and number as firms have taken advantage of increased public market demand and a return of corporate buyers. The number of exits recorded in our sample for 2013 is the highest since our studies began and so too is the value — and by some margin.
PE is demonstrating that it can crystallize the value of many deals completed pre-crisis. Indeed, it is making distributions to limited partners (LPs) at a faster rate than it has deployed the capital; the North American portfolio shrunk over the last two years after a period of rapid growth in the run-up to the crisis. This encouraging trend is lifting PE out of the danger zone as capital that was recently anchored in the portfolio has been released within a reasonable time horizon. Overall, it proves that the industry is capable of supporting the weight of capital that has flowed toward it over the last several years.
Last year also saw a shift in value creation strategy employed by PE as it took advantage of the buyer’s market that was in evidence post-crisis. While previous studies showed that PE efforts were mainly focused

4 Returning to safer ground: how do private equity investors create value?
on accelerating the growth of portfolio companies’ core business, exits achieved in 2013 show a significant increase in buy-and-build as the strategy of choice. With strategic buyers out of the market, a lack of public market capital for expansion and many businesses affected by the downturn since the crisis, PE seized the opportunity to make add-on acquisitions at reasonable valuations to scale up portfolio companies and expand into new geographic and product areas or to consolidate fragmented industries.
And while our studies have always underscored the importance of management to a deal’s success, our results show that this has become more important than ever, and that PE firms are evolving the ways they support and incentivize management teams. Our analysis shows that exits achieved in the post-crisis period exhibit a more trusted pool of recipients in equity incentive plans, more focused on senior management teams and less so on spreading equity incentives more widely. The use of external operating partners, which gained in popularity for exits achieved during the downturn, is now becoming less common, replaced by a more management-centric approach or an adapted operating partner model that employs dedicated in-house expertise and resources to bring about improved company performance.
This is arguably a more hands-on modus operandi than bringing in senior advisors that may provide higher-level strategic input but are generally less involved in day-to-day operations. It reflects the increased involvement portfolio companies required — and received — from PE during the downturn to drive improvement measures and focus on the right levers for growth. It may also reflect the increased prevalence of buy-and-build strategies in this period as these generally
require more specialist M&A support, which in-house PE teams are perfectly placed to provide.
This focus on growth and driving improvements through the portfolio clearly results in stronger performance for PE-backed businesses. As with all our previous studies, this year’s analysis shows that PE outperforms comparable public markets companies by a significant margin. PE’s strategic and operational value-adds comprise nearly a third of this outperformance for exits achieved over the study period. Our study also points to the increased importance of organic revenue growth over the last few years, driven primarily by entry into new geographic markets and the launch of new products. Organic revenue growth accounted for around half of EBITDA growth for exits completed between 2010 and 2013. Pre-crisis times, it contributed just over a third.
However, while our study points to a PE industry that is emerging well-positioned from the crisis and taking advantage of the strong exit market, the prevalence of IPOs does pose some risk to PE. Our analysis shows that the increased size of PE-backed IPOs since 2010 has led to a reduction in the proportion of shares offered at initial listing and therefore in time to full exit and more risk in the post-IPO trading performance. With large amounts of capital locked up in these publicly traded companies, PE’s exposure to market movements and its correlation with public markets have increased markedly over the recovery period.
This, together with a further increase in average hold periods over the last year, suggests that while PE is making good progress overall, exits will need to be a primary focus for the foreseeable future.

Returning to safer ground: how do private equity investors create value? 5

6 Returning to safer ground: how do private equity investors create value?
Exit activity and performance
Returning to safer ground: how do private equity investors create value? 7
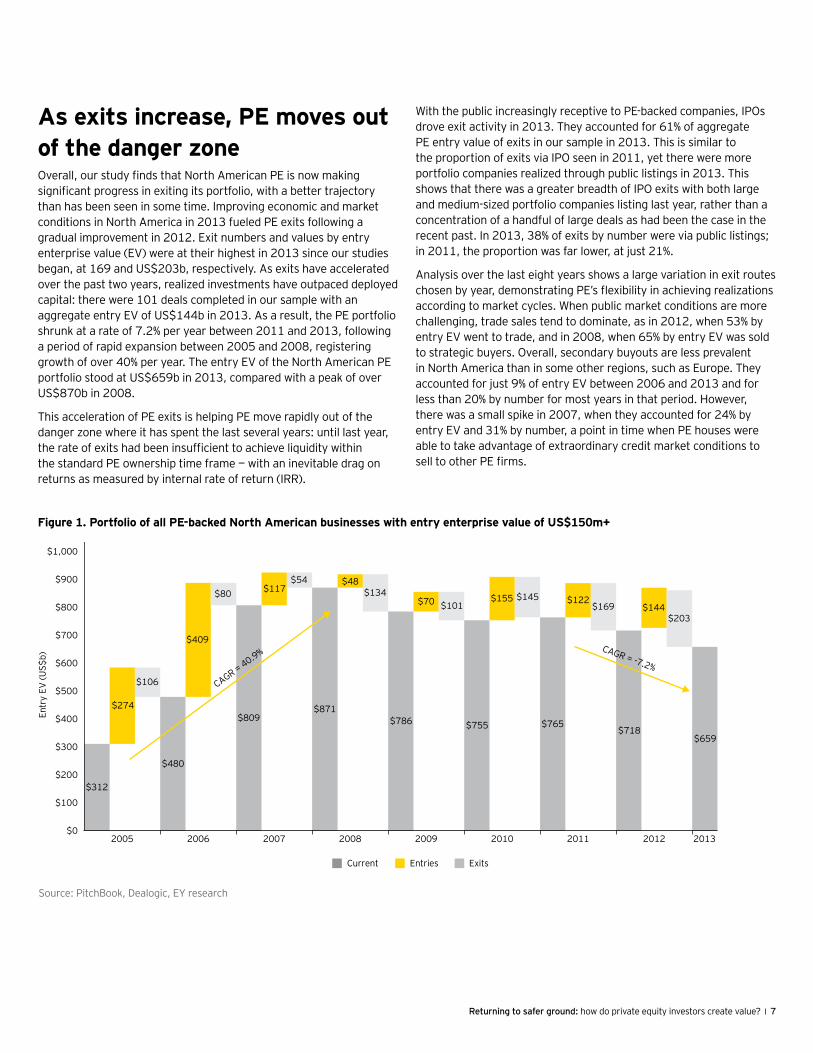
As exits increase, PE moves out of the danger zoneOverall, our study finds that North American PE is now making significant progress in exiting its portfolio, with a better trajectory than has been seen in some time. Improving economic and market conditions in North America in 2013 fueled PE exits following a gradual improvement in 2012. Exit numbers and values by entry enterprise value (EV) were at their highest in 2013 since our studies began, at 169 and US$203b, respectively. As exits have accelerated over the past two years, realized investments have outpaced deployed capital: there were 101 deals completed in our sample with an aggregate entry EV of US$144b in 2013. As a result, the PE portfolio shrunk at a rate of 7.2% per year between 2011 and 2013, following a period of rapid expansion between 2005 and 2008, registering growth of over 40% per year. The entry EV of the North American PE portfolio stood at US$659b in 2013, compared with a peak of over US$870b in 2008.
This acceleration of PE exits is helping PE move rapidly out of the danger zone where it has spent the last several years: until last year, the rate of exits had been insufficient to achieve liquidity within the standard PE ownership time frame — with an inevitable drag on returns as measured by internal rate of return (IRR).
With the public increasingly receptive to PE-backed companies, IPOs drove exit activity in 2013. They accounted for 61% of aggregate PE entry value of exits in our sample in 2013. This is similar to the proportion of exits via IPO seen in 2011, yet there were more portfolio companies realized through public listings in 2013. This shows that there was a greater breadth of IPO exits with both large and medium-sized portfolio companies listing last year, rather than a concentration of a handful of large deals as had been the case in the recent past. In 2013, 38% of exits by number were via public listings; in 2011, the proportion was far lower, at just 21%.
Analysis over the last eight years shows a large variation in exit routes chosen by year, demonstrating PE’s flexibility in achieving realizations according to market cycles. When public market conditions are more challenging, trade sales tend to dominate, as in 2012, when 53% by entry EV went to trade, and in 2008, when 65% by entry EV was sold to strategic buyers. Overall, secondary buyouts are less prevalent in North America than in some other regions, such as Europe. They accounted for just 9% of entry EV between 2006 and 2013 and for less than 20% by number for most years in that period. However, there was a small spike in 2007, when they accounted for 24% by entry EV and 31% by number, a point in time when PE houses were able to take advantage of extraordinary credit market conditions to sell to other PE firms.
Source: PitchBook, Dealogic, EY research
Figure 1. Portfolio of all PE-backed North American businesses with entry enterprise value of US$150m+
Current Entries Exits
$659
$312
$274
$106
$480
$409
$80
$809
$117$54
$871
$48$134
$786
$70 $101
$755
$155 $145
$765
$122$169
$718
$144$203
$0
$100
$200
$300
$400
$500
$600
$700
$800
$900
$1,000
2005 2006 2007 2008 2009 2010 2011 2012 2013
Entr
y EV
(US$
b)
CAGR = 40.9% CAGR = -7.2%

8 Returning to safer ground: how do private equity investors create value?
PE is clearly taking advantage of these two trends — a robust IPO market and an increased demand for M&A among strategic buyers — to exit, providing liquidity to LPs within a more normalized traditional time frame. With all three primary exit routes available to PE for the first time since the crisis, the market has provided optionality to manage the weight of invested capital that has been deployed by the industry over the last eight years.
Larger, pre-crisis deals now being realizedAs the IPO window remained firmly open in 2013, PE took the opportunity to exit some of its largest companies acquired in the run-up to the crisis — a part of the portfolio that had remained stuck dating back to 2007 during the recession. The percentage of exits via IPO with an entry EV of US$1b+ was 30% last year, in line with the previous two years; that of exits in the US$2b+ bracket was 22%, slightly down on 2012, but in line with 2011 and 2010.
However, unlike last year, other exit routes were also open to PE for some of its largest deals. In an encouraging sign of a market in recovery, exits of large companies via M&A (to strategics and PE) were up significantly last year. Corporates were more active in the M&A market last year, in contrast to previous years.
For deals with an entry EV of US$1b+, 25% went to M&A buyers, a proportion that has increased steadily over the last two years; for the US$2b+ bracket, the increase was more dramatic, with 17% of deals exited via M&A, up from just 10% in 2012 and the highest proportion since our studies began.
Source: PitchBook, Dealogic, EY research
Figure 3. Percentage of exits with entry EV US$2b and up
0%
5%
10%
15%
20%
25%
30%
35%
6%
13%
2006
4%
11%
2007
0%
12%
2008
29%
3%
2009
22%
4%
2010
23%
7%
2011
29%
10%
2012
22%
17%
2013
Percentage of exits by IPO Percentage of exits by M&A
Exits via M&A have been increasing steadily over the last two years.
Figure 2. Percentage of exits with entry EV US$1b and up
0%
10%
20%
30%
40%
50%
60%
31%25%
2006
17%15%
2007
0%
24%
2008
52%
28%
2009
48%
17%
2010
32%
14%
2011
32%
21%
2012
30%25%
2013
Percentage of IPO exits Percentage of M&A exits

Returning to safer ground: how do private equity investors create value? 9
Market momentum validates PE’s long-term approachThe improvement in overall market conditions is also having a positive effect on the prospects of the portfolio companies most affected by the recession. Post-crisis, PE struggled to regain value lost in a number of deals during the downturn. Yet many of these have now recovered to the point where they can be profitably exited. Indeed, the factor most cited by PE as the trigger for exits in 2013, with 45%, was favorable market conditions. This phenomenon underscores the benefits of PE’s long-term investment horizons. While the portfolio was clearly affected by the recession, PE’s ability to ride out the storm and hold on to businesses while rigorously repositioning operations and driving growth has crystallized in successful exits.
At the same time, creditor exits have declined sharply since the crisis era. In 2013, just 5% of exits by entry EV went to creditors, compared with 38% in 2008. The peak by number was in 2009, when 26 exits were to creditors; this has now reached more normal levels of seven to eight per year. Our analysis also demonstrates that creditor exits were driven by the post-crisis fallout in some sectors: consumer discretionary goods, arguably the area of the economy most affected by the downturn, accounted for nearly half (45%) of all creditor exits by number over the last six years, with most concentrated in 2008 to 2010. Over the last three years, however, this has shifted as creditor exits have tended to be related to specific company issues as opposed to sector-specific factors.
Hold periods still on the riseDespite the acceleration of PE exits last year, hold periods continue to trend upward, having increased annually since 2009. The weighted-average hold period for exits achieved in 2013 stood at 5.4 years, a full year more than for 2012 exits. This is consequently dragging down returns as measured by IRR. The average hold period for exits over the entire eight-year study period stands at 4.4 years, and if 2013 hold periods had been in line with this average, IRRs would have been nearly 30% higher. PE will need to continue to find ways of increasing its exit pace if it is to reverse this trend and boost its IRR profile.
PE continues to outperform the public marketsOur analysis shows that PE continues to outperform comparable public market companies. For our sample completed between 2006 and 2013, PE returned 2.4x similar publicly listed companies over the same time frame, with PE’s strategic and operational value-add a key driver of PE performance. Over the entire study period, PE outperformance accounts for over a third of PE’s total return. Additional leverage accounts for a similar proportion.
Figure 4. Weighted-average hold period
3.44.0 3.8
3.1
4.4
4.8
4.4
5.4
4.4
1
2
3
4
5
6
2006 2007 2008 2009 2010 2011 2012 2013
Weighted-average hold period by year Study average
Hol
d pe
riod
(in y
ears
)
Figure 5. PE exits compare well versus public companies
1.0
1.8
1.6
1.0
1.8
1.6
+4.4
0
1
2
3
4
5
Stock marketreturn
Additionalleverage
PE strategic andoperational
improvement
PEoutperformance
Gross weighted average equity multiple attribution, 2006-13

10 Returning to safer ground: how do private equity investors create value?
Key findings
10 Returning to safer ground: how do private equity investors create value?

Returning to safer ground: how do private equity investors create value? 11
Organic revenue growth drives EBITDA performanceConsistent with our previous studies, our analysis shows that the majority of EBITDA growth for 2006–13 was derived from organic revenue growth (46%). This source of growth has been particularly important in the recovery years, as half of all EBITDA growth reported in exits achieved between 2010 and 2013 was attributed to organic growth. The contribution of buy-and-build strategies to EBITDA growth has also increased markedly in the recovery period, accounting for over a quarter of total EBITDA growth, up from just 13% in 2008 and 2009.
Meanwhile, our results show that the focus on cost-cutting prevalent in the pre-crisis years, has declined in recent years. However, it remains an important part of the PE playbook. Cost reduction accounted for 30% of EBITDA growth in 2006 and 2007 exits. In contrast, this percentage had fallen to just 16% from 2010 to 2013 as PE concentrated more on other value-creation strategies, in particular buy-and-build. Transformational change in the form of entering new geographic markets and launching new products has always been a centerpiece of PE value creation, but the importance of these factors has increased in recent years. These two initiatives accounted for 23% and 15% of organic revenue growth, respectively, in companies exited over the entire study period. However, their contribution almost doubled over the recovery period — to 35% and 24% of organic growth, respectively — demonstrating PE’s ability to drive through company expansion strategies even at times of benign economic growth. Meanwhile, hands-on, functional expertise is still a vital feature of PE’s value-add. Initiatives, such as price increases and improved sales processes, contributed 28% of the total organic revenue growth for exits across the entire sample.
Despite less emphasis on cost reduction over recent years, this tool remains an integral component of PE’s operational improvement toolkit. Our analysis shows that operating efficiencies, such as
Figure 7. Principal drivers of organic revenue growth, 2007–13
Figure 6. Sources of EBITDA growth, 2006–13
7.1% 8.4%5.8%
8.6%
4.8% 1.9%3.1%
4.6%0.1%0.4%
0.2%5.5%
3.2%1.8%
4.7%
0.9%
18.3%
14.3%
11.4%0.7%
0.3%
0.8%
18.9%
-1.0%
1.0%
3.0%
5.0%
7.0%
9.0%
11.0%
13.0%
15.0%
17.0%
19.0%
All years(2006–13)
Pre-recession(2006–07)
Post-recession(2008–09)
Recovery(2010–13)
Bolt-on acquisitions Disposals
Other
Organic revenue growth
Cost reduction
supply chain improvements and synergy capitalization, comprised 59% of cost reduction realized over the entire study period. Improved financial systems and control accounted for nearly 20%.
Buy-and-build strategies are backIn the post-recession era, PE has adapted its value creation strategy to suit the market environment. While the strategies of investing in growth sectors and accelerating growth from the core business were the predominant means of creating value in prior years, 2013 exits exhibit a definite trend toward PE houses pursuing buy-and-build strategies. Since 2009, the number of deals implementing a buy-and-build strategy averaged 21%, yet buy-and-build strategies were associated with 31% of deals exited in 2013.
PE has clearly taken advantage of conditions in the post-crisis period to use its finely honed M&A expertise to build companies of greater scale. Lower company valuations, a lack of competition from strategic buyers, and companies’ difficulty in tapping the public markets for finance as a result of the downturn in the IPO market in 2009–10 all contributed to an environment that supported add-on acquisitions. The recession also created opportunities for PE to consolidate in either fragmented industries or sectors where competitors may have been weakened by the economic decline.
Geographical expansion Price increases Improved selling
2007 2008–09(Recession)
2010–13(Recovery)
2007–2013
Change of offering New productsGrowth (shrinking) in market demand
28%
8%
12%
10%
31% 11%
22%
4%13%
13% 14%
34%
-1%
35%
4% 21%
17%
24% 23%
6%
22% 13%
15%
21%
12 Returning to safer ground: how do private equity investors create value?
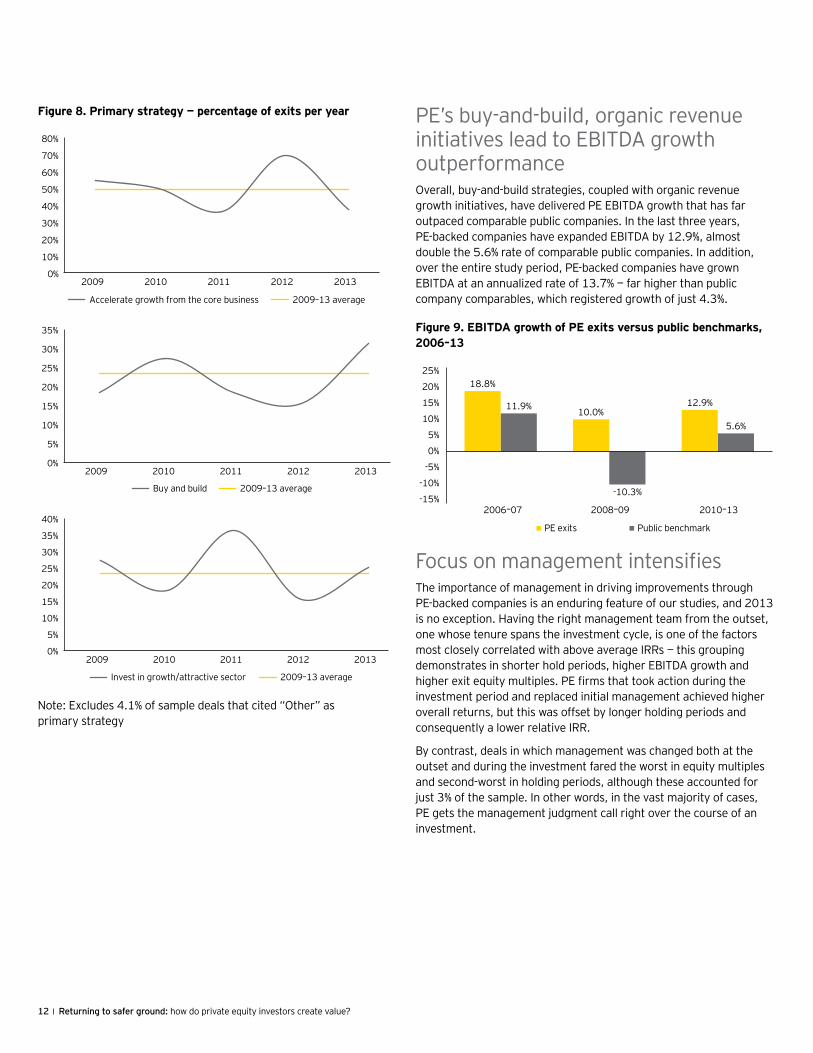
PE’s buy-and-build, organic revenue initiatives lead to EBITDA growth outperformanceOverall, buy-and-build strategies, coupled with organic revenue growth initiatives, have delivered PE EBITDA growth that has far outpaced comparable public companies. In the last three years, PE-backed companies have expanded EBITDA by 12.9%, almost double the 5.6% rate of comparable public companies. In addition, over the entire study period, PE-backed companies have grown EBITDA at an annualized rate of 13.7% — far higher than public company comparables, which registered growth of just 4.3%.
Focus on management intensifiesThe importance of management in driving improvements through PE-backed companies is an enduring feature of our studies, and 2013 is no exception. Having the right management team from the outset, one whose tenure spans the investment cycle, is one of the factors most closely correlated with above average IRRs — this grouping demonstrates in shorter hold periods, higher EBITDA growth and higher exit equity multiples. PE firms that took action during the investment period and replaced initial management achieved higher overall returns, but this was offset by longer holding periods and consequently a lower relative IRR.
By contrast, deals in which management was changed both at the outset and during the investment fared the worst in equity multiples and second-worst in holding periods, although these accounted for just 3% of the sample. In other words, in the vast majority of cases, PE gets the management judgment call right over the course of an investment.
Figure 9. EBITDA growth of PE exits versus public benchmarks, 2006–13
18.8%
10.0%12.9%11.9%
5.6%
-15%
-10%
-5%
0%
5%
10%
15%
20%
25%
2006–07 2008–09 2010–13
PE exits Public benchmark
-10.3%
Figure 8. Primary strategy — percentage of exits per year
0%
5%
10%
15%
20%
25%
30%
35%
2009 2010 2011 2012 2013
2009–13 averageBuy and build
0%
5%
10%
15%
20%
25%
30%
35%
40%
2009 2010 2011 2012 2013
2009–13 averageInvest in growth/attractive sector
0%
10%
20%
30%
40%
50%
60%
70%
80%
2009 2010 2011 2012 2013
2009–13 averageAccelerate growth from the core business
Note: Excludes 4.1% of sample deals that cited “Other” as primary strategy

Returning to safer ground: how do private equity investors create value? 13
Our study shows that PE is employing a variety of measures to ensure it has the right teams in place, including using consultants to identify management team strengths and weaknesses before investing, strengthening boards at the outset of the deal, adding new C-level positions to address areas of focus, and investing in the next level of management, particularly in cases where senior team members are close to retirement.
PE firms are also seeking out teams with experience working for PE-backed companies with a solid understanding of the model. Many firms in the sample partnered with the same management team over the course of several deals. Perhaps most importantly, when it became clear that a particular manager or team wasn’t up to the task, the most successful PE firms moved quickly to replace them.
Top management now the focus of incentive programsEffective alignment of incentives is one of the key drivers of PE value creation and a fundamental component of its playbook. In recognition of the vital role played by management, particularly since the onset of the crisis, PE has adjusted its incentive programs with a focus on senior team members, who are arguably the individuals most able to drive improvements and transformation in a business. In our 2006–10 sample, 53% of portfolio companies had equity incentives in place for wider management (i.e., beyond the top five members for the management team); in 2011–13, this had been reduced to 42%, with an increased emphasis on incentivizing top management.
This shift may well have been brought about by PE’s experience culled from the crisis. In difficult times, having in place the right management team that is incentivized with finely tuned, individually designed structures becomes more vital than ever. Moreover, offering equity widely across the company is costly, especially if many of those receiving equity incentives don’t necessarily value it as a currency. As a result, PE is therefore now refining incentive schemes in a variety of ways, with the goal of incentivizing management at all levels of the company in a manner that is directly tied to performance and that most resonates with them, whether it be cash, equity or some combination thereof. PE firms are working to balance short- and long-term objectives; perform regular reviews of compensation, particularly in light of changing market environments; and offer plans with multiple components that are time-based, performance-based and tied to PE firms’ ultimate returns, including in the post-liquidity period. Lastly, PE firms are using nonlinear bonus structures that provide significant upside for significantly exceeding goals. All of these initiatives help to ensure that sponsors and their management teams are as aligned as possible and that all are driving toward achieving the same ultimate goal.
Management-centric models becoming more prevalentOver the last several years, an important shift has occurred as many PE firms built out sophisticated operations team and networks of senior executives who are available to lend their expertise to portfolio companies. Our analysis shows that a clear bifurcation is emerging between firms that have adopted some form of the operating partner model and those that pursue a strategy more closely aligned with giving greater autonomy to the management team and deliver on the growth agenda. In 2011, 70% of deals exited had used an operating partner; in 2013, this had been reduced to just 47%. Moreover, in deals exited between 2008 and 2013, 52% adopted a management-centric approach. Among those firms that have implemented an operating partner model, there is a shift away from using senior industry advisors to building in-house resources by employing either generalists to work with a portfolio company or bringing functional expertise, such as HR, IT, supply chain or marketing specialists, onto the payroll. In the 2008-13 sample, 21% had used a dedicated in-house team.
Further analysis suggests that those deals where in-house teams were used, or where management was central to the value-creation strategy in aggregate, outperformed those where a “lighter touch” senior advisor was brought in to provide high-level support and board-level improvement. The results of our study appear to show that time spent working directly with portfolio companies has a positive effect on performance.
However, it’s worth noting that the sample bore examples of outperformers across all categories, implying there in no “one size fits all” approach to portfolio management. Moreover, PE firms manage deals on a case-by-case basis, using the most appropriate model for the specific deal situation. Some firms may choose to rely purely on management expertise at a portfolio company even if they have access to best-in-class operating capabilities, for example.
In deals exited between 2008 and 2013, 52% adopted a management-centric approach.
14 Returning to safer ground: how do private equity investors create value?
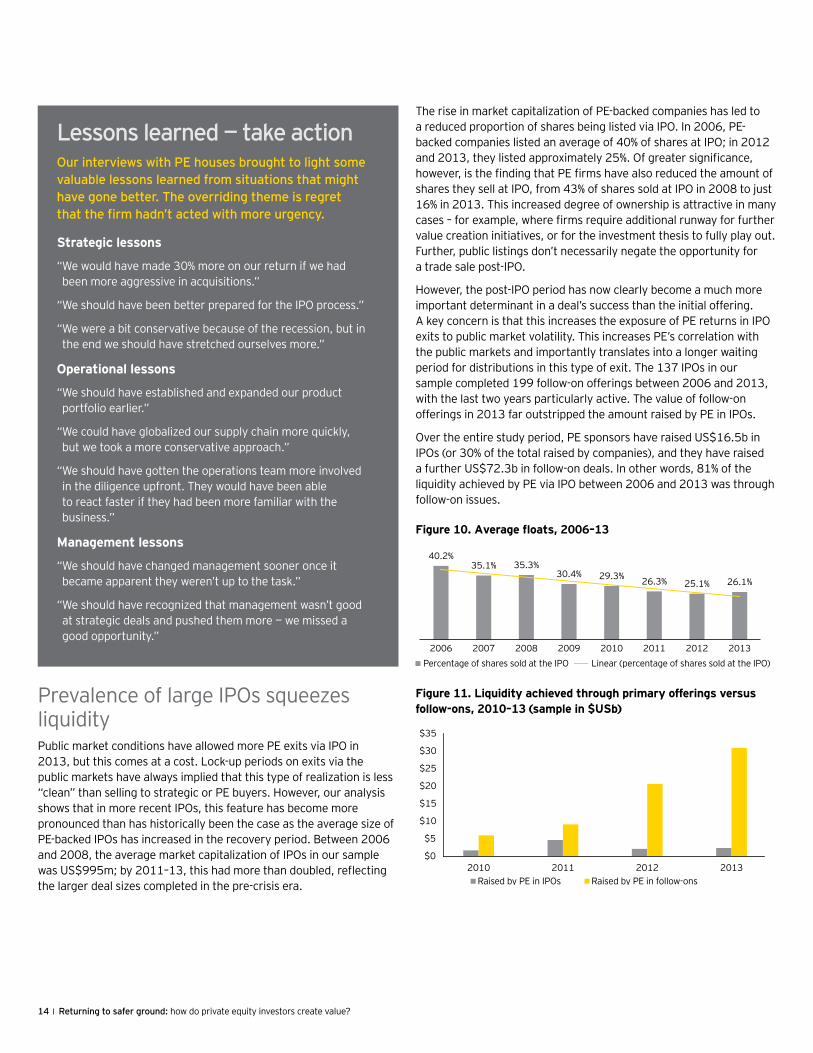
Prevalence of large IPOs squeezes liquidityPublic market conditions have allowed more PE exits via IPO in 2013, but this comes at a cost. Lock-up periods on exits via the public markets have always implied that this type of realization is less “clean” than selling to strategic or PE buyers. However, our analysis shows that in more recent IPOs, this feature has become more pronounced than has historically been the case as the average size of PE-backed IPOs has increased in the recovery period. Between 2006 and 2008, the average market capitalization of IPOs in our sample was US$995m; by 2011–13, this had more than doubled, reflecting the larger deal sizes completed in the pre-crisis era.
The rise in market capitalization of PE-backed companies has led to a reduced proportion of shares being listed via IPO. In 2006, PE-backed companies listed an average of 40% of shares at IPO; in 2012 and 2013, they listed approximately 25%. Of greater significance, however, is the finding that PE firms have also reduced the amount of shares they sell at IPO, from 43% of shares sold at IPO in 2008 to just 16% in 2013. This increased degree of ownership is attractive in many cases – for example, where firms require additional runway for further value creation initiatives, or for the investment thesis to fully play out. Further, public listings don’t necessarily negate the opportunity for a trade sale post-IPO.
However, the post-IPO period has now clearly become a much more important determinant in a deal’s success than the initial offering. A key concern is that this increases the exposure of PE returns in IPO exits to public market volatility. This increases PE’s correlation with the public markets and importantly translates into a longer waiting period for distributions in this type of exit. The 137 IPOs in our sample completed 199 follow-on offerings between 2006 and 2013, with the last two years particularly active. The value of follow-on offerings in 2013 far outstripped the amount raised by PE in IPOs.
Over the entire study period, PE sponsors have raised US$16.5b in IPOs (or 30% of the total raised by companies), and they have raised a further US$72.3b in follow-on deals. In other words, 81% of the liquidity achieved by PE via IPO between 2006 and 2013 was through follow-on issues.
Lessons learned — take actionOur interviews with PE houses brought to light some valuable lessons learned from situations that might have gone better. The overriding theme is regret that the firm hadn’t acted with more urgency.
Strategic lessons
“ We would have made 30% more on our return if we had been more aggressive in acquisitions.”
“We should have been better prepared for the IPO process.”
“ We were a bit conservative because of the recession, but in the end we should have stretched ourselves more.”
Operational lessons
“ We should have established and expanded our product portfolio earlier.”
“ We could have globalized our supply chain more quickly, but we took a more conservative approach.”
“ We should have gotten the operations team more involved in the diligence upfront. They would have been able to react faster if they had been more familiar with the business.”
Management lessons
“ We should have changed management sooner once it became apparent they weren’t up to the task.”
“ We should have recognized that management wasn’t good at strategic deals and pushed them more — we missed a good opportunity.”
Figure 10. Average floats, 2006–13
$0
$5
$10
$15
$20
$25
$30
$35
2010 2011 2012 2013Raised by PE in IPOs Raised by PE in follow-ons
Figure 11. Liquidity achieved through primary offerings versus follow-ons, 2010–13 (sample in $USb)
40.2%35.1% 35.3%
30.4% 29.3% 26.3% 25.1% 26.1%
2006 2007 2008 2009 2010 2011 2012 2013Linear (percentage of shares sold at the IPO)Percentage of shares sold at the IPO

Returning to safer ground: how do private equity investors create value? 15Returning to safer ground: how do private equity investors create value? 15

16 Returning to safer ground: how do private equity investors create value?
Outlook
16 Returning to safer ground: how do private equity investors create value?

Returning to safer ground: how do private equity investors create value? 17
Our study demonstrates that PE is now making progress on its most significant issue – a growing and aging portfolio. More of the stuck portfolio companies acquired before the recessions were cleared last year, a trend that has continued this year. If the IPO window remains open, and if corporates continue their return to the M&A markets, PE should be able to maintain the pace or even accelerate it. While average holding periods increased last year, there will come a tipping point where they start to reverse. We may begin to see over the coming year.
However, with larger companies opting for public listings, PE will need to manage its public market exposure with care. A rising stock market has benefited firms that have managed to take portfolio companies public over the past couple of years; if markets become more volatile, returns will clearly be affected. PE will also need to be sensitive to LP needs in this regard: having committed to PE as an investment strategy, they may be less than satisfied with a greater exposure to public markets over a longer period in the underlying portfolio than they had anticipated.
Yet as PE continues to return capital to LPs, the industry is faced with a further challenge. Indications are that LPs are generally very satisfied with the performance of their PE investments and will either maintain or increase their allocations to PE. The fund-raising market has steadily improved over the last year, with the time taken for firms to reach their targets shortening and some large funds being successfully raised. As a result, PE will need to continue adapting to ensure it is able to deploy the capital that is flowing toward it. With valuations rising as the public markets have gathered pace and M&A activity has increased, PE will need to strike the balance between maintaining a steady investment pace and avoiding overpaying for assets.
The shift toward more management-centric approaches or building in-house operating teams may well accelerate. With a refinement of equity incentives at the senior management level under way and a greater level of involvement in portfolio companies enabled by having in-house teams rather than using senior industry figures, the trend looks set to continue. However, general partners (GPs) will need to tread with care. The SEC has recently announced that it is focusing on the method by which PE allocates the cost of operating partners — continued moves toward transparency of reporting and communication by GPs will be helpful in avoiding further regulatory scrutiny.
PE has clearly proved itself capable of not only weathering the worst economic storm in a generation but of emerging stronger and able to generate outperformance on a consistent basis. It has achieved this through a process of constant evolution and continuous refinement of its value creation strategies in response to changing market conditions. Overall, the future looks promising for PE, its portfolio, and the LPs that rely on the industry’s performance.
Exits achieved in 2013 show a significant increase in buy and build as the strategy of choice.

18 Returning to safer ground: how do private equity investors create value?
About the studyThe 2014 Africa study examined the results and methods of PE exits between 2007 and 2013 using similar methodology to the US, Europe, Latin America and Australasia studies. Data was drawn from various sources, including AVCA and EMPEA, and confidential, detailed interviews with former PE owners of the exited businesses. Initial research was performed into 207 transactions across the continent, with in-depth information obtained on 129 exits. The exits had a minimum entry enterprise value of US$1m and included only full (not partial) exits.
Our analysis entailed an examination of the decision to invest, value creation during ownership, the exit strategy and key lessons learned. We obtained good coverage of data in our sample relative to the population across a number of metrics, such as exit year. However, as our exit population is not complete for the period 2007–13, our findings may not be fully
representative. In particular, we highlight the relatively small sample in Central Africa.
Given the limitations of the data, our aim in this inaugural study was to produce an important but not necessarily statistically significant sample of deals, analysis of which would enhance the understanding of exit modalities and strategies in these markets and the underlying drivers of value creation.
The size of the sample is a function of the availability of data on exits in these markets — our primary motivation for embarking on this research — and the extent of participation from the PE community. We are tremendously grateful for the generosity of those participating in this study and appreciate both their time and input.
We look forward to continuing to bring you insights into private equity value creation in both developed and emerging economies in the coming months and years.
About the studyFor the last nine years in Europe, and the last seven years in North America, EY has produced How do private equity investors create value?, one of the industry’s most important pieces of research focused on the methods by which PE investors create value in the companies they acquire and operate.
Through rigorous analysis of public filings and, most importantly, through detailed interviews with the PE professionals themselves, we have developed a database that includes performance data on more than 400 exits, giving us a unique insight into the techniques that PE firms employ to nurture and grow their portfolio holdings.
The study covers exits made by sale to a strategic investor, secondary buyout, an initial public offering or bankruptcy. The lessons learned from these transactions represent a collective set of industry best practices we intend to serve as a guide to be used to continuously refine strategy and portfolio management.
To avoid performance bias, and to ensure a focus on the largest businesses owned by PE, exits were screened to capture only those that had an EV at entry of more than US$150m. This criterion was also applied to our estimate of the current size of the PE portfolio. In total, we have identified 893 exits of businesses that met our criteria over the seven years from 2006 through 2013 — the “population.” Through detailed, confidential interviews and in-depth research using public sources, we obtained performance data for 440 of these businesses, which constitutes our sample. Except where otherwise noted, results are weighted by the total equity investment in the company in order to more accurately measure aggregate economic impact.
Looking across key performance metrics (e.g., deal size, exit route, incidence of creditor exits) there is no discernible bias in the composition of the sample compared with the whole population. For some of the performance metrics, our sample size is smaller than 439.
Our performance attribution analysis compares our sample of PE-backed companies to a broader universe of public comparables, matched by sector and investment period. Leverage effects are derived from recasting the capital structure of sample exits in line with public comps and recalculating returns post-adjustment. Returns also have been adjusted for the estimated impact of the increase or decrease in interest expense attributable to the implied change in the capital structure. Market returns are measured by the change in the respective S&P industry-specific index value over the same holding period as the individual exit/deal being analyzed. Outperformance is calculated on an individual deal basis and uses S&P industry-specific benchmarks over comparable holding periods.
The ability to incorporate data obtained directly from interviews with top PE investors is an important feature of the study and is among the primary reasons the study is recognized by many commentators as the authoritative work in the field.
18 Returning to safer ground: how do private equity investors create value?

Returning to safer ground: how do private equity investors create value? 19
ContactsJeff Bunder
Global Private Equity Leader [email protected]
Michael Rogers
Global Deputy Private Equity Leader [email protected]
Special thanks to:Peter Witte
Senior Private Equity Analyst [email protected]
Returning to safer ground: how do private equity investors create value? 19
About EYEY is a global leader in assurance, tax, transaction and advisory services. The insights and quality services we deliver help build trust and confidence in the capital markets and in economies the world over. We develop outstanding leaders who team to deliver on our promises to all of our stakeholders. In so doing, we play a critical role in building a better working world for our people, for our clients and for our communities.
EY refers to the global organization, and may refer to one or more, of the member firms of Ernst & Young Global Limited, each of which is a separate legal entity. Ernst & Young Global Limited, a UK company limited by guarantee, does not provide services to clients. For more information about our organization, please visit ey.com.
How EY’s Global Private Equity Center can help your business Value creation goes beyond the private equity investment cycle to portfolio company and fund advice. EY’s Global Private Equity Center offers a tailored approach to the unique needs of private equity funds, their transaction processes, investment stewardship and portfolio companies’ performance. We focus on the market, sector and regulatory issues. If you lead a private equity business, we can help you meet your evolving requirements and those of your portfolio companies from acquisition to exit through a highly integrated global resource of 190,000 professionals across audit, tax, transactions and advisory services. Working together, we can help you meet your goals and compete more effectively.
© 2014 EYGM Limited. All Rights Reserved.
EYG no. FR0134CSG/GSC2014/1393430ED None
In line with EY’s commitment to minimize its impact on the environment, this document has been printed on paper with a high recycled content.
This material has been prepared for general informational purposes only and is not intended to be relied upon as accounting, tax, or other professional advice. Please refer to your advisors for specific advice.
ey.com/privateequity
EY | Assurance | Tax | Transactions | Advisory
Top Related