


Languages
Pages
Legal


11th Quarterly Report to COAG Disability Reform Council 1 31 March 2016
National Disability Insurance Agency
Quarterly Report to COAG Disability Reform Council
31 March 2016

11th Quarterly Report to COAG Disability Reform Council 2 31 March 2016
Note: Data extracted 31 March 10pm AEST
Published: 30/04/2016
Contact: Sarah Johnson (Scheme Actuary)
Key definitions:
Access request A formal request by an individual for a determination of eligibility to access the
Scheme. This includes all requests and is not unique to single participants.
Active
participant
Active participants are those who are currently eligible, are not deceased and have
a client status of "Active".
Annualised
Package Cost
Approved Package Cost, pro-rated over a 12 month period to allow
like-for-like comparisons.
Culturally and
Linguistically
Diverse (CALD)
Country of birth is not Australia, UK, USA, Canada or South Africa,
or primary language spoken at home is not English.
Payments Payments made to providers, participants or their nominees for
supports received as part of the participant’s plan.
Committed
support
The cost of supports that are contained within a participant’s plan,
approved to be provided to support a participant’s needs.
In-kind
“In-kind” supports are existing Commonwealth or State/Territory
government programs delivered under existing block grant funding
arrangements.
Aboriginal
and/or Torres
Strait Islander
Response of:
Aboriginal but not Torres Strait Islander; or
Australian Aboriginal; or
Torres Strait Islander.
LAC
Local Area Coordinators conduct community capacity and
awareness building activities, and assist, if necessary, in the
coordination and sourcing of participant supports.
Participant An individual whose access request has been determined ‘eligible’.
State/Territory Based on the jurisdiction administering the participant.
11th Quarterly Report to COAG Disability Reform Council 3 31 March 2016
Introduction
This report to the COAG Disability Reform Council details the delivery of the National Disability Insurance
Scheme (NDIS) by the National Disability Insurance Agency (NDIA). The report contains three sections:
Part 1: A summary of progress against the Statement of Strategic Guidance
Part 2: A summary report on the management of Scheme cost drivers
Part 3: A report under the Integrated NDIS Performance Reporting Framework
11th Quarterly Report to COAG Disability Reform Council 4 31 March 2016
Part 1
Progress against Statement of Strategic Guidance

11th Quarterly Report to COAG Disability Reform Council 5 31 March 2016
1. Background
On 28 June 2013 the former Commonwealth Minister for Disability Reform issued the Statement of
Strategic Guidance to the National Disability Agency (NDIA) Board (available online at the NDIS website).
The statement was issued with the agreement of state and territory governments in accordance with
section 125 of the National Disability Insurance Scheme Act 2013 (NDIS Act).
The statement outlines government expectations of the Board and the NDIA for the duration of the trial
phase of the NDIS and transition to full scheme.
The statement also requests that the Board report against a set of ongoing and time-specific key
deliverables in each quarterly report. A report against the ongoing key deliverables is below. The next time
specific deliverables will be reported against is in June 2016.
Ongoing deliverables for period of trial – Update on progress
Deliverable: Status:
1. Provide regular information to governments, including through the quarterly report to the Ministerial Council (as set out in section 174 of the NDIS Act and the Integrated NDIS Performance Reporting Framework in the IGA), to give all jurisdictions visibility of the Agency’s service delivery and fiscal outcomes and whether the Agency is meeting agreed performance targets, and keep governments informed of implementation issues as they emerge
This is the Board’s eleventh Quarterly Report to COAG
Disability Reform Council (CDRC) (NDIS Act, s 174).
The Board also prepared an additional ‘Report on the
Sustainability of the NDIS’ for the eleventh quarter as part of
the Agency’s function to report on the sustainability of the
Scheme.
The Board has also provided market and participant
dashboards to the CDRC with more information on the
progress of the Scheme, since September 2015.
The Chair of the Board and the CEO appear before CDRC
meetings when required.
The Agency appears before the Joint Standing Committee
when required.
The Chair of the Board and the CEO continue to meet
regularly with shareholder governments to discuss the
ongoing roll out of the NDIS.
The Agency is supporting all jurisdictions to settle
arrangements for transition to full scheme. This includes
Schedule G of bilateral agreements for performance
reporting.
The Board has provided its Risk Management Framework to
the CDRC.
2. Maintain best practice standards of governance appropriate to the Agency, having regard to ANAO’s Public Sector Governance Better Practice Guides and ensuring Board members undertake their duties impartially with a high
All Board meetings are run in accordance with the NDIS Act,
the Public Governance, Performance and Accountability
2013 Act (PGPA Act) and the ANAO Public Sector
Governance Better Practice Guides.
The Board has established a Sustainability Committee, Audit,
Risk and Finance Committee, and an ICT Committee.
11th Quarterly Report to COAG Disability Reform Council 6 31 March 2016
Ongoing deliverables for period of trial – Update on progress
Deliverable: Status:
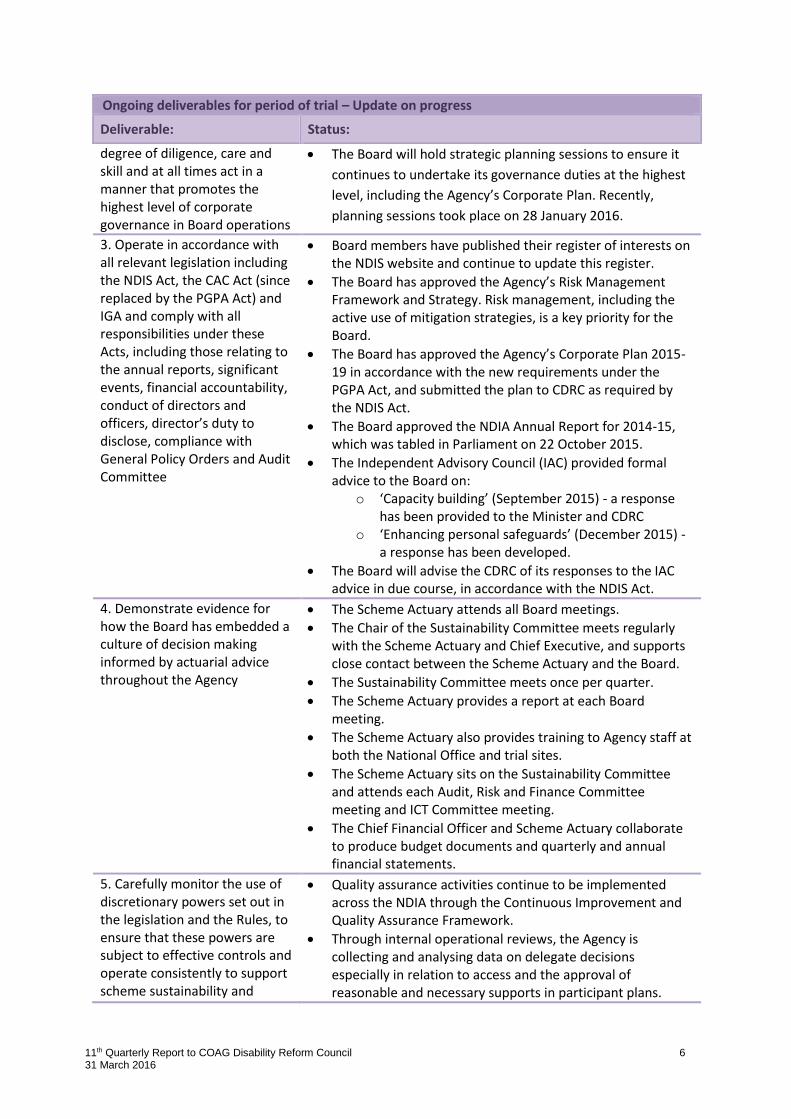
degree of diligence, care and skill and at all times act in a manner that promotes the highest level of corporate governance in Board operations
The Board will hold strategic planning sessions to ensure it
continues to undertake its governance duties at the highest
level, including the Agency’s Corporate Plan. Recently,
planning sessions took place on 28 January 2016.
3. Operate in accordance with all relevant legislation including the NDIS Act, the CAC Act (since replaced by the PGPA Act) and IGA and comply with all responsibilities under these Acts, including those relating to the annual reports, significant events, financial accountability, conduct of directors and officers, director’s duty to disclose, compliance with General Policy Orders and Audit Committee
Board members have published their register of interests on the NDIS website and continue to update this register.
The Board has approved the Agency’s Risk Management Framework and Strategy. Risk management, including the active use of mitigation strategies, is a key priority for the Board.
The Board has approved the Agency’s Corporate Plan 2015-19 in accordance with the new requirements under the PGPA Act, and submitted the plan to CDRC as required by the NDIS Act.
The Board approved the NDIA Annual Report for 2014-15, which was tabled in Parliament on 22 October 2015.
The Independent Advisory Council (IAC) provided formal advice to the Board on:
o ‘Capacity building’ (September 2015) - a response has been provided to the Minister and CDRC
o ‘Enhancing personal safeguards’ (December 2015) - a response has been developed.
The Board will advise the CDRC of its responses to the IAC advice in due course, in accordance with the NDIS Act.
4. Demonstrate evidence for how the Board has embedded a culture of decision making informed by actuarial advice throughout the Agency
The Scheme Actuary attends all Board meetings.
The Chair of the Sustainability Committee meets regularly with the Scheme Actuary and Chief Executive, and supports close contact between the Scheme Actuary and the Board.
The Sustainability Committee meets once per quarter.
The Scheme Actuary provides a report at each Board meeting.
The Scheme Actuary also provides training to Agency staff at both the National Office and trial sites.
The Scheme Actuary sits on the Sustainability Committee and attends each Audit, Risk and Finance Committee meeting and ICT Committee meeting.
The Chief Financial Officer and Scheme Actuary collaborate to produce budget documents and quarterly and annual financial statements.
5. Carefully monitor the use of discretionary powers set out in the legislation and the Rules, to ensure that these powers are subject to effective controls and operate consistently to support scheme sustainability and
Quality assurance activities continue to be implemented across the NDIA through the Continuous Improvement and Quality Assurance Framework.
Through internal operational reviews, the Agency is collecting and analysing data on delegate decisions especially in relation to access and the approval of reasonable and necessary supports in participant plans.

11th Quarterly Report to COAG Disability Reform Council 7 31 March 2016
Ongoing deliverables for period of trial – Update on progress
Deliverable: Status:
transparency in access to supports
These include desktop reviews of participant files and interviews with staff at trial sites.
The Agency also uses internal operational reviews to closely monitor the use of delegations, ensuring they are used appropriately and consistently across trial sites, having regard to local needs.
The Agency monitors and reviews the outcome of internal and external reviews of decisions and updates its processes and procedures in the light of this experience.
The Agency has developed a comprehensive set of operational guidelines to assist with consistency in decision making across the trial sites. These are reviewed and updated regularly, having regard to Agency experience including the outcome of internal and external reviews of decisions.

11th Quarterly Report to COAG Disability Reform Council 8 31 March 2016
Part 2
Summary Report on Management of Scheme Cost
Drivers

11th Quarterly Report to COAG Disability Reform Council 9 31 March 2016
1. Overview of cost drivers
The analysis below addresses a recommendation from the Council of Australian Government’s (COAG) May
2014 meeting - the NDIA Board is to outline in all Quarterly Reports the impact of past and future actions
intended to manage cost drivers and ensure the financial sustainability of the Scheme.
As outlined in the NDIA Strategic Plan 2013-16, one of the goals of the NDIA is to ensure that the NDIS is
financially sustainable and governed using insurance principles. Management of cost drivers is a key
component of the insurance approach. The insurance approach enforces strong monitoring of Scheme
experience, including actuarial analysis which compares actual experience with expected experience. This
detailed comparison allows cost pressures to be identified and addressed in a timely manner. Significant
training continues to be rolled out across the Agency to instil insurance principles within the Agency.
The Sustainability Committee has developed an Insurance Principles and Financial Sustainability Manual to
more formally articulate the concepts of insurance principles and financial sustainability within the NDIS,
and how these link to the NDIA Strategic Plan 2013-16. This document consolidates the process of
Prudential Governance of the cost drivers set out below, and the levers open to the Board to monitor and
manage financial sustainability. It should be noted that the financial sustainability of the Scheme is
determined by the interrelationship of all cost drivers; it is inappropriate to consider the performance of
any one cost driver in isolation.
At a high level, there are five categories of costs drivers which affect the financial sustainability of the
National Disability Insurance Scheme (NDIS). These are:
Access: how many people meet the access criteria to be a participant in the Scheme, and who is entitled to
a plan with supports funded or provided by the Scheme.
Scope: the scope of NDIS-funded supports that are available to be purchased by participants of the
Scheme, as opposed to supports that are not within the scope of the Scheme, for example, because they
are more appropriately funded or provided through other systems of service delivery like the health
system.
Volume: the resources available, for individual participants, to purchase supports within the scope of the
Scheme.
Delivery: the manner in which supports are funded or provided, and in particular how effectively,
efficiently and economically this is done.
Price: the price that it costs participants or the NDIA to purchase the supports that are funded by the
Scheme.

11th Quarterly Report to COAG Disability Reform Council 10 31 March 2016
2. Monitoring framework related to cost drivers
The National Disability Insurance Agency has developed a framework for monitoring cost drivers and
financial sustainability. This framework is summarised in the diagram below:
Specifically, the framework involves collecting data on the number of participants, the characteristics of
these participants (to allow analysis of reference groups), the outcomes for these participants, and the cost
of supports provided to participants. This allows a detailed understanding of deviations between actual and
expected experience and hence identification of cost drivers. This information can then be used by the
NDIA Board and NDIA management to implement any changes required to continue to ensure the NDIS
remains financially sustainable.
Monitoring and investigation of actual experience compared with expected experience are continuous
activities within the Agency. The Scheme Actuary prepares an annual report on the Scheme’s financial
sustainability. The 2014-15 Summary Financial Sustainability Report was released with the NDIA Annual
Report.
This Quarterly Report to COAG Council on Disability Reform contains a summary of performance related to
cost drivers (reported in Part 3), and a summary of key initiatives related to cost drivers.
Baseline assumptions and
projections
Monitoring of actual experience
compared with expected
experience
Investigate emerging trends and experience
Incorporate emerging
experience into assumptions and
projections
Monitoring scheme financial
sustainability (Actuarial
control cycle)
Participant outcomes and scheme costs
Factors contributing to deviations
Mainstream services
Family and friends
GeographyCommunity
inclusiveness
Participant characteristics (e.g. reference
groups)
Service Providers
Availability of supports
Cost of supports

11th Quarterly Report to COAG Disability Reform Council 11 31 March 2016
3. Summary of key initiatives related to cost drivers
During the 2015-16 reporting period, the NDIA has committed significant resources to the design of the
National Disability Insurance Scheme operations required for the rollout of full scheme. This design work
builds on the lessons from the NDIS trial, including the initiatives implemented related to cost drivers. In
particular:
The streamlining of access for full scheme participants through the use of existing data from State,
Territory and Commonwealth governments.
The allocation of funding in participant plans to outcome categories. This improves the understanding
of the purpose of funding, increases participant choice and control over how those outcomes are
achieved, and encourages sector innovation in service delivery.
Earlier capture of actuarial data, and improved use of the NDIS reference packages. Reference packages
provide a benchmark for scheme costs, and ensure that decisions are considered by a financial delegate
appropriate to the level of risk.
Increased use of support to assist participants in implementing their plan, including the engagement of
providers and linkages to community and mainstream services.
Development of a fit-for-purpose ICT system, in partnership with Commonwealth Department of
Human Services.
Development of the Early Childhood Early Intervention (ECEI) approach to better support children with
a disability.
Development of the School Leaver Employment Support (SLES) initiative to better support school
leavers with a disability obtain employment.
The below table summarises key initiatives that have been implemented by NDIA during the trial period.
Cost Driver Key Initiatives Implemented by Agency
Streamlining access Implementation of risk-based segmentation to streamline access and planning for participants in Western Australia, Northern Territory and Australian Capital Territory. This was reviewed after three months and improvements put in place.
The Agency has matured its use of data from existing State/Territory and Commonwealth programs to proactively approach potential participants. This has resulted in a more efficient and reliable phasing process, and where appropriate, pre-determined eligibility for some applicants.
Trial sites undertake regular reviews of decisions to check for local consistency. The National Quality and Innovation Team audit’s decisions and monitors national consistency.
Detailed analysis of participants who have been found ineligible is undertaken to provide some indications of where possible cost pressures may arise.
A detailed review of access for people with psychosocial disability is currently underway.
Weekly operational dashboards have been put in place, which allow timely monitoring of Scheme performance. Further, daily work in progress reports assist staff to best manage workflows.

11th Quarterly Report to COAG Disability Reform Council 12 31 March 2016
Cost Driver Key Initiatives Implemented by Agency
A National Access Team has been established to improve the consistency of decision making, and to improve the staff coverage in response to peaks and troughs in work queues.
An increased operational focus on the collection of integral actuarial data has been embedded in the National Access Team. Operational reporting has been implemented to monitor the compliance in the capture of these data.
The introduction of the ECEI approach to better support the pathways of children with a disability into mainstream and community services as well as the NDIS.
Scope of supports funded under the Scheme
A comparative review of supports funded under the NDIS versus those proposed by the Productivity Commission indicated that the scope of supports is in line.
Establishment of expert groups in autism and sensory disability to determine the evidence base for funding appropriate early intervention options for children.
Focusing the planning conversation on the availability of community and mainstream support to meet the needs of participants before consideration of funded supports. This also encourages innovative ways for individuals to achieve desired outcomes.
Supports funded in participant plans are being classified as core, capacity or capital, improving visibility of the expected purpose and duration of the support’s funding. The inclusion of capacity and capital supports indicate active work to improve participant outcomes, and in some cases, reduce the intensity of future core supports.
The NDIA has provided input (through the Inter-jurisdictional Mainstream Interface Working Group) to the review of the COAG Applied Principles and Tables of support that determine the responsibilities of the NDIS and other service systems. The findings of this review will assist in construction of appropriate operational guidelines in relation to funding of supports.
The NDIA has redefined the supports funded to align to the NDIA Outcomes Framework. This reclassification increases the emphasis of the NDIA as funding participant outcomes, and increases the choice and control of participants in the delivery of those outcomes. Reporting and historical support catalogues have been updated to ensure consistency in longitudinal analyses.
Volume of supports funded
Substantial research has been undertaken to refine reference packages – reference packages provide a benchmark amount for participants with similar characteristics (such as age, disability, and level of functional ability). This allows detailed monitoring of the amount of supports provided to certain groups of participants, and identification of any cost pressures in a timely manner. It is important to note that the reference packages are not used to determine the amount provided to individual participants but allow for detailed monitoring. The piloting of reference packages commenced February 2015.

11th Quarterly Report to COAG Disability Reform Council 13 31 March 2016
Cost Driver Key Initiatives Implemented by Agency
This project has allowed streamlining of the planning process by collecting much information in advance of these discussions. The outputs of these projects is now informing the design of the full Scheme operating model of the NDIA, with increased emphasis on the early capture of reference package information.
Operational guidelines providing information on reasonable and necessary supports assist in the planning process in allocation of resources.
The ICT system has been modified to escalate funded plans that vary (both positively and negatively) from the benchmarks in the reference packages to staff with higher delegations. This is to ensure that decisions deemed a higher financial risk are determined by an appropriately experienced officer.
A simplification of the support catalogue has reduced the need for additional supports and funding to be included in plans. Historically, these additional supports were included for use in the event that planned supports were unexpectedly required at different times of the day.
Monthly dashboards monitoring the amount of supports provided by services providers have been developed.
Delivery of supports funded
A pilot of the NDIA outcomes framework was conducted through January, February and March 2015. The results of the pilot, along with feedback from consultation with the disability sector have been used to improve the framework. The need to develop a shorter form to assist in participant planning arose from this pilot. The outcomes framework will provide the NDIA Board with a dynamic feedback loop to evaluate the outcomes of particular groupings of Scheme participants, and the extent to which the NDIA is meeting its strategic objectives. A report on the outcomes of the pilot study has been publicly released: http://www.ndis.gov.au/search/node/outcomes%20framework
The implementation of the outcomes framework short form, and the aligning of participant funding to its domains, occurred August 2015. This will encourage the delivery of supports to strive towards achieving positive outcomes for participants, their families and carers. Further enhancements to the Short Form Outcomes Framework have been included into its operationalised form.
Participant flexibility in the choice and consumption of allocated funding has been delivered through the “bundling” of similar supports. Providing increased flexibility has also reduced the need to choose a wider range of fixed supports in participant plans.
Work to simplify the catalogue of supports to be outcomes that are focused and encourage more innovation is complete, and was implemented in August 2015.
Enhancements to the ICT system allow participants to monitor expenditure against their plan, and to invoice online for self-purchased supports.
Work is underway to develop strategies and models of support for Indigenous communities, rural and remote communities, culturally
11th Quarterly Report to COAG Disability Reform Council 14 31 March 2016
Cost Driver Key Initiatives Implemented by Agency
and linguistically diverse (CALD) communities, and for participants with psychosocial disability.
In order to better understand links with other service systems and the use of mainstream supports, the NDIA is applying to be an accredited Data Integration Authority.
It is critical that the NDIA has developed a fit for purpose ICT System for full Scheme roll out. A Board Committee has been formed to provide enhanced governance of this crucial component of managing cost drivers.
System improvements implemented to improve monitoring and reconciliation of supports delivered under Commonwealth, State and Territory “in-kind” funding arrangements.
Quarterly participant and market dashboards have been developed and are being publicly released with these quarterly reports.
The development of the SLES initiative to better support school leavers into employment.
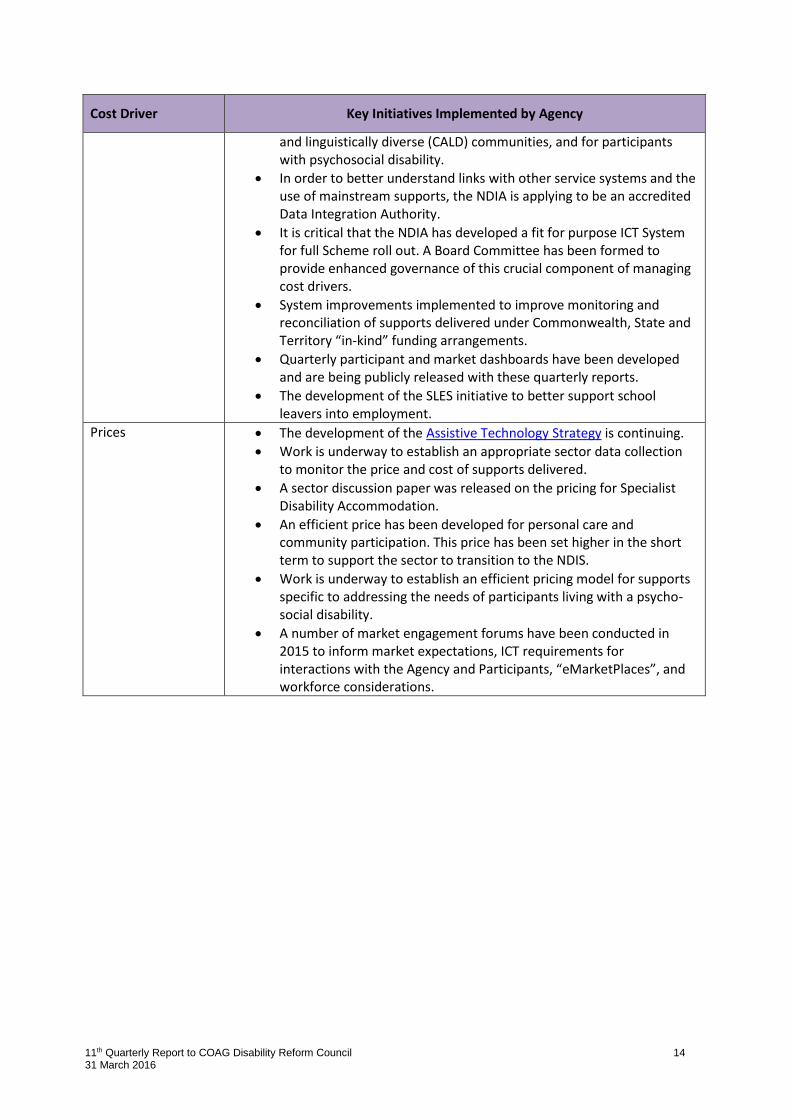
Prices The development of the Assistive Technology Strategy is continuing.
Work is underway to establish an appropriate sector data collection to monitor the price and cost of supports delivered.
A sector discussion paper was released on the pricing for Specialist Disability Accommodation.
An efficient price has been developed for personal care and community participation. This price has been set higher in the short term to support the sector to transition to the NDIS.
Work is underway to establish an efficient pricing model for supports specific to addressing the needs of participants living with a psycho-social disability.
A number of market engagement forums have been conducted in 2015 to inform market expectations, ICT requirements for interactions with the Agency and Participants, “eMarketPlaces”, and workforce considerations.
11th Quarterly Report to COAG Disability Reform Council 15 31 March 2016
Part 3
Report under the Integrated NDIS Performance
Reporting Framework

11th Quarterly Report to COAG Disability Reform Council 16 31 March 2016
Index of Part 3 tables
Table 1.1.1. Information about participants with approved plans ................................................................................................................................. 31
Table 1.1.1(a). Information about participants with approved plans, split by gender and age ...................................................................................... 31
Table 1.1.1(b). Information about participants with approved plans, split by primary disability ................................................................................... 32
Table 1.1.2. Support needs for participants with approved plans by life domain .......................................................................................................... 33
Table 1.1.2(a) Support needs for participants with approved plans by life domain, split by State/Territory ................................................................. 33
Table 1.1.2(b). Support needs for participants with approved plans by life domain, split by primary disability ............................................................ 34
Table 1.2.1. Number of participant plans with each funded support category .............................................................................................................. 35
Table 1.2.1(a). Number of participant plans with each funded support category, split by State/Territory .................................................................... 35
Table 1.2.1(b). Number of participant plans with each funded support category, split by primary disability ................................................................ 36
Table 1.2.2. Delivery of agreed supports as planned ...................................................................................................................................................... 37
Table 1.2.2(a). Delivery of agreed supports as planned, split by State/Territory ........................................................................................................... 37
Table 1.2.2(b). Delivery of agreed supports as planned, split by primary disability ....................................................................................................... 38
Table 1.2.3. Proportion of participants with payments, by plan length and State/Territory .......................................................................................... 40
Table 1.2.4. Proportion of plans approved within 90 days of access request ................................................................................................................. 40
Table 1.2.5. Service provider characteristics and market profile .................................................................................................................................... 41
Table 1.3.1. Trends in the proportion of participants using each, or a combination, of plan management options ...................................................... 42
Table 1.3.2. Access requests made ................................................................................................................................................................................. 43
Table 1.3.2(a). Access requests made ............................................................................................................................................................................ 43
Table 1.3.2(b) Proportions of access requests made ...................................................................................................................................................... 43
Table 1.3.3. Reviews of decisions (internal) ................................................................................................................................................................... 44
Table 1.3.4. Total appeals by outcome with the Administrative Appeals Tribunal (AAT) ............................................................................................... 44
Table 1.3.5. Appeals by Category with the AAT .............................................................................................................................................................. 45
Table 1.3.6. Complaints by outcome .............................................................................................................................................................................. 45
Table 1.3.7. Complaint type ........................................................................................................................................................................................... 46
Table 1.3.8(a) Participant/Carer/Family satisfaction with the Agency and life experience ............................................................................................ 46
Table 1.3.8(b) Participant/ Carer/ Family satisfaction with the Agency ......................................................................................................................... 46
Table 2.1.1 Total amount of committed supports .......................................................................................................................................................... 48
Table 2.1.2. Total payments ($, in-kind) ......................................................................................................................................................................... 49
Table 2.1.3 Operating Expenses Ratio (% total costs) ..................................................................................................................................................... 49
Table 2.1.4 Annualised support package distributions ................................................................................................................................................... 50
Table 2.1.5 Proportion of participants with approved plans receiving support within 180 days of access request ....................................................... 51
Table 2.1.6. Payments to providers and participants split by support cluster – since 1 July 2013 ................................................................................. 52
Table 2.1.7. Average and median costs of individual support packages ......................................................................................................................... 53
Table 2.1.8. Value of and number of active approved packages by participant group – since 1 July 2013 .................................................................... 53
Table 2.1.9. Number of participants receiving supports paid for with cash and/or in-kind supports by State/Territory ............................................... 54
Table 2.1.10. Ratio of cash to in-kind services by State/Territory .................................................................................................................................. 54
Table 2.1.11. Participant numbers ................................................................................................................................................................................. 55
Table 2.1.11(a). Participant numbers, split by gender, CALD and Aboriginal and/or Torres Strait Islander status ......................................................... 55
Table 2.1.11(c). Participant numbers, split by age and site ............................................................................................................................................ 56
Table 2.1.11(b). Participant numbers, split by primary disability ................................................................................................................................... 56
Table 2.1.12. Total number of plans developed ............................................................................................................................................................. 57
11th Quarterly Report to COAG Disability Reform Council 17 31 March 2016
Table 2.1.13. Number of plans with single supports ...................................................................................................................................................... 57
Table 3.1.1. Proportion of participants accessing mainstream services ......................................................................................................................... 58
Table 3.1.2. Support categories with mainstream services ............................................................................................................................................ 58
Table 3.2.1. Community awareness activities undertaken within the period by LACs ................................................................................................... 60
Table 3.3.1. Community capacity building activities undertaken by LACs within the period .......................................................................................... 63

11th Quarterly Report to COAG Disability Reform Council 18 31 March 2016
Agency Performance
Overview
This section provides an overview of agency performance as at 31 March 2016 across the seven trial sites.
The seven locations are:
The Hunter trial site – Newcastle, Lake Macquarie, and Maitland Local Government Areas (LGAs) in
New South Wales.
The Barwon trial site – Greater Geelong, Surf Coast, Queenscliff and Colac-Otway LGAs in Victoria.
The South Australian trial site – 0-14 year olds.
The Tasmanian trial site – 15-24 year olds.
The first four trial sites commenced on 1 July 2013, the following three commenced on 1 July 2014:
The Australian Capital Territory trial site.
The Perth Hills trial site - Swan, Kalamunda and Mundaring LGAs in Western Australia.
The Barkly region trial site in the Northern Territory.
In addition to the seven trial sites, transition to full Scheme commenced in Nepean Blue Mountains in New
South Wales on 1 July 2015. The LGAs in the site are Blue Mountains, Hawkesbury, Lithgow and Penrith.
Information on this site is also included in this section and throughout the report.
There are five further NDIS sites not included in this report:
Concurrent trials are underway in the South West and Cockburn-Kwinana in Western Australia
based on the Western Australia NDIS My Way Model. Information on these trials are not included
in this report. Information on the Western Australia NDIS My Way Model trial sites are published
separately by the Western Australian Disability Services Commission.
In March 2016 transition to full scheme commenced in Townsville, Palm Island and Charters Towers
in Queensland. At 31 March 2016, there were 16 participants in Queensland.
Access requests
34,325 access requests to the Scheme have been made by individuals, with 29,273 people currently
eligible1 for the Scheme (85.2% of access requests), and 2,289 people (6.7%) found ineligible (this falls to
5.6% when ineligibility due to age and residency requirements are excluded). Only 211 (0.6%) of these
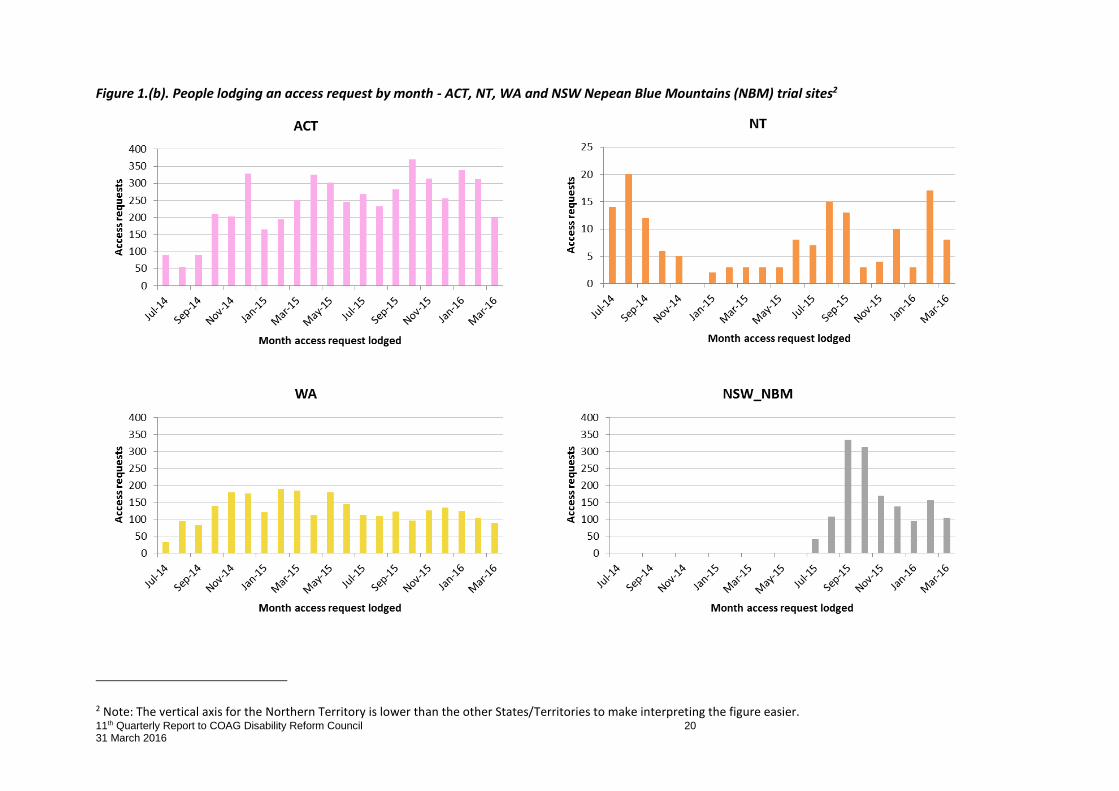
access request decisions have been requested to be internally reviewed. Figures 1 (a) and (b) show the
numbers of people lodging access requests since July 2013. Access requests by month are in line with the
individual jurisdiction’s phasing arrangements, documented in the bilateral agreements.
1 Note: 29,769 participants have ever been found eligible for the Scheme. However, 424 participants are now inactive.

11th Quarterly Report to COAG Disability Reform Council 19 31 March 2016
Figure 1.(a). People lodging an access request by month – NSW Hunter (HTR), SA, TAS and VIC trial sites
11th Quarterly Report to COAG Disability Reform Council 20 31 March 2016
Figure 1.(b). People lodging an access request by month - ACT, NT, WA and NSW Nepean Blue Mountains (NBM) trial sites2
2 Note: The vertical axis for the Northern Territory is lower than the other States/Territories to make interpreting the figure easier.

11th Quarterly Report to COAG Disability Reform Council 21 31 March 2016
Participants
Of the 29,769 active and inactive participants3, 24,866 have received an approved plan. Of the participants
with approved plans, 5.5% are Aboriginal and/or Torres Strait Islander and 4.2% are Culturally and
Linguistically Diverse (CALD). These percentages are consistent with those reported in the December 2015
quarter. The number of participants identifying as Aboriginal and/or Torres Strait Islander is largely in line
with expectations, with only Tasmania, South Australia and Western Australia being below expectation. All
sites have lower than expected CALD participants.
‘Autism and related disorders’ is the most common primary disability across all sites (31% of participants
nationally), noting that the age-specific sites are included in this figure. In South Australia, 48% of
participants have Autism and related disorders listed as their primary disability due to the very young
cohort of participants (0-6 year olds). In Tasmania, intellectual disability (including Down syndrome and
other intellectual/learning disability) is the most prevalent primary disability at 50%, due to the young adult
cohort (15-24 years). In New South Wales (Hunter) and Victoria, the two sites established in 2013-14 and
inclusive of all ages, intellectual disability and Autism and related disorders are the most prevalent primary
disabilities (25% and 23% respectively across the two sites). These sites also demonstrate higher
proportions of participants with psychosocial and degenerative disabilities, reflecting the adult cohort in
the trial population.
A number of participants in the NDIS received funded supports from existing Commonwealth and
State/Territory disability programs –54% of active participants, down from 55% last quarter. Other
participants entering the NDIS have not received any disability services before, either due to unmet need or
new incidence –46% of active participants. There are 24,535 active participants with approved plans, of
whom, 14,426 (58%) were found eligible for the Scheme because they met the disability requirements
(section 24 of the NDIS Act), and 10,109 (41%) participants met the early invention requirements (section
25 of the NDIS Act). Note: there are a small proportion (1%) of participants who met the early intervention
requirements and now meet the disability requirements. Participants in the younger age groups
(particularly 0-12 year olds) often meet the early intervention requirements rather than the disability
requirements. A small proportion of participants aged 13-18 have entered the Scheme because they meet
the early intervention requirements. From age 19 onwards almost all participants meet the disability
requirements.
3 Active participants are those who are currently eligible, are not deceased and have a client status of "Active". Inactive participants are all other participants, including participants who are now deceased or have chosen to exit the Scheme, as well as participants who have had their eligibility revoked.

11th Quarterly Report to COAG Disability Reform Council 22 31 March 2016
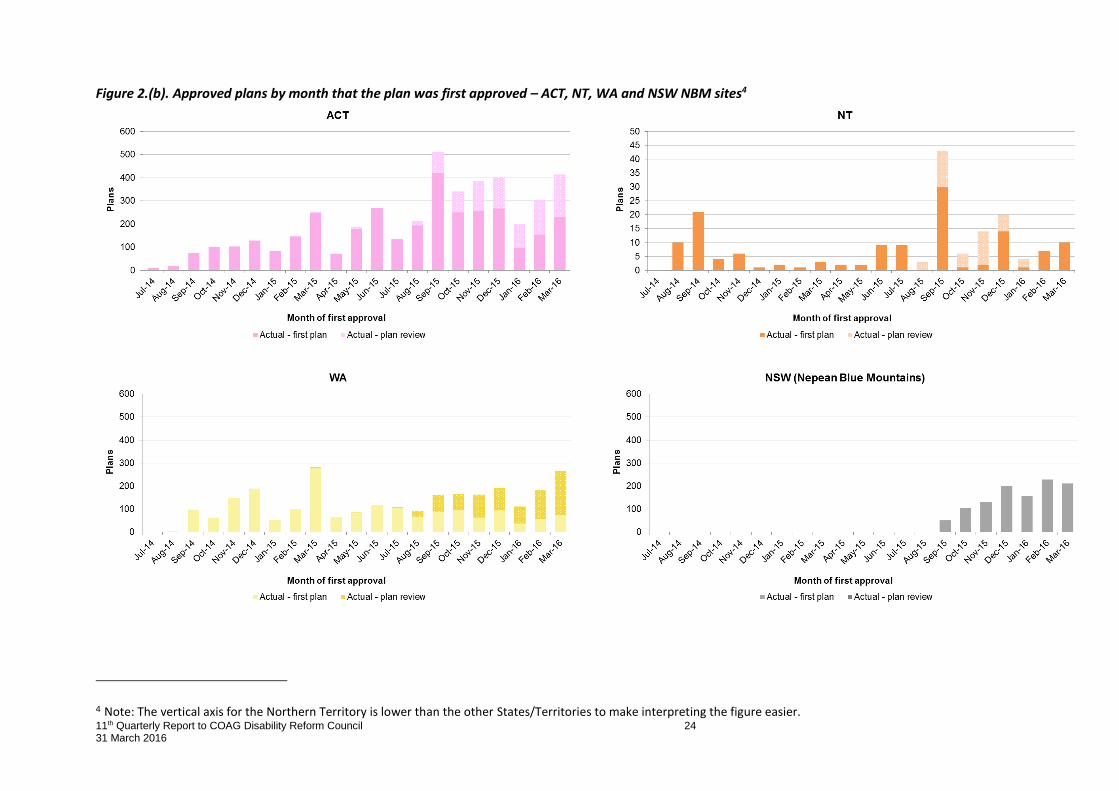
Plans
43,946 plans have been approved to date, including 15,872 second plans, 15,441 third plans, 1,080 fourth
plans, and 50 fifth plans. These plans are likely to include a focus on supporting participants with their goals
across independence, social participation and/or health & wellbeing. They are also likely to contain multiple
funded supports (81% of plans). Overall the most common funded supports in dollar terms are assistance
with daily life and then improved daily living skills. This order is reversed in South Australia and Nepean
Blue Mountains, where there is an increased focus on capacity building in the early intervention cohorts.
These plans are mostly solely agency managed (58%). There are 35% which use a combination of agency
management and self-management, and 7% are solely self-managed. Note: the management of the plan in
this instance refers to the financial management of the plan. Participants can self-direct their supports
whilst the agency manages the financial side of the plan.

11th Quarterly Report to COAG Disability Reform Council 23 31 March 2016
Figure 2.(a). Approved plans by month that the plan was first approved – NSW HTR, SA, TAS and VIC sites
11th Quarterly Report to COAG Disability Reform Council 24 31 March 2016
Figure 2.(b). Approved plans by month that the plan was first approved – ACT, NT, WA and NSW NBM sites4
4 Note: The vertical axis for the Northern Territory is lower than the other States/Territories to make interpreting the figure easier.

11th Quarterly Report to COAG Disability Reform Council 25 31 March 2016
In addition to supports provided through plans, 90% of participants are also accessing mainstream services
(up from 89% last quarter). A large number of these mainstream services include services related to
education (52%) or community related activities (50%5).
Figure 3. Types of mainstream supports accessed in participants’ plans
Committed funds
Overall, $2 billion has been committed for participant support costs to date, with $799.4 million and $496.7
million committed in the New South Wales (Hunter) and Victorian sites respectively (noting $214.4 million
and $45.5 million have been committed to participants in the Stockton and Kanangra large residences in
the New South Wales trial site, and the Colanda large residence in the Victorian trial site respectively).
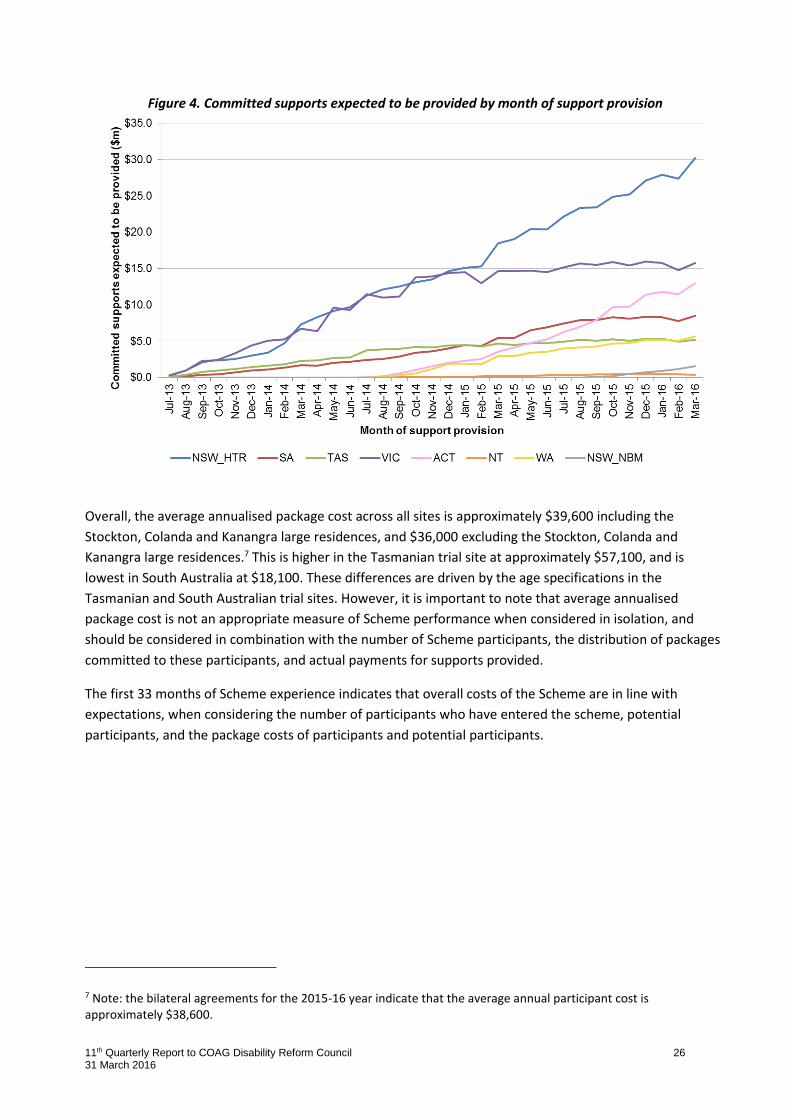
Figure 4 shows the committed support expected to be provided each month by State/Territory.
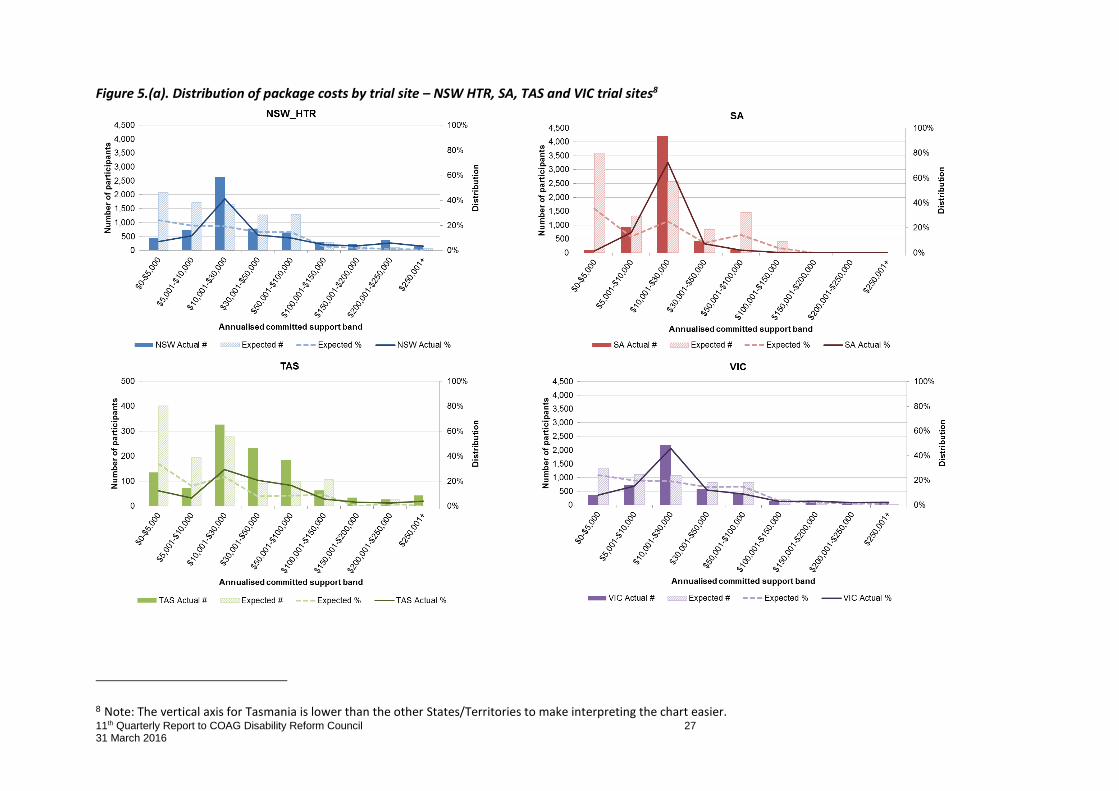
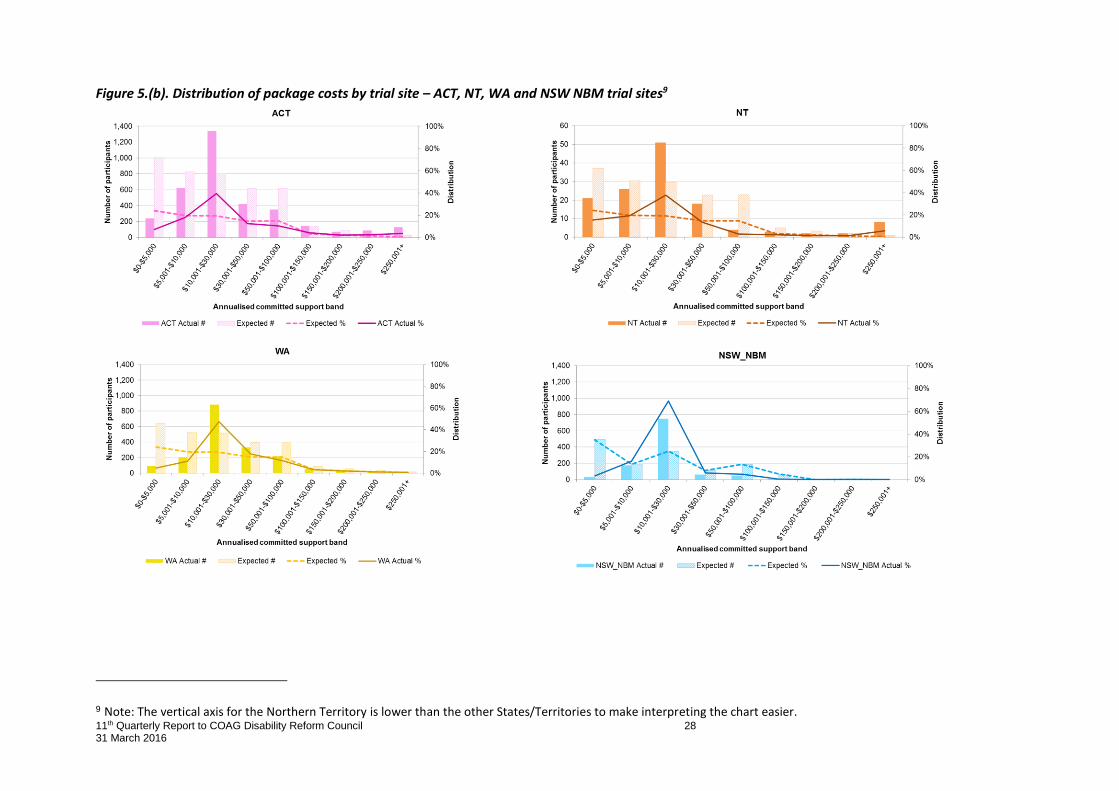
A significant proportion of support costs are allocated to a very small proportion of high-cost participants –
only 10% of participants have an annualised package cost over $100,000, but these participants account for
50% of total committed supports.6 On the other hand, 71% have an annualised package cost below
$30,000, and account for only 25% of annualised committed funding.
5 Note 48% is comprised of mainstream categories ‘community and social life’ and ‘community-social and civic’. Plans with supports that fall into the latter are included in the ‘other’ category displayed in the graph. 6 Committed support is the dollar amount of support that has been made available to participants in their statements of support.
11th Quarterly Report to COAG Disability Reform Council 26 31 March 2016
Figure 4. Committed supports expected to be provided by month of support provision
Overall, the average annualised package cost across all sites is approximately $39,600 including the
Stockton, Colanda and Kanangra large residences, and $36,000 excluding the Stockton, Colanda and
Kanangra large residences.7 This is higher in the Tasmanian trial site at approximately $57,100, and is
lowest in South Australia at $18,100. These differences are driven by the age specifications in the
Tasmanian and South Australian trial sites. However, it is important to note that average annualised
package cost is not an appropriate measure of Scheme performance when considered in isolation, and
should be considered in combination with the number of Scheme participants, the distribution of packages
committed to these participants, and actual payments for supports provided.
The first 33 months of Scheme experience indicates that overall costs of the Scheme are in line with
expectations, when considering the number of participants who have entered the scheme, potential
participants, and the package costs of participants and potential participants.
7 Note: the bilateral agreements for the 2015-16 year indicate that the average annual participant cost is approximately $38,600.
11th Quarterly Report to COAG Disability Reform Council 27 31 March 2016
Figure 5.(a). Distribution of package costs by trial site – NSW HTR, SA, TAS and VIC trial sites8
8 Note: The vertical axis for Tasmania is lower than the other States/Territories to make interpreting the chart easier.
11th Quarterly Report to COAG Disability Reform Council 28 31 March 2016
Figure 5.(b). Distribution of package costs by trial site – ACT, NT, WA and NSW NBM trial sites9
9 Note: The vertical axis for the Northern Territory is lower than the other States/Territories to make interpreting the chart easier.

11th Quarterly Report to COAG Disability Reform Council 29 31 March 2016
Payments made
77% of participants with funded supports have had at least one payment against their plan (84% of those
with plans active for three months or more).10
Payments made for participant supports total $91.3 million for supports provided in 2013-14 (65% of
committed support11 in this year), $372.7 million for supports provided during 2014-15 (74% of committed
support in this year), and $421.0 million for supports provided in 2015-16 (69% of committed support to 31
March 2016). Note: payments to date include in-kind support reconciled off the system and adjustments
for capital items committed in one financial year but provided in a different financial year, and that work is
underway on the 2015-16 in-kind off-system reconciliation.
The largest amounts overall have been paid for assistance with daily life at home, in the community,
education and at work (includes supported independent Living) ($473 million) and improved daily living
skills ($118 million). $612 million has been paid in cash, and $97.5 million has been paid in-kind (or $272.8
million if the off-system payments are included).12
Note: there will be a lag between supports being provided and subsequently invoiced by service providers.
This is particularly relevant for support provided in the most recent months.
Service providers
There are 2,377 registered service providers, of whom:
2,288 (96%) operate in one State/Territory only.
865 (36%) are individual/sole traders and 584 (26%) are private sector companies.
These service providers have received a total of $645 million for participant supports, which is 91% of the
total payments made to date. The remaining $63.9 million has been paid to participants who are self-
managing.13
Participant satisfaction
Of the 2,011 participants surveyed for their satisfaction, the majority are highly satisfied with the Agency,
with an overall rating of 1.63 on a scale of -2 (very poor) to +2 (very good), with slightly lower levels of
10 Note: These percentages are will be affected by in-kind payments reconciled offline and not able to be attributed to a participant. 11 Committed support is the dollar amount of support that has been made available to participants in their statements of support. 12 Note: the catalogue of supports was modified on 1 August 2015. This has resulted in the changes to the categories of support. The reporting reflects this change. 13 Not including the off-system payments and including a small amount of funding paid directly to providers by the Agency.

11th Quarterly Report to COAG Disability Reform Council 30 31 March 2016
satisfaction in South Australia, the Australian Capital Territory, and Western Australia. The overall
satisfaction rating is calculated as a weighted average of the satisfaction ratings of each participant
surveyed. Participants are contacted by a member of the engagement team after their plan is agreed with
their planner; not all participants choose to complete and submit their survey. The participant’s responses
remain anonymous to their planners.
To date there have been 63 appeals with the Administration Appeal Tribunal – 19 due to access issues
(0.06% of all access requests), and 44 due to plan issues (0.14% of all active and inactive14 participants with
an approved plan). Of these appeals, 47 have reached a resolution – 25 have been varied (participant won
the appeal) and the other 22 have been dismissed, withdrawn or affirmed (the original decision confirmed).
14 Active participants are those who are currently eligible, are not deceased and have a client status of "Active". Inactive participants are all other participants, including participants who are now deceased or have chosen to exit the Scheme, as well as participants who have had their eligibility revoked.
11th Quarterly Report to COAG Disability Reform Council 31 31 March 2016
1. Participant outcomes
1.1. People with disability achieve their goals for independence, social and economic
participation
This section provides some descriptive information on participants in the Scheme, including their support
needs. The measures specified in the COAG Integrated Performance Framework are reported where
possible.
Work is underway to implement an outcomes framework, which will allow the Agency to report against
Scheme outcomes. More information on the outcomes framework can be found at:
http://www.ndis.gov.au/document/outcomes-framework-pilot
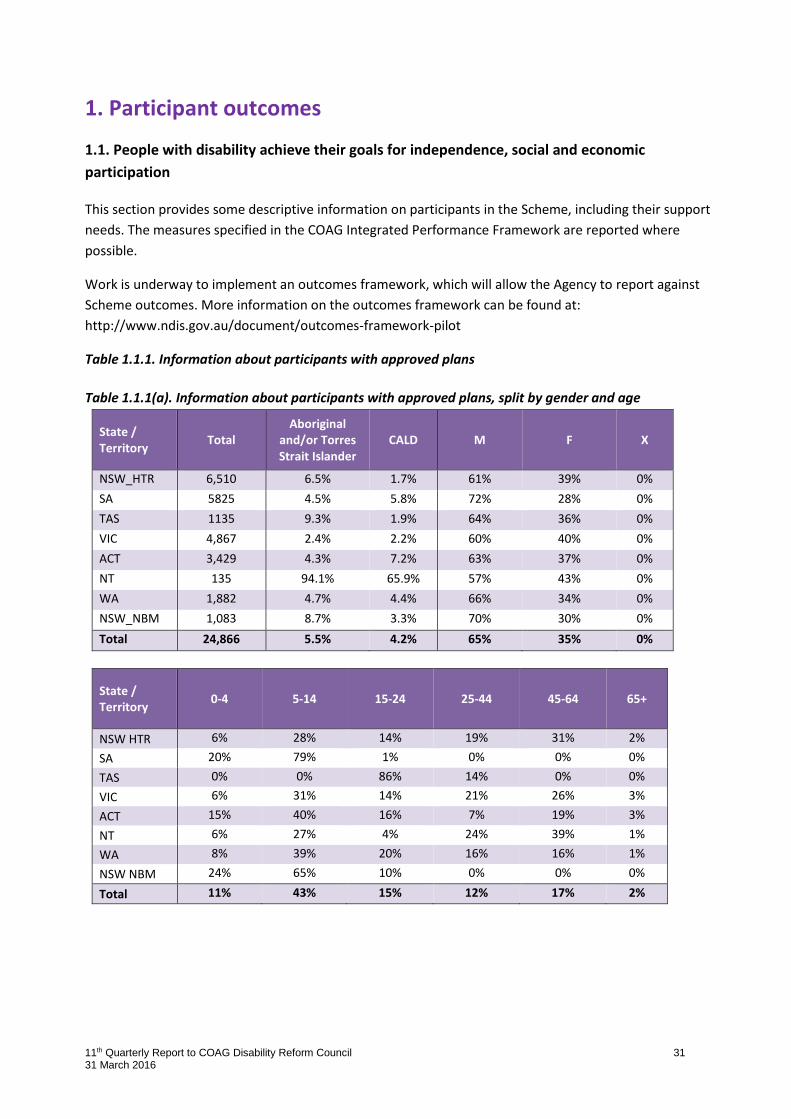
Table 1.1.1. Information about participants with approved plans
Table 1.1.1(a). Information about participants with approved plans, split by gender and age
State / Territory
Total Aboriginal
and/or Torres Strait Islander
CALD M F X
NSW_HTR 6,510 6.5% 1.7% 61% 39% 0%
SA 5825 4.5% 5.8% 72% 28% 0%
TAS 1135 9.3% 1.9% 64% 36% 0%
VIC 4,867 2.4% 2.2% 60% 40% 0%
ACT 3,429 4.3% 7.2% 63% 37% 0%
NT 135 94.1% 65.9% 57% 43% 0%
WA 1,882 4.7% 4.4% 66% 34% 0%
NSW_NBM 1,083 8.7% 3.3% 70% 30% 0%
Total 24,866 5.5% 4.2% 65% 35% 0%
State / Territory
0-4 5-14 15-24 25-44 45-64 65+
NSW HTR 6% 28% 14% 19% 31% 2%
SA 20% 79% 1% 0% 0% 0%
TAS 0% 0% 86% 14% 0% 0%
VIC 6% 31% 14% 21% 26% 3%
ACT 15% 40% 16% 7% 19% 3%
NT 6% 27% 4% 24% 39% 1%
WA 8% 39% 20% 16% 16% 1%
NSW NBM 24% 65% 10% 0% 0% 0%
Total 11% 43% 15% 12% 17% 2%
11th Quarterly Report to COAG Disability Reform Council 32 31 March 2016
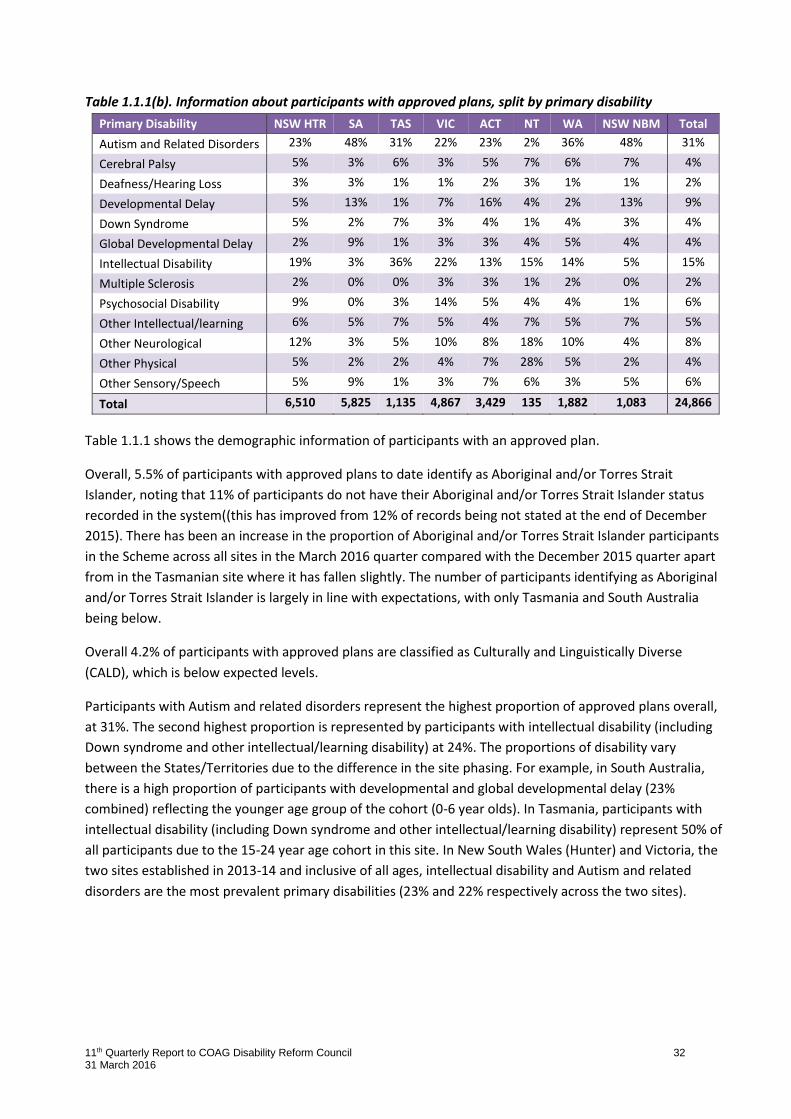
Table 1.1.1(b). Information about participants with approved plans, split by primary disability
Primary Disability NSW HTR SA TAS VIC ACT NT WA NSW NBM Total
Autism and Related Disorders 23% 48% 31% 22% 23% 2% 36% 48% 31%
Cerebral Palsy 5% 3% 6% 3% 5% 7% 6% 7% 4%
Deafness/Hearing Loss 3% 3% 1% 1% 2% 3% 1% 1% 2%
Developmental Delay 5% 13% 1% 7% 16% 4% 2% 13% 9%
Down Syndrome 5% 2% 7% 3% 4% 1% 4% 3% 4%
Global Developmental Delay 2% 9% 1% 3% 3% 4% 5% 4% 4%
Intellectual Disability 19% 3% 36% 22% 13% 15% 14% 5% 15%
Multiple Sclerosis 2% 0% 0% 3% 3% 1% 2% 0% 2%
Psychosocial Disability 9% 0% 3% 14% 5% 4% 4% 1% 6%
Other Intellectual/learning 6% 5% 7% 5% 4% 7% 5% 7% 5%
Other Neurological 12% 3% 5% 10% 8% 18% 10% 4% 8%
Other Physical 5% 2% 2% 4% 7% 28% 5% 2% 4%
Other Sensory/Speech 5% 9% 1% 3% 7% 6% 3% 5% 6%
Total 6,510 5,825 1,135 4,867 3,429 135 1,882 1,083 24,866
Table 1.1.1 shows the demographic information of participants with an approved plan.
Overall, 5.5% of participants with approved plans to date identify as Aboriginal and/or Torres Strait
Islander, noting that 11% of participants do not have their Aboriginal and/or Torres Strait Islander status
recorded in the system((this has improved from 12% of records being not stated at the end of December
2015). There has been an increase in the proportion of Aboriginal and/or Torres Strait Islander participants
in the Scheme across all sites in the March 2016 quarter compared with the December 2015 quarter apart
from in the Tasmanian site where it has fallen slightly. The number of participants identifying as Aboriginal
and/or Torres Strait Islander is largely in line with expectations, with only Tasmania and South Australia
being below.
Overall 4.2% of participants with approved plans are classified as Culturally and Linguistically Diverse
(CALD), which is below expected levels.
Participants with Autism and related disorders represent the highest proportion of approved plans overall,
at 31%. The second highest proportion is represented by participants with intellectual disability (including
Down syndrome and other intellectual/learning disability) at 24%. The proportions of disability vary
between the States/Territories due to the difference in the site phasing. For example, in South Australia,
there is a high proportion of participants with developmental and global developmental delay (23%
combined) reflecting the younger age group of the cohort (0-6 year olds). In Tasmania, participants with
intellectual disability (including Down syndrome and other intellectual/learning disability) represent 50% of
all participants due to the 15-24 year age cohort in this site. In New South Wales (Hunter) and Victoria, the
two sites established in 2013-14 and inclusive of all ages, intellectual disability and Autism and related
disorders are the most prevalent primary disabilities (23% and 22% respectively across the two sites).

11th Quarterly Report to COAG Disability Reform Council 33 31 March 2016
Table 1.1.2. Support needs for participants with approved plans by life domain
Table 1.1.2(a) Support needs for participants with approved plans by life domain, split by State/Territory1516
State Community,
Social and Civic Participation
Daily living Education Employment Health and Wellbeing
Home Living
Independence
Relationships Total Plans
NSW HTR 1,011 6,256 40 801 1,161 650 3,748 938 6,366
SA 169 5,793 70 1 301 110 843 354 5,794
TAS 351 1,059 85 245 184 60 491 108 1,083
VIC 1,168 4,685 51 647 1,030 695 3,070 851 4,746
ACT 795 3,356 135 239 603 431 2,124 384 3,391
NT 16 124 0 3 41 9 93 1 132
WA 321 1,836 45 250 261 154 1,146 210 1,853
NSW NBM 126 1,071 5 17 12 35 181 18 1,072
Total 3,957 24,180 431 2,203 3,593 2,144 11,696 2,864 24,437
15 Note: This table includes active plans with funded supports only. There are 98 approved plans that do not contain any funded supports. 16 The support need categories in this table have been updated to align to the domains of the NDIS Outcomes Framework. Historical data has been migrated to these new categories, to enable longitudinal analyses.
11th Quarterly Report to COAG Disability Reform Council 34 31 March 2016
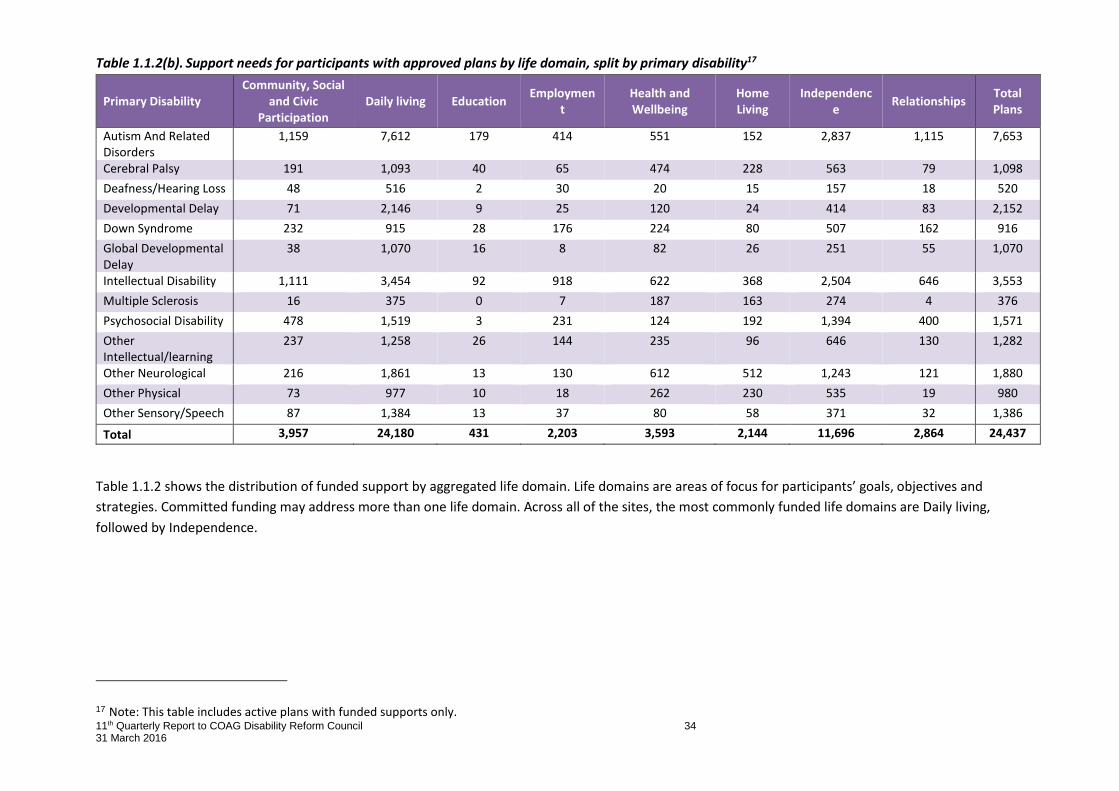
Table 1.1.2(b). Support needs for participants with approved plans by life domain, split by primary disability17
Primary Disability Community, Social
and Civic Participation
Daily living Education Employmen
t Health and Wellbeing
Home Living
Independence
Relationships Total Plans
Autism And Related Disorders
1,159 7,612 179 414 551 152 2,837 1,115 7,653
Cerebral Palsy 191 1,093 40 65 474 228 563 79 1,098
Deafness/Hearing Loss 48 516 2 30 20 15 157 18 520
Developmental Delay 71 2,146 9 25 120 24 414 83 2,152
Down Syndrome 232 915 28 176 224 80 507 162 916
Global Developmental Delay
38 1,070 16 8 82 26 251 55 1,070
Intellectual Disability 1,111 3,454 92 918 622 368 2,504 646 3,553
Multiple Sclerosis 16 375 0 7 187 163 274 4 376
Psychosocial Disability 478 1,519 3 231 124 192 1,394 400 1,571
Other Intellectual/learning
237 1,258 26 144 235 96 646 130 1,282
Other Neurological 216 1,861 13 130 612 512 1,243 121 1,880
Other Physical 73 977 10 18 262 230 535 19 980
Other Sensory/Speech 87 1,384 13 37 80 58 371 32 1,386
Total 3,957 24,180 431 2,203 3,593 2,144 11,696 2,864 24,437
Table 1.1.2 shows the distribution of funded support by aggregated life domain. Life domains are areas of focus for participants’ goals, objectives and
strategies. Committed funding may address more than one life domain. Across all of the sites, the most commonly funded life domains are Daily living,
followed by Independence.
17 Note: This table includes active plans with funded supports only.
11th Quarterly Report to COAG Disability Reform Council 35 31 March 2016
1.2. Increased mix of support options and innovative approaches to provision of support
in response to assessed need
The NDIS provides a range of supports aimed at increasing participant independence, inclusion, and
social & economic participation. These supports are designed to be more flexible than the previous
system and allow innovation. Importantly, the supports are specific to an individual, and not
provided through block grants to service providers. No specific data on services received under the
previous disability system is collected and comparison is difficult due to block grants. It is envisioned
that the range of supports funded by the Scheme will expand over time.
This section provides descriptive information on funded support categories, payments and
registered service providers.
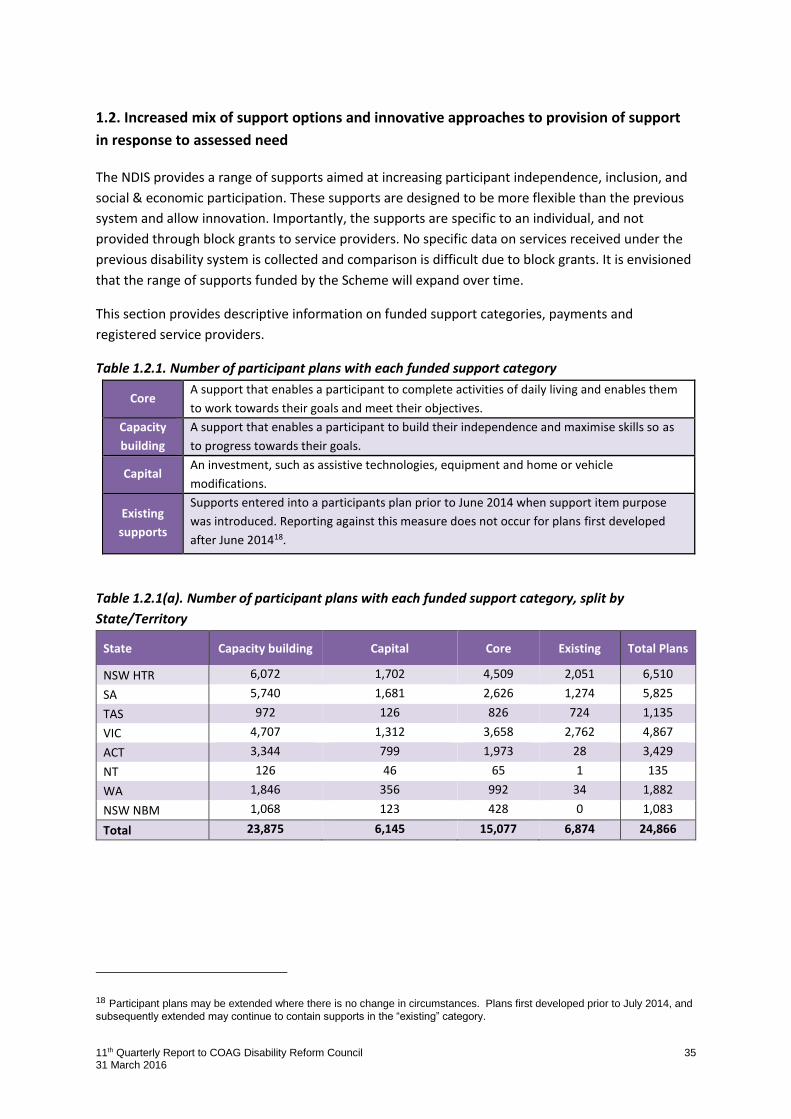
Table 1.2.1. Number of participant plans with each funded support category
Core A support that enables a participant to complete activities of daily living and enables them
to work towards their goals and meet their objectives.
Capacity
building
A support that enables a participant to build their independence and maximise skills so as
to progress towards their goals.
Capital An investment, such as assistive technologies, equipment and home or vehicle
modifications.
Existing
supports
Supports entered into a participants plan prior to June 2014 when support item purpose
was introduced. Reporting against this measure does not occur for plans first developed
after June 201418.
Table 1.2.1(a). Number of participant plans with each funded support category, split by
State/Territory
State Capacity building Capital Core Existing Total Plans
NSW HTR 6,072 1,702 4,509 2,051 6,510
SA 5,740 1,681 2,626 1,274 5,825
TAS 972 126 826 724 1,135
VIC 4,707 1,312 3,658 2,762 4,867
ACT 3,344 799 1,973 28 3,429
NT 126 46 65 1 135
WA 1,846 356 992 34 1,882
NSW NBM 1,068 123 428 0 1,083
Total 23,875 6,145 15,077 6,874 24,866
18 Participant plans may be extended where there is no change in circumstances. Plans first developed prior to July 2014, and
subsequently extended may continue to contain supports in the “existing” category.

11th Quarterly Report to COAG Disability Reform Council 36 31 March 2016
Table 1.2.1(b). Number of participant plans with each funded support category, split by primary
disability
Primary Disability Capacity building Capital Core Existing Total Plans
Autism and Related Disorders 7,528 1,101 3,927 1,851 7,702
Cerebral Palsy 1,073 672 833 370 1,112
Deafness/Hearing Loss 475 275 277 163 526
Developmental Delay 2,128 322 717 422 2,174
Down Syndrome 900 246 746 381 928
Global Developmental Delay 1,065 249 475 256 1,083
Intellectual Disability 3,403 569 2,834 1,431 3,627
Multiple Sclerosis 367 260 361 134 387
Psychosocial Disability 1,531 197 1,160 418 1,602
Other Intellectual/learning 1,236 332 841 336 1,297
Other Neurological 1,855 1,042 1,635 675 1,999
Other Physical 971 545 728 191 1,028
Other Sensory/Speech 1,343 335 543 246 1,401
Total 23,875 6,145 15,077 6,874 24,866
Table 1.2.1 shows the distribution of funded support by category. Committed funding may address
more than one support category. Across each of the sites, the most commonly funded support
category is capacity building.
11th Quarterly Report to COAG Disability Reform Council 37 31 March 2016
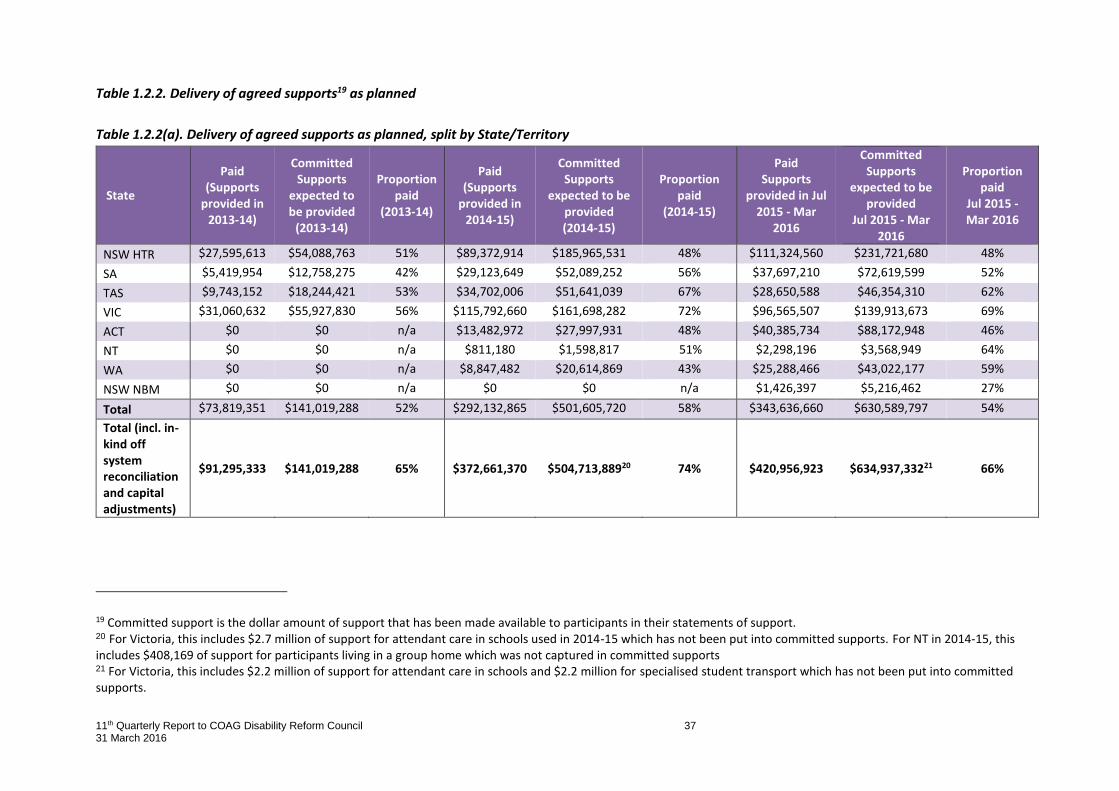
Table 1.2.2. Delivery of agreed supports19 as planned
Table 1.2.2(a). Delivery of agreed supports as planned, split by State/Territory
State
Paid (Supports
provided in 2013-14)
Committed Supports
expected to be provided
(2013-14)
Proportion paid
(2013-14)
Paid (Supports
provided in 2014-15)
Committed Supports
expected to be provided (2014-15)
Proportion paid
(2014-15)
Paid Supports
provided in Jul 2015 - Mar
2016
Committed Supports
expected to be provided
Jul 2015 - Mar 2016
Proportion paid
Jul 2015 - Mar 2016
NSW HTR $27,595,613 $54,088,763 51% $89,372,914 $185,965,531 48% $111,324,560 $231,721,680 48%
SA $5,419,954 $12,758,275 42% $29,123,649 $52,089,252 56% $37,697,210 $72,619,599 52%
TAS $9,743,152 $18,244,421 53% $34,702,006 $51,641,039 67% $28,650,588 $46,354,310 62%
VIC $31,060,632 $55,927,830 56% $115,792,660 $161,698,282 72% $96,565,507 $139,913,673 69%
ACT $0 $0 n/a $13,482,972 $27,997,931 48% $40,385,734 $88,172,948 46%
NT $0 $0 n/a $811,180 $1,598,817 51% $2,298,196 $3,568,949 64%
WA $0 $0 n/a $8,847,482 $20,614,869 43% $25,288,466 $43,022,177 59%
NSW NBM $0 $0 n/a $0 $0 n/a $1,426,397 $5,216,462 27%
Total $73,819,351 $141,019,288 52% $292,132,865 $501,605,720 58% $343,636,660 $630,589,797 54%
Total (incl. in-kind off system reconciliation and capital adjustments)
$91,295,333 $141,019,288 65% $372,661,370 $504,713,88920 74%
$420,956,923
$634,937,33221 66%
19 Committed support is the dollar amount of support that has been made available to participants in their statements of support. 20 For Victoria, this includes $2.7 million of support for attendant care in schools used in 2014-15 which has not been put into committed supports. For NT in 2014-15, this includes $408,169 of support for participants living in a group home which was not captured in committed supports 21 For Victoria, this includes $2.2 million of support for attendant care in schools and $2.2 million for specialised student transport which has not been put into committed supports.
11th Quarterly Report to COAG Disability Reform Council 38 31 March 2016
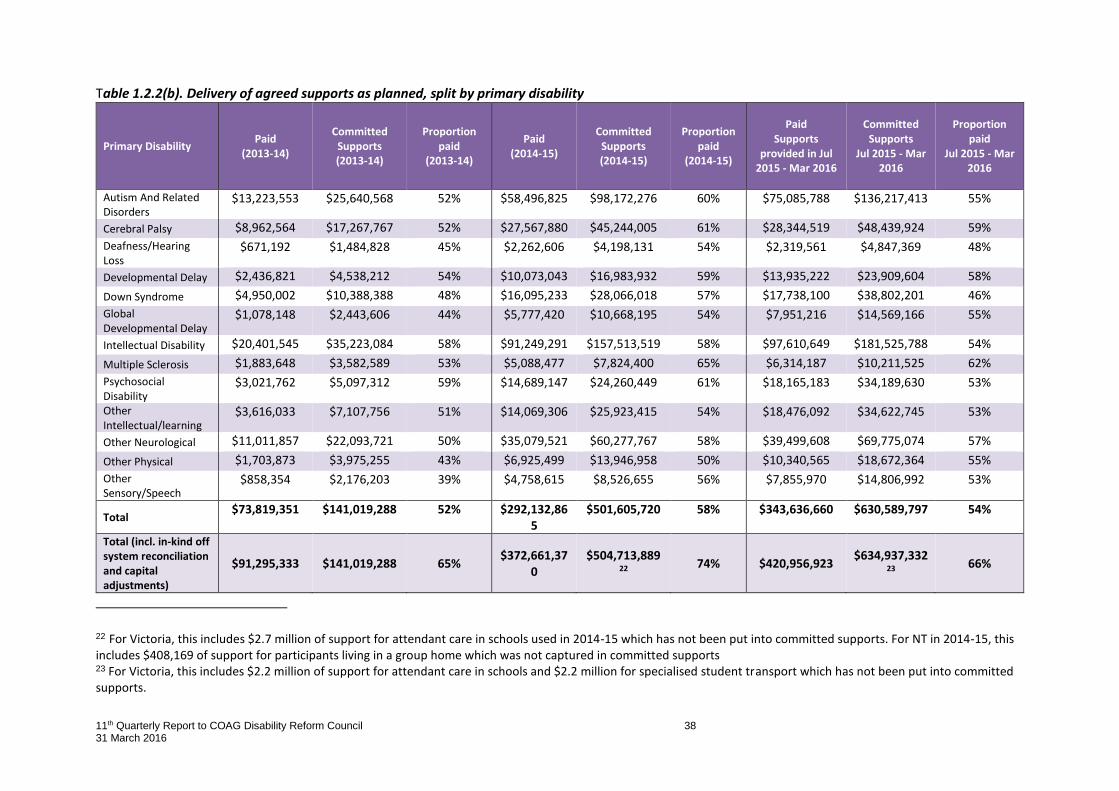
Table 1.2.2(b). Delivery of agreed supports as planned, split by primary disability
Primary Disability Paid
(2013-14)
Committed Supports (2013-14)
Proportion paid
(2013-14)
Paid (2014-15)
Committed Supports (2014-15)
Proportion paid
(2014-15)
Paid Supports
provided in Jul 2015 - Mar 2016
Committed Supports
Jul 2015 - Mar 2016
Proportion paid
Jul 2015 - Mar 2016
Autism And Related Disorders
$13,223,553 $25,640,568 52% $58,496,825 $98,172,276 60% $75,085,788 $136,217,413 55%
Cerebral Palsy $8,962,564 $17,267,767 52% $27,567,880 $45,244,005 61% $28,344,519 $48,439,924 59%
Deafness/Hearing Loss
$671,192 $1,484,828 45% $2,262,606 $4,198,131 54% $2,319,561 $4,847,369 48%
Developmental Delay $2,436,821 $4,538,212 54% $10,073,043 $16,983,932 59% $13,935,222 $23,909,604 58%
Down Syndrome $4,950,002 $10,388,388 48% $16,095,233 $28,066,018 57% $17,738,100 $38,802,201 46%
Global Developmental Delay
$1,078,148 $2,443,606 44% $5,777,420 $10,668,195 54% $7,951,216 $14,569,166 55%
Intellectual Disability $20,401,545 $35,223,084 58% $91,249,291 $157,513,519 58% $97,610,649 $181,525,788 54%
Multiple Sclerosis $1,883,648 $3,582,589 53% $5,088,477 $7,824,400 65% $6,314,187 $10,211,525 62%
Psychosocial Disability
$3,021,762 $5,097,312 59% $14,689,147 $24,260,449 61% $18,165,183 $34,189,630 53%
Other Intellectual/learning
$3,616,033 $7,107,756 51% $14,069,306 $25,923,415 54% $18,476,092 $34,622,745 53%
Other Neurological $11,011,857 $22,093,721 50% $35,079,521 $60,277,767 58% $39,499,608 $69,775,074 57%
Other Physical $1,703,873 $3,975,255 43% $6,925,499 $13,946,958 50% $10,340,565 $18,672,364 55%
Other Sensory/Speech
$858,354 $2,176,203 39% $4,758,615 $8,526,655 56% $7,855,970 $14,806,992 53%
Total $73,819,351 $141,019,288 52% $292,132,86
5 $501,605,720 58% $343,636,660 $630,589,797 54%
Total (incl. in-kind off system reconciliation and capital adjustments)
$91,295,333 $141,019,288 65% $372,661,37
0 $504,713,889
22 74% $420,956,923
$634,937,33223
66%
22 For Victoria, this includes $2.7 million of support for attendant care in schools used in 2014-15 which has not been put into committed supports. For NT in 2014-15, this includes $408,169 of support for participants living in a group home which was not captured in committed supports 23 For Victoria, this includes $2.2 million of support for attendant care in schools and $2.2 million for specialised student transport which has not been put into committed supports.

11th Quarterly Report to COAG Disability Reform Council 39 31 March 2016
Table 1.2.2 shows the total dollar amount paid to date compared with the estimated funds committed for supports delivered to date. Of the $634.9m in supports
committed in participant plans to be provided since the start of the 2015-16 year, to date 68% has been delivered and paid for by the Scheme. Complexity in the funding
arrangements for participants and providers transitioning to the Scheme make this experience difficult to interpret. A large proportion of payments are reconciled off-
system - the 2015-16 in-kind offline reconciliation is continuing to be undertaken which means the 68% will increase. Further, there is an expected lag between when a
support is provided and when payments are made.
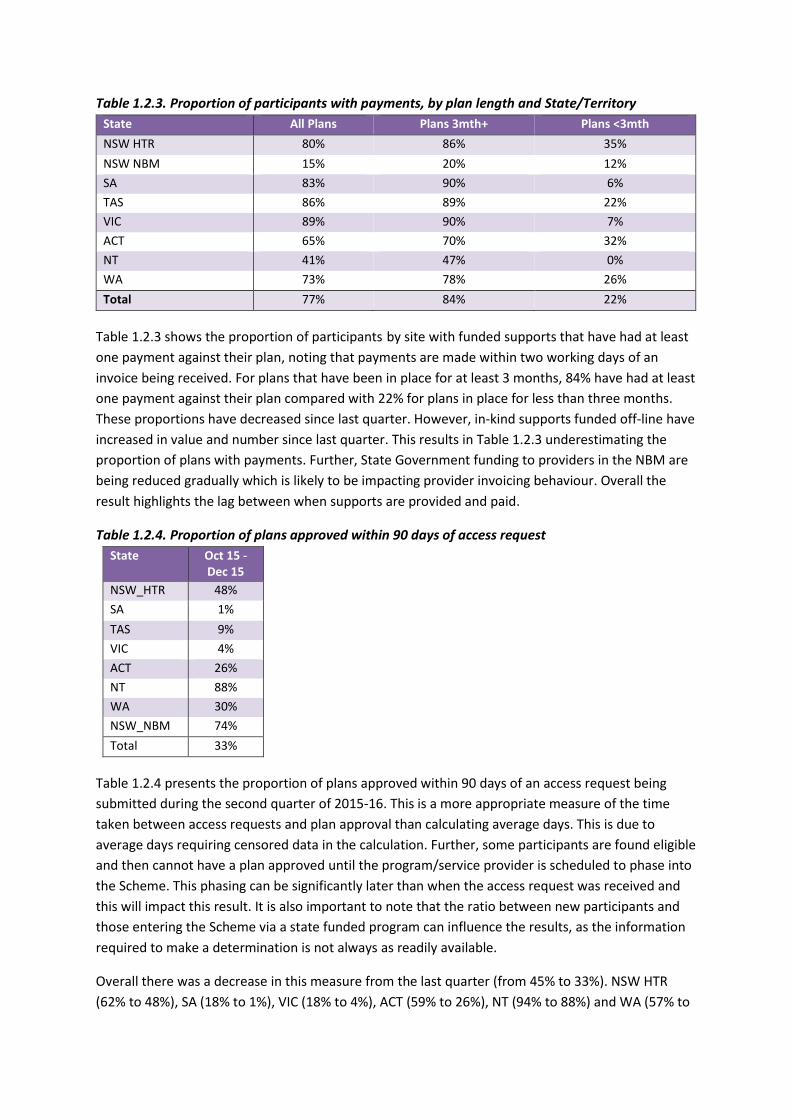
Table 1.2.3. Proportion of participants with payments, by plan length and State/Territory
State All Plans Plans 3mth+ Plans <3mth
NSW HTR 80% 86% 35%
NSW NBM 15% 20% 12%
SA 83% 90% 6%
TAS 86% 89% 22%
VIC 89% 90% 7%
ACT 65% 70% 32%
NT 41% 47% 0%
WA 73% 78% 26%
Total 77% 84% 22%
Table 1.2.3 shows the proportion of participants by site with funded supports that have had at least
one payment against their plan, noting that payments are made within two working days of an
invoice being received. For plans that have been in place for at least 3 months, 84% have had at least
one payment against their plan compared with 22% for plans in place for less than three months.
These proportions have decreased since last quarter. However, in-kind supports funded off-line have
increased in value and number since last quarter. This results in Table 1.2.3 underestimating the
proportion of plans with payments. Further, State Government funding to providers in the NBM are
being reduced gradually which is likely to be impacting provider invoicing behaviour. Overall the
result highlights the lag between when supports are provided and paid.
Table 1.2.4. Proportion of plans approved within 90 days of access request
State Oct 15 - Dec 15
NSW_HTR 48%
SA 1%
TAS 9%
VIC 4%
ACT 26%
NT 88%
WA 30%
NSW_NBM 74%
Total 33%
Table 1.2.4 presents the proportion of plans approved within 90 days of an access request being
submitted during the second quarter of 2015-16. This is a more appropriate measure of the time
taken between access requests and plan approval than calculating average days. This is due to
average days requiring censored data in the calculation. Further, some participants are found eligible
and then cannot have a plan approved until the program/service provider is scheduled to phase into
the Scheme. This phasing can be significantly later than when the access request was received and
this will impact this result. It is also important to note that the ratio between new participants and
those entering the Scheme via a state funded program can influence the results, as the information
required to make a determination is not always as readily available.
Overall there was a decrease in this measure from the last quarter (from 45% to 33%). NSW HTR
(62% to 48%), SA (18% to 1%), VIC (18% to 4%), ACT (59% to 26%), NT (94% to 88%) and WA (57% to
41 11th Quarterly Report to COAG Disability Reform Council 31 March 2016
30%) all decreased noticeably. TAS increased from 7% to 9% and NSW NBM from 57% to 74%. A
number of factors are likely to have impacted these results. The NDIA processes access requests as
they are received and then undertakes planning with participants in line with the bilateral phasing
schedule. In order to remain within the phasing schedule in VIC, ACT and SA, the time between
access request and plan approval increases. SA in particular have a well-known participant base and
a clear phasing schedule meaning that access requests are often submitted well in advance of the
participant phasing into the Scheme. In addition to this all sites saw the highest level of plan reviews
to date approved over the last three months of 2015 which would have diverted resources. Other
factors including staff leave, staff movement and difficulties in scheduling planning meetings with
participants over the Christmas holiday period would also effect this result. Furthermore VIC and TAS
had a low number of plan approvals for the quarter (72 and 69) so their results should be treated
with caution.
The Agency is continuing to work on streamlining both the planning and reviewing processes and has
improved reporting for this purpose in order to improve results.
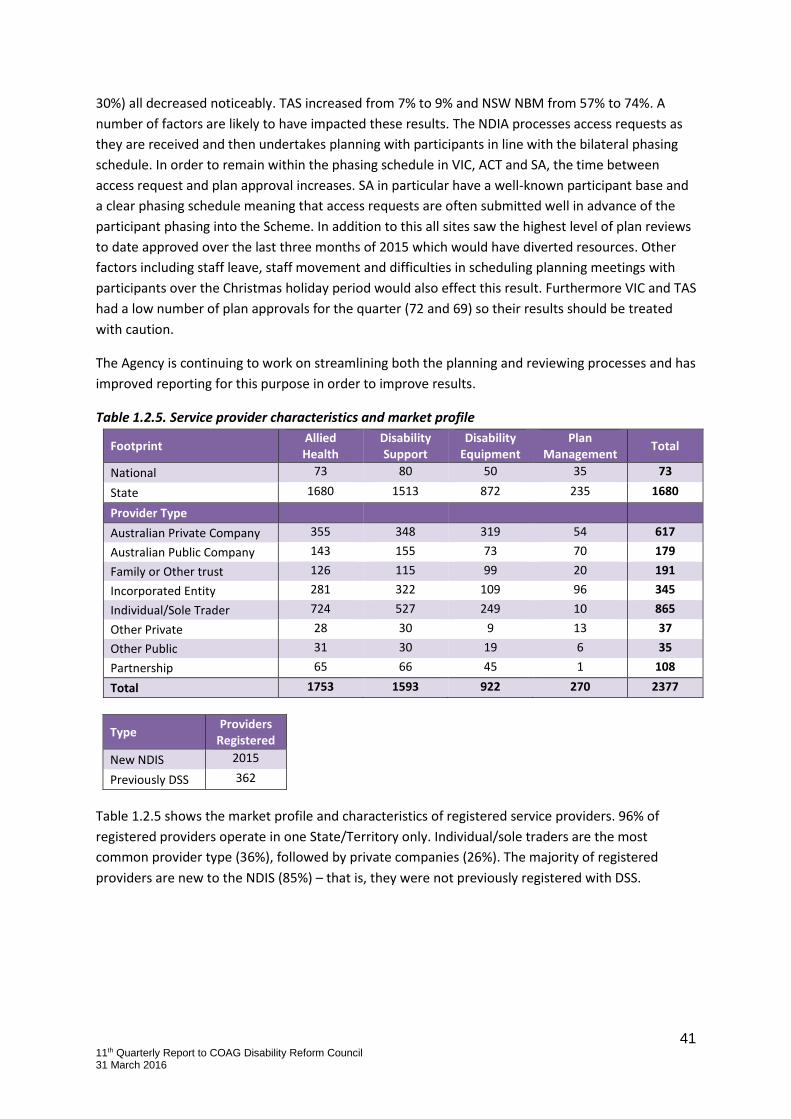
Table 1.2.5. Service provider characteristics and market profile
Footprint Allied Health
Disability Support
Disability Equipment
Plan Management
Total
National 73 80 50 35 73
State 1680 1513 872 235 1680
Provider Type
Australian Private Company 355 348 319 54 617
Australian Public Company 143 155 73 70 179
Family or Other trust 126 115 99 20 191
Incorporated Entity 281 322 109 96 345
Individual/Sole Trader 724 527 249 10 865
Other Private 28 30 9 13 37
Other Public 31 30 19 6 35
Partnership 65 66 45 1 108
Total 1753 1593 922 270 2377
Type Providers
Registered
New NDIS 2015
Previously DSS 362
Table 1.2.5 shows the market profile and characteristics of registered service providers. 96% of
registered providers operate in one State/Territory only. Individual/sole traders are the most
common provider type (36%), followed by private companies (26%). The majority of registered
providers are new to the NDIS (85%) – that is, they were not previously registered with DSS.
42 11th Quarterly Report to COAG Disability Reform Council 31 March 2016
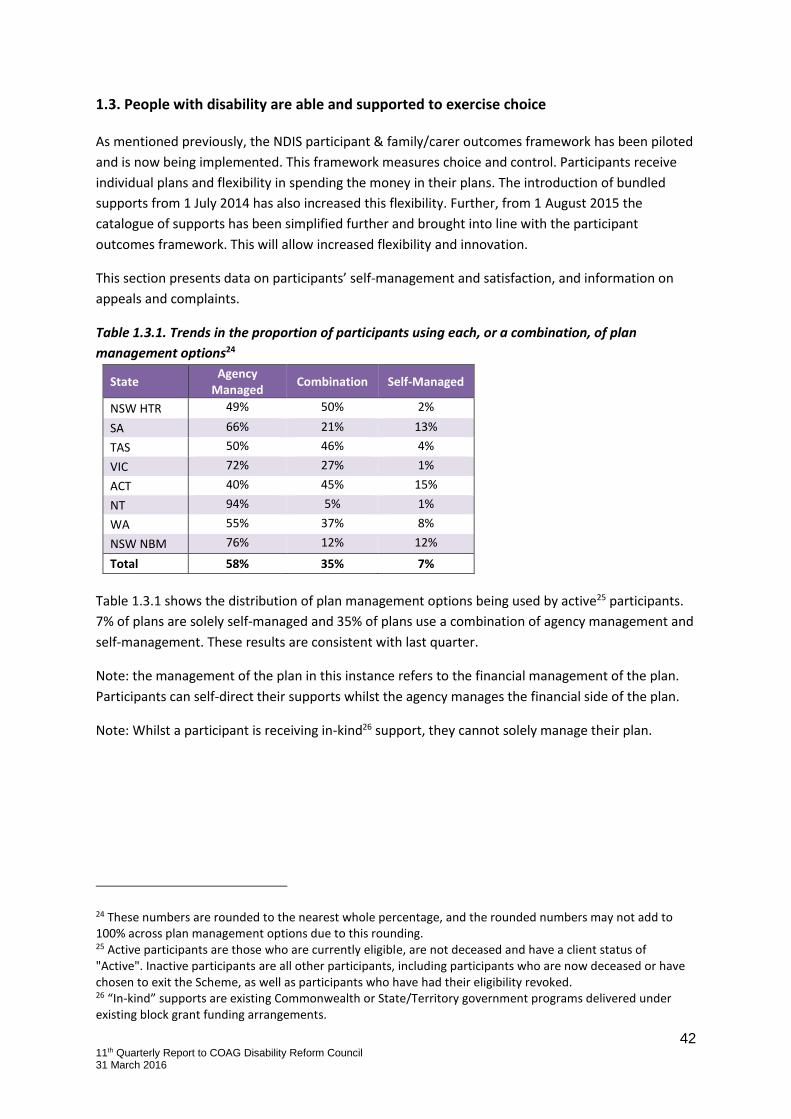
1.3. People with disability are able and supported to exercise choice
As mentioned previously, the NDIS participant & family/carer outcomes framework has been piloted
and is now being implemented. This framework measures choice and control. Participants receive
individual plans and flexibility in spending the money in their plans. The introduction of bundled
supports from 1 July 2014 has also increased this flexibility. Further, from 1 August 2015 the
catalogue of supports has been simplified further and brought into line with the participant
outcomes framework. This will allow increased flexibility and innovation.
This section presents data on participants’ self-management and satisfaction, and information on
appeals and complaints.
Table 1.3.1. Trends in the proportion of participants using each, or a combination, of plan
management options24
State Agency
Managed Combination Self-Managed
NSW HTR 49% 50% 2%
SA 66% 21% 13%
TAS 50% 46% 4%
VIC 72% 27% 1%
ACT 40% 45% 15%
NT 94% 5% 1%
WA 55% 37% 8%
NSW NBM 76% 12% 12%
Total 58% 35% 7%
Table 1.3.1 shows the distribution of plan management options being used by active25 participants.
7% of plans are solely self-managed and 35% of plans use a combination of agency management and
self-management. These results are consistent with last quarter.
Note: the management of the plan in this instance refers to the financial management of the plan.
Participants can self-direct their supports whilst the agency manages the financial side of the plan.
Note: Whilst a participant is receiving in-kind26 support, they cannot solely manage their plan.
24 These numbers are rounded to the nearest whole percentage, and the rounded numbers may not add to 100% across plan management options due to this rounding. 25 Active participants are those who are currently eligible, are not deceased and have a client status of "Active". Inactive participants are all other participants, including participants who are now deceased or have chosen to exit the Scheme, as well as participants who have had their eligibility revoked. 26 “In-kind” supports are existing Commonwealth or State/Territory government programs delivered under existing block grant funding arrangements.
43 11th Quarterly Report to COAG Disability Reform Council 31 March 2016
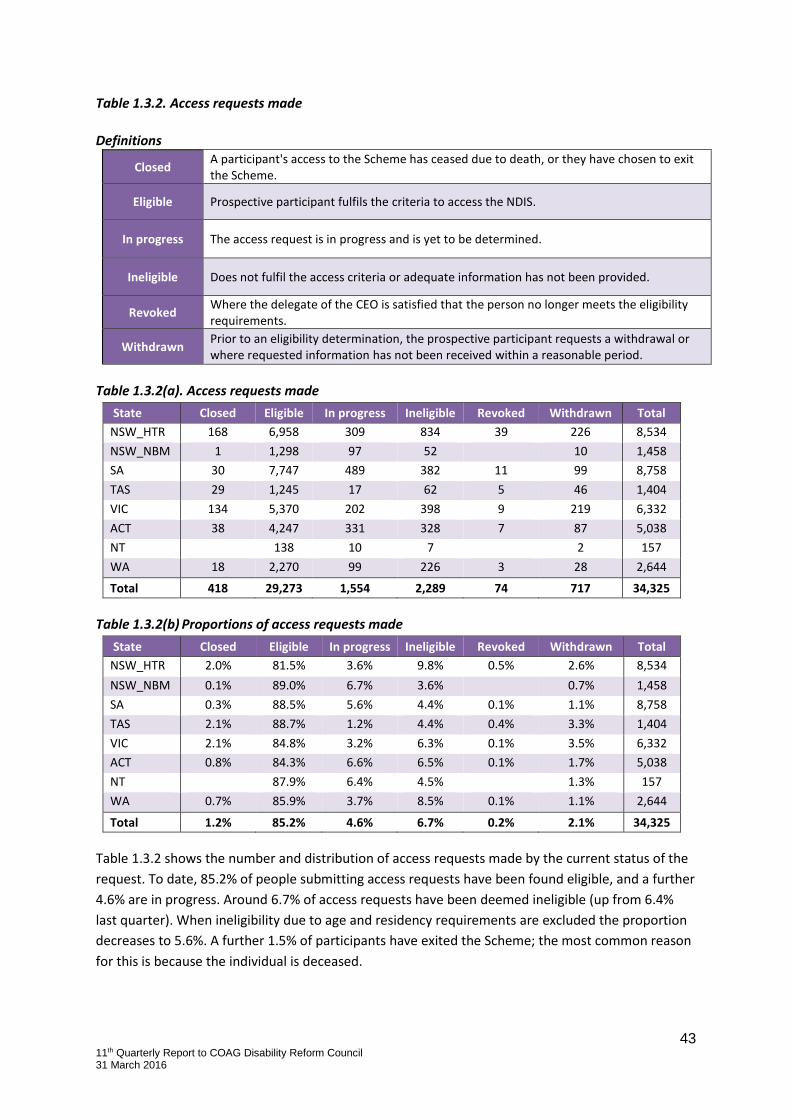
Table 1.3.2. Access requests made
Definitions
Closed A participant's access to the Scheme has ceased due to death, or they have chosen to exit the Scheme.
Eligible Prospective participant fulfils the criteria to access the NDIS.
In progress The access request is in progress and is yet to be determined.
Ineligible Does not fulfil the access criteria or adequate information has not been provided.
Revoked Where the delegate of the CEO is satisfied that the person no longer meets the eligibility requirements.
Withdrawn Prior to an eligibility determination, the prospective participant requests a withdrawal or where requested information has not been received within a reasonable period.
Table 1.3.2(a). Access requests made
State Closed Eligible In progress Ineligible Revoked Withdrawn Total
NSW_HTR 168 6,958 309 834 39 226 8,534
NSW_NBM 1 1,298 97 52 10 1,458
SA 30 7,747 489 382 11 99 8,758
TAS 29 1,245 17 62 5 46 1,404
VIC 134 5,370 202 398 9 219 6,332
ACT 38 4,247 331 328 7 87 5,038
NT 138 10 7 2 157
WA 18 2,270 99 226 3 28 2,644
Total 418 29,273 1,554 2,289 74 717 34,325
Table 1.3.2(b) Proportions of access requests made
State Closed Eligible In progress Ineligible Revoked Withdrawn Total
NSW_HTR 2.0% 81.5% 3.6% 9.8% 0.5% 2.6% 8,534
NSW_NBM 0.1% 89.0% 6.7% 3.6% 0.7% 1,458
SA 0.3% 88.5% 5.6% 4.4% 0.1% 1.1% 8,758
TAS 2.1% 88.7% 1.2% 4.4% 0.4% 3.3% 1,404
VIC 2.1% 84.8% 3.2% 6.3% 0.1% 3.5% 6,332
ACT 0.8% 84.3% 6.6% 6.5% 0.1% 1.7% 5,038
NT 87.9% 6.4% 4.5% 1.3% 157
WA 0.7% 85.9% 3.7% 8.5% 0.1% 1.1% 2,644
Total 1.2% 85.2% 4.6% 6.7% 0.2% 2.1% 34,325
Table 1.3.2 shows the number and distribution of access requests made by the current status of the
request. To date, 85.2% of people submitting access requests have been found eligible, and a further
4.6% are in progress. Around 6.7% of access requests have been deemed ineligible (up from 6.4%
last quarter). When ineligibility due to age and residency requirements are excluded the proportion
decreases to 5.6%. A further 1.5% of participants have exited the Scheme; the most common reason
for this is because the individual is deceased.

44 11th Quarterly Report to COAG Disability Reform Council 31 March 2016
Table 1.3.3. Reviews of decisions (internal)
Status Definition
Affirmed Original decision was maintained
Set Aside Original decision was overturned
Pending Review is still underway
State Affirmed Set aside Pending Outcome not
recorded27 Total
NSW 28 56 19 49 152
SA 14 36 12 27 89
TAS 2 1 1 2 6
VIC 41 79 25 46 191
ACT 8 16 7 21 52
NT 0 0 0 0 0
WA 5 6 3 5 19
National Office
9 19 12 5 45
Total 98 194 67 150 554
Table 1.3.3 shows the number of decisions that participants, providers, or their agents have formally
requested to be reviewed. Reviews can be requested for decisions on access requests (34,325) or
plan decisions (43,946). Given the total number of decisions, there have been very few requests for
review – 554 in total, of which 219 relate to access decisions.
Table 1.3.4. Total appeals by outcome with the Administrative Appeals Tribunal (AAT)
Determination Definition
Affirmed Participant loses appeal
Set Aside Participant wins appeal
Pending Appeal is still underway
Varied Participant wins appeal
Dismissed Appeal is dismissed
Withdrawn Participant withdraws appeal prior to determination
State Affirmed Set aside Pending Varied Dismissed Withdrawn Total
NSW 2 0 3 3 2 0 10
SA 1 0 1 3 3 5 13
TAS 0 0 0 1 0 0 1
VIC 2 2 6 12 3 5 30
ACT 0 0 3 1 0 1 5
NT 0 0 0 0 0 0 0
WA 0 0 1 2 1 0 4
National Office 0 0 0 0 0 0 0
Total 5 2 14 22 9 11 63
27 Current ICT system does not enforce the recording of a review outcome. The NDIA and the Department of Human Services
(DHS) are currently implementing a new ICT system that addresses this issue.
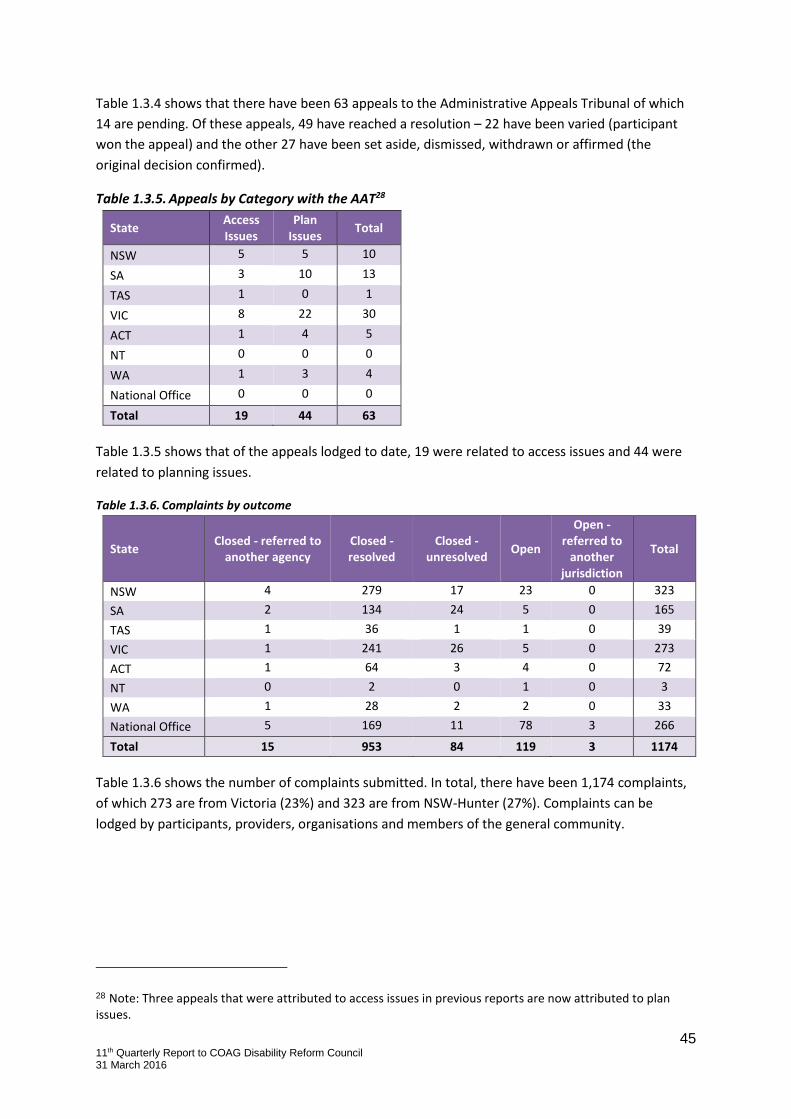
45 11th Quarterly Report to COAG Disability Reform Council 31 March 2016
Table 1.3.4 shows that there have been 63 appeals to the Administrative Appeals Tribunal of which
14 are pending. Of these appeals, 49 have reached a resolution – 22 have been varied (participant
won the appeal) and the other 27 have been set aside, dismissed, withdrawn or affirmed (the
original decision confirmed).
Table 1.3.5. Appeals by Category with the AAT28
State Access Issues
Plan Issues
Total
NSW 5 5 10
SA 3 10 13
TAS 1 0 1
VIC 8 22 30
ACT 1 4 5
NT 0 0 0
WA 1 3 4
National Office 0 0 0
Total 19 44 63
Table 1.3.5 shows that of the appeals lodged to date, 19 were related to access issues and 44 were
related to planning issues.
Table 1.3.6. Complaints by outcome
State Closed - referred to
another agency Closed - resolved
Closed - unresolved
Open
Open - referred to
another jurisdiction
Total
NSW 4 279 17 23 0 323
SA 2 134 24 5 0 165
TAS 1 36 1 1 0 39
VIC 1 241 26 5 0 273
ACT 1 64 3 4 0 72
NT 0 2 0 1 0 3
WA 1 28 2 2 0 33
National Office 5 169 11 78 3 266
Total 15 953 84 119 3 1174
Table 1.3.6 shows the number of complaints submitted. In total, there have been 1,174 complaints,
of which 273 are from Victoria (23%) and 323 are from NSW-Hunter (27%). Complaints can be
lodged by participants, providers, organisations and members of the general community.
28 Note: Three appeals that were attributed to access issues in previous reports are now attributed to plan issues.

46 11th Quarterly Report to COAG Disability Reform Council 31 March 2016
Table 1.3.7. Complaint type
State Provider Agency Reasonable and
Necessary Supports Other Total
NSW 15 213 59 36 323
SA 0 141 13 11 165
TAS 0 30 2 7 39
VIC 5 191 45 32 273
ACT 2 56 6 8 72
NT 1 1 0 1 3
WA 0 25 2 6 33
National Office 5 199 10 52 266
Total 28 856 137 153 1174
Table 1.3.7 shows the distribution of the total complaints to date by complaint type. The majority
(73%) of complaints are agency related, with a further 12% relating to the amount of reasonable and
necessary supports in participant plans.
Table 1.3.8(a) Participant/Carer/Family satisfaction with the Agency and life experience
(Note: Satisfaction is reported on a scale of -2 very poor to +2 very good, with 0 = neutral)
State Participant/family/
carer satisfaction
Experience
satisfaction29
NSW 1.73 1.04
SA 1.55 1.06
TAS 1.69 1.35
VIC 1.76 1.14
ACT 1.50 0.83
NT - 0.53
WA 1.34 1.04
Total 1.63 1.09
Table 1.3.8(b) Participant/ Carer/ Family satisfaction with the Agency
State Very good Good Neutral Poor Very Poor Total
NSW 76% 23% 1% 1% 0% 100%
SA 67% 25% 5% 3% 1% 100%
TAS 77% 23% 3% 0% 1% 100%
VIC 81% 16% 3% 1% 0% 100%
ACT 55% 41% 3% 0% 1% 100%
NT - - - - - -
WA 53% 36% 7% 2% 3% 100%
Total 71% 24% 4% 1% 0% 100%
Table 1.3.8 shows participant satisfaction with the Agency, and in particular, the planning process.
Experience satisfaction measures a participant’s overall satisfaction with their current life experience
29 Life Experience satisfaction is no longer collected during planning. This measure is part of the outcomes framework being base-lined in 2015-16. Reporting will be included in the 2015-16 end of year report.

47 11th Quarterly Report to COAG Disability Reform Council 31 March 2016
and outcomes. Of the 2,011 participants who have been surveyed, 95% have responded that their
experience was either good or very good.
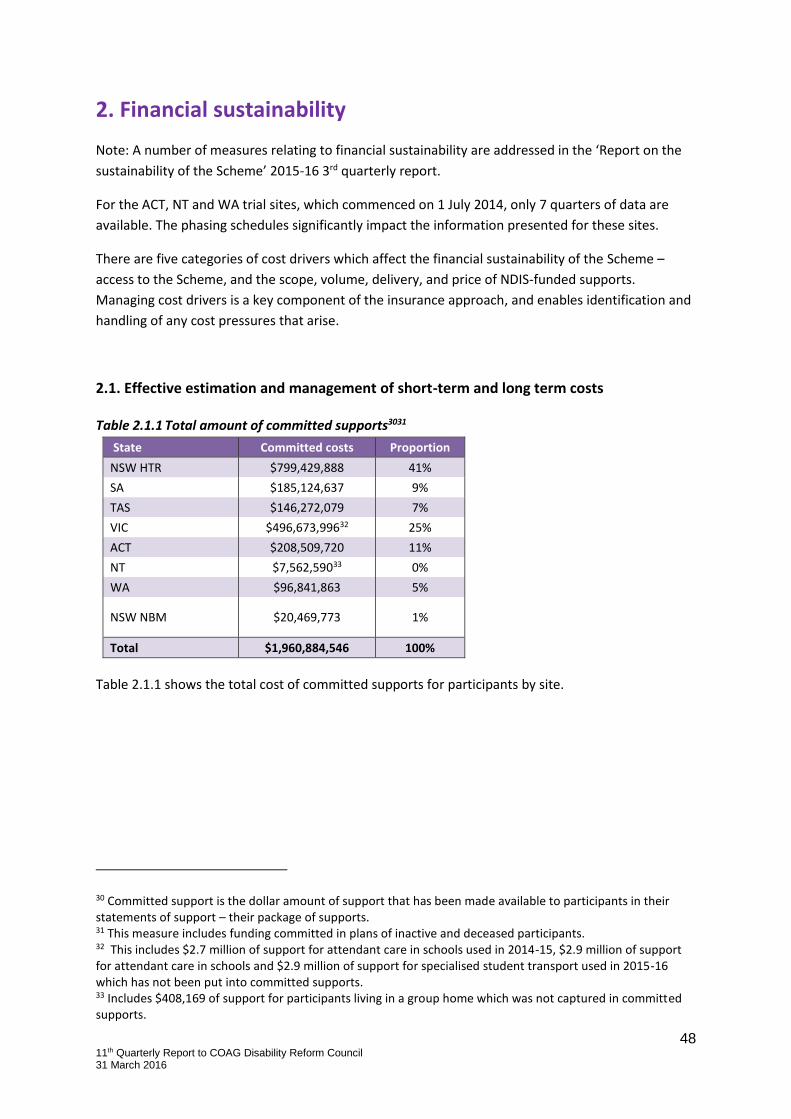
48 11th Quarterly Report to COAG Disability Reform Council 31 March 2016
2. Financial sustainability
Note: A number of measures relating to financial sustainability are addressed in the ‘Report on the
sustainability of the Scheme’ 2015-16 3rd quarterly report.
For the ACT, NT and WA trial sites, which commenced on 1 July 2014, only 7 quarters of data are
available. The phasing schedules significantly impact the information presented for these sites.
There are five categories of cost drivers which affect the financial sustainability of the Scheme –
access to the Scheme, and the scope, volume, delivery, and price of NDIS-funded supports.
Managing cost drivers is a key component of the insurance approach, and enables identification and
handling of any cost pressures that arise.
2.1. Effective estimation and management of short-term and long term costs
Table 2.1.1 Total amount of committed supports3031
State Committed costs Proportion
NSW HTR $799,429,888 41%
SA $185,124,637 9%
TAS $146,272,079 7%
VIC $496,673,99632 25%
ACT $208,509,720 11%
NT $7,562,59033 0%
WA $96,841,863 5%
NSW NBM $20,469,773 1%
Total $1,960,884,546 100%
Table 2.1.1 shows the total cost of committed supports for participants by site.
30 Committed support is the dollar amount of support that has been made available to participants in their statements of support – their package of supports. 31 This measure includes funding committed in plans of inactive and deceased participants. 32 This includes $2.7 million of support for attendant care in schools used in 2014-15, $2.9 million of support for attendant care in schools and $2.9 million of support for specialised student transport used in 2015-16 which has not been put into committed supports. 33 Includes $408,169 of support for participants living in a group home which was not captured in committed supports.

49 11th Quarterly Report to COAG Disability Reform Council 31 March 2016
Table 2.1.2. Total payments ($, in-kind34)
State Cash In-Kind Total
NSW (HTR) $226,316,831 $1,976,257 $228,293,087
SA $67,104,255 $5,136,559 $72,240,814
TAS $62,712,074 $10,383,672 $73,095,746
VIC $166,345,139 $77,073,661 $243,418,800
ACT $53,080,852 $787,855 $53,868,707
NT $3,083,309 $26,067 $3,109,376
WA $32,059,992 $2,075,957 $34,135,949
NSW (NBM) $1,426,397 $0 $1,426,397
Total payments $612,128,849 $97,460,026 $709,588,876
Total (incl. in-kind offline reconciliation for 2013-14 and 2014-15 and known in-kind in 2015-16)
$612,128,849 $272,784,777 $884,913,626
Table 2.1.2 shows total payments to date by site. The majority of payments are from the New South
Wales (HTR) and Victorian sites (66% of payments, combined). This is expected as these are the
largest sites. The newer sites have made fewer payments than the 2013-14 trial sites. This is
expected as they have had less Scheme experience and there is a lag between support provision and
payment.
Table 2.1.3 Operating Expenses Ratio (% total costs)35
%
Operating expenses ratio 20.6%
Table 2.1.3 shows the operating expenses ratio. This figure has increased from 19.6% reported in the
previous quarter. This increase reflects the increased operational and setup costs associated with
the ramp up in preparation for the NDIS Full Scheme Launch on 1 July 2016.
34 “In-kind” supports are existing Commonwealth or State/Territory government programs delivered under existing block grant funding arrangements. 35 The numerator includes all operating expenses of the Agency including sector development grants but excludes participant payments. The denominator is total expenses incurred by the Agency including all grants, operating expenses and participant support.
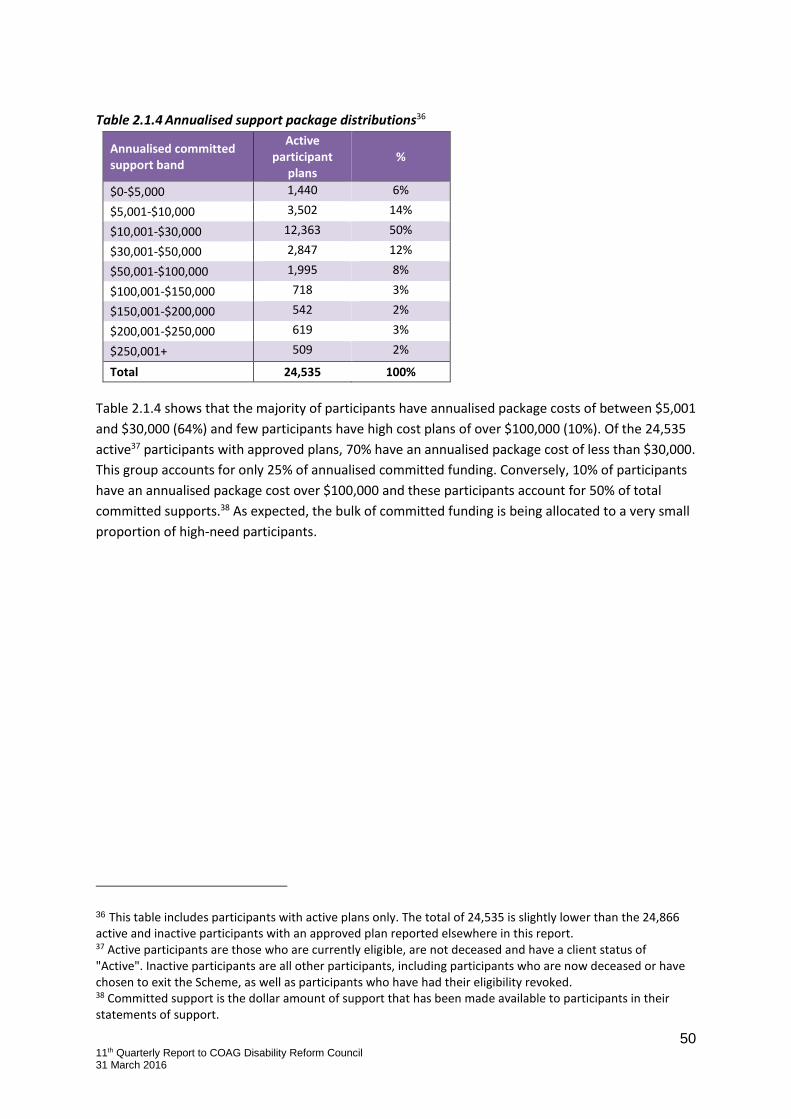
50 11th Quarterly Report to COAG Disability Reform Council 31 March 2016
Table 2.1.4 Annualised support package distributions36
Annualised committed support band
Active participant
plans %
$0-$5,000 1,440 6%
$5,001-$10,000 3,502 14%
$10,001-$30,000 12,363 50%
$30,001-$50,000 2,847 12%
$50,001-$100,000 1,995 8%
$100,001-$150,000 718 3%
$150,001-$200,000 542 2%
$200,001-$250,000 619 3%
$250,001+ 509 2%
Total 24,535 100%
Table 2.1.4 shows that the majority of participants have annualised package costs of between $5,001
and $30,000 (64%) and few participants have high cost plans of over $100,000 (10%). Of the 24,535
active37 participants with approved plans, 70% have an annualised package cost of less than $30,000.
This group accounts for only 25% of annualised committed funding. Conversely, 10% of participants
have an annualised package cost over $100,000 and these participants account for 50% of total
committed supports.38 As expected, the bulk of committed funding is being allocated to a very small
proportion of high-need participants.
36 This table includes participants with active plans only. The total of 24,535 is slightly lower than the 24,866 active and inactive participants with an approved plan reported elsewhere in this report. 37 Active participants are those who are currently eligible, are not deceased and have a client status of "Active". Inactive participants are all other participants, including participants who are now deceased or have chosen to exit the Scheme, as well as participants who have had their eligibility revoked. 38 Committed support is the dollar amount of support that has been made available to participants in their statements of support.

51 11th Quarterly Report to COAG Disability Reform Council 31 March 2016
Table 2.1.5 Proportion of participants with approved plans receiving support within 180 days of
access request
State Jun 15 – Sep 15
NSW HTR 79%
NSW NBM 74%
SA 18%
TAS 25%
VIC 22%
ACT 60%
NT 41%
WA 58%
Total 50%
Table 2.1.5 shows the proportion of participants with approved plans who have received support
within 180 days of submitting an access request during the 1st quarter of 2015-16. This is a more
appropriate measure of the time taken between access requests and receiving supports than
calculating average days. This is due to average days requiring censored data in the calculation.
Overall, this measure has decreased since the previous quarter, from 66% to 50% with the most
significant changes being in SA (65% to 18%), VIC (57% to 22%) and the NT (71% to 41%). This result
can be impacted by a number of different factors but appears to be driven by the proportion of
plans approved within 90 days of access request reported in Table 1.2.4. States/Territories with a
lower proportion of approvals within 90 days of an access request being submitted report a lower
proportion of supports received within 180 days. Further, in-kind invoicing is affecting this measure,
as not all in-kind services provided are invoiced in the system and are therefore not included in the
proportions above. In-kind services invoiced offline have increased significantly this quarter.
The Agency is continuing to work on streamlining both the planning and reviewing processes and has
improved reporting for this purpose in order to improve results.

52 11th Quarterly Report to COAG Disability Reform Council 31 March 2016
Table 2.1.6. Payments to providers and participants split by support category – since 1 July 2013
Support Category Participant Service
Provider Total
Assistance with daily life at home, in the community, education and at work (capacity building)
$1,290,688 $5,140,915 $6,431,602
Assistance with daily life at home, in the community, education and at work (includes supported independent Living)
$27,434,097 $445,459,265 $472,893,362
Assistive technology $3,047,162 $27,784,013 $30,831,175
Finding and keeping a job $217,326 $11,781,105 $11,998,431
Home modifications $444,823 $4,897,600 $5,342,423
Improved daily living skills $17,648,369 $100,291,156 $117,939,525
Improved health and wellbeing $996,329 $4,600,958 $5,597,287
Improved learning $86,453 $603,709 $690,162
Improved life choices $718,270 $19,279,615 $19,997,886
Improved living arrangements $27,481 $541,200 $568,681
Improved relationships $404,878 $3,734,469 $4,139,347
Increased social and community participation $568,034 $9,323,706 $9,891,740
Transport to access daily activities $11,426,159 $9,301,368 $20,727,526
Vehicle modifications $319,269 $2,220,459 $2,539,728
Total $64,629,337 $644,959,539 $709,588,876
Total (incl. in-kind off system reconciliation) $884,913,626
Table 2.1.6 shows total payments (cash & in-kind39) expenditure split by support category. Support
categories are groupings of similar supports. A single plan may have funding over many support
clusters. Payees can include participants who are self-managing or providers who invoice against a
plan. The majority of payments are made to providers (91%). The total payments made have
increased from approximately $566 million in the previous quarter ($707 million including the in-
kind off system reconciliation) to over $709 million excluding the in-kind off system reconciliation,
and $885 million when this reconciliation is included.
A new catalogue has been introduced for supports funded by the NDIS (from 1 August 2015), to
support the move to full scheme and encourage outcome-focussed support provision. The
categories in the table contain the categories used in the new support catalogue. Historical
payments have update to correspond to the new support catalogue.
39 “In-kind” supports are existing Commonwealth or State/Territory government programs delivered under existing block grant funding arrangements.

53 11th Quarterly Report to COAG Disability Reform Council 31 March 2016
Table 2.1.7. Average and median costs of individual support packages40
State Average annualised
committed Median annualised
committed
NSW HTR $45,445 $19,318
SA $18,057 $14,427
TAS $57,062 $31,432
VIC $36,244 $18,277
ACT $46,975 $18,749
NT $42,327 $15,055
WA $37,217 $21,927
NSW NBM $19,103 $12,814
Total $35,992 $17,056
Table 2.1.7 shows the average annualised plan amount and the median annualised plan amount, by
site.
Table 2.1.8. Value of and number of active approved packages by participant group – since 1 July
201341
Primary Disability Number Committed costs42 Average
annualised cost
Autism and Related Disorders 7,678 $385,517,641 $26,755
Cerebral Palsy 1099 $162,799,399 $65,102
Deafness/Hearing Loss 523 $15,278,113 $13,618
Developmental Delay 2160 $67,318,731 $16,059
Down Syndrome 917 $122,266,241 $57,660
Global Developmental Delay 1073 $39,782,941 $19,949
Intellectual Disability 3575 $597,484,458 $62,959
Multiple Sclerosis 376 $31,375,623 $42,249
Psychosocial Disability 1577 $106,983,272 $35,330
Other Intellectual/learning 1288 $106,192,161 $37,543
Other Neurological 1889 $223,823,309 $53,784
Other Physical 989 $53,923,888 $29,425
Other Sensory/Speech 1391 $39,233,886 $16,806
Total 24,535 $1,951,979,664 $35,992
Table 2.1.8 shows the number of active participants43 who have approved plans, the total cost
committed in these plans and the average annualised cost of the plans, split by primary disability
group. The average annualised costs by primary disability group will be affected by the underlying
40 Note: Average and median annualised costs exclude participants from the Stockton and Kanangra large residential centres in NSW and Colanda large residence in VIC. 41 Note: Average annualised cost excludes participants from the Stockton and Kanangra large residential centres in NSW and Colanda large residence in VIC. 42 Excluding in-kind support reconciled offline 43 Note: Active participants are those who are currently eligible, are not deceased and have a client status of "Active". Inactive participants are all other participants, including participants who are now deceased or have chosen to exit the Scheme, as well as participants who have had their eligibility revoked.
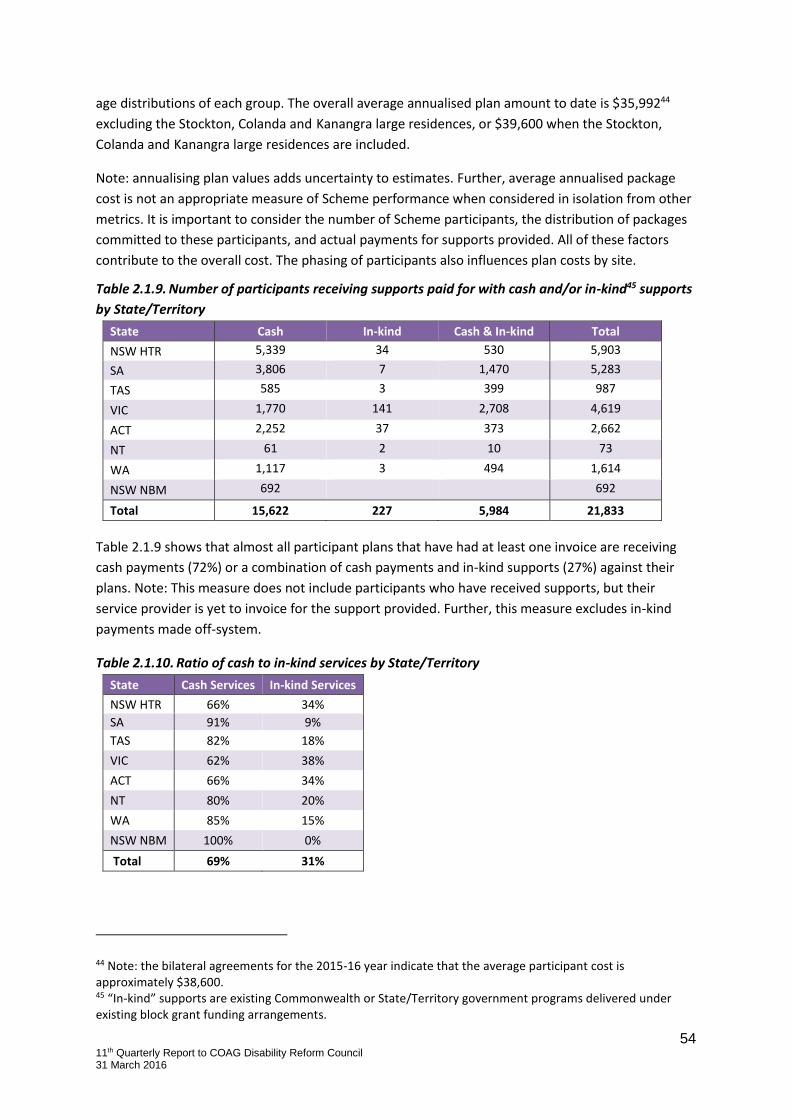
54 11th Quarterly Report to COAG Disability Reform Council 31 March 2016
age distributions of each group. The overall average annualised plan amount to date is $35,99244
excluding the Stockton, Colanda and Kanangra large residences, or $39,600 when the Stockton,
Colanda and Kanangra large residences are included.
Note: annualising plan values adds uncertainty to estimates. Further, average annualised package
cost is not an appropriate measure of Scheme performance when considered in isolation from other
metrics. It is important to consider the number of Scheme participants, the distribution of packages
committed to these participants, and actual payments for supports provided. All of these factors
contribute to the overall cost. The phasing of participants also influences plan costs by site.
Table 2.1.9. Number of participants receiving supports paid for with cash and/or in-kind45 supports
by State/Territory
State Cash In-kind Cash & In-kind Total
NSW HTR 5,339 34 530 5,903
SA 3,806 7 1,470 5,283
TAS 585 3 399 987
VIC 1,770 141 2,708 4,619
ACT 2,252 37 373 2,662
NT 61 2 10 73
WA 1,117 3 494 1,614
NSW NBM 692 692
Total 15,622 227 5,984 21,833
Table 2.1.9 shows that almost all participant plans that have had at least one invoice are receiving
cash payments (72%) or a combination of cash payments and in-kind supports (27%) against their
plans. Note: This measure does not include participants who have received supports, but their
service provider is yet to invoice for the support provided. Further, this measure excludes in-kind
payments made off-system.
Table 2.1.10. Ratio of cash to in-kind services by State/Territory
State Cash Services In-kind Services
NSW HTR 66% 34%
SA 91% 9%
TAS 82% 18%
VIC 62% 38%
ACT 66% 34%
NT 80% 20%
WA 85% 15%
NSW NBM 100% 0%
Total 69% 31%
44 Note: the bilateral agreements for the 2015-16 year indicate that the average participant cost is approximately $38,600. 45 “In-kind” supports are existing Commonwealth or State/Territory government programs delivered under existing block grant funding arrangements.

55 11th Quarterly Report to COAG Disability Reform Council 31 March 2016
Table 2.1.10 shows the distribution of payments for services funded through cash and in-kind
arrangements by site. Victoria has the highest percentage of in-kind payments at 38%, while South
Australia has the lowest at 9%. Note: Nepean Blue Mountains is yet to fund any services through in-
kind arrangements and figures include in-kind off system reconciliation.
Table 2.1.11. Participant numbers
Note – the results expressed in the following tables are also contained in Table 1.1.1 as percentages.
Table 2.1.11(a). Participant numbers, split by gender, CALD and Aboriginal and/or Torres Strait
Islander status
State / Territory Total Aboriginal and/or
Torres Strait Islander CALD M F X
NSW HTR 6,510 420 111 3,996 2,513 1
SA 5,825 264 339 4,195 1,630 0
TAS 1135 106 22 722 413 0
VIC 4,867 119 109 2,897 1,969 1
ACT 3,429 149 248 2,145 1,282 2
NT 135 127 89 77 58 0
WA 1,882 88 83 1,247 634 1
NSW NBM 1,083 94 36 763 320 0
Total 24,866 1,367 1,037 16,042 8,819 5

Table 2.1.11(c). Participant numbers, split by age and site
State / Territory 0-4 5-14 15-24 25-44 45-64 65+ Total
NSW HTR 374 1,815 935 1,239 1,989 158 6,510
SA 1,176 4,604 45 0 0 0 5,825
TAS 0 0 971 164 0 0 1,135
VIC 282 1,508 701 1,007 1,242 127 4,867
ACT 528 1,359 557 224 667 94 3,429
NT 8 36 6 32 52 1 135
WA 143 734 378 308 302 17 1,882
NSW NBM 263 709 110 146 0 0 1,082
Total 2,774 10,765 3,703 2,975 4,252 397 24,866
Table 2.1.11(b). Participant numbers, split by primary disability
Primary Disability NSW HTR SA TAS VIC ACT NT WA NSW NBM
Total
Autism and Related Disorders
1,500 2789 348 1076 793 3 673 520 7,702
Cerebral Palsy 295 199 72 169 174 10 116 77 1112
Deafness/Hearing Loss 189 157 8 67 71 4 16 14 526
Developmental Delay 319 766 8 361 534 5 44 137 2174
Down Syndrome 295 140 78 169 130 2 81 33 928
Global Developmental Delay
143 514 10 150 120 5 101 40 1083
Intellectual Disability 1205 175 410 1047 444 20 267 59 3627
Multiple Sclerosis 123 0 1 131 87 1 44 0 387
Psychosocial Disability 616 6 30 659 187 6 84 14 1602
Other Intellectual/learning
366 270 75 253 150 9 103 71 1297
Other Neurological 801 149 58 474 262 24 187 44 1999
Other Physical 323 114 22 178 226 38 103 24 1028
Other Sensory/Speech 335 546 15 133 251 8 63 50 1401
Total 6,510 5,825 1,135 4,867 3,429 135 1,882 1,083 24,866
46 Note: The age of a participant’s parent was erroneously input into their record. There are 0 participants in the NSW NBM site aged in the 25-44 bracket and 710 in the 5-14 bracket. Overall percentages are not impacted.

57 11th Quarterly Report to COAG Disability Reform Council 31 March 2016
Table 2.1.12. Total number of plans developed
State Total plans developed
NSW HTR 11,934
SA 9,817
TAS 2,596
VIC 11,338
ACT 4,349
NT 177
WA 2,649
NSW NBM 1,086
Total 43,946
Table 2.1.12 shows the total number of plans completed. This includes 15,872 second plans, 15,441
third plans, 1,080 fourth plans, and 50 fifth plans. 331 participants with approved plans have since
left the Scheme via participant-initiated request, death or Agency-initiated eligibility revocation.
Table 2.1.13. Number of plans with single supports
State Single items Ratio
NSW_HTR 834 13%
SA 1378 24%
TAS 79 7%
VIC 179 4%
ACT 774 23%
NT 5 4%
WA 263 14%
NSW NBM 133 12%
Total 3,645 15%
Table 2.1.13 shows the number of approved plans that only contain a single type of support. Overall,
15% of approved plans only contain a single type of support, down from 19% last quarter. South
Australia has 1,378 of these plans, which make up 24% of all approved plans in South Australia.
2.2. Benefits are realised from targeted investment strategies in enhanced disability
support
Of the 24,535 active participants with approved plans, 58% were found eligible for the Scheme
because they met the disability requirements (section 24 of the NDIS Act), and 10,109 (41%)
participants met the early invention requirements (section 25 of the NDIS Act). Younger participants
are more likely to meet the early intervention requirements which aim to improve, stabilise or lessen
the impact of the person’s impairment on their functional capacity.
The NDIS Outcomes Framework will be used to monitor participant outcomes and benefit
realisation. The Outcomes Framework is currently being baselined, and reporting will commence at
the end of 2015-16.
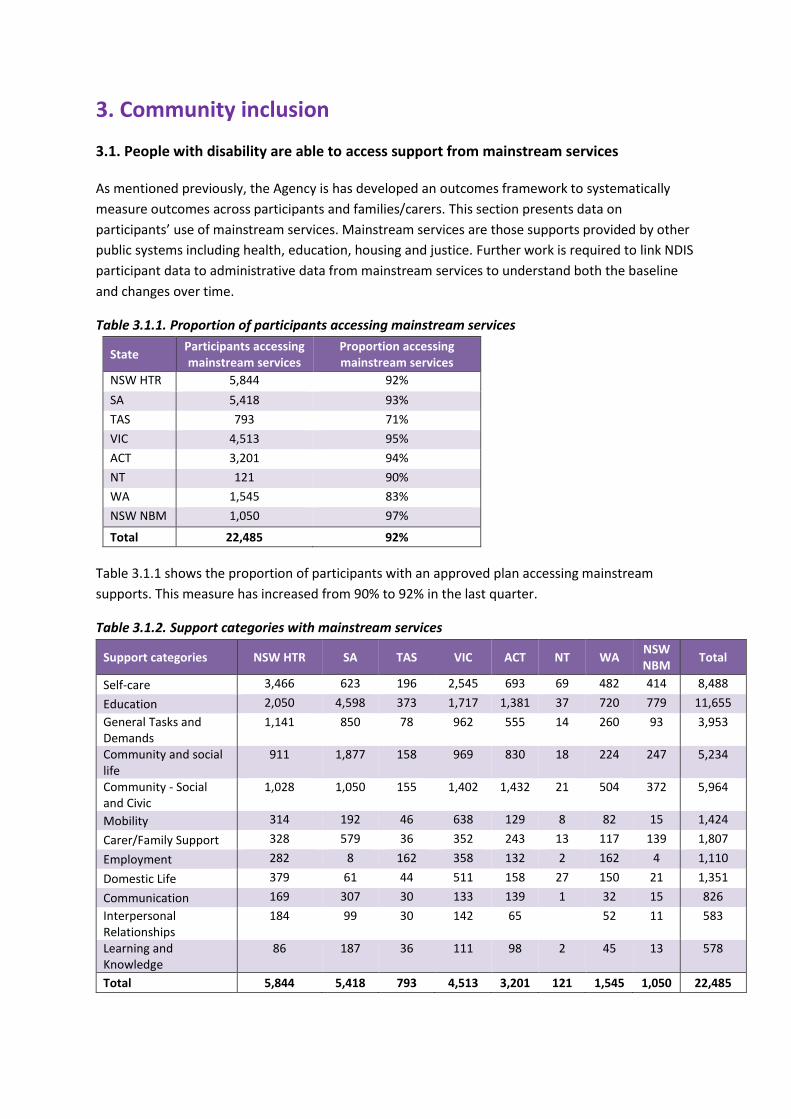
3. Community inclusion
3.1. People with disability are able to access support from mainstream services
As mentioned previously, the Agency is has developed an outcomes framework to systematically
measure outcomes across participants and families/carers. This section presents data on
participants’ use of mainstream services. Mainstream services are those supports provided by other
public systems including health, education, housing and justice. Further work is required to link NDIS
participant data to administrative data from mainstream services to understand both the baseline
and changes over time.
Table 3.1.1. Proportion of participants accessing mainstream services
State Participants accessing mainstream services
Proportion accessing mainstream services
NSW HTR 5,844 92%
SA 5,418 93%
TAS 793 71%
VIC 4,513 95%
ACT 3,201 94%
NT 121 90%
WA 1,545 83%
NSW NBM 1,050 97%
Total 22,485 92%
Table 3.1.1 shows the proportion of participants with an approved plan accessing mainstream
supports. This measure has increased from 90% to 92% in the last quarter.
Table 3.1.2. Support categories with mainstream services
Support categories NSW HTR SA TAS VIC ACT NT WA NSW NBM
Total
Self-care 3,466 623 196 2,545 693 69 482 414 8,488
Education 2,050 4,598 373 1,717 1,381 37 720 779 11,655
General Tasks and Demands
1,141 850 78 962 555 14 260 93 3,953
Community and social life
911 1,877 158 969 830 18 224 247 5,234
Community - Social and Civic
1,028 1,050 155 1,402 1,432 21 504 372 5,964
Mobility 314 192 46 638 129 8 82 15 1,424
Carer/Family Support 328 579 36 352 243 13 117 139 1,807
Employment 282 8 162 358 132 2 162 4 1,110
Domestic Life 379 61 44 511 158 27 150 21 1,351
Communication 169 307 30 133 139 1 32 15 826
Interpersonal Relationships
184 99 30 142 65 52 11 583
Learning and Knowledge
86 187 36 111 98 2 45 13 578
Total 5,844 5,418 793 4,513 3,201 121 1,545 1,050 22,485

59 11th Quarterly Report to COAG Disability Reform Council 31 March 2016
Table 3.1.2 shows the most common mainstream supports are education and self-care, with 11,655
and 8,488 utilised respectively by participants with approved plans47. 22,485 active, approved plans
contain mainstream supports (92%)
47 Participants may be accessing more than one mainstream service, and hence the overall total is not the sum of the services across the support categories.

3.2. Effectiveness of Local Area Coordinators (LAC) community capacity building activities
Table 3.2.1. Community awareness activities undertaken within the period by LACs
State/Territory Community awareness activity
NSW HTR
During the period January – March 2016 Hunter Trial Site Engagement and Local Area Coordinator Teams conducted the following activities:
Mental Health Community of Practice Forums
Provider forums/workshops
Community Expos
Interagency meetings
NDIA Information Desks at local shopping centres and other community venues
Mainstream Interface operational working groups
School Information sessions
Future Proofing Your Organisation – Managing Change in an NDIS World Forum – Armidale
Partners in Recovery Aboriginal Advisory Group Meeting
Workshop with Justice Agencies to support access to the scheme for potential participants
Community meeting with Mindaribba Lands Council
SA
Five information sessions were held with approximately 150 staff working in the Child Protection sector who are directly supporting children with disabilities to assist them in supporting people to access the NDIS and prepare for planning.
Coordinators participated in the Disability Expo and Forum – Gawler, Barossa and surrounding areas, including delivering a key welcome speech and hosting an information booth to increase awareness of the NDIS in these communities.
Coordinators in regional areas met regularly with local services and attended community network meetings to increase awareness of the Scheme.
Coordinators jointly delivered the NDIS Psychosocial Support Information and Workshop in conjunction with the Mental Health Coalition.
Coordinators delivered four National Disability Coordination Officer Transition network sessions, with over 80 attendees across Adelaide, focussing on increasing community awareness of the NDIS and the transition from Education to Employment for people with disabilities.
Coordinators attended the South Australian Carers Services Roundtable and a range of carer network meeting to build broader awareness of the NDIS and provide updates about the progress and roll out of the Scheme and the role of carers.
Coordinators delivered information session to Health Networks regarding to build community awareness of the NDIS, roll out in SA and access to the scheme.
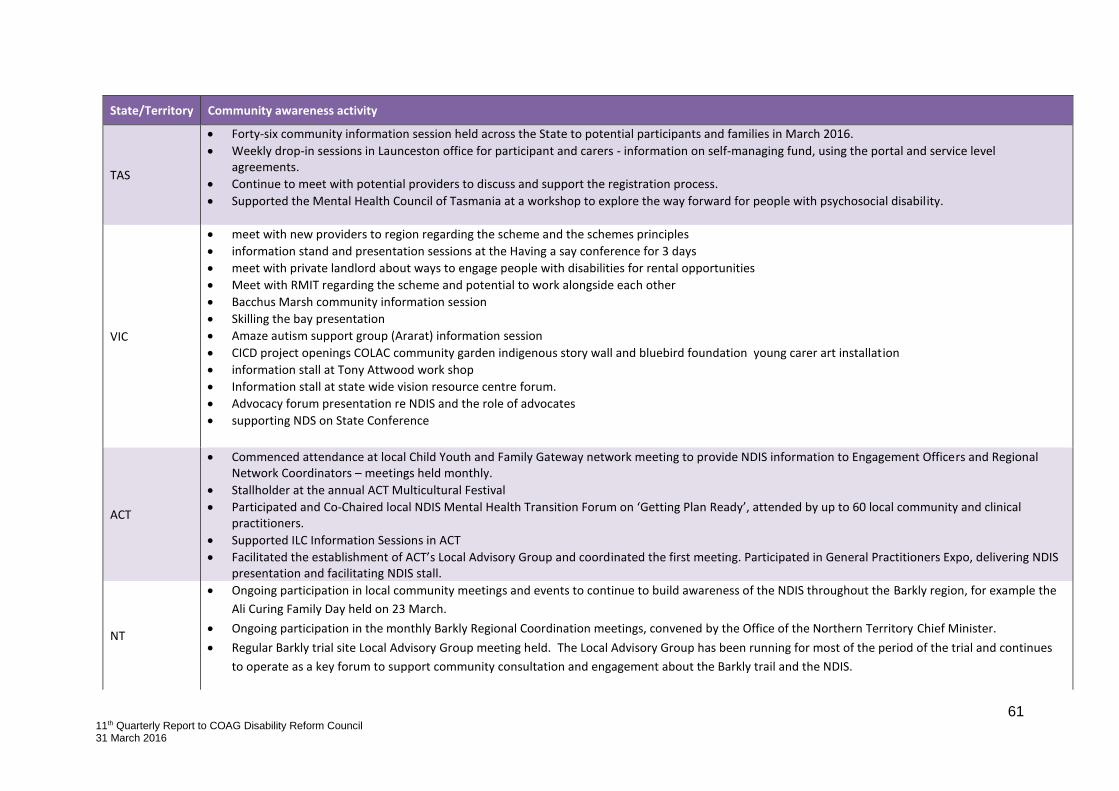
61 11th Quarterly Report to COAG Disability Reform Council 31 March 2016
State/Territory Community awareness activity
TAS
Forty-six community information session held across the State to potential participants and families in March 2016.
Weekly drop-in sessions in Launceston office for participant and carers - information on self-managing fund, using the portal and service level agreements.
Continue to meet with potential providers to discuss and support the registration process.
Supported the Mental Health Council of Tasmania at a workshop to explore the way forward for people with psychosocial disability.
VIC
meet with new providers to region regarding the scheme and the schemes principles
information stand and presentation sessions at the Having a say conference for 3 days
meet with private landlord about ways to engage people with disabilities for rental opportunities
Meet with RMIT regarding the scheme and potential to work alongside each other
Bacchus Marsh community information session
Skilling the bay presentation
Amaze autism support group (Ararat) information session
CICD project openings COLAC community garden indigenous story wall and bluebird foundation young carer art installation
information stall at Tony Attwood work shop
Information stall at state wide vision resource centre forum.
Advocacy forum presentation re NDIS and the role of advocates
supporting NDS on State Conference
ACT
Commenced attendance at local Child Youth and Family Gateway network meeting to provide NDIS information to Engagement Officers and Regional Network Coordinators – meetings held monthly.
Stallholder at the annual ACT Multicultural Festival
Participated and Co-Chaired local NDIS Mental Health Transition Forum on ‘Getting Plan Ready’, attended by up to 60 local community and clinical practitioners.
Supported ILC Information Sessions in ACT
Facilitated the establishment of ACT’s Local Advisory Group and coordinated the first meeting. Participated in General Practitioners Expo, delivering NDIS presentation and facilitating NDIS stall.
NT
Ongoing participation in local community meetings and events to continue to build awareness of the NDIS throughout the Barkly region, for example the
Ali Curing Family Day held on 23 March.
Ongoing participation in the monthly Barkly Regional Coordination meetings, convened by the Office of the Northern Territory Chief Minister.
Regular Barkly trial site Local Advisory Group meeting held. The Local Advisory Group has been running for most of the period of the trial and continues
to operate as a key forum to support community consultation and engagement about the Barkly trail and the NDIS.

62 11th Quarterly Report to COAG Disability Reform Council 31 March 2016
State/Territory Community awareness activity
WA
Monthly community information sessions continue at site – first Friday of each month
Weekly outreach to Aboriginal Emergency Accommodation – Karnany- and street doctor continues. This has increased the knowledge about the scheme and increased access requests.
Three more pop up stalls at local shopping centres have been booked (one completed this quarter) resulting in eight AR kits being sent out.
AR kits that are sent out are tracked and followed through by the Perth Hills engagement team to return to the Agency as these are generally sent to people who are vulnerable and have more difficulty following through on their access request (e.g. people with mental health issues, intellectual disability).
Local Aboriginal Reference Group continues to meet and is now chaired from within the membership. The chair has been approached by NDIA to represent on national group.
Planning for future National Disability Services (NDS) Sector Interest Group meetings for 2016 is underway. These meetings will be held at the NDIA
Fortnightly provider information sessions continue this quarter and continue to be well attended – more than 20 providers at each session. The workshops deal with trending issues and provide a question and answer forum for providers – covering the very basic (connecting to a participant, portal issues) to more complex (reporting, HACC, transport, support coordination)
Engagement staff are part of networks with other agencies in the area including the Midland Leadership Group, Strong Families, local shire disability advisory groups, Disability Employment Service (Centrelink chaired group), ADE network group. Through these networks, information about the NDIS is shared and contacts made to encourage people to access the scheme.
Regular meeting with local child protection agency and subsidiaries also continues, resulting in good working relations and seamless work with mutual participants.
Visits to GP practices to meet with clinical teams to explain the NDIS has become a regular activity – meeting with on average one per week.
NSW NBM Contracted Community Connectors conducted 18 General Information Sessions.
NDIA staff conducted 34 general awareness sessions

63 11th Quarterly Report to COAG Disability Reform Council 31 March 2016
3.3. Effectiveness of LAC community capacity building activities
Table 3.3.1. Community capacity building activities undertaken by LACs within the period
State/Territory Community capacity building activity
NSW HTR
Individual pre-planning support provided to participants entering the scheme.
Monthly capacity building provider workshops in the delivery of Coordination of Supports to increase capacity and capability in the sector for the provision of Support Connection and Support Coordination to participants – each month has a different focus, the month of March was focussed on the role of Coordination of Support and the Health interface, this workshop was co-facilitated with Hunter New England Health.
Co-hosted NSW Regional Service Provider Information Sessions with National Disability Services (NDS), Early Childhood Intervention association (ECIA NSW/ACT and Family and Community Services (FACS) preparing providers for the rollout of the scheme across NSW commencing 1 July 2016. Overview of the scheme and NDIA also included – Tamworth, Gosford and Newcastle.
One-on-one assistance for potential NDIS participants to complete access Request Forms.
Supporting young people in residential aged care in partnership with the Summer foundation to access the scheme and provided education awareness regarding the scheme to staff in aged care facilities.
One-on-one assistance for potential NDIS participants to complete access Request Forms.
Hunter Primary Care Information Session for regional staff – coordination of support focus.
North Coast Allied Health Association Forum – Coffs Harbour.
Collaboration with Aboriginal Affairs in working together with providers to increase.
Coordination of Supports training with Hunter New England Health.
Outreach to Mental Health facilities, coaching and supporting clinicians and individuals to make application to the scheme.
SA
“Getting Plan Ready” sessions were delivered to support families to think about goals and planning meetings at the NDIS. Seven sessions were delivered to people in metropolitan and regional areas.
“Make your Child’s NDIS plan work for them” workshops were offered to support families to implement their plan and engage with Mainstream and Community supports. 12 workshops were delivered to people in metropolitan and regional areas. Individual phone and face to face sessions were offered in regional areas to help people to access the information.
Coordinators in regional areas participated in community capacity building activities focussing on supporting communities to develop opportunities for increased inclusion of children with disabilities in mainstream and community activities including school holiday programs.
Coordinators from the Ngaanyatjarra, Pitjantjatjara and Yankunytjatjara Women's Council, working in the Anangu Pitjantjatjara Yankunytjatjara Lands (APY Lands), have undertaken a range of community awareness activities in communities on the APY Lands. These have included meetings to building community capacity with Anangu Pitjantjatjara Yankunytjatjara (APY) communities, including Ernabella, Mimili and Indulkana; Anangu Co-ordinators; Early childhood Nurse co-coordinator and School principals and council members from Ernabella , Mimili and Indulkana;

64 11th Quarterly Report to COAG Disability Reform Council 31 March 2016
State/Territory Community capacity building activity
Coordinators from Tullawon Health Service, working in Yalata, have worked with the Yalata and Oak Valley communities, School Attendance Officers Community members, Aboriginal health workers and Tullawon Health to build community capacity and support children with disability to access the NDIS.
Work directly with Aboriginal communities and families in Adelaide and surrounding areas have been undertaken by coordinators working with the First Peoples Disability Network, to increase awareness of the NDIS, build community capacity and directly support families of children with a disability to access the NDIS.
Coordinators met with Agencies including: Families SA, Disability SA, Centrelink and the Department for Education and Child Development to discuss local support needs, regional challenges and opportunities to address barriers to participation and inclusion.
Coordinators developed relationships with mainstream and community services such as child care, schools, recreational organisations, user led community groups and health services to support these services to build capacity and consider increased opportunities to deliver inclusive programs.
Continuing to work with potential and existing providers (particularly those who can offer support coordination services) in metropolitan, rural and remote areas to build options for participants to have help to set up supports in their plans.
Focus in regional areas on connecting with families who need help to access the NDIS.
The SA Youth Advisory Group for young people aged 12-24 years met monthly. The group continues to provide advice to the trial site on engagement and communication with young people about the Scheme. Some of their current projects include designing posters and videos and language to engage young people.
Introduction to the NDIS session delivered to over 65 providers to help build support options for participants.
Provider information session delivered to over 80 NDIA registered providers about delivery of therapy supports and reporting outcomes
Regular Education and Health interface meetings held to progress working arrangements and plan suitable engagement support to these sectors.
Facilitated a workshop for a range of Interpreters in the community to better understand the NDIS context that they offer services within and to seek their input on CALD resources – 40 attendees – further session in next quarter.
Remote Service provider forum – National forum held in Adelaide to consult and build understanding with key remote service providers.
TAS
LACs have worked Department of Education and NDIA staff to support participants engaged in School Leavers Employment Support, specifically to connect participants with employment providers.
LACs have met with a number of local councils to discuss NDIS.
LACs met with a number of Allied Health professionals across the state to provide information about full scheme rollout and registration processes.
VIC
Meeting with OT Australia and Gymnastics Victoria regarding therapy being provided in gymnastics centres.
Federation University provider information session
Support coordinators forum
new participant self-management information sessions
Otway health information session
Aboriginal advisory group participation
Road shows with Carers Vic re NDIS and planning

65 11th Quarterly Report to COAG Disability Reform Council 31 March 2016
State/Territory Community capacity building activity
working with local university and other key agencies in developing a Health literacy workshop for participants and providers
supporting Arts Victoria in planning and understanding there role in NDIS
ACT
Delivered 17 Pre-planning workshops with 82 attendees
Delivered 9 Managing Your Plan workshops with 103 attendees
Delivered 2 Community Conversations sessions with 10 attendees
Delivered 2 NDIS Information sessions with 10 attendees
Delivered NDIS Information Session to local staff at the National Australian Library
Delivered three NDIS information sessions for local Community Centre and their clients
Provided individual support to over 40 participants to assist with implementation, managing plans, linking and connecting to providers and mainstream services.
Ongoing partnership, meeting weekly with local Indigenous Youth Corporation Gugan-Gulwan to facilitate Access and Planning for Indigenous participants.
Delivered two Coordination of Support workshops to over 60 local community members
NT
Planning is continuing to initiate a Sector Development Fund project to support the development and trial of a locally focussed community based
Disability Worker targeted training programme. The training programme will be targeted at Indigenous people in remote communities in the Barkly to
support the implementation of the NDIS. If successful, the training programme could be used as a model for other regions across remote Australia.
The trial site continues to work closely with the Ali Curung community to support dialogue around disability issues and needs. For example the trial site is
working closely with the community and the local Community Development Programme (CDP) contractor, Julalikari, to support a project to rejuvenate
the local Respite Centre and then potentially use that facility as a future hub to support people with disability and others, including as a future hub for
increased social participation.
Close collaboration with the Tennant Creek Transport Group to support promotion of new public transport and point to point taxi subsidy eligible
transport options for people with disability - which have previously not existed.
WA
Self-Management Workshops held twice weekly, conducted by the finance team for participants
Pre-planning workshops held weekly on Monday mornings and evenings
Plan implementation workshops held weekly on Tuesdays morning and evening (week about)
CICD projects continue and include: o Transition from education to employment for those in years 10, 11, 12 and post compulsory (13) continues and has extended to Catholic
Education. This will mean adding in 150 hours to those in that age cohort to explore employment – customised employment / job carving approach. Fortnightly info sessions are held for parents and students to find out more about the program.
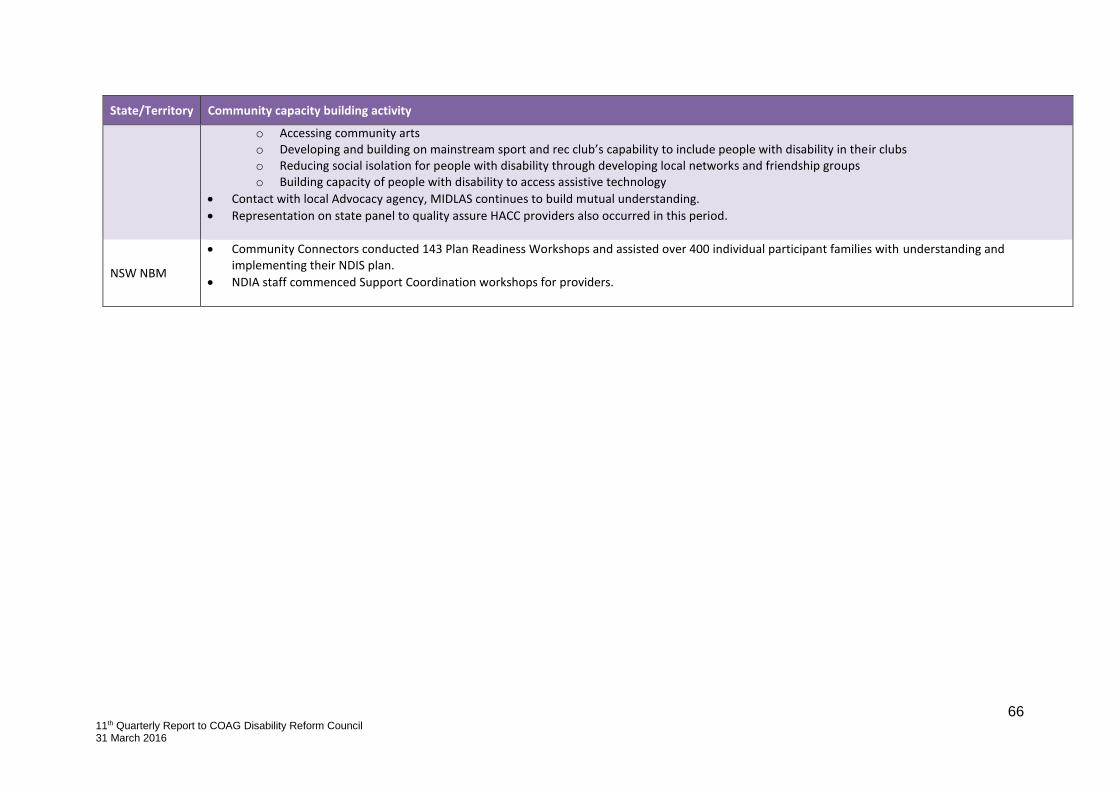
66 11th Quarterly Report to COAG Disability Reform Council 31 March 2016
State/Territory Community capacity building activity
o Accessing community arts o Developing and building on mainstream sport and rec club’s capability to include people with disability in their clubs o Reducing social isolation for people with disability through developing local networks and friendship groups o Building capacity of people with disability to access assistive technology
Contact with local Advocacy agency, MIDLAS continues to build mutual understanding.
Representation on state panel to quality assure HACC providers also occurred in this period.
NSW NBM
Community Connectors conducted 143 Plan Readiness Workshops and assisted over 400 individual participant families with understanding and implementing their NDIS plan.
NDIA staff commenced Support Coordination workshops for providers.
Appendix 1
Measures documented in Level 2
Performance Reporting Framework not
included in this report

68 11th Quarterly Report to COAG Disability Reform Council 31 March 2016
For reasons detailed in Appendix 3, not all measures documented in the Intergovernmental
Agreement were able to be reported on for 2015/16 Q2. These are listed below:
1. People with disability lead lives of their choice
Proportion of plans requiring early review (%)
Planning and goal setting completed on time (%)
Trends in proportion of participants using different approaches to decision supports
Carer satisfaction with agency
2. NDIS is a financially sustainable, insurance-based Scheme Growth in future commitments
Management of prudential risk
Provision of supports
Average cost of supports per assessor
Current and future funding resources
Current expenditure compared to projections
Projected expenditure compared to projected revenue
Long term cost trends (population, price and wage growth)
Average client lifetime cost of support
Number of Tier 2 supports with LAC funding and purpose of funding
Average cost of internal reviews
Average cost of appeals Proportion of participants with reduced needs after intervention supports
3. People with disability are included in their community
Community capacity building activities undertaken by funded NGOs within the period
Note: A number of measures relating to financial sustainability will be addressed in the Summary
Financial Sustainability Report.
Appendix 2
Accessible tables for Agency performance overview graphs

70 11th Quarterly Report to COAG Disability Reform Council 31 March 2016
Table 1. Access requests lodged by month48
Table 1(a): Financial year 2013/2014
State/Territory Jul-13 Aug-13 Sep-13 Oct-13 Nov-13 Dec-13 Jan-14 Feb-14 Mar-14 Apr-14 May-14 Jun-14
National 1,097 1,179 1,073 879 646 531 588 693 1,136 698 948 908
NSW HTR 391 296 310 306 168 160 176 240 422 172 262 232
SA 171 168 185 186 162 101 149 137 194 195 319 414
TAS 105 120 85 89 113 69 60 53 47 49 80 56
VIC 430 595 493 298 203 201 203 263 473 282 287 206
ACT
NT
WA
NSW NBM
48 Note: There are 374 access requests for which a date of receipt has not been recorded. Consequently they are not included in the tables below.

71 11th Quarterly Report to COAG Disability Reform Council 31 March 2016
Table 1(b): Financial year 2014/2015
State/Territory Jul-14 Aug-14 Sep-14 Oct-14 Nov-14 Dec-14 Jan-15 Feb-15 Mar-15 Apr-15 May-15 Jun-15
National 1,053 1,044 905 1,028 1,020 1,171 774 1,078 1,175 1,044 1,265 1,287
NSW HTR 237 202 200 185 173 246 148 262 300 195 320 314
SA 461 427 364 311 317 251 223 303 281 292 298 433
TAS 46 22 28 21 11 16 13 18 25 25 31 22
VIC 171 224 127 156 132 153 102 107 131 90 131 121
ACT 91 55 91 210 203 329 165 195 251 326 302 245
NT 14 20 12 6 5 0 2 3 3 3 3 8
WA 33 94 83 139 179 176 121 190 184 113 180 144
NSW NBM 237 202 200 185 173 246 148 262 300 195 320 314

72 11th Quarterly Report to COAG Disability Reform Council 31 March 2016
Table 1(c): Financial year 2015/2016
State/Territory Jul-15 Aug-15 Sep-15 Oct-15 Nov-15 Dec-15 Jan-16 Feb-16 Mar-16 Apr-16 May-16 Jun-16
National 1,137 1,206 1,598 1,657 1,407 1,201 1,136 1,336 910
NSW HTR 199 253 371 366 378 296 248 326 196
SA 380 363 351 335 272 223 209 269 211
TAS 16 22 31 25 40 33 31 18 11
VIC 112 104 93 148 105 111 89 133 90
ACT 269 232 282 370 313 256 338 312 199
NT 7 15 13 3 4 10 3 17 8
WA 113 109 123 97 126 135 124 105 90
NSW NBM 41 108 334 313 169 137 94 156 105

73 11th Quarterly Report to COAG Disability Reform Council 31 March 2016
Table 2 First approved plans by month that the plan was first approved
Table 2(a):Financial year 2013/2014
State/Territory Jul-13 Aug-13 Sep-13 Oct-13 Nov-13 Dec-13 Jan-14 Feb-14 Mar-14 Apr-14 May-
14 Jun-14
NSW HTR 4 127 141 145 160 164 162 315 494 154 165 225
SA 6 67 76 75 111 146 103 156 222 107 142 140
TAS 24 61 66 60 60 78 55 96 84 50 68 84
VIC 20 169 201 164 215 213 235 473 403 138 367 303
ACT
NT
WA
NSW NBM
National 54 424 484 444 546 601 555 1,040 1,203 449 742 752
Table 2(b):Financial year 2014/2015
State/Territory Jul-14 Aug-14 Sep-14 Oct-14 Nov-14 Dec-14 Jan-15 Feb-15 Mar-15 Apr-15 May-
15 Jun-15
NSW HTR 144 121 120 149 114 110 85 140 325 298 348 391
SA 166 150 166 208 210 184 167 238 369 341 449 653
TAS 18 21 14 18 10 16 10 15 17 14 9 12
VIC 205 112 92 190 93 115 134 58 118 132 126 113
ACT 8 18 74 100 103 129 82 145 249 71 178 268
NT 0 10 21 4 6 1 2 1 3 2 2 9
WA 0 4 97 64 148 187 51 100 278 65 85 118
NSW NBM
National 541 436 584 733 684 742 531 697 1,359 923 1,197 1,564

74 11th Quarterly Report to COAG Disability Reform Council 31 March 2016
Table 2(c):Financial year 2015/2016
State/ Territory
Jul-15 Aug-15 Sep-15 Oct-15 Nov-15 Dec-15 Jan-16 Feb-16 Mar-16 Apr-16 May-16 Jun-16
NSW HTR 131 123 189 213 231 316
SA 179 252 146 51 25 40
TAS 9 16 19 12 21 29
VIC 96 84 115 61 30 20
ACT 133 193 421 250 257 267
NT 9 0 30 1 2 14
WA 106 67 89 96 64 94
NSW NBM 0 0 51 104 132 201
National 663 735 1,060 788 762 981
Table 3. Types of mainstream supports accessed in participants plans
Support categories Total NSW SA TAS VIC ACT NT WA NSW NBM
Total 22,485 5,844 5,418 793 4,513 3,201 121 1,545 1,050
Education 52% 35% 85% 47% 38% 43% 31% 47% 74%
Self-care 38% 59% 11% 25% 56% 22% 57% 31% 39%
Community and social life 23% 16% 35% 20% 21% 26% 15% 14% 24%
General Tasks and Demands 18% 20% 16% 10% 21% 17% 12% 17% 9%
Other 49% 40% 38% 56% 61% 61% 50% 57% 50%

75 11th Quarterly Report to COAG Disability Reform Council 31 March 2016
Table 4. Committed supports expected to be provided by month of support provision ($millions)
Table 4(a): Financial year 2013/2014
State/Territory Jul-13 Aug-13 Sep-13 Oct-13 Nov-13 Dec-13 Jan-14 Feb-14 Mar-14 Apr-14 May-
14 Jun-14
National $0.8 $2.5 $5.4 $6.2 $7.8 $9.8 $11.3 $13.2 $18.0 $18.7 $23.5 $23.9
NSW HTR $0.2 $1.0 $2.3 $2.3 $2.5 $3.0 $3.4 $4.8 $7.3 $8.3 $9.2 $9.7
SA $0.1 $0.2 $0.4 $0.5 $0.7 $0.9 $1.1 $1.4 $1.7 $1.6 $2.0 $2.1
TAS $0.1 $0.4 $0.7 $1.0 $1.2 $1.4 $1.7 $1.8 $2.3 $2.4 $2.7 $2.7
VIC $0.3 $0.9 $2.1 $2.5 $3.3 $4.4 $5.0 $5.3 $6.7 $6.4 $9.6 $9.3
ACT $0.0 $0.0 $0.0 $0.0 $0.0 $0.0 $0.0 $0.0 $0.0 $0.0 $0.0 $0.0
NT $0.0 $0.0 $0.0 $0.0 $0.0 $0.0 $0.0 $0.0 $0.0 $0.0 $0.0 $0.0
WA $0.0 $0.0 $0.0 $0.0 $0.0 $0.0 $0.0 $0.0 $0.0 $0.0 $0.0 $0.0
NSW NBM $0.0 $0.0 $0.0 $0.0 $0.0 $0.0 $0.0 $0.0 $0.0 $0.0 $0.0 $0.0
Table 4(b):Financial year 2014/2015
State/Territory Jul-14 Aug-14 Sep-14 Oct-14 Nov-14 Dec-14 Jan-15 Feb-15 Mar-15 Apr-15 May-
15 Jun-15
National $28.9 $29.9 $31.5 $36.3 $38.0 $41.4 $42.8 $41.4 $49.9 $51.0 $54.8 $55.7
NSW HTR $11.3 $12.1 $12.5 $13.1 $13.5 $14.6 $15.1 $15.3 $18.5 $19.0 $20.5 $20.4
SA $2.4 $2.6 $2.9 $3.4 $3.6 $4.0 $4.5 $4.3 $5.5 $5.5 $6.5 $6.9
TAS $3.8 $3.9 $3.9 $4.2 $4.1 $4.4 $4.5 $4.2 $4.6 $4.5 $4.8 $4.7
VIC $11.5 $11.0 $11.1 $13.8 $13.9 $14.4 $14.5 $13.0 $14.6 $14.6 $14.7 $14.5
ACT $0.0 $0.2 $0.6 $1.1 $1.5 $2.0 $2.3 $2.6 $3.5 $4.2 $4.8 $5.3
NT $0.0 $0.0 $0.1 $0.1 $0.1 $0.1 $0.1 $0.1 $0.3 $0.2 $0.3 $0.3
WA $0.0 $0.1 $0.3 $0.6 $1.2 $1.9 $1.9 $1.8 $2.9 $3.0 $3.4 $3.5
NSW NBM $0.0 $0.0 $0.0 $0.0 $0.0 $0.0 $0.0 $0.0 $0.0 $0.0 $0.0 $0.0
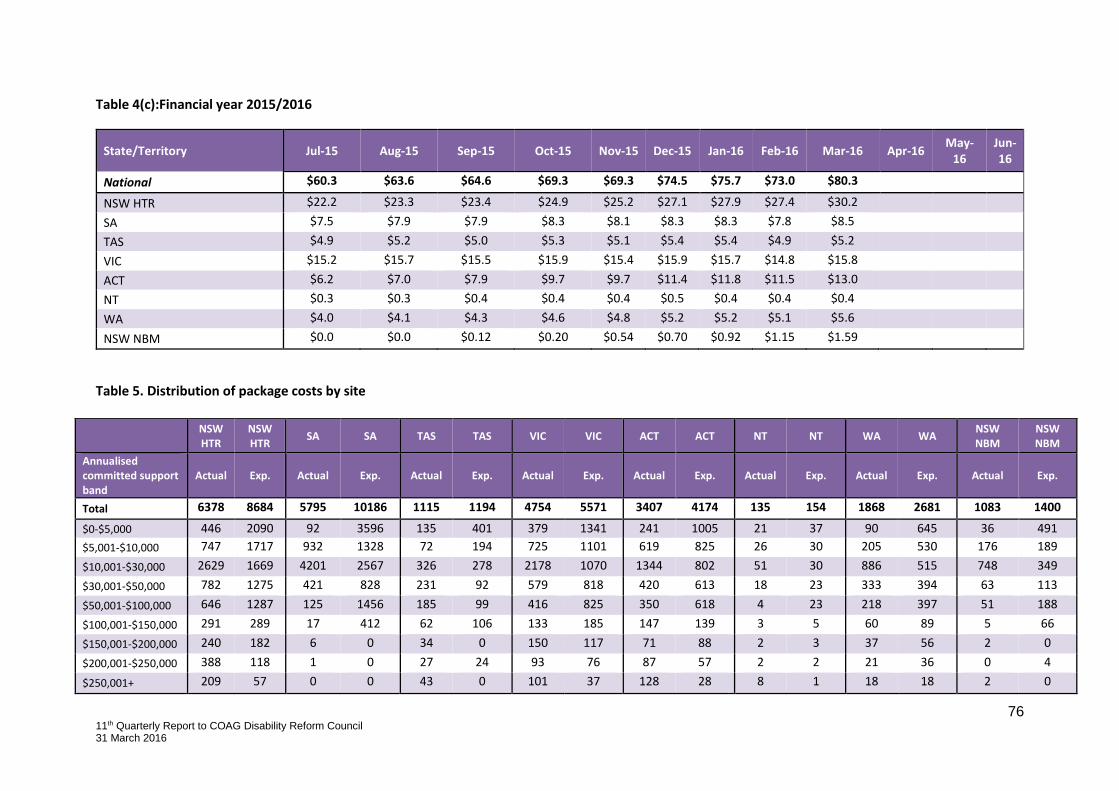
76 11th Quarterly Report to COAG Disability Reform Council 31 March 2016
Table 4(c):Financial year 2015/2016
State/Territory Jul-15 Aug-15 Sep-15 Oct-15 Nov-15 Dec-15 Jan-16 Feb-16 Mar-16 Apr-16 May-
16 Jun-16
National $60.3 $63.6 $64.6 $69.3 $69.3 $74.5 $75.7 $73.0 $80.3
NSW HTR $22.2 $23.3 $23.4 $24.9 $25.2 $27.1 $27.9 $27.4 $30.2
SA $7.5 $7.9 $7.9 $8.3 $8.1 $8.3 $8.3 $7.8 $8.5
TAS $4.9 $5.2 $5.0 $5.3 $5.1 $5.4 $5.4 $4.9 $5.2
VIC $15.2 $15.7 $15.5 $15.9 $15.4 $15.9 $15.7 $14.8 $15.8
ACT $6.2 $7.0 $7.9 $9.7 $9.7 $11.4 $11.8 $11.5 $13.0
NT $0.3 $0.3 $0.4 $0.4 $0.4 $0.5 $0.4 $0.4 $0.4
WA $4.0 $4.1 $4.3 $4.6 $4.8 $5.2 $5.2 $5.1 $5.6
NSW NBM $0.0 $0.0 $0.12 $0.20 $0.54 $0.70 $0.92 $1.15 $1.59
Table 5. Distribution of package costs by site
NSW HTR
NSW HTR
SA SA TAS TAS VIC VIC ACT ACT NT NT WA WA NSW NBM
NSW NBM
Annualised committed support band
Actual Exp. Actual Exp. Actual Exp. Actual Exp. Actual Exp. Actual Exp. Actual Exp. Actual Exp.
Total 6378 8684 5795 10186 1115 1194 4754 5571 3407 4174 135 154 1868 2681 1083 1400
$0-$5,000 446 2090 92 3596 135 401 379 1341 241 1005 21 37 90 645 36 491
$5,001-$10,000 747 1717 932 1328 72 194 725 1101 619 825 26 30 205 530 176 189
$10,001-$30,000 2629 1669 4201 2567 326 278 2178 1070 1344 802 51 30 886 515 748 349
$30,001-$50,000 782 1275 421 828 231 92 579 818 420 613 18 23 333 394 63 113
$50,001-$100,000 646 1287 125 1456 185 99 416 825 350 618 4 23 218 397 51 188
$100,001-$150,000 291 289 17 412 62 106 133 185 147 139 3 5 60 89 5 66
$150,001-$200,000 240 182 6 0 34 0 150 117 71 88 2 3 37 56 2 0
$200,001-$250,000 388 118 1 0 27 24 93 76 87 57 2 2 21 36 0 4
$250,001+ 209 57 0 0 43 0 101 37 128 28 8 1 18 18 2 0

Appendix 3
Definition of measures reported in
Quarterly Report to the COAG Disability
Reform Council

78 11th Quarterly Report to COAG Disability Reform Council 31 March 2016
1. Participant outcomes
Measure as indicated in Integrated Performance
Framework Title Brief Description
Included in 2015-16 Q3 report?
1.1.1. Information about participants with approved plans
Summary of demographics for participants, defined as people eligible for funding as per the Act, who have had or currently have an approved plan for funding in place.
Yes
1.1.2. Support needs for participants
For participants, identifies the life domains which supports are being funded to address identified need. Note: Approved funding may address more than one life domain.
Yes
n/a
Proportion of participants achieving their life goals as specified in their plan
The outcome of a review of a participant's goals. Goals refer to the overarching, personal goals of participants.
No - insufficient Scheme development for any plan reviews. Reporting to commence following finalisation of outcomes framework.
n/a Proportion of participants achieving their plan goals (total)
The outcome of a review of a participant's plan objectives (plan goals). Plan objectives refer to the identified aims within a plan, for which funding is allocated to support the achievement.
No - insufficient Scheme development for any plan reviews. Reporting to commence following finalisation of outcomes framework.
n/a
Proportion of participants achieving their plan goals in one or more specific domains
The outcome of review of a participant's plan objectives (plan goals), with identification of the aggregated life domain the objective was related to.
No - insufficient Scheme development for any plan reviews. Reporting to commence following finalisation of outcomes framework.
n/a Planning and goal setting completed on time (%)
Reports the proportion of plan reviews that are completed on or before the previous plan's scheduled end date.
No - insufficient Scheme development for any plan reviews. Reporting to commence following finalisation of outcomes framework.
n/a Plans requiring early review (%)
Reports the proportion of plans that were, or are due to be, reviewed less than 12 months after the plan commenced
No- an appropriate measure is required to be developed. There is also insufficient Scheme development for this

79 11th Quarterly Report to COAG Disability Reform Council 31 March 2016
Measure as indicated in Integrated Performance
Framework Title Brief Description
Included in 2015-16 Q3 report?
measure to be meaningful.
Measure as indicated in Integrated Performance
Framework Title Brief Description
Included in 2015-16 Q3 report?
n/a Active Participants (Tier 2 and Tier 3)
On plan review, number of participants who change the way funding is utilised to support their needs.
No - insufficient Scheme development for any plan reviews. Reporting to commence following finalisation of outcomes framework.
n/a Availability of provider services (%)
Proportion of identified support needs that have at least one registered provider servicing the residential area of the participant.
No. Data is not currently available for this measure.
1.2.1. Funded support purpose
Support purposes for which supports have been funded. Note: A single plan can contain funding in multiple support purposes.
Yes
n/a
Proportion of participants with support packages within expected ranges (reference +/- x %)
Delegations are determined by the instrument of Delegation. This measure reports the delegation required to approve committed plans
No. Data is not currently available for this measure
1.2.2. Delivery of agreed supports as planned
Proportion of funds committed for supports delivered to date that have been invoiced.
Yes
1.2.3. Proportion of participants with invoiced support
Proportion of participants with funded supports in support category that have had at least one payment.
Yes
n/a
Trends in proportion of participants using different approaches to decision supports
At plan review, proportion of participants who choose to change the way their plan is managed
No - insufficient Scheme development for any plan reviews. Reporting to commence following finalisation of outcomes framework.
1.3.1.
Trends in proportion of participants using each, or a combination, of plan management options
Split of plan management options being used by active participants.
Yes

80 11th Quarterly Report to COAG Disability Reform Council 31 March 2016
Measure as indicated in Integrated Performance
Framework Title Brief Description
Included in 2015-16 Q3 report?
1.3.2 Access requests accepted for funding
Number of eligible access requests that have established plans for funding.
Yes
1.3.3. Reviews of decisions
Number of decisions that have been formally requested to be reviewed. Outcome of reviews are classified as: Affirmed = original decision was maintained; Set Aside = original decision was overturned Pending = review is still underway
Yes
1.3.4.
Total appeals by outcome with the Administration Appeal Tribunal
Number of appeals submitted to the AAT. Outcome of reviews are classified as: Affirmed = participant loses appeal; Set Aside = participant wins appeal Pending = appeal is still underway Varied = participant wins appeal Dismissed = appeal is dismissed Withdrawn = participant withdraws appeal
Yes
1.3.5. Appeals by Category with the Administration Appeal Tribunal
Number of appeals submitted.
Yes
2. Financial sustainability
Measure as indicated in Integrated Performance
Framework Title Brief Description
Included in 2015-16 Q3 report?
n/a Management of prudential risk
Reports liabilities and assets of the Agency
No - Work on an Insurances Principles and Financial Sustainability Manual is underway. This document sets out a prudential governance framework.
2.1.6. Payments to providers and participants, split by support category
Payments against plans, split by support type and payee.
Yes

81 11th Quarterly Report to COAG Disability Reform Council 31 March 2016
Measure as indicated in Integrated Performance
Framework Title Brief Description
Included in 2015-16 Q3 report?
2.1.7. Average and median costs of individual support packages
Reports average and median annualised committed funds in each site
Yes
2.1.8.
Value of and number of active approved packages by participant group
Number of plans with approved funding, the total costs committed in those plans, and the average annualised cost of the plans.
Yes
2.1.9.
Number of participants receiving supports paid for with cash and/or in-kind supports
Number of participants who have had payments against plans. This does not represent total expenditure
Yes
2.1.10. Ratio of cash to in-kind services by participant group
Ratio of supports paid for through cash or in-kind arrangements
Yes
n/a Average cost of supports per assessor
Average value of funds committed in plans per planner
No - insufficient Scheme experience for informed adjustment to actuarial model
2.1.11. Tier 3 participant numbers, and people supported by Tier 2
Reports number of people accessing Tier 3 supports.
Partial - system for capturing Tier 2 activities was not implemented for 2013-14
2.1.12. Total number of plans developed
Total number of plans that have been developed and approved. This measure includes plans that have now been superseded.
Yes
2.1.13. Number of plans with single supports
Number of plans approved that only contain a single type of support
Yes
n/a Current and future funding resources
Current annualised costs of approved plans, and the un-annualised committed value of plans
No - Projections will be provided in the annual financial sustainability report.
n/a Current expenditure compared to projections
Actual expenditure compared to actuarial projections
No - Projections will be provided in the annual financial sustainability report.
n/a Projected expenditure compared to projected revenue
Comparison of projected expenditure to projected revenue
No - Projections will be provided in the annual financial sustainability report.
n/a Long term cost trends (population, price and wage growth)
Monitors long term economic assumptions
No - Projections will be provided in the annual

82 11th Quarterly Report to COAG Disability Reform Council 31 March 2016
Measure as indicated in Integrated Performance
Framework Title Brief Description
Included in 2015-16 Q3 report?
financial sustainability report.
n/a Average client lifetime cost of support
Average actuarial estimate of individual participants' future cost liabilities.
No - insufficient Scheme experience for informed adjustment to actuarial model
n/a
Number of Tier 2 supports with LAC funding and purpose of funding
Number of supports with Tier 2 funding. Note: This is not the same as number of participants - supports are not necessarily attached to individuals
No - system for capturing Tier 2 activities was not implemented for 2013-14
n/a Average cost of internal reviews
Average cost of administering internal reviews)
No - system is not in place for capturing internal review costs
n/a Average cost of appeals Average cost of administering appeals
No - system is not in place for capturing appeal costs for 2013-14
n/a
Proportion of participants with reduced needs after intervention supports
Reports growth in annual committed costs for participants who have had early intervention supports as part of the previous plans.
No - Analysis of participant’s who have received second plans will be included in the financial sustainability report. This analysis will become more meaningful as the Scheme progresses.
n/a Proportion of participants with early intervention supports
Proportion of currently approved plans with non-zero supports that have supports identified as early intervention supports - included to reduce long term need for lifetime supports
No. The data item previously being used to report this measure was reviewed and deemed not meaningful. Work is underway to better report against this measure.
n/a
Total cost of Investment in research and innovation (including the sector development fund)
Costs for investment into research and innovation which includes the sector development fund.
No- The relevant grants (sector development fund) have been transferred to the Department of Social Services.
3. Community Inclusion
Measure as indicated in Integrated Performance
Framework Title Brief Description
Included in 2015-16 Q3 report?
3.1.1 Proportion of participants accessing mainstream services
Proportion of participants with active approved funded supports who are also
Yes

83 11th Quarterly Report to COAG Disability Reform Council 31 March 2016
Measure as indicated in Integrated Performance
Framework Title Brief Description
Included in 2015-16 Q3 report?
accessing mainstream supports
3.1.2 Support categories with mainstream services
Number of mainstream services, by support category
Yes
3.2.1 Community awareness activities undertaken within the period
Reports community awareness activities undertaken by LACs
Yes
3.3.1
Community capacity building activities undertaken by LACs within the period
Reports community capacity building activities undertaken by LACs
Yes
n/a
Community capacity building activities undertaken by funded NGOs within the period
Reports funding provided to Non-Government Organisations to undertake community capacity building activities.
No – Difficult to measure with accuracy. Further work is being conducted to ensure reporting on this is possible.