


Languages
Pages
Legal


Final Report
Mid-term Quick Impact Evaluation Study of Special Package for Drought Mitigation and Integrated
Development of Bundelkhand Region
NABARD Consultancy Service Pvt. Ltd.
Prepared for National Rainfed Area Authority
Erstwhile, Planning Commission, now NITI Aayog
Govt. of India
by

ii
Quick Impact Evaluation Study of Special Package for Drought Mitigation and
Integrated Development of Bundelkhand Region
A Study Report prepared by NABARD Consultancy Services (NABCONS) Pvt Ltd.for the National Rainfed Area Authority, erstwhile Planning Commission, now NITI Aayog, Government of India, New Delhi Study team from NABARD Consultancy Services (P) Ltd. (NABCONS)
Overall guidance:
Shri K. Jindal, Chief General Manager & Chief Executive Officer, NABCONS
Shri. Arun. K. Tallur, Vice President, NABCONS
Dr. Sunil Kumar, Vice President, NABCONS
Principal Researcher and Team Leader
Dr. V. Mohandoss, NABCONS
Shri. Sadique Akhtar, NABCONS
Members:
Shri Tariq Shafiq, Consultant MI & Water Resources, NABCONS
Shri. Kuldeep Singh, Vice President, NABCONS
Shri. Jay Nigam, AGM, NABARD
Shri. Amit Kumar, Associate Consultant- Economist, NABCONS

iii
Disclaimer
This document has been prepared by NABARD Consultancy Services
(NABCONS) Pvt. Ltd for the National Rainfed Area Authority (NRAA),
Planning Commission, Government of India, New Delhi based on the
field study.
The views expressed in the report are advisory in nature. It does not
represent or reflect the policy or view of NABCONS/ National Bank for
Agriculture & Rural Development (NABARD). NABCONS/ NABARD
accepts no financial liability or any other liability whatsoever to anyone
in using this report.

iv
Acknowledgement
The Quick Impact Evaluation Study of Special Package for Drought Mitigation and Integrated Development of Bundelkhand Region was undertaken by NABARD Consultancy Services (P) Ltd. on behalf of National Rainfed Area Authority (NRAA), Planning Commission, Govt. of India covering the period of XI Five Year Plan, with a view to assessing the scheme’s impact and evaluating operational roles of various stakeholders, identifying constraints and bottlenecks and suggesting areas for improvement. NABCONS would like to thank to NRAA for their financial support to this study. We would also like to place on record our special gratitude to Ms Sindhushree Khullar, Secretary, Planning Commission for extending her support, cooperation and valuable suggestions during the study period. We also thank Dr. J S Samra, CEO, NRAA and Dr. K S Ramachandra, Member and Technical Expert, NRAA for their valuable inputs and contribution at every stage of the study. We appreciate their assistance in providing essential information and data on the package. The cooperation, support, valuable inputs and insights received from the Divisional Commissioners of Sagar, Jhansi, and Chitrakoot and other officials of district administration and implementing departments is gratefully acknowledged. The cooperation received from the Nodal Officers and Consultants of NABCONS and other Officers of UP & MP Regional Offices of NABARD in conducting the study, especially in data collection and compilation of preliminary study observations is also deeply acknowledged. The study could not have been completed successfully but for the best efforts put in by the staff attached to the Zonal Office of NABCONS, New Delhi who deserve our appreciation.

v
Table of Contents
LIST OF TABLES IX
LIST OF FIGURES XII
LIST OF ABBREVIATION XIII
EXECUTIVE SUMMARY XIV
CHAPTER 1 INTRODUCTION 29
BUNDELKHAND REGION 29
BUNDELKHAND PACKAGE 30
SECTORS OF FOCUS 31
SECTORAL ALLOCATION OF ACA FUNDS IN BUNDELKHAND REGION 31
RELEASES AND EXPENDITURE UNDER ACA ALLOCATION 32
RATIONALE, SCOPE AND TOR FOR THE STUDY 32
CHAPTER 2 APPROACH, METHODOLOGY, SAMPLING AND RESEARCH TOOLS 34
APPROACH 34
METHODOLOGY 35
SAMPLE 35
SAMPLE DISTRIBUTION 37
RESEARCH TOOLS 38
CHAPTER 3 WATER RESOURCES SECTOR – SURFACE WATER IRRIGATION 40
THE ALLOCATIONS AND FINANCIAL ACHIEVEMENTS 40
BRIEF OUTLINE OF SURFACE IRRIGATION PROJECTS 41
OVER ALL PHYSICAL PROGRESS 42
ADDITIONAL IRRIGATION CAPACITY CREATED 42
MAJOR OBSERVATIONS DURING FIELD VISITS: MADHYA PRADESH 45
PHYSICAL PROGRESS OF SAMPLE PROJECTS 45
ANTICIPATED AND ACTUAL COST OF SAMPLE PROJECTS 49
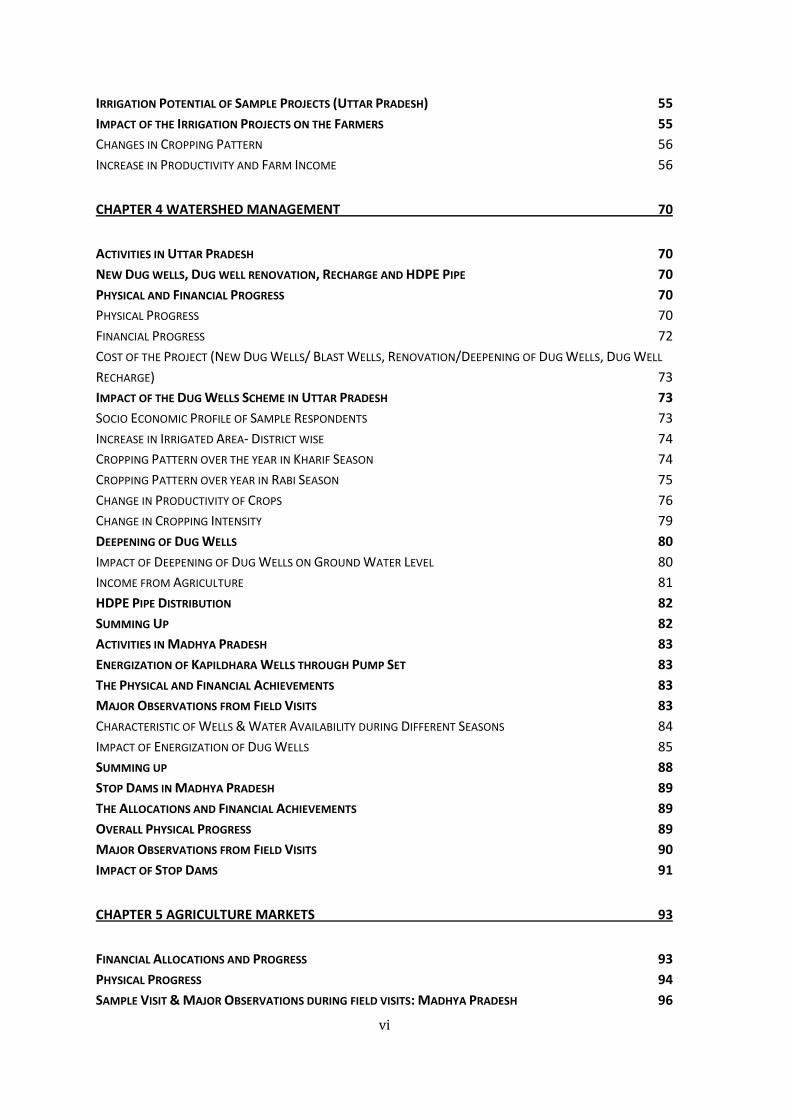
IRRIGATION POTENTIAL OF SAMPLE PROJECTS (MADHYA PRADESH) 50
IMPACT OF THE IRRIGATION PROJECTS ON THE FARMERS 51
CHANGES IN CROPPING PATTERN 52
INCREASE IN PRODUCTIVITY AND FARM INCOME 52
MAJOR OBSERVATIONS FROM FIELD VISITS: UTTAR PRADESH 53
PHYSICAL PROGRESS OF SAMPLE PROJECTS 53
ANTICIPATED AND ACTUAL COST OF THE PROJECT 54
vi
IRRIGATION POTENTIAL OF SAMPLE PROJECTS (UTTAR PRADESH) 55
IMPACT OF THE IRRIGATION PROJECTS ON THE FARMERS 55
CHANGES IN CROPPING PATTERN 56
INCREASE IN PRODUCTIVITY AND FARM INCOME 56
CHAPTER 4 WATERSHED MANAGEMENT 70
ACTIVITIES IN UTTAR PRADESH 70
NEW DUG WELLS, DUG WELL RENOVATION, RECHARGE AND HDPE PIPE 70
PHYSICAL AND FINANCIAL PROGRESS 70
PHYSICAL PROGRESS 70
FINANCIAL PROGRESS 72
COST OF THE PROJECT (NEW DUG WELLS/ BLAST WELLS, RENOVATION/DEEPENING OF DUG WELLS, DUG WELL
RECHARGE) 73
IMPACT OF THE DUG WELLS SCHEME IN UTTAR PRADESH 73
SOCIO ECONOMIC PROFILE OF SAMPLE RESPONDENTS 73
INCREASE IN IRRIGATED AREA- DISTRICT WISE 74
CROPPING PATTERN OVER THE YEAR IN KHARIF SEASON 74
CROPPING PATTERN OVER YEAR IN RABI SEASON 75
CHANGE IN PRODUCTIVITY OF CROPS 76
CHANGE IN CROPPING INTENSITY 79
DEEPENING OF DUG WELLS 80
IMPACT OF DEEPENING OF DUG WELLS ON GROUND WATER LEVEL 80
INCOME FROM AGRICULTURE 81
HDPE PIPE DISTRIBUTION 82
SUMMING UP 82
ACTIVITIES IN MADHYA PRADESH 83
ENERGIZATION OF KAPILDHARA WELLS THROUGH PUMP SET 83
THE PHYSICAL AND FINANCIAL ACHIEVEMENTS 83
MAJOR OBSERVATIONS FROM FIELD VISITS 83
CHARACTERISTIC OF WELLS & WATER AVAILABILITY DURING DIFFERENT SEASONS 84
IMPACT OF ENERGIZATION OF DUG WELLS 85
SUMMING UP 88
STOP DAMS IN MADHYA PRADESH 89
THE ALLOCATIONS AND FINANCIAL ACHIEVEMENTS 89
OVERALL PHYSICAL PROGRESS 89
MAJOR OBSERVATIONS FROM FIELD VISITS 90
IMPACT OF STOP DAMS 91
CHAPTER 5 AGRICULTURE MARKETS 93
FINANCIAL ALLOCATIONS AND PROGRESS 93
PHYSICAL PROGRESS 94
SAMPLE VISIT & MAJOR OBSERVATIONS DURING FIELD VISITS: MADHYA PRADESH 96

vii
SAMPLE VISIT & MAJOR OBSERVATIONS DURING FIELD VISITS: UTTAR PRADESH 96
IMPACT OF MARKET YARDS AND GODOWNS PROJECTS 98
RECOMMENDATION 99
CHAPTER 6 ANIMAL HUSBANDRY 100
THE ALLOCATION AND FINANCIAL ACHIEVEMENTS 100
BRIEF OUTLINE OF ANIMAL HUSBANDRY PROJECTS 101
OVERALL PHYSICAL PROGRESS 101
DISTRIBUTION OF GOAT UNITS 102
PERFORMANCE OF BREED IMPROVEMENT ACTIVITIES 104
MAJOR OBSERVATIONS DURING FIELD VISITS: UTTAR PRADESH 106
CHAPTER 7 DAIRY DEVELOPMENT 108
THE ALLOCATION AND FINANCIAL ACHIEVEMENTS 108
BRIEF OUTLINE OF DAIRY PROJECTS 108
OVERALL PHYSICAL PROGRESS 109
MAJOR OBSERVATIONS FROM FIELD VISITS: UTTAR PRADESH 110
MAJOR OBSERVATIONS DURING FIELD VISITS: MADHYA PRADESH 113
RECOMMENDATION/ SUGGESTION 115
CHAPTER 8 FOREST & ENVIRONMENT 117
FINANCIAL ALLOCATIONS AND PROGRESS 117
CONVERGENCE OF FUNDS IN FOREST AND ENVIRONMENT ACTIVITIES 118
PHYSICAL PROGRESS 119
SAMPLE VISIT & MAJOR OBSERVATIONS FROM FIELD VISITS: MADHYA PRADESH 120
SAMPLE VISIT & MAJOR OBSERVATIONS FROM FIELD VISITS: UTTAR PRADESH 120
IMPACT OF THE PROJECT 121
RECOMMENDATION 122
CHAPTER 9 RURAL DRINKING WATER 123
FINANCIAL ALLOCATIONS AND FINANCIAL ACHIEVEMENTS 123
FINANCIAL PROGRESS 123
PHYSICAL PROGRESS 124
SAMPLE VISIT & MAJOR OBSERVATIONS FROM FIELD VISITS: MADHYA PRADESH 126
SAMPLE VISIT & MAJOR OBSERVATIONS FROM FIELD VISITS: UTTAR PRADESH 126
IMPACT OF THE PROJECT ON LIVES OF THE BENEFICIARIES 127
IMPACT IN MADHYA PRADESH- 127
IMPACT IN UTTAR PRADESH- 128
RECOMMENDATION 128

viii
CHAPTER 10 RELEVANCE/ ACCEPTANCE OF DIFFERENT INTERVENTION MADE UNDER THE
PACKAGE AS MEDIUM LONG TERM STRATEGIES FOR DROUGHT MITIGATION. 129
RAINFALL SITUATION AND IRRIGATION COVERAGE IN BUNDELKHAND 129
MEDIUM AND LONG TERM STRATEGIES FOR DROUGHT MITIGATION 131
FOCUS OF THE PACKAGE 132
LIKELY PHYSICAL IMPACT OF THE PACKAGE ON DROUGHT MITIGATION 132
CHAPTER 11 CONVERGENCE IN THE PACKAGE 134
LEVEL AND EXTENT OF CONVERGENCE OF VARIOUS CS/CSS SCHEMES, MGNREGA IN DIFFERENT COMPONENTS
AND THEIR IMPACT ON OVERALL PROGRESS OF THE PACKAGE. 134
CHAPTER 12 MONITORING OF THE PACKAGE 139
VISIT OF NRAA OFFICIALS 139
REVIEW MEETINGS WITH PRINCIPAL SECRETARIES AND SENIOR GOVERNMENT OFFICIALS OF THE IMPLEMENTING
DEPARTMENTS 140
ADVISORY MEETINGS AT DELHI 140
CHAPTER 13 RECOMMENDATION AND SUGGESTIONS 142
PLANNING AND IMPLEMENTATION DEFICIENCIES AND SUGGESTIONS 142
DELAYS IN IMPLEMENTATION OF THE PROJECTS 142
CONVERGENCE A HINDRANCE TO IMPLEMENTATION? 143
REVISITING PROJECTS INVOLVING SUPPORT FOR INDIVIDUALS 143
POST HARVEST GETTING EQUAL FOCUS AS DROUGHT MITIGATION 144
ABSENCE OF STRUCTURED MONITORING MECHANISM OF THE PACKAGE 144
ABSENCE OF STRUCTURED REVIEW BY ADVISORY BODY 144
INADEQUATE REPORTING SYSTEM TO NRAA 145
ABSENCE OF CONCURRENT / MIDTERM MONITORING AND EVALUATION MECHANISM BY THIRD PARTIES 145
ANNEXURE TOOLS USED DURING THE STUDY 146

ix
List of Tables
TABLE 1 DISTRICTS OF BUNDELKHAND REGION OF UP AND MP ................................................................................... 29
TABLE 2 FUNDING SOURCES FOR BUNDELKHAND PACKAGE ......................................................................................... 30
TABLE 3 ACA ALLOCATION, RELEASES AND EXPENDITURE IN MADHYA PRADESH .............................................................. 32
TABLE 4 ACA ALLOCATION, RELEASES AND EXPENDITURE IN UTTAR PRADESH ................................................................. 32
TABLE 5 SAMPLE DISTRIBUTION OF MADHYA PRADESH .............................................................................................. 37
TABLE 6 SAMPLE DISTRIBUTION OF UTTAR PRADESH .................................................................................................. 38
TABLE 7 ALLOCATION TO WATER RESOURCE PROJECT UNDER BUNDELKHAND PACKAGE ................................................... 40
TABLE 8 FINANCIAL ACHIEVEMENTS UNDER WATER RESOURCE PROJECT UNDER BUNDELKHAND PACKAGE ........................... 41
TABLE 9 SHARE OF DIFFERENT PROJECT UNDER SURFACE IRRIGATION IN TOTAL ACA ALLOCATIONS ...................................... 41
TABLE 10 PHYSICAL PROGRESS UNDER SURFACE IRRIGATION PROJECTS IN MP & UP ........................................................ 42
TABLE 11 ACHIEVEMENT OF TARGETED IRRIGATED ACREAGE UNDER SURFACE IRRIGATION PROJECTS.................................... 44
TABLE 12 DISTRICT WISE SAMPLE PROJECTS VISITED UNDER SURFACE IRRIGATION PROJECTS ............................................... 45
TABLE 13 STATUS OF IMPLEMENTATION OF SAMPLE MINOR IRRIGATION PROJECTS IN MP ................................................. 48
TABLE 14 SANCTIONED AND ACTUAL COST OF SAMPLE SURFACE IRRIGATION PROJECTS IN MP ............................................ 49
TABLE 15 CCA, POTENTIAL CREATED AND AREA IRRIGATED DURING RABI FROM MAJOR/ MINOR IRRIGATION PROJECT IN MP .. 51
TABLE 16 AVERAGE LAND HOLDING AND CROPPING INTENSITY OF SAMPLE BENEFICIARIES OF SURFACE IRRIGATION PROJECTS IN
MP ......................................................................................................................................................... 52
TABLE 17 KHARIF CROPPING PATTERN OF SAMPLE BENEFICIARIES OF SURFACE IRRIGATION PROJECTS IN MP ......................... 52
TABLE 18 RABI CROPPING PATTERN OF SAMPLE BENEFICIARIES OF SURFACE IRRIGATION PROJECTS IN MP ............................. 52
TABLE 19 PRODUCTIVITY OF MAJOR CROPS OF SAMPLE BENEFICIARIES OF SURFACE IRRIGATION PROJECTS IN MP ................... 53
TABLE 20 SAMPLE SURFACE IRRIGATION PROJECTS VISITED IN UP ................................................................................. 53
TABLE 21 SANCTIONED AND ACTUAL COST OF SAMPLE SURFACE IRRIGATION PROJECTS IN UP ............................................ 54
TABLE 22 YEAR WISE IRRIGATION POTENTIAL OF SAMPLE SURFACE IRRIGATION PROJECTS IN UP ......................................... 55
TABLE 23 AVERAGE LAND HOLDING AND CROPPING INTENSITY OF SAMPLE BENEFICIARIES OF SURFACE IRRIGATION PROJECTS IN
UP .......................................................................................................................................................... 56
TABLE 24 KHARIF CROPPING PATTERN OF SAMPLE BENEFICIARIES OF SURFACE IRRIGATION PROJECTS IN UP ......................... 56
TABLE 25 RABI CROPPING PATTERN OF SAMPLE BENEFICIARIES OF SURFACE IRRIGATION PROJECTS IN UP ............................. 56
TABLE 26 PRODUCTIVITY OF MAJOR CROPS OF SAMPLE BENEFICIARIES OF SURFACE IRRIGATION PROJECTS IN UP ................... 57
TABLE 27 AVERAGE HOUSEHOLD FARM INCOME OF SAMPLE BENEFICIARIES OF SURFACE IRRIGATION PROJECTS IN UP ............ 57
TABLE 28: COMPONENT WISE PHYSICAL PROGRESS UNDER SAMPLE SURFACE IRRIGATION PROJECTS IN MADHYA PRADESH ...... 59
TABLE 29: COMPONENT WISE PHYSICAL PROGRESS UNDER SAMPLE SURFACE IRRIGATION PROJECTS IN UTTAR PRADESH .......... 66
TABLE 30 DISTRICT WISE PHYSICAL TARGETS AND ACHIEVEMENTS OF DUG WELLS SCHEME UNDER BUNDELKHAND PACKAGE IN UP
.............................................................................................................................................................. 71
TABLE 31 DISTRICT WISE FINANCIAL TARGETS AND ACHIEVEMENTS OF DUG WELL SCHEME IN UP ........................................ 72
TABLE 32 COST INCURRED FOR CREATING AN ACRE OF IRRIGATED AREA BY NEW DUG WELLS IN UP ..................................... 73
TABLE 33 SOCIO ECONOMIC PROFILE OF SAMPLE DUG WELL BENEFICIARIES IN UP ........................................................... 73
TABLE 34 CHANGE IN STATUS OF RAINFED AND IRRIGATED ACREAGE DUE TO DUG WELL IN UP ........................................... 74
TABLE 35 CHANGE IN CROPPING PATTERN OF KHARIF CROPS AMONG DUG WELL BENEFICIARIES IN UP ............................... 75
TABLE 36 CHANGE IN CROPPING PATTERN OF RABI CROPS AMONG DUG WELL BENEFICIARIES IN UP.................................... 75
TABLE 37 CHANGE IN PRODUCTIVITY OF KHARIF CROPS (KG/ACRE) AMONG DUG WELL BENEFICIARIES IN UP ........................ 76
TABLE 38 CHANGE OF PRODUCTIVITY OF RABI CROP (KG/ACRE) AMONG DUG WELL BENEFICIARIES IN UP ........................... 78
TABLE 39 CHANGE IN CROPPING INTENSITY AMONG DUG WELL BENEFICIARIES IN UP ....................................................... 79
TABLE 40 PERCENTAGE DISTRIBUTION OF DEEPENING OF DUG WELLS WITH RESPECT TO DEPTH IN UP ................................. 80
TABLE 41 PHYSICAL AND FINANCIAL PROGRESS UNDER PUMP SET DISTRIBUTION SCHEME OF BUNDELKHAND PACKAGE IN MP . 83
TABLE 42 SOCIO ECONOMIC PROFILE OF PUMP SET BENEFICIARIES IN MP ...................................................................... 84
TABLE 43 DIMENSION OF DUG WELLS AND DEPTH TO WATER LEVEL IN MP ..................................................................... 85
TABLE 44 IMPACT OF DUG WELLS AND PUMP SETS ON CROPPING PATTERN AND YIELDS: AGGREGATE OF SAMPLES IN MP ........ 86

x
TABLE 45 ACA ALLOCATION IN STOP DAMS UNDER BUNDELKHAND PACKAGE IN MP ...................................................... 89
TABLE 46 ALLOCATION, RELEASE AND EXPENDITURE IN STOP DAMS UNDER BUNDELKHAND PACKAGE IN MP ........................ 89
TABLE 47 PHYSICAL PROGRESS AND FINANCIAL EXPENDITURE OF STOP DAM IN MP UNDER BUNDELKHAND PACKAGE ............ 89
TABLE 48 SAMPLE STOP DAMS VISITED AND COST STRUCTURE ..................................................................................... 90
TABLE 49 NUMBER OF STOP DAMS AND HOUSEHOLD BENEFITTED FROM STOP DAMS UNDER BUNDELKHAND SPECIAL PACKAGE IN
MP ......................................................................................................................................................... 91
TABLE 50 IMPACT OF STOP DAMS ON WATER STORAGE, IRRIGATED AREA AND WATER LEVEL IN NEARBY DUG WELLS ............... 92
TABLE 51 ALLOCATION TO AGRICULTURE MARKET YARDS, GODOWN PROJECT UNDER BUNDELKHAND PACKAGE .................. 93
TABLE 52 FINANCIAL ACHIEVEMENTS UNDER STORAGE AND MARKET YARDS PROJECTS .................................................... 94
TABLE 53 PHYSICAL PROGRESS OF STORAGE AND MARKET YARD PROJECTS IN MP .......................................................... 94
TABLE 54 PHYSICAL PROGRESS UNDER MARKET YARDS AND STORAGE PROJECTS IN UP ................................................... 95
TABLE 55 SAMPLE MARKET YARDS/ STORAGE PROJECTS VISITED IN MP ....................................................................... 96
TABLE 56 SAMPLE PROJECTS OF MARKET YARDS/ RURAL INFRASTRUCTURE NUCLEI VISITED IN UP ..................................... 97
TABLE 57 STORAGE CAPACITY CREATED UNDER THE PACKAGE IN UP AND MP ................................................................ 98
TABLE 58 ALLOCATION IN ANIMAL HUSBANDRY PROJECT UNDER BUNDELKHAND PACKAGE ............................................ 100
TABLE 59 ALLOCATION, RELEASE AND EXPENDITURE IN ANIMAL HUSBANDRY SECTOR UNDER BUNDELKHAND PACKAGE ....... 100
TABLE 60 OVERALL PHYSICAL PROGRESS OF ACTIVITIES UNDER TAKEN IN ANIMAL HUSBANDRY SECTION IN UP & MP UNDER
BUNDELKHAND PACKAGE .......................................................................................................................... 101
TABLE 61 SOCIO ECONOMIC PROFILE OF GOATRY BENEFICIARIES ................................................................................ 103
TABLE 62 STATUS OF GOATRY UNITS AND IMPACT ON INCOME OF SAMPLE BENEFICIARIES ............................................... 103
TABLE 63 STATUS OF BREED IMPROVEMENT PROGRAM UNDER BUNDELKHAND PACKAGE ............................................... 105
TABLE 64 ALLOCATION IN DAIRY SECTOR UNDER BUNDELKHAND PACKAGE .................................................................. 108
TABLE 65 ALLOCATION, RELEASE AND EXPENDITURE IN DAIRY SECTOR UNDER BUNDELKHAND PACKAGE............................ 108
TABLE 66 PHYSICAL PROGRESS UNDER DAIRY SECTOR IN UP & MP ........................................................................... 109
TABLE 67 STATUS AND IMPACT OF DAIRY DEVELOPMENT UNDER BUNDELKAHAND PACKAGE IN UP ................................... 111
TABLE 68 STATUS AND IMPACT OF DAIRY DEVELOPMENT IN MP ................................................................................ 114
TABLE 69 ALLOCATION AND EXPENDITURE IN ENVIRONMENT & FOREST SECTOR UNDER BUNDELKHAND PACKAGE .............. 117
TABLE 70 CONVERGENCE OF FUND IN FOREST AND ENVIRONMENT ACTIVITIES UNDER BUNDELKHAND PACKAGE ................. 118
TABLE 71 AREA TREATED AND STRUCTURE CREATED UNDER SOIL AND WATER CONSERVATION ACTIVITIES BY FOREST DEPT. UNDER
THE BUNDELKHAND PACKAGE (MADHYA PRADESH) ........................................................................................ 119
TABLE 72 PHYSICAL PROGRESS IN UP UNDER SOIL AND WATER CONSERVATION ACTIVITY IN UP ....................................... 119
TABLE 73 AREA TREATED BY FOREST DEPT UNDER THE BUNDELKHAND PACKAGE IN MP ................................................ 120
TABLE 74 AREA TREATED BY FOREST DEPT. UNDER BUNDELKHAND PACKAGE IN UP ...................................................... 121
TABLE 75 ALLOCATION, RELEASES AND EXPENDITURE IN DRINKING WATER PROJECTS UNDER BUNDELKHAND PACKAGE ....... 123
TABLE 76 DISTRICT WISE FINANCIAL ALLOCATION AND UTILIZATION OF FUND IN DRINKING WATER PROJECTS IN MP UNDER
BUNDELKHAND SPECIAL PACKAGE. .............................................................................................................. 124
TABLE 77 DISTRICT WISE FINANCIAL ALLOCATION AND UTILIZATION IN DRINKING WATER SCHEME UNDER BUNDLKHAND
PACKAGE IN UP ....................................................................................................................................... 124
TABLE 78 PHYSICAL PROGRESS UNDER RURAL DRINKING WATER SCHEME PROJECTS IN MP .............................................. 125
TABLE 79 PHYSICAL PROGRESS UNDER RURAL DRINKING WATER SCHEME UNDER BUNDELKHAND PACKAGE IN UP................ 125
TABLE 80 TOTAL NUMBER OF SCHEMES AND SAMPLE PROJECTS UNDER RURAL DRINKING WATER SCHEMES VISITED IN MP .... 126
TABLE 81 TOTAL NUMBER OF SCHEMES AND SAMPLE PROJECTS UNDER RURAL DRINKING WATER PROJECT VISITED IN UP ...... 127
TABLE 82 NET SOWN AREA AND IRRIGATED AREA (000 HA) IN BUNDELKHAND REGION .................................................. 130
TABLE 83 MEDIUM/LONG TERM STRATEGIES DRAWN UNDER THE BUNDELKHAND PACKAGE ............................................ 131
TABLE 84 ANTICIPATED IMPACT OF THE BUNDELKHAND PACKAGE .............................................................................. 133
TABLE 85 FUND CONVERGENCE UNDER BUNDELKHAND PACKAGE (RS. CRORE) ............................................................ 134
TABLE 86 RELEASE OF FUNDS FROM DIFFERENT SOURCES UNDER BUNDELKHAND PACKAGE ............................................. 135
TABLE 87 PHYSICAL PROGRESS OF ACTIVITIES INVOLVING CONVERGENCE OF MGNREGA FUNDS IN UP ............................ 135
TABLE 88 PHYSICAL PROGRESS OF ACTIVITIES INVOLVING CONVERGENCE OF MGNREGA FUNDS IN MP ........................... 136

xi
TABLE 89 VISIT OF TECHNICAL OFFICERS OF NRAA TO PROJECT SITES ......................................................................... 139
TABLE 90 VISIT OF CEO, NRAA TO THE REGION ..................................................................................................... 139

xii
List of Figures
FIGURE 1 FUND ALLOCATION UNDER BUNDELKHAND PACKAGE .................................................................................... 31
FIGURE 2 SECTORAL SHARE UNDER ACA COMPONENT OF BUNDELKHAND PACKAGE ........................................................ 31
FIGURE 3 OVERALL CHANGE IN PRODUCTIVITY OF KHARIF CROP AMONG DUG WELL BENEFICIARIES IN UP ............................ 77
FIGURE 4 OVERALL CHANGE IN PRODUCTIVITY OF WHEAT AND GRAM CROPS AMONG DUG WELL BENEFICIARIES IN UP ........... 78
FIGURE 5 OVERALL CHANGE IN PRODUCTIVITY OF MUSTARD, PEAS, ONION AND TOMATO AMONG DUG WELL BENEFICIARIES IN
UP .......................................................................................................................................................... 79
FIGURE 6 IMPACT OF DEEPENING OF DUG WELLS ON WATER COLUMN IN UP .................................................................. 80
FIGURE 7 IMPACT OF DEEPENING OF DUG WELL ON CHANGE IN IRRIGATED ACREAGE IN UP................................................ 81
FIGURE 8 CHANGE IN FARM INCOME DUE TO ENHANCED WATER AVAILABILTIY AMONG DUG WELL BENEFICIARIES ................... 81
FIGURE 9 OVERALL CHANGE IN PRODUCTIVITY OF KHARIF AND RABI CROPS DUE TO DUG WELLS AND PUMP SET IN MP ........... 87
FIGURE 10 CONVERGENCE OF FUNDS FROM DIFFERENT SOURCES UNDER FOREST AND ENVIRONMENT ACTIVITIES UNDER THE
BUNDELKHAND PACKAGE .......................................................................................................................... 118
FIGURE 11 NORMAL ANNUAL RAINFALL (MM) IN BUNDELKHAND DISTRICTS ................................................................. 129
FIGURE 12 SHORTFALL IN RAINFALL IN BUNDELKHAND REGION ................................................................................. 130
FIGURE 13: SHARE OF IRRIGATION AND WATERSHED PROGRAMMES IN BUNDELKHAND PACKAGE ...................................... 132
FIGURE 14 SHARE OF ACA AND NON ACA FUND IN BUNDELKHAND PACKAGE ............................................................. 135
FIGURE 15 MEETINGS HELD WITH SENIOR OFFICIALS OF STATE GOVERNMENTS AT STATE LEVEL. ....................................... 141
FIGURE 16 ADVISORY MEETINGS HELD AT NEW DELHI ............................................................................................. 141

xiii
List of Abbreviation
ACA Additional Central Assistance
AH Animal Husbandry
AI Artificial Insemination
APL Above Poverty Line
BAIF Bhartiya Agro Industries Foundation
BMC Bulk Milk Coolers
BPL Below Poverty Line
BRGF Backward Rural Grant Fund
CAD Command Area Development
CCA Culturable Command Area
CEO Chief Executive Officer
CS Central Sector Scheme
CSS Centrally Sponsored Schemes
CUMEC Cubic meter per second
CUSEC Cubic foot per second
DCS Dairy Cooperative Society
FCI Food Corporation of India
FGD Focused Group Discussion
GAP Good Agriculture Practice
HDPE High Density Poly Ethylene
IWMP Integrated Watershed Management Programme
LBC Left Bank Canal
LPCD Liter Per Capita Per Day
MARKFED Marketing Federation Limited
MGNREGA Mahatma Gandhi National Rural Employment Guarantee Act
MI Minor Irrigation
MIS Management Information System
MP Madhya Pradesh
MT Metric Tonnes
MY Market Yards
NGO Non Governmental Organizations
NRAA National Rainfed Area Authority
PACS Primary Agriculture Cooperative Societies
PCDF Pradeshik Cooperative Dairy Federation
RBC Right Bank Canal
RIN Rural Infrastructure Nuclei
RKVY Rashtriya Krishi Vigyan Yojana
RRR Restoration Rehabilitation and Remodelling
SC Scheduled Castes
SD Stop Dam
ST Scheduled Tribes
SWC State Warehousing Corporation
UP Uttar Pradesh
WUA Water User Association

xiv
EXECUTIVE SUMMARY
Backgrounder to the study
Bundelkhand Package aimed at mitigation of progressively increasing drought by inclusive
integrated development with investment portfolio of Rs. 7,466 crore, consisting of 49% (Rs.
3650 crore) Additional Central Assistance and 51% Central Sector and Centrally Sponsored
Scheme. The package commenced from 2009-10. Mid-term impact was evaluated by
NABCONS by well designed methodology and sampling technique with rationale of assessing
the acceptance of such a large program in targeted geographies and the relevance of
medium and long term drought mitigation strategies. The Quick Impact Evaluation Study
covered all the activities/ intervention in all the seven sectors: Water Resource, Watershed
Management, Environment and Forest, Agriculture, Dairy, Animal Husbandry and Rural
Drinking Water Supply. The sample projects for the study were drawn from all the sectors /
activities across all the 13 districts of Bundelkhand region. In all, a total of 256 site
inspections/ FGDs and 1965 household surveys were conducted. This report presents the
findings of the quick impact evaluation study.
The executive summary highlights the findings and views on essential aspects of the package
viz.
Conception of the package especially for drought mitigation strategies
Implementation of the package by the constituent states
Release of funds and convergence related issues
Monitoring the implementation of the package / projects
Impact assessment
Recommendations for future guidance in planning, implementation and monitoring
Conception of the package especially drought mitigation strategies
Bundelkhand region falls under rainfed farming areas with more than 750 mm of annual
normal rainfall and the soil moisture situation is better. The irrigated area averaged 45–
46% of the net sown area. However continuous shortfall in rainfall for 4 years prior to
formulation of the package made the region drought affected. The shortfall increased from
2004-05 to 2007-08. The recurring drought situation sparked the need for implementation
of a drought mitigation package in Bundelkhand region.
The total allocation under Bundelkhand package aggregated Rs 7266 crore (Rs 3860 crore in
Madhya Pradesh and Rs 3606 crore in UP). Within the package, the ACA allocation was to
the extent of Rs 3649 crore: Rs 1953 crore in MP and Rs 1696 crore in UP. The total fund
requirement was arrived at on the basis of projects suggested by the two state governments
thus signalling need based assessment.
Increasing the irrigated area through major, medium and minor irrigation projects and
increasing the soil moisture regime through watershed development constituted a major
portion of the package allocation and ACA allocation. About two thirds of the total
Bundelkhand package and 50 to 61% of the ACA allocation were earmarked for irrigation
and watershed development programmes. The IWMP funds were converged with ACA funds

xv
for integrated watershed management of arable lands. Thus the package has fully focussed
on the drought mitigation activities.
Overall the package when fully implemented would result in increasing the irrigated acreage
in the region by 4.23 lakh ha; 2.15 lakh ha in MP and 2.08 lakh ha in UP. This works out to
about 26% of the irrigated area in MP prior to the project and 25% in UP. Thus the additions
would be substantial. The irrigation coverage of the net sown area would increase from 45-
46% to 56% in either states and in the region.
The watershed management activities in arable lands would enhance the moisture regime
by about 4 lakh ha in MP and 7 lakh ha in UP constituting 22% and 38% of the net sown area
in the respective states. Besides, the treatment of forest lands would also enhance the soil
moisture regime in forest lands leading to increased vegetation. Thus overall, it can be
concluded that the package comprehensively addressed the issue of drought mitigation. On
completion of all the projects and the assets well maintained, the package would transform
the livelihood of the people in the region
While drought proofing was the focus of the package, other complementary activities like
postharvest management (market yards and storage godowns), livelihood improvement
through livestock related activities (establishment of milk societies and Livestock
Development Centres, income generation through goats and murrah buffaloes etc.,
mitigating the drinking water stress through drinking water supply project etc., were also
given due importance. Thus the package was well conceived for the desired objective in the
first phase.
Implementation of the package
The states right earnestly started implementing the projects sanctioned under the
Bundelkhand package from 2010-11 onwards once the first instalment of 50% ACA was
released by end March 2010. The projects were implemented by the respective line
departments in the states. No additional staffs were placed in the respective departments for
implementing the package but the existing staffs were geared up to complete the projects in
a time bound manner. Divisional Commissioners were made in charge of the package
implementation and a constant review of the implementation of the programme was made.
In the entire package envisaged implementation of a large number of projects under
different sectors and activities. The sectoral discussions on the implementation of the ACA
funded projects are presented below:
Surface Irrigation Projects
Development of water resources is the major activity. The surface water resources were to
be developed by the various implementing department, especially the irrigation department
and ground water resources are to be judiciously exploited by individual farmers. While
overall, 24 to 25% of the ACA allocation has been earmarked for development of water
resources in either state, the composition varied widely. In Madhya Pradesh, surface
irrigation development to be carried out by state government departments had a share of
about 90% in the ACA allocation for this sector and in UP individually implemented projects
and departmentally implemented projects have more or less an equal share.

xvi
The allocation to surface irrigation projects in MP was Rs 881 crore (45% 0f ACA allocation)
against which Rs 869 crore has been released and Rs 796 crore expended. The allocation to
surface irrigation projects in UP was Rs 410 crore against which Rs 400 crore has been
released and Rs 367 crore expended. In Madhya Pradesh, the surface irrigation projects
comprised of Rajghat command area development projects, Beriyarpur and Singhpur
irrigation projects, completion of incomplete minor irrigation projects, new minor irrigation
projects and RRR of water bodies. In UP, Rajghat command area development projects, RRR
of water bodies, Betwa Gursarai canal system and few miscellaneous projects are
implemented. As high as 90% of the total allocation in MP was towards creating additional
irrigated area while in UP, a larger share was allotted to restoring water bodies (71%)
indicating restoration of lost irrigation capacity. This highlights the need for proper
maintenance of the created irrigation potential through adequate budgetary support.
In general, the proportion of incomplete projects is more in UP as compared to MP. These
incomplete projects are in various stages of implementation and they are likely to be
completed soon. Based on field survey, the major reason for delays in completion of the
projects was due to land acquisition in MP. In UP as most of the projects are renovation /
modernisation / lining of existing canals / water bodies projects no land acquisition
problems were encountered. Despite no hurdles in land acquisition, delays were seen in
completion of the projects due to reasons delays or no release of funds from CS or CSS
shemes, and less period for renovation and lining works.
Most of the projects have been completed / likely to be completed within the sanctioned
cost some with considerably reduced costs, while only in respect of three projects there was
cost overrun. As long as the total expenditure under all the projects under the package is
within the sanctioned cost, the cost overrun may not hinder completion of all projects within
the sanctioned package amount.
Dug Wells (New / Deepening / Recharge) and Distribution of HDPE pipes in UP
A total of Rs 400 crore constituting 24% of the ACA allocations were earmarked for the
above activities. The amount released was Rs 236 crore (59%), against which Rs 168 crore
has been expended. The low level of financial achievement was due to several
implementation problems faced at the field level. The total targeted new dug well/blast
wells under the package for the phase-I was 8,834 against which 4,094 are reportedly
completed, which is 46% of the total target dug wells. The convergence with MGNREGA
Scheme has resulted in considerable delays in completion of work and many dug wells are
still incomplete. Cases of collapse were also reported because the wells were not completed
in time as the fund from MGNREGA was not released in time.
Under Renovation/Deepening of Dug Wells and Blast wells, the progress is not at all
satisfactory as only 13% of the targeted deepening have taken place. In Jalaun, Hamirpur
and Banda districts, activity of deepening was dropped due its impracticability. Similarly
under dug well recharge programme, the achievements were only 21% of the targets and
whatever has been completed, the utility of these recharge pits is in question as the
infiltration rate is almost negligible. The HDPE pipe distribution programme was more than
achieved, however quite a good numbers of farmers covered under the activity are well off.

xvii
Energisation of Dug Wells in Madhya Pradesh
An allocation of Rs 80 crore constituting 4% of the ACA allocations to MP was made under
the package for energisation of dug wells (constructed under MNREGA). Against this, Rs 76
crore has been has been released and Rs 60 crore has been expended. Against the total of
40000 targeted wells, 36826 wells have reportedly been constructed and energised. It is
remarkable that a programme in which MNREGA was converged, had taken off very well in
the state due to the excellent coordination between the district administration and the
implementing department.
Stop Dams in Madhya Pradesh
Stop dams are constructed under the Bundelkhand package in the state of Madhya Pradesh
to enhance the irrigation facilities and water table. The allocation to this activity in MP was
Rs 132.48 crore constituting 6.63% of the ACA allocation to the state. As against the above
allocations, the releases so far and the expenditure incurred were Rs 90 crore and 76.99
crore respectively. Out of a total of 352 projects to be implemented only 218 projects have
been completed. Eight projects are yet to be started. Inaccessibility of sites and technical
difficulties in locating appropriate site for the stop dams are reported to be the reasons for
slow progress.
Forests and Environment
Funding under environment and forest showcased a convergence of ACA, CS and MGNREGA.
The total allocation was Rs 314 crore, of which MP had a share of Rs 242 crore and UP Rs 72
crore. ACA funds and MNREGA funds are the two major sources for the environment and
forestry component of the package. While ACA funds have been released in full, the releases
under MNREGA was not commensurate especially in MP where only 6.63% of MNREGA
funds have been released. Forest department in Bundelkhand region have undertaken many
activities; Contour Bunding, Earthen Check Dam, Deepening of ponds etc. to restore the lost
moisture of the land and improve the ground water level. Madhya Pradesh has reported that
the Forest department was able to achieve their targets in the stipulated period of time.
However, in terms of treatment of forest area for soil and moisture preservation, despite
95% completion of the envisaged structures, only 92554.83 hectare of land as against the
targeted 2 lakh hectares could be treated.
In case of Uttar Pradesh, it has been reported that 100% of the work has been completed by
the forest department and the targeted 60000 ha have been treated. The ACA releases
exceeded the allocations and this helped in completing the targeted acreage in UP.
Animal Husbandry Sector
Animal Husbandry sector accounted for about 2% of the total ACA budget allocated to
Bundelkhand region. The package supported the distribution of goats and Murrah buffalo to
individual farmers, establishment of Artificial Insemination Centres in Collaboration with
NGO (BAIF), establishment of fodder banks etc.
In MP, 72% of the targeted Murrah buffaloes were distributed while the 99% have been
distributed in Uttar Pradesh. The sample survey revealed that the services provided by these
animals were found to be satisfactory in both the states.
xviii
Similarly, 96% of the targeted goats have been distributed in Uttar Pradesh, while 65% have
been distributed in Madhya Pradesh. There is a requirement of contribution by the
beneficiaries to the extent of 20-25% of the cost of the animals as margin money in MP. Thus
beneficiary selection has been rigorous in MP which may be one of the reasons for
underachievement of targets. At the same time, this contribution ensured that the animals
are properly maintained in MP. In its absence the beneficiaries in UP have not maintained
the animals properly. Besides high mortality of goats was reported in UP due to sudden
outbreak of diseases , poor quality of animal supplied, insufficient quarantine practices, non-
suitability of Barbari breed in the climatic conditions etc., may be another reason for high
mortality.
All the targeted three fodder banks in MP have been completed and operations have also
started. In UP the operations are yet to commence. The fodder stored in fodder banks in MP
are currently used in cattle breeding farms. The impact is yet to be felt among the dairy
community and farmers.
All the Livestock Development Centres (LDCs) which are to be operated by BAIF have been
set up covering all the districts falling under Bundelkhand region. A total of 230 centres have
been set up in 13 districts of Bundelkhand region from the package.
Dairy Sector
Dairy sector accounted for about 1% of the total ACA budget allocated to Bundelkhand
region. In Madhya Pradesh, the major activities undertaken in package are Organization/
revival of 500 Dairy Cooperative Societies, establishment of 09 Bulk Milk Coolers,
strengthening of milk processing plant at Sagar, procurement of milk and marketing. In
Uttar Pradesh, the activities under taken were organization/ revival of 560 Dairy
Cooperative Societies and their registration, technical investments in improved husbandry
practices, subsiding transportation cost of milk , milk processing plant at Jhansi,
strengthening and upgradation of infrastructure at Chitrakoot and Jalaun district was also
undertaken in the package. The progress reported by both the states is almost 100% against
the targets.
The dairy sector in Madhya Pradesh has shown an impressive progress since the inception
of the package. The funds have been fully utilized and infrastructures have been fully
created and functional. All the established societies are functional. The milk procurement
targets have been fully achieved and the functioning of the societies is impressive. The
prices realised by the farmers are competitive.
In Uttar Pradesh however underutilisation of milk processing capacities, non-functional
cooperative societies, idling of assets created, nonaccrual of any additional benefits to the
milk producers due to the interventions etc., are observed.
Agricultural Market Yard and Godowns projects
Agriculture sector mainly covering market yards and godowns projects accounted for about
35 % of the total ACA budget allocated to Bundelkhand region. Out of total allocation of
Rs.1268 crore, the allocation made to Madhya Pradesh and Uttar Pradesh was Rs. 574.50
crore and Rs. 694 crore respectively. Of the total allocations for this sector, an estimated
40% was towards creation of additional storage capacity and the balance was towards

xix
erection of auction platforms, construction of internal roads within the mandi area, farmers’
facilitation centres, traders facilitation centres and other supporting infrastructure.
As against the allocation, 100% releases were made and 72% expenses are reportedly made
by the Implementing Departments in MP. In UP, against the allocation of Rs 694 crore, only
Rs. 320 crore was released and the utilisation was 100% of the releases.
In Madhya Pradesh, the state implemented 27 schemes relate to 27 PACS each creating 3000
MT of storage capacity and 67 schemes relate to creation of 110 market yards and godowns.
The three major agencies involved in marketing and storage of agricultural inputs and
outputs in MP viz., the MP State Warehousing and Logistics Corporation Ltd., MP State
Mandi Board and MARKFED implemented these projects in MP. . In all, the projects are
expected to create an additional storage capacity of 6.40 lakh MT besides auction platforms,
construction if internal roads within the mandi area, farmers’ facilitation centre traders’
facilitation centres and other supporting infrastructure.
In Madhya Pradesh, 71% of the projects implemented under the head “Construction of
warehouse & marketing infrastructure facility” were found to be completed whereas 62% of
the projects implemented under the head “Development of mini markets run by PACs” were
found to be completed. Few of the projects have already started functioning. Storage
godown created under the package was used by MARKFED and FCI to store the wheat that
had been procured during the month of May 2014. The physical progress was quite
satisfactory
In Uttar Pradesh, the plan envisaged construction of 7 Specialised mandi yards at the seven
district headquarters of the 7 districts of Bundelkhand region in UP and 168 numbers of
Rural Infrastructure Nuclei at sub district level. Each RIN will have 500 MT capacities of
storage godowns along with auction platform, 5 shops, farmers facilitation centres etc. The
Specialised Market yards will have 20000 MT of godowns capacity each apart from auction
platforms, shops etc., on a larger scale.
Delays in administrative approvals and site location for the special mandi yards, in the first
place, resulted in delayed commencement of work and as on date of visit work in respect of
one yard was yet to commence while in respect of others only 20 to 38% of the work has
been completed. Similarly in case of RIN programme, only 14.4% of 138 sanctioned projects
were completed in case of RIN commencement of works for these yards; even the completed
projects are non-functional reportedly due to difficult site location, lack of understanding
among the stakeholders as to the utility of these RINs. A considerable delay in the
construction work was observed in all the districts of Uttar Pradesh. Deadlines were missed
by most of the contractors to whom the work was assigned through an open tender process.
Overall, the special mandi yards / RIN programme in UP has not been implemented
satisfactorily.
Rural Drinking Water projects
A total of Rs. 195.0724 crore (5.34% of ACA allocation) has been sanctioned under ACA for
the Bundelkhand region. In MP about 96.4% of the sanctioned funds (Rs 103 crore) have
been released of which 92.8% of the funds were utilized to create the stated infrastructure.
In UP however, only 69.7% of the total allocation has been received of which 89.3% of the
funds were utilized to create the stated infrastructure.

xx
Piped drinking water scheme and Installation of hand pumps were two activities
undertaken under the package to provide clean drinking water to people living in
Bundelkhand. Madhya Pradesh showcased a number of pipelined projects while in UP, hand
pumps were the major intervention followed by pipelined drinking water. It was observed
that 70% of the sanctioned projects in the first phase of the package were completed in
Madhya Pradesh. In UP while the piped drinking water schemes which were fewer in
number registered a slow progress, the state could achieve 100 % of the targets in
installation of hand pumps.
Funds Flow and Convergence
The ACA allocation under Bundelkhand package aggregated to Rs 1953 crore in Madhya
Pradesh and Rs 1696 crore in UP. Against this the releases till 31 March 2013, the end date
for Phase I amounted to Rs 1880 crore to the state of MP and Rs 1212 crore to UP. Thus
there was a large gap in release of ACA allocated funds to the state of UP as the end of Phase
I. The shortfall was in Agriculture Sector (Rs 473 crore) under which the state is to create
infrastructure for market yards and RIN. Generally the ACA component has been designed to
be released in two stages, the first stage being the advance which are normally 50% of the
allocation and the balance as and when the advance amount gets exhausted and UC
submitted. By and large the states expressed satisfaction in the release of ACA funds and if
the works are not progressing as per schedule it was on account of factors other than release
of funds. The released amounts have been utilized to an extent of 82% and 83% respectively
in MP and UP. The sector wise / date wise release of funds to MP is summarized and placed
in Exhibit 1 and that for UP in Exhibit 2 (Page- 137 &138) .
The Bundelkhand package envisaged convergence of funds from different sources for
enhancing resources availability and ensuring complementarities of activities. Of the total
package amount of Rs 7466 crore, about 3649 crore amounting to 48% was the ACA
exclusively provided for the Bundelkhand region and the balance was to be sourced from
other CS / CSS schemes, MGNREGA and BRGF / RKVY in that order. State government
contribution to the package as per CS/CSS norms was a minor component. Beneficiary’s
contribution was envisaged in individual beneficiary oriented projects like dug wells, pump
sets, etc. On the whole a more than 50% of the resources for implementation of the package
have to be sourced from outside the ACA. The biggest advantage of ACA funding was that it
accelerated the pace of implementation of identified long pending projects due to smooth
flow of funds and targeted programme period deadline.
Under ACA as also the CS, the flow of funds is smooth in the sense that 25 - 50% of the funds
are placed in advance with the states and further flow is ensured once the benchmarks set
for utilisation is achieved. The ACA funds and the funds under CS /CSS schemes and RKVY /
BRGF are routed through the consolidated funds of the respective states. As in the case of
ACA funds no problems were expressed by the states in availing the CS / CSS funds.
However the MGNREGA funds are with the district administration and the funds flow is
contingent upon completion of certain designated tasks by the rural people. By its very
nature the activities under MGNREGA are taken up by rural households in their respective
villages while the activities supported by ACA / CS / CSS schemes are undertaken by the line
departments under the package. The outcome and implementation of the package is very
much dependent on the flow of funds from MGNREGA sources.

xxi
In Uttar Pradesh, MNREGA funds were to be used in activities like earth works under lining
of canal projects, renovation of dug wells and tanks, watershed management activities in
forest areas. The slow release of funds from MNREGA to some extent has affected the
progress of the activities. In MP the involvement of MNREGA funds in Forests and
Environment sector has affected the progress. At the same time in MP the involvement of
MNREGA resources do not appear to have affected the progress of implementation of the
energisation of Kapildhara programme under which wells are constructed. A better
coordination between various departments would have helped achieve the satisfactory
position in respect of this activity.
Overall while convergence is good as it enhances the availability of funds from different
sources in a focussed manner to targeted sectors /activities, involving MGNREGA funds in
projects with specific time frame may hamper implementation in a smooth manner. Further
MNREGA works are typically non skilled, while majority of the activities contemplated
involve skilled labour. Therefore, it is suggested that MNREGA funds need not be dovetailed
with other programmes of GoI. Where such convergence becomes essential, the state should
ensure better coordination between the implementing departments.
Monitoring the implementation of the package
The monitoring of the implementation of the package at Government of India level is done as
under:
Regular visit of technical officers of NRAA
Visit by CEO of NRAA to the states for technical monitoring
Review meeting with Planning Secretary and Senior Officials of the State Government
by NRAA CEO
Meetings of Advisory Body for the Package at Planning Commission
At the state level, the state governments are required to monitor the projects as per their
internal guidelines and NRAA has not prescribed any structured monitoring of the projects
being implemented by the state departments.
In the guidelines relating to the implementation of the package, no structured monitoring
studies / visits had been suggested to the state governments; nor has structured review of
the progress of the package been envisaged both at the state level and NRAA level. While
discussions with the state authorities revealed that they have frequent meetings /
interactions with the implementing departments, it is felt that this has not been effective
especially in UP as could be seen from the delays in project execution; besides proper post
project follow up was lacking especially in diary projects in Uttar Pradesh.
The visits of technical officers are by and large linked to status of implementation. As the
progress overall was at a better pace in Madhya Pradesh, more number of visits have been
undertaken in that state between 2010-11 and 2012-13. There were regular visits by the
CEO of NRAA to the project districts.
Between January 2010 and February 2014, a total of 5 Review Meetings with Principal
Secretaries and Senior Government officials of the Implementing departments were held in
MP while in UP, a total 6 meetings have been held. Meetings with Planning Secretary and

xxii
senior officials of the State governments were being held on adhoc basis. No structured
quarterly meetings were envisaged.
The Advisory Committee at Delhi is the overall authority for deciding the package
parameters and effecting changes in any of the parameters during the course of
implementation of the package. During the period 2009-10, the Advisory Body had met
three times i.e., in September 2010, June 2011 and December 2011. There have been no
advisory meetings thereafter.
Overall assessment in terms of impact
The Bundelkhand package was right earnestly implemented by the two states from 2010-11
only and hence many of the projects taken up under the package excepting activities that
supported individuals like animal husbandry, dairy, dug wells, energisation of wells etc.,
were on-going as at the time of field visits. Therefore the full benefits of the projects are yet
to stabilize and reach the intended beneficiaries. The broad trends in benefits assessed
through field visits and sample surveys revealed the following:
The surface irrigation projects are envisaged to create additional irrigation capacity of
155297 ha in MP and 96500 ha of additional area and 38700 ha of restoration of lost
irrigated area totalling to 135200 ha in UP. During sample survey it was observed that most
of the completed projects have achieved the targeted potential barring one of the sample
projects in MP viz., Sakaria tank (a failed project). It is possible that once all the projects are
completed in full measure, the anticipated targets will be more or less fully achieved.
The surface irrigation projects enabled the farmers to bring additional area under irrigation
and shift and expand the cropping pattern to remunerative wheat crop. In MP, additional
irrigated area accrued during rabi season. This was devoted to wheat and the area under
wheat in the sample farms increased from 2.14 acres in 2009-10 to 3.38 acres (57%) in
2012-13. In UP also the additional area was brought under wheat due to availability of
irrigation facilities. The area under wheat in the sample farms increased from 1.95 acres in
2009-10 to 2.32 acres in 2012-13 (19% increase). Overall it can be concluded that the
additional irrigated potential created by the surface irrigation projects has been fully
devoted to cultivation of wheat crop in Bundelkhand region. As for productivity, the yield of
wheat in the sample farms in MP increased from 886 kg per acre in 2009-10 to 1129 kg per
acre in 2012-13, a 27% increase due to assured irrigation and adoption of HYV /improved
varieties of seeds with appropriate package of practices. Similarly the yield of wheat
increased from 581 kg per acre to 789 kg per acre between 2009-10 and 2012-13 i.e., by
36%. At a macro level the total production of wheat would have increased by 91300 MT in
MP and 69740 MT in UP aggregating all to 161000 MT in the region because of the package.
The dug wells supported under the package in UP to individual farmers significantly
improved the status of irrigated agriculture. The percentage increase in irrigated area for
the sample farmers is estimated at 63%. In Rabi season, there has been a significant shift to
wheat and Vegetables from gram, lentil, etc. Deepening of wells, though not picked up to the
desired extent, had helped in better water availability to the farmers. It was observed that
the average water column during kharif and rabi seasons increased by about 4.0 meters
resulting in increase in irrigated area by 1.85 acres per farm. Recharge of dug wells through

xxiii
recharge pits was a total failure and no benefits accrued to the intended beneficiaries. The
HDPE pipes distributed to farmers have proven useful in reduction of conveyance loss and
wastage of water. On average, there is reduction of 4 hours for irrigating an acre of land
from 10.85 hours to 6.98 hours, which is equivalent of saving at least 4 litres of diesel
amounting to Rs.200 per acre/ per irrigation.
Energisation of dug wells constructed under Kapildhara programme in MP enabled the
farmers to increase the area under wheat production by as much as 87% due to availability
of assured irrigation. The productivity of all the crops have increased largely due to the
presence of assured irrigation which during stress period in kharif can be utilized to give
protective irrigation when needed.
Construction of stop dams in MP led to an increase in the storage capacity to the extent of
216% of the pre project storage capacity. The incremental irrigated area accrued at a
marginal cost of Rs.78,572 per ha. Focused Group Discussions with farmers revealed that
they could cultivate vegetable crops in kharif in addition to soya bean, while in Rabi they
introduced HYV of wheat in place of local variety. A significant increase in water level has
been reported by the farmers of the sampled projects. Once all the 352 stop dams projects
are completed, an additional irrigated area of about 16000 ha would be created in rabi
season which would invariably devoted to wheat. The additional production of wheat in MP
due to stop dams would be 45000 MT.
Projects implemented under the Forest and Environment head had a mono objective of
checking the soil erosion by restoring the soil moisture. In both the states, the land near the
project area showcased an excellent progress. However, not much change could be observed
on those areas which were a bit far from the project site. Impact quantification was not
possible as the activities have been implemented in forest areas and there are no direct
beneficiary farmers for this activity.
Storage and market yards projects enabled food grain procurement and distribution
agencies to store the procured food grains in a scientific manner as compared to open yard
storage. In MP, all the projects are more or less complete and the projects have created / are
expected to create an additional storage capacity of 6.40 lakh MT besides auction platforms,
construction of internal roads within the mandi area, farmer’s facilitation centres, trader’s
facilitation centres and other supporting infrastructure. Newly constructed trading platform
at HAAT bazaar in MP has devolved considerable satisfaction to the locals. Infrastructure
created under PACS would help the farmer to receive assistance under a single window.
In UP only a few of the projects have been completed and none of them are functioning. A
considerable delay in the construction work was observed in all the districts of Uttar
Pradesh largely on account of the problems in acquiring land. A total of 104000 MT of
storage is likely to be created in Uttar Pradesh after completing of work under RIN & Special
Market Yards. RIN again is an excellent initiative for a single window availability of requisite
inputs for the farmers. It is definitely going to boost good agriculture practices (GAP) among
the local farmers.
Activities under Animal Husbandry sector included animal distribution, establishment of
Livestock Development Centres, fodder banks etc. By far the most successful activity in both

xxiv
the states across all sectors and both the states are setting up of LDCs by BAIF. All the 230
LDCs which are to be operated by BAIF have been set up within a period of three months
covering all the districts falling under Bundelkhand region. Since the inception of the activity
from January 2013, BAIF LDC centres have performed more than 23 thousand and 35
thousand AI in MP and UP respectively. The additions to the improved breed of calves
amounted to 1288 and 1537 in MP and UP respectively in slightly over one year period. The
annual additions to cross bred cattle and improved buffaloes would be about 3000 per
annum over the next 5 years. In few years to come this would result in a substantial increase
in cross bred cows population in the Bundelkhand region.
Distribution of goats to poor and landless under the package has resulted in additional
income generation to the extent of Rs 16323 per beneficiary in MP and Rs 9425 in UP. The
income realisation to the beneficiaries was higher in MP as they have been maintaining the
animals properly guided by the department officials. Benefit accrual to beneficiaries in UP
was lower due to mortality, non- suitability of the breed, sale of animals etc.
Positive benefits accrued to the beneficiaries of the bull distribution programme through
natural servicing though the amounts accrued were lower than the annual maintenance
charges. They may not be able to increase the service rates as the AI facility is available at
cheaper rates. A rethink on extending such support for natural servicing in the context of
easy availability of AI services at cheaper costs may be required.
The fodder stored in fodder banks in MP are currently used in cattle breeding farm. The
impact is yet to be felt among the dairy community and farmers. The units in UP are still
under establishment. Benefits may accrue to the community in due course.
The dairy sector as already stated has shown an impressive progress since the inception of
the package in Madhya Pradesh through establishment of dairy cooperative societies and
milk chilling centres. A total of 18460 families have benefited by becoming members of the
societies. It has been estimated that each member family of the cooperative has been able to
generate additional Rs. 8184.00 per annum from the dairy activity which is quite significant
addition to its overall income. Fair prices were ensured to the dairy farmers besides supply
of quality inputs, AI facilities etc. The investments in the sector in UP has not achieved the
desired results and most of the societies established are not functioning at present or at the
desired level. Therefore limited benefit has accrued to the dairy farmers in the state.
The rural drinking water supply projects have helped the beneficiaries to reduce the
travel time by an average of 55% and also improved the supply of drinking water from an
average of 31 LPCD to 55 LPCD. In Tikamgarh, easy availability of clean water has helped
the villagers in improving sanitation facilities have home. This in turn has improved the
hygiene & living standards of the villagers. Overall the allocation of Rs 195.07 crore under
the package would benefit about 5 lakh persons in the region at an average per capita cost of
Rs 3500.
Overall it can be concluded that the trends in benefit realisation are more or less in tune
with the expectations excepting the goatry units and dairy sector activities in UP.

xxv
Suggestions and recommendations
Planning of the package
At the time of formulation/ conception of the package, several factors were considered for
ensuring a holistic approach to drought mitigation and enhancing the financial resources
available for the package. The consultants, after a review of the implementation of the
package at the field level and with Bundelkhand II package on the anvil, feel that the
following few critical areas need to be addressed at the planning stage itself for enhancing
the overall impact of the package.
Revisiting projects involving support for individuals
Under the package two types of projects were envisaged and implemented with reference to
the project entity:
1. Departmentally implemented projects which benefit a large number of farmers in a
geographical area
2. Individual beneficiary projects like dug wells, lifting devices, supply of HDPE pipes,
income generating activities like bull induction, goatery etc.
The latter type of projects were found to suffer from the following
Tentativeness in fixing targets.
Complaint of bias in beneficiary selection.
Slow progress and inability to ensure proper quality control.
Problems in monitoring due to large number of beneficiaries spread over the
districts.
Tendency to develop liking for only fully subsidised projects from the government.
We are of the opinion that individual beneficiary oriented projects may be taken out of
purview of such packages and they may be implemented like any other CSS with funding
from bankers and individuals. A larger share of subsidy can be envisaged considering the
drought in the region. This would ensure proper implementation, endues and monitoring of
the funds. The complaint of bias in beneficiary selection can also be precluded.
Specific activities that may be precluded in the package
The buffalo bull induction programme ensures natural servicing but at the same time will
not be able to compete with AI programmes due to ease of implementation and cheaper
delivery costs of the latter. Since AI programmes are well established and there is a good
response for AI, emphasis may be exclusively placed on AI for breed upgradation and bull
induction at individual farmer level may be discouraged.
Post-harvest infrastructure to be planned with a lag
The Bundelkhand package was aimed to be a drought mitigation package with focus on
irrigation and watershed management activities. While this was ensured by converging
funds from CS / CSS schemes, it is observed that there was an equal emphasis on post-
harvest market infrastructure in terms of market yards and warehouses especially in UP
where post-harvest sector was the largest beneficiary of the ACA funding. While these
infrastructure are required to take care of the enhanced production arising out of drought
mitigation activities, they are not immediately needed as the irrigation / watershed projects

xxvi
will take time to yield full results and the post-harvest infrastructure created in anticipation
of the increased production may be fully utilised only after four to five years; till such time
the maintenance of the structures has to be funded from budgetary sources. Besides, the
attention of the funding agency also gets diluted from the drought mitigation activities.
Therefore it is suggested that post-harvest infrastructure may be funded with a lag perhaps
with a built in second phase in the package.
Convergence a hindrance to implementation?
At the time of formulation of the package, convergence of various activities / sectors was
envisaged so as to pool all the resources available for drought mitigation to achieve this
common objective. Accordingly the package was funded by ACA, CS / CSS funds, RKVY,
MNREGA besides state and owners contribution. As already seen from the chapter on
Convergence, while no difficulty has been faced by the implementing authorities in sourcing
funds from other sources, funds availability from MNREGA has been a source of concern and
projects involving partial funding from MNREGA had invariably experienced delays. This is
pronounced in dug well projects and RRR of water bodies, where part of the work is funded
by ACA and the balance from MNREGA. Besides MNREGA funds can be utilised for unskilled
works while most of the projects required skilled labour for execution. In this context, it is
suggested that
Convergence of funds from MNREGA for the same activity may be avoided
In case it is required for funds augmentation, the complete activity has to be funded
from single source
Besides it was also found that there are activities like watershed development in arable
lands, crop production programme for drought mitigation which form part of the package
but fully funded by CS / CSS schemes without any commitment from ACA. Such activities are
not properly monitored and reported to NRAA with the result that monitoring is mostly
restricted to ACA package. The state governments also focus mostly on ACA funded
activities. Therefore an umbrella body including NRAA and the Various Ministries whose
funds are sought to be involved has to review the progress of the package. Alternatively the
focus of NRAA can be only ACA funds without envisaging any convergence from other
sources.
Provision of budget for post package maintenance
The package as conceived has provisions only for creation of assets; the resources
required for subsequent maintenance of assets have not been provided for nor the
post package maintenance issue been adequately addressed in the package. It
assumes importance especially in the context of a large number of surface irrigation
projects in UP are intended for restoration of lost irrigation potentials. It is
suggested that the state governments should be advised to provide for annual
allocation in the state budgets during the project implementation period so as to
create a corpus for maintenance of the assets in future
Implementation of the package
The major plank of the Bundelkhand package is drought proofing of the region within a time
frame of three years i.e., by 2012-13. However a large number of projects were found to be

xxvii
on going even during period of field visits i.e., February – May 2014; besides a number of
projects were completed with delay. Some of the projects which experienced significant
delay are include the following
All the market yards projects and rural infrastructure nuclei projects in UP are
ongoing and yet to be completed; administrative delays in taking decision as to the
location of the projects , delays in land acquisition are sighted as the major reasons
All the ground water irrigation projects in UP which support the individual farmers
are found to suffer delays in completion due to convergence of MNREGA projects
with ACA funds for completing the activity
Several minor, medium and major surface irrigation projects in UP experienced
delay, contractors not fulfilling commitment, very limited work period available for
water bodies’ renovation due to release of water continually in the canals etc., as
well as issues on releases of MNREGA funds.
The stop dams projects Madhya Pradesh also suffered delays due to insufficient
man power, tendering and technical problems.
In general in both the states poor response to tendering process resulted in
retendering; besides open tendering in initial stages in UP resulted further delays in
processing
To overcome the above difficulties, the state governments may consider instituting
transparent mechanisms for tendering, land acquisition, tough penalties for way ward
contractors etc. Besides the administration should, with people’s involvement, work
towards increasing the working period during the year. As MNREGA funds are to be released
by the district administration, effective coordination between the implementing
departments and administration has to be ensured from the higher level decision making
authorities in the states. Staff augmentation is another area which the states have to address
for effective implementation. The recommendations for better implementation of activities
under different sectors are presented in the respective chapters.
Monitoring of the package
A strong monitoring mechanism can pre-empt many of the implementation deficiencies
especially those relating to administrative and financial issues. In the guidelines relating to
the implementation of the package, no structured monitoring studies / visits had been
suggested to the state governments; nor has structured review of the progress of the
package been envisaged both at the state level and NRAA level. The provisions can be
incorporated in the guidelines for strengthening the monitoring efforts during the
implementation phase of such programmes.
Structured Meetings of Advisory Body
The meetings of the Advisory Body give strong signals to the States for effective
implementation of the package. It is suggested that the Advisory Body meets at least once in
a half year as it would transmit the seriousness of the funding agency to the implementing
states for faster implementation of the projects.

xxviii
Structured Meetings with state level implementing departments
Structured quarterly meetings with Planning Secretary and senior officials of the State
governments may be held to sort out interdepartmental issues relating to administrative
and financial areas.
Reporting system to NRAA
The reports submitted to NRAA on the physical achievements are aggregates of a large
number of projects and it is difficult to ascertain whether the projects are complete or not.
Many a time, while the reports submitted by the states indicate full achievement of the
targeted physical programme under the sector/ group of similar projects, yet field visits
revealed that many individual projects forming part the sector/ group were ongoing as on
the dates of the consultants field visits and were slated for completion even one year hence.
Thus while at the aggregate level, the targets seem to have been achieved, yet in reality there
exists a gap in achievement which is not captured in the present reporting system of the
states to NRAA. A robust MIS is required that would provide project specific progress on a
quarterly basis needs to be introduced. The services of professional MIS experts may be
availed in developing a robust reporting system and a Project Monitoring Unit can be set up
in NRAA by outsourcing the same from professional consultancy organisations
Concurrent / Midterm monitoring mechanism by third parties
By design, the package has not envisaged a mechanism for third party monitoring of the
package / concurrent evaluation. Such processes are necessary components of any
programmes. It is suggested that provision may be made at the time of formulation of the
package for third party monitoring. Professional consultancy organisations can be roped in
for this purpose.

Chapter 1 Introduction
Bundelkhand Region
The Bundelkhand region comprises of 7 districts of Uttar Pradesh and 6 districts of Madhya
Pradesh
Table 1 Districts of Bundelkhand Region of UP and MP
Madhya Pradesh Uttar Pradesh
Chhatarpur Jhansi
Tikamgarh Jalaun
Damoh Hamirpur
Sagar Banda
Datia Chitrakoot
Panna Mahoba
Lalitpur
Geographically, the region falls in India’s heartland (i.e. Central India) , which has a number
of north bound perennial rivers viz. Sindh, Pahuj, Betwa, Dhasan, Ken, Baghein, Paisuni and
Tons along with their numerous tributaries. However, topographically it is a hard rock area
with limited or inadequate ground water resources, lacks infrastructure, access to improved
technologies, markets and inputs with low productivity. It is predominantly an agrarian
economy with over 80% of population being dependent on agriculture; the livestock,
usufructs from forest and outsourcing income by seasonal migration after Rabi sowing are
other alternative sources of income. The
agriculture is vastly rain-dependent, diverse,
complex, under-invested, risky and vulnerable. In
addition, extreme weather conditions, like
droughts, short-term rain and flooding in fields add
to the uncertainties and seasonal migrations.
The 13 districts of Bundelkhand feature in the
Planning Commission of India’s 200 most backward
districts list. Eighty percent people depend on
agriculture and livestock rearing
The scarcity of water in the semi-arid region, with
poor soil and low productivity further aggravates
the problem of food security. With a population of
approximately 21 million in Bundelkhand, 82.32
per cent is rural and more than one third of the
households in these areas are considered to be
Below the Poverty Line (BPL). The poverty situation in the region has become extremely
critical in the recent years. This is because of lack of employment and lack of opportunities.
Picture 1 Map of Bundelkhand region

30
The insecurity of livelihoods and lack of supportive governance have led to forced large-
scale migration of the local population. Further, climatic uncertainties, leading to extended
and frequent spells of drought and drastically reduced agricultural yields, have also
aggravated the problem.
All these districts in the region lag behind the rest of UP and MP in many socio economic
indicators such as; literacy rate, health related indicators and the overall human
development index. Highly feudalistic society has resulted in the exploitation of the limited
natural resources available in the area by a few. Though the region has a natural basin, it is
divided between the two states of MP and UP. Management and conservation of water
resources therefore has become a challenging and sensitive task. The recurring drought
adversely impacted the socio economic conditions in the region affecting standard of living
of the people in the area.
Bundelkhand Package
Against the above backdrop, the Government of India approved a Special Package at a cost of
Rs.7,266 crore Rs 3606 crore for UP and Rs 3860 crore for MP) for implementation of a
drought mitigation strategy over a period of three years commencing from 2009-10 for
integrated development of Bundelkhand region. The prime mover of the package was
optimization of water resources through rainwater harvesting and through proper
utilization of the river systems. Intensive and diversified agriculture was to be promoted for
productivity gains in the crops along with promoting higher sown area in the Kharif season.
Animal husbandry and diary activities were to be expanded as ancillary activities to enhance
farmers’ incomes to cope with the drought conditions. Under the package, provision of Rs.
3450 crore was created as Additional Central Assistance (ACA) and balance cost of the
package was to be met through convergence of Central Sector Schemes (CS) and Centrally
Sponsored Schemes (CSS). Additional Rs 200 crore, Rs 100 crore each for UP and MP has
been approved as ACA for providing drinking water thus making the total package amount
aggregate Rs 7466 crore.
Table 2 Funding sources for Bundelkhand Package
S.No Fund Component Madhya Pradesh
Uttar Pradesh
Bundelkhand
1 Additional Central Assistance (ACA) 1953.20 1695.76 3648.96
2 CS/CSS Schemes 953.65 1318.59 2272.24
3 BRGF / RKVY 225.00 25.00 250.00
4 MGNREGA 595.00 471.00 1066.00
5 State Share 12.04 12.04 24.08
6 Beneficiary Contribution 121.11 83.61 204.72
Total 3860.00 3606.00 7466.00

31
Sectors of Focus
Under the Bundelkhand package, the following six broad thematic areas have been
identified for intervention
i. Water resource sector
ii. Watershed Management
iii. Environment and Forest
iv. Agriculture
v. Animal Husbandry
vi. Rural Drinking water Supply
Sectoral Allocation of ACA Funds in Bundelkhand Region
The allocation under Bundelkhand package aggregated Rs 1953 crore in Madhya Pradesh
and Rs 1696 crore in UP. The component wise share is presented in Figure 2
Figure 2 Sectoral share under ACA component of Bundelkhand Package
Water resources (45%) was the most dominant sector in Madhya Pradesh while agriculture
(41%) essentially market yards was the most dominant in Uttar Pradesh. Animal husbandry,
rural drinking water supply and environment and forest had a share of about 3-6% across
the states. The balance was accounted for watershed management (11% in MP and 24% in
0%
5%
10%
15%
20%
25%
30%
35%
40%
45%
50%
Madhya Pradesh
Uttar Pradesh
Bundelkhand
Figure 1 Fund allocation under Bundelkhand Package

32
UP). Aggregating irrigation and watershed management which directly alleviate the ill
effects of drought , the package on the whole allocated about 48% to 56 % of the amount to
these sectors in UP and MP respectively.
Releases and Expenditure under ACA Allocation
The entire ACA allocation has been released in case of Madhya Pradesh, while in case of UP,
only 75% of ACA funds have been released largely because of slow progress in watershed
management sector and agriculture market sectors. The released amounts have however
utilized to an extent of 82% and 83% in Madhya Pradesh and Uttar Pradesh respectively.
Table 3 ACA allocation, releases and expenditure in Madhya Pradesh
Sector ACA allocation
ACA released
ACA expenditure
Water Resources 881.00 878.16 796.00 Watershed management 210.00 210.00 137.15 Environment and Forest 107.00 107.00 105.87 Agriculture 574.50 574.50 412.65 Animal Husbandry 80.70 72.70 49.86 Rural Drinking water supply 100.00 100.00 92.51 Energisation of Private Tube Wells
0.00 0.00 0.00
Total 1953.20 1942.36 1594.04
Table 4 ACA allocation, releases and expenditure in Uttar Pradesh
Sector ACA allocation
ACA released
ACA expenditure
Water Resources 410.00 400.25 367 Watershed management 400.00 235.66 70.24 Environment and Forest 31.56 61.56 31.56 Agriculture 693.50 320.00 320 Animal Husbandry 60.70 55.30 55.3 Rural Drinking water supply 100.00 70.00 91.63 Energisation of Private Tube Wells
0.00 69.77 69.77
Total 1695.76 1212.54 1005.5
Rationale, Scope and ToR for the Study
The first phase of Bundelkhand package was over by 2012-13 and the second phase is to be
implemented. At this juncture, NRAA has decided to undertake a quick evaluation study of
the implementation of the package with the rationale of assessing the acceptance of such a
large programme in the targeted geographies and the relevance and impact of medium term
and long term drought strategies in mitigating drought in this region. With this objective in
mind, NRAA commissioned NABCONS to undertake a quick impact evaluation study. As per
the Terms of Reference of the study, the broad components to be covered are:
i. Impact of the package in creating additional water storage capacity in situ rain
water conservation as long term drought mitigation strategy.

33
ii. Impact of package in enhancing the net sown area; production and productivity
of crops.
iii. Shift in ratio of kharif: rabi crop sowing in Bundelkhand region.
iv. Relevance/ acceptance of different intervention/ scheme made under the
package as medium long term strategies for drought mitigation.
v. Impact of package in providing livelihoods opportunities especially to the land
less/ asset less and weaker section of the community through intervention in
dairy and animal husbandry.
vi. Level and extent of convergence of various CS/CSS schemes, forest/ agriculture
under activities in different components and their impact on overall progress of
the package.
vii. Overall constraints and opportunities of the package.
The Impact Evaluation Study will cover all the activities/ intervention in all the seven
sectors; Water Resource, Watershed Management, Environment and Forest, Agriculture,
Dairy, Animal Husbandry and Rural Drinking Water Supply. The study will select sample
projects from all the sectors / activities across all the districts of Bundelkhand region.

34
Chapter 2 Approach, Methodology, Sampling and Research Tools
Approach
The activities under Bundelkhand Package were categorized broadly under sectors; Water
Resources, Watershed Management, Agriculture, Environment and Forest, Animal
Husbandry, Dairy and Drinking Water Schemes. Under Water Resource Sector the activities
implemented were Construction/ Repair, Renovation, Restoration, Remodelling of Irrigation
Infrastructures (Reservoirs & Canals), Water Bodies (Tanks and Ponds, Stop Dams), Dug
wells. Under Environment and Forest, the activities implemented were mostly watershed
activities in Common Wasteland and Forest Land. In Agriculture sector the activities
implemented were mostly the warehousing and storage infrastructure differing from size
and mode of implementation. Animal Husbandry sectors involved distribution of goats and
bulls to individual beneficiaries, creation of fodder banks, construction of meeting halls,
mobile vans etc and establishment of AI Centres. While, dairy sectors mostly focused on
organization of Milk Cooperative Societies at the village level and strengthening/
upgradation of chilling centres/ processing units. These activities varied within sectors and
districts in both the states. Considering, the complexity, the following approach was adopted
to cover all the sectors and sample.
1. The documents related to fund allocation, sanctions and releases, and activities
implemented were obtained from the National Rainfed Area Authority.
2. The documents obtained were studied with regards to percentage allocation and
release to each sectors and activities implemented.
3. Two division level meetings were organized in Jhansi and Sagar in presence of the
implementing agencies heads and officials of district administration. The meeting
was objectively organized to obtain clarity on the types of activities undertaken,
their status and spread across districts. Sites visits for sample projects were made to
ascertain the implementation process, activities undertaken, and understanding on
the output and outcome level indicators.
4. The district wise list of activities for each sectors were obtained from Sagar Division
of Madhya Pradesh and Jhansi Division of Uttar Pradesh. The district level
information were obtained for Chitrakoot Division.
5. Once, the information on the sector wise activities and financial details were
obtained, it was enlisted for each district to see their spread across each districts of
Bundelkhand region. The prepared list was later used for selection of sample
projects so as to cover every project and every district.

35
6. The projects were categorized under each sector were then selected based on their
size and financial allocations.
7. Once the sector wise list of activities was made, appropriate research tools were
developed to capture information on important variables.
8. Site Inspection were made for the sample projects categorized under Irrigation
(Major/ Medium/ Minor), Agriculture Projects (Market Yards, Haat Bazars, Rural
Infrastructure Nuclei), Environment and Forest, Dairy, Animal Husbandry and
Drinking Water Schemes followed by Focussed Group Discussions with the project
beneficiaries by the technical staffs.
9. Individual household survey were conducted to estimates the impact of intervention
on the livelihoods of the beneficiaries from the project catchment villages of
irrigation projects, dug wells/pump set/HDPE Pipe schemes, goatry and buffalo bulls
beneficiaries.
10. The data were tabulated for statistical analyses supplemented by the findings of site
inspection and focused group discussion.
Methodology
The study is based on the primary and secondary data. The primary data were obtained
through sample survey across all the 13 districts of Bundelkhand Regions covering
beneficiaries of Major, Medium and Minor Irrigation Projects, Animal Husbandry Projects. In
addition to sample survey Focused Group Discussion were held with the beneficiaries of
drinking water schemes, Secretary of Dairy Cooperative Societies, nodal officers of all line
departments implementing the projects and Chief Development Officers/Collectors/
Commissions of districts/ division and NRAA to consolidated their view on overall package
design, implementation constraints and potential to maximize the benefits from the package.
The secondary information was collected from the National Rainfed Area Authority (NRAA),
line departments of 13 districts and official websites of each district on requirements. The
secondary information mostly encapsulated Financial Allocations, Sanction, Release and
Expenditure, Activities targets and achievement status and monitoring mechanism.
Sample
The samples were selected based on the following criteria for each of the sector.
Irrigation projects were selected based on size and category of projects (major,
medium and minor). The projects were selected randomly on the criteria based on
Highest Financial Allocations.
Agriculture Market Yard Projects were selected based on the category (Market
Yards, RIN, Haat Bazar), their storage capacity and Mode of Implementation
(Convergence of Markfed, MPWCL and Mandi Samiti) and their status of physical
progress (completed and in progress)
20 Milk Cooperative societies (4 each from 5 districts of MP) and 09 from 05
districts of UP were selected randomly. 5 Bulk Milk Coolers/ processing plants from
04 districts of MP and 03 Milk Chilling/ processing plants from 03 districts of UP
which received the allocations under the package were selected.
The beneficiaries of goatry, bull induction, new dug wells, deepening of dug wells,
recharge pits, pump set, and HDPE pipes were selected randomly from the list of

36
beneficiaries provided by the implementing department. 07 districts from UP and 06
districts from MP were covered.
02 AI Centres each from each district of Bundelkhand Region were selected
randomly after obtaining the list from the BAIF.
Under environment and forest, the sites intervened were selected randomly. One or
two sites based from each districts were obtained. Since, a significant number of stop
dams were constructed by the forest department in Madhya Pradesh under the BSP,
this particular activity was chosen purposively, however the site for site inspection
was done randomly from the list.
Two different systems were installed; one the pipe line based system and another
Mark-II hand pumps. Both the systems were selected based on their availability in
the district randomly. A good number of pipe line system has been installed and
completed in MP so the priority has been given to study the pipe line based system,
while a significant number of Hand pumps were installed in UP, so the priority was
given to study the installation of Hand pumps in UP along with a few pipe line based
system. The pipe line based systems were selected based on highest financial
allocation.
The farm households falling under the project catchments villages of Major, Medium
and Minor Irrigation Projects were selected randomly for sample survey. A total of
630 household in 21 Sample Irrigation (Major/ Medium/ Minor) Projects of MP and
870 beneficiaries in 17 sample Irrigation Projects of UP were covered. In Major
/Canal projects, the beneficiaries were selected from Head, Middle and Tail Reach.

37
Sample Distribution
Table 5 below presents the sample distribution across activities undertaken in Bundelkhand
Special Package in MP and UP.
Table 5 Sample distribution of Madhya Pradesh
Sectors/ Activities No Name/ District Covered
Water Resource Sectors Major Medium Irrigation Project
05 Rajghat CAD, Beriyarpur & Singpur Barrage, Urmil and Rangwan (Datia, Chhatarpur)
Ongoing and New Minor Irrigation Projects
21 Sagar, Tikamgarh, Chhatarpur, Damoh & Panna
Stop Dams 30 Sagar, Chhatarpur, Damoh & Tikamgarh Dug Wells with Pumpset 85 Sagar, Chhatarpur, Tikamgarh, Damoh & Panna Agriculture Agriculture Market Yards 14 Sagar, Chhatarpur, Tikamgarh & Panna Dairy Development Milk Cooperative Societies 20 Tikamgarh, Panna, Damoh and Chhatarpur Milk Chilling Centre/ Processing Plant/BMC
05 Sagar, Tikamgarh, Chhatarpur, & Damoh
Animal Husbandry Goatry Units 30 Sagar, Tikamgarh, Chhatarpur , Panna, Damoh
Bull Induction 30 Sagar, Tikamgarh, Chhatarpur, Panna
AI Centres 10 Sagar & Tikamgarh
Fodder Bank 03 Sagar, Tikamgarh & Panna
Environment & Forest
Construction of Stop Dams 25 Sagar, Chhatarpur, Damoh & Panna
Drinking Water Schemes
Cistern based pipe line system 08 Sagar, Damoh, Chhatarpur, Tikamgarh & Panna
Household Survey of Irrigation Schemes
630 Covering all 26 Major, Medium, Minor Irrigation Schemes (Sagar, Chhatarpur, Tikamgarh, Panna, Damoh and Datia)
Thus, in MP across the 06 Bundelkhand Districts, a total of 141 site inspection/ FGDs and
775 household surveys conducted covering all the sectors.
Table 6 below presents the sample distribution of UP.

38
Table 6 Sample distribution of Uttar Pradesh
Sectors/ Activities No Name/ District Covered
Water Resource Sectors Major Medium Irrigation Project
06 Upper Rajghat, Lower Rajghat, JPC, Badwar, Pathrai, Maudaha (Lalitpur, Jhansi, Jalaun)
Ongoing and New Minor Irrigation Projects
11 Jhansi, Jalaun, Hamirpur, Banda & Chitrakoot
New Dug Wells 100 Jhansi, Lalitpur, Chitrakoot and Mahoba Deepening of Dug wells 60 Jhansi, Lalitpur, Chitrakoot and Mahoba Dug Well Recharge 50 Jhansi, Lalitpur, Chitrakoot, Mahoba and Banda Agriculture Agriculture Market Yards 25 Jhansi, Jalaun, Lalitpur, Chitrakoot, Mahoba, Banda
and Hamirpur Dairy Development Milk Cooperative Societies 09 Jhansi, Lalitpur, Banda, Hamirpur & Mahoba Milk Chilling Centre/ Processing Plant/BMC
03 Jhansi, Jalaun, & Chitrakoot
Animal Husbandry Goatry Units 70 Jhansi, Jalaun, Lalitpur, Chitrakoot, Mahoba, Banda
and Hamirpur Bull Induction 30 Jhansi, Jalaun, Lalitpur, Chitrakoot, Mahoba, Banda
and Hamirpur AI Centres 14 Jhansi, Jalaun, Lalitpur, Chitrakoot, Mahoba, Banda
and Hamirpur Fodder Bank 03 Jhansi, Jaluan,, & Lalitpur
Environment & Forest
Sites of Visit 10 Jhansi, Jalaun, Lalitpur, Hamirpur & Mahoba
Drinking Water Schemes
Cistern based pipe line system 02 Mahoba & Hamirpur
Handpumps 32 Chitrakoot, Banda, Mahoba, Hamirpur
Household Survey of Irrigation Schemes
870 Covering all the 17 Major/ Medium/ Minor Irrigation Schemes (Jhansi, Jalaun, Lalitpur, Chirakoot, Banda, Mahoba and Hamirpur)
In UP, across all its 07 Bundelkhand Districts, a total of 115 site inspection, FGDs and 1180
individual household surveys were conducted covering all the sectors.
In total, a total of 256 FGDs and 1955 household surveys were conducted between 24
February 2014 and 30 May 2014.
Research Tools
The structured questionnaires were developed for all the individual activities. For site
inspection and focused group discussion, separate questionnaires were developed for all the
activities which during the course of discussions with departments were documented. This
questionnaire was designed to obtain information on physical and financial progress,
important dates (admin approval, tendering, type of tendering, award of tender,
commencement of work, time of completion- actual/ expected etc), types of infrastructure

39
and status of progress, implementation constraints, institutional mechanism, overall
perception of beneficiaries on impact variables and overall comments of the technical staff.
This questionnaire after administering with department officials was verified in the actual
site and discussions were held with beneficiaries.
A total of 09 different questionnaires were developed which were administered by technical
staffs during site inspection/ FGDs covering major irrigation, medium irrigation, stop dams,
Water User Associations, AI Centres, Fodder Banks, Dairy Cooperative Societies, BMC/
Chilling Plants and Drinking Water Schemes. Eight (08) separate questionnaires were
developed to capture information from individual household who were benefitted under
large irrigation projects, installation of pump sets, new dug wells, deepening of dug wells,
dug well recharge, HDPE pipes, goatry, and bull induction.
One separate check list was also prepared with regards to capture the information on fund
flow from central to state, state to directorate to districts.
Averages, percentages, frequency distribution and other simple statistical tools are used
deriving the results. The questionnaires are attached in Annexure of this report.

40
Chapter 3 Water Resources Sector – Surface Water Irrigation
The Allocations and Financial Achievements
Development of water resources is the major activity under the Bundelkhand package. Both
the surface water resources and ground water resources were to be developed under the
package. The surface water resources are to be developed by various implementing
departments especially the irrigation department while ground water resources are to be
judiciously exploited by individual farmers. The ground water exploitation has been clubbed
under watershed development sector in the package allocation. However for sectoral
discussion, the ground water works have been considered under water resources sector.
The allocations to this activity in MP and UP are presented in Table 7.
Table 7 Allocation to Water Resource Project under Bundelkhand Package
State Allocation to irrigation
projects (Rs. Crore)
Total allocation in the package
(Rs. Crore)
% allocation to the sector
Surface water development
Madhya Pradesh 881 1958 45%
Uttar Pradesh 410 1696 24%
Bundelkhand region 1268 3654 35%
Ground water development
Madhya Pradesh 80 1958 4%
Uttar Pradesh 400 1696 24%
Bundelkhand region 1268 3654 35%
Total water resources
Madhya Pradesh 961 1958 49%
Uttar Pradesh 810 1696 48%
Bundelkhand region 2536 3654 69%
While overall, 24 to 25% of the ACA allocation has been earmarked for development of
water resources in either state, the composition varied widely. In Madhya Pradesh, surface
irrigation development to be carried out by state government departments had a share of
about 90% in the ACA allocation for this sector, in UP individually implemented projects and

41
departmentally implemented projects have more or less an equal share. As against the
above allocations, the releases so far and the expenditure incurred by the respective states
are given in Table 8.
Table 8 Financial achievements under Water Resource Project under Bundelkhand Package
State Allocation (Rs.
Crore)
Amount released
(Rs. Crore)
Amount released as % of
allocation
Amount expended
(Rs. Crore)
Expenditure as % of release
Surface water development
Madhya Pradesh 881 869 99% 796 92%
Uttar Pradesh 410 400 98% 367 92%
Bundelkhand region 1291 1269 98% 1163 92%
Ground water development
Madhya Pradesh 80 80 100% 60 76%
Uttar Pradesh 400 236 59% 168 71%
Bundelkhand region 480 316 66% 229 72%
Total water resources development
Madhya Pradesh 961 949 99% 856 90%
Uttar Pradesh 810 636 79% 535 84%
Bundelkhand region 1771 1585 89% 1392 88%
The expenditure incurred under individual beneficiary oriented ground water development
projects was about three fourths of the releases which was lower than the 92% expenditure
achieved under departmentally implemented surface irrigation projects.
Brief Outline of Surface Irrigation Projects
Since the impact of surface water resources are different from that of the ground water
resources, this chapter deals with surface water irrigation schemes only. - The share of the
different types of projects in the total allocation is given in Table 9.
Table 9 Share of different project under surface irrigation in total ACA allocations
Activity Madhya Pradesh Uttar Pradesh
ACA Allocation
% ACA Allocation
%
Rajghat Command Area Development
50.00 6% 80 22%
Ongoing and new MI projects (MP) / Schemes (UP)
522.00 59% 6 2%
Incomplete Beriyarpur project (MP) / Betwa Gursarai project (UP)
117.00 13% 20 5%
Singpur Barrage Project 100.00 11%
RRR of water bodies 92.00 10% 264 71%
Total 881.00 100% 370.00 100%

42
As high as 90% of the total allocation in MP was towards creating additional irrigated area
while in UP, a larger share was allotted to restoring water bodies (71%) indicating
restoration of lost irrigation capacity. This highlights the need for proper maintenance of the
created irrigation potential through adequate budgetary support.
Over all Physical progress
The status of completion of surface water irrigation projects in the two states is summarized
as under in Table 10.
Table 10 Physical progress under surface irrigation projects in MP & UP
Activity Number of projects
Total Complete Incomplete % of incomplete
Madhya Pradesh
Rajghat Command Area Development
1 1 0 0%
On going MI projects 49 49 0 0%
New MI projects 97 74 23 24%
Incomplete Beriyarpur project (MP) 1 1 0 0%
Singpur Barrage Project 1 0 1 100%
RRR of water bodies 3 3 0 0%
Uttar Pradesh
Rajghat Command Area Development
1 0 1 100%
Betwa Gursarai Canal System 1 0 1 100%
RRR scheme of canals 39 17 22 56%
Repair of Lift irrigation schemes 1 1 0 0%
Changing Pump sets 3 3 0 0%
RRR of water Bodies 28 28 0 0%
Reconstruction of water bodies 10 0 10 100%
In general, the number of incomplete projects is more in UP as compared to MP. These
incomplete projects are in various stages of implementation and they are likely to be
completed soon.
Additional Irrigation Capacity Created
The above projects are envisaged to create additional irrigation capacity of 155297 ha in MP
and 96500 ha of additional area and 38700 ha of restoration of lost irrigated area totalling
to 135200 ha in UP. AS PER THE DATA PROVIDED BY THE RESPECTIVE STATE
GOVERNMENTS, the actual irrigated area achieved as on date of visit was 88% in MP and
61% in UP. The project wise details are given in Table 11.
It can be seen there from that cent percent achievement of targeted area was reported under
Rajghat Command area project, Beriyarpur canal project, canal renovation projects etc.

43
However during sample survey it was observed that several projects were still ongoing;
further one of the sample projects in MP viz., Sakaria tank was found to be a complete
failure. Therefore the achievements of additional area irrigated would be lower than what
has been reported; it is possible that once all these projects are completed in full measure,
the anticipated targets will be more or less fully achieved.
LINING OF LOWER RAJGHAT CANAL UNDERTAKEN IN BSP

44
Table 11 Achievement of targeted irrigated acreage under surface irrigation projects
Madhya Pradesh Uttar Pradesh
Project Category Target Achievement % Project Category Target Achievement %
Command Area Development of Rajghat Project
26,624 26,624 100% Command Area Development of Rajghat Project
69,500 39,140 56%
New and ongoing minor irrigation projects (146)
50,232 42,272 84% Betwa Gursarai Canal System
27,000 20,570 76%
Bariyarpur Medium Projects(1)
43,850 43,850 100% RRR scheme of canals 28400 12,379 44%
Singhpur Barrage Medium Projects(1)
10,200 0 0% RRR of water Bodies 10000 10,000 100%
Canal Renovation (3) 24,391 24,391 100% Others 300 300 100%
Total 1,55,297 1,37,137 88% Total 1,35,200 82,389 61%

45
Major Observations during field visits: Madhya Pradesh
As a part of the evaluation study, 24 major, medium and minor irrigation projects were
visited. Apart from the Rajghat CAD project which transcends several districts, the district
wise of the remaining 23 projects visited are presented below (Table 12):
Table 12 District wise sample projects visited under surface irrigation projects
Chattarpur Damoh Panna Sagar Tikamgarh
Mamon tank
Urmil right bank canal
Rangwan canal
Beriyarpur left bank canal
Gonchi tank
Singpur barrage
Naruguwan tank
Sakaria tank
Ken anaicut
Paharikeda tank
Lipari tank
Amha tank
Krahi tank
Rampura tank
Samnapur tank
Bila feeder canal
Chanaua Bujgrug tank
Satdhara tank
Tikari tank
Veersagar tank
Rongataghat stop dam cum cause way
Sarkanpur tank
Satighat tank
6 projects 1 project 7 projects 5 projects 4 projects
Of the above 5 projects viz., the Rajghat CAD, Urmil Right Bank Canal project, Beriyarpur
left bank canal project, Singpur barrage project
and Rangawan Canal Project are classified as
major / medium irrigation projects while all
others are minor irrigation projects. All the 5
major / medium irrigation projects are on going
as on date of visit and they are expected to be
completed by June 2015.
Of the remaining 19 minor irrigation projects, 10
projects have been completed and another 7 are
likely to be completed by June 2014. The
following projects are expected to be completed by June 2015:
Naraguwan tank scheme
Samnapur tank scheme.
Physical Progress of Sample Projects
Rajghat CAD Project
The Rajghat Project which is a completed project, have over period witnessed reduction in
the irrigation capacity due to system deficiencies and damage. To remove these deficiencies,
the works were simultaneously undertaken under eight different packages amounting to Rs

46
2871 lakh for ERM under AIBP, under five
different packages for CSD and work of water
courses/ field channels through WUAs under
Bundelkhand Special Package amounting to Rs
2238.36 lakh. Based on the site inspection of
head middle and tail reaches of Datia Irrigation
Canal (DIC) and discussion with WRDs and
WUAS, it is observed that works of strengthening
of Canal bank in select reaches and repair of
various structures on the canal in select reaches
are significantly under progress and needs to be
completed. Out of the allocated amount of Rs.
2238.36 lakh, 1000 lakh was released and expenditure of Rs 917.40 lakh was made under
different works. The major operational
difficulties as reported by the Department
official are the sporadic nature of repair and
maintenance resulting in high cost due to
adverse effect of over emphasis on the economy
o scope in project formulation and unavailability
of suitable and resourceful contractors for small
works, scattered maintenance/repair and new
works carried out by WUAs
Beriyarpur Left Bank Canal Project
It is one of the major irrigation projects with a 45 km long main canal, 30 km of branch
canal and 412 km length of subsidiaries and net works. All the canals have been completed,
while the lining of canals are at different stages of completion. The project is expected to be
completed by June 2015.
Type of component Unit Target Achievement % Achievement
Length of main canal KM 45.00 49.00 100
Length of branch canal KM 30.00 30.00 100
Length of subsidiary and networks
KM 412.00 400.00 99
Length of main canals lined under the package
KM 49.00 43.00 88
Length of branch canals lined under the package
KM 30.00 15.00 50
Length of subsidiary and net works lined under the package )
KM 412.00 42.00 10

47
Singpur barrage project
It is one of the medium irrigation projects with a 23
km long main canal and 127 km length of subsidiaries
and net works. While the main canal has been more or
less constructed, about 20-30% of the remaining
works are complete. The project is expected to be
completed by June 2015.
Urmil Right Bank Canal
It is one of the major irrigation projects with a
30 km long main canal and 105 km length of
subsidiaries and net works. While the main
canal has been constructed, about 45 – 55% of
the remaining works are complete. The
project is expected to be completed by June
2014 though it was scheduled to be
completed by February 2013. The delay in
completion was due to the contractor.
Type of component Unit Target Achievement % achievement
Length of main canal KM 30.09 28.04 90
Length of subsidiary and networks
KM 105.39 47.12 45
Length of irrigation canals lined under the package (meter)
KM 135.48 75.08 55
Rangawan Canal Project
It is one of the major irrigation projects with a 40 km long main canal and 85 km length of
subsidiaries and net works. While the main canal has been completed upto 84%, about 68-
73% of the remaining works are complete. The project is expected to be completed by June
2014 though it was scheduled to be completed by February 2013. Early and continuous
rains were reported to be the reason for the delay.
Type of component Unit Target Achievement % achievement
Unit-i h/w cement : concrete and masonry
TH. CUM
88.50 61.50 70
Length of main canal KM 22.68 22.12 95
Length of subsidiary and networks
KM 127.00 30.00 20
Length of irrigation canals lined under the package (km.)
KM 149.68 52.12 30
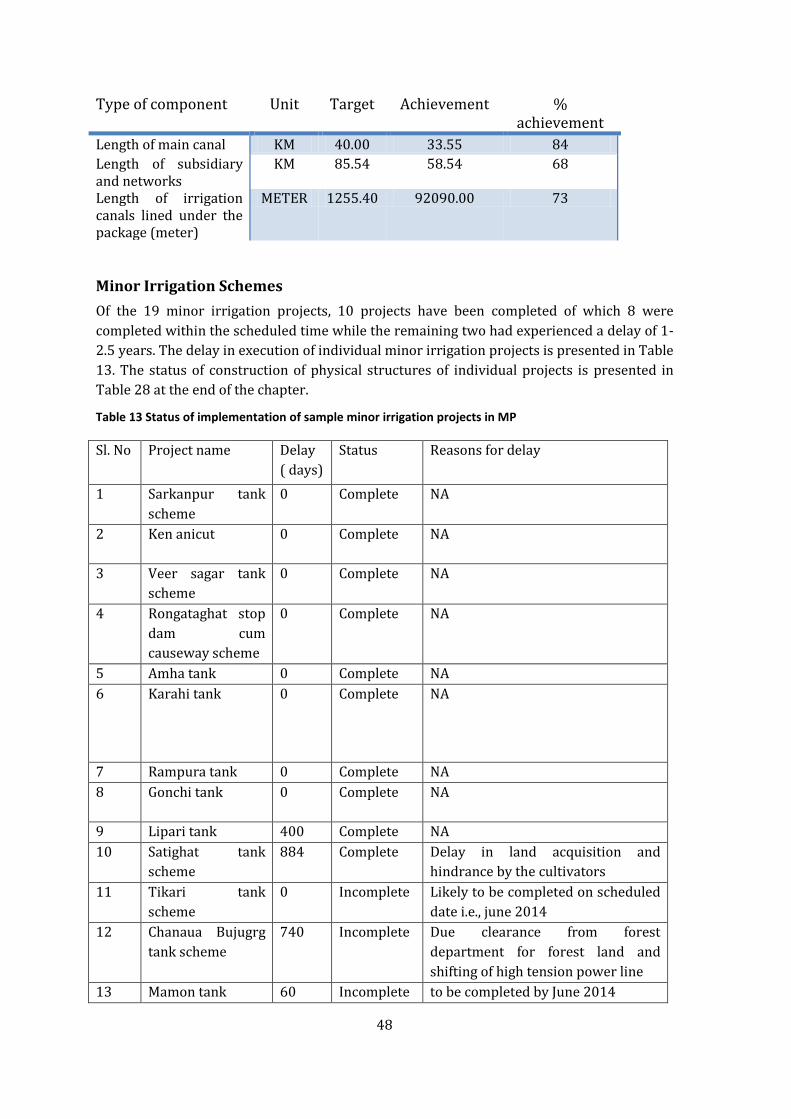
48
Type of component Unit Target Achievement % achievement
Length of main canal KM 40.00 33.55 84
Length of subsidiary and networks
KM 85.54 58.54 68
Length of irrigation canals lined under the package (meter)
METER 1255.40 92090.00 73
Minor Irrigation Schemes
Of the 19 minor irrigation projects, 10 projects have been completed of which 8 were
completed within the scheduled time while the remaining two had experienced a delay of 1-
2.5 years. The delay in execution of individual minor irrigation projects is presented in Table
13. The status of construction of physical structures of individual projects is presented in
Table 28 at the end of the chapter.
Table 13 Status of implementation of sample minor irrigation projects in MP
Sl. No Project name Delay
( days)
Status Reasons for delay
1 Sarkanpur tank
scheme
0 Complete NA
2 Ken anicut 0 Complete NA
3 Veer sagar tank
scheme
0 Complete NA
4 Rongataghat stop
dam cum
causeway scheme
0 Complete NA
5 Amha tank 0 Complete NA
6 Karahi tank 0 Complete NA
7 Rampura tank 0 Complete NA
8 Gonchi tank 0 Complete NA
9 Lipari tank 400 Complete NA
10 Satighat tank
scheme
884 Complete Delay in land acquisition and
hindrance by the cultivators
11 Tikari tank
scheme
0 Incomplete Likely to be completed on scheduled
date i.e., june 2014
12 Chanaua Bujugrg
tank scheme
740 Incomplete Due clearance from forest
department for forest land and
shifting of high tension power line
13 Mamon tank 60 Incomplete to be completed by June 2014

49
Sl. No Project name Delay
( days)
Status Reasons for delay
14 Bila feeder canal 273 Incomplete Due to increase in the quantity of
excavation, particularly hard soil
and rock.
15 Sakariya tank 536 Incomplete Project failed
16 Paharikheda tank 536 Incomplete Small patch is left to be completed.
17 Narguwan tank
scheme
943 Incomplete Tenders had to be floated 4 times
due to non-completion of stipulated
works by the contractors acquisition
amounting to 2.479 ha has been
sought from forest deptt. on
03/03/2014
18 Samnapur tank
scheme
1500 Incomplete Land acquisition, case & obtaining
agency for canal work 2nd call and
tender
19 Satdhara tank
scheme
1692 Incomplete Delay due to land acquisition cases
affecting the work of canal system
Anticipated and actual cost of sample projects
The sanctioned project cost and the expenditure incurred along with the status of project
implementation in respect of the above 24 projects is given in Table14
Table 14 Sanctioned and actual cost of sample surface irrigation projects in MP
Sl.No. Name of the
project
Project
Cost
Expenditur
e
%
expenditure
Status of project
1 Mamon tank 955 769.01 81% To be completed
by June 2014
2 Urmil r.b canal
project
4569 1850 40% To be completed
by June 2014
3 Singhpur barrage
project
20052 17988.43 90% To be completed
by June 2015
4 Rangawan canal
project
3244 2381 73% To be completed
by June 2014
5 Bariyarpur left
bank canal project
20566.08 19930.79 97% To be completed
by June 2015
6 Narguwan tank
scheme
1268.66 1042.66 82% To be completed
by June 2015
7 Veer Sagar tank
scheme
58.55 40.38 69% Completed
8 Rongataghat stop
dam cum
causeway scheme
164.98 164.98 100% Completed
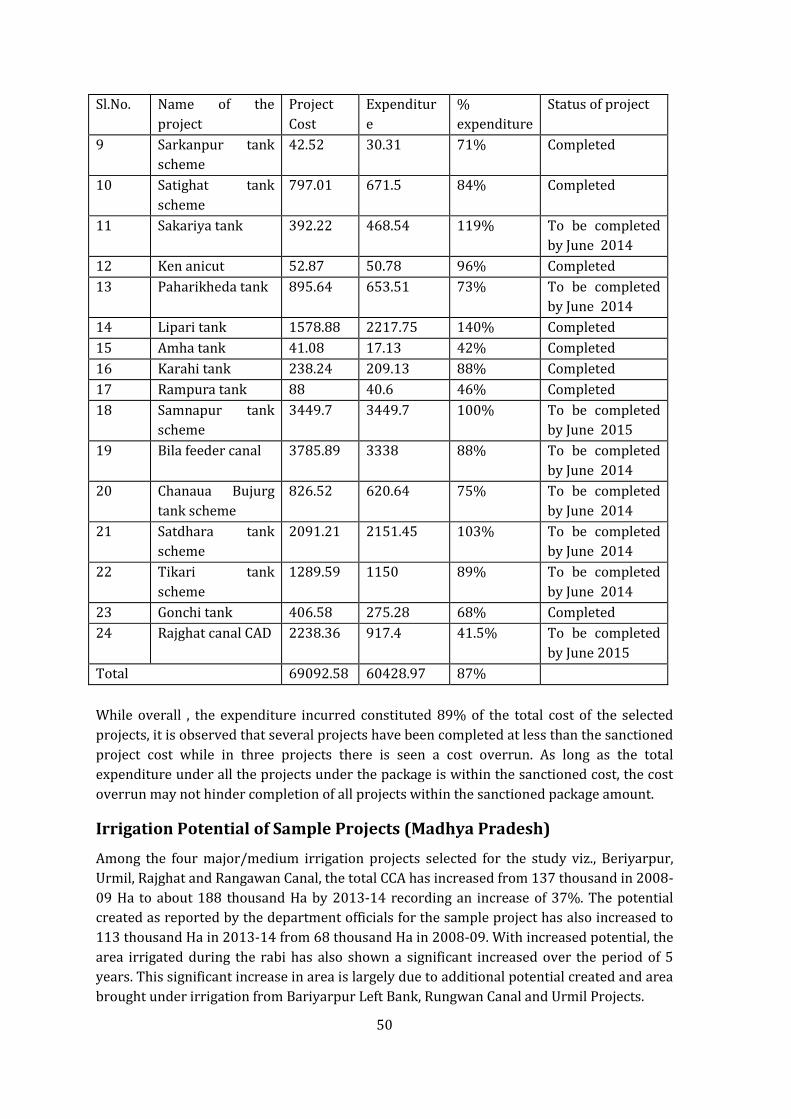
50
Sl.No. Name of the
project
Project
Cost
Expenditur
e
%
expenditure
Status of project
9 Sarkanpur tank
scheme
42.52 30.31 71% Completed
10 Satighat tank
scheme
797.01 671.5 84% Completed
11 Sakariya tank 392.22 468.54 119% To be completed
by June 2014
12 Ken anicut 52.87 50.78 96% Completed
13 Paharikheda tank 895.64 653.51 73% To be completed
by June 2014
14 Lipari tank 1578.88 2217.75 140% Completed
15 Amha tank 41.08 17.13 42% Completed
16 Karahi tank 238.24 209.13 88% Completed
17 Rampura tank 88 40.6 46% Completed
18 Samnapur tank
scheme
3449.7 3449.7 100% To be completed
by June 2015
19 Bila feeder canal 3785.89 3338 88% To be completed
by June 2014
20 Chanaua Bujurg
tank scheme
826.52 620.64 75% To be completed
by June 2014
21 Satdhara tank
scheme
2091.21 2151.45 103% To be completed
by June 2014
22 Tikari tank
scheme
1289.59 1150 89% To be completed
by June 2014
23 Gonchi tank 406.58 275.28 68% Completed
24 Rajghat canal CAD 2238.36 917.4 41.5% To be completed
by June 2015
Total 69092.58 60428.97 87%
While overall , the expenditure incurred constituted 89% of the total cost of the selected
projects, it is observed that several projects have been completed at less than the sanctioned
project cost while in three projects there is seen a cost overrun. As long as the total
expenditure under all the projects under the package is within the sanctioned cost, the cost
overrun may not hinder completion of all projects within the sanctioned package amount.
Irrigation Potential of Sample Projects (Madhya Pradesh)
Among the four major/medium irrigation projects selected for the study viz., Beriyarpur,
Urmil, Rajghat and Rangawan Canal, the total CCA has increased from 137 thousand in 2008-
09 Ha to about 188 thousand Ha by 2013-14 recording an increase of 37%. The potential
created as reported by the department officials for the sample project has also increased to
113 thousand Ha in 2013-14 from 68 thousand Ha in 2008-09. With increased potential, the
area irrigated during the rabi has also shown a significant increased over the period of 5
years. This significant increase in area is largely due to additional potential created and area
brought under irrigation from Bariyarpur Left Bank, Rungwan Canal and Urmil Projects.

51
Table 15 CCA, Potential created and area irrigated during rabi from major/ minor irrigation project in
MP
Particulars
20
08
-09
20
09
-10
20
10
-11
20
11
-12
20
12
-13
20
13
-14
Major/Medium Project
Culturable Command Area (Th. Ha)
137.26 137.26 137.26 137.26 182.07
188.07
Irrigation Potential Created (Th. Ha)
68.21 65.71 63.81 68.81 105.17
113.17
Area Irrigated during Rabi (Th. Ha)
9.00 35.77 40.19 69.95 84.59 116.58
Ongoing/New Minor Irrigation Projects
Culturable Command Area (Th. Ha)
3.32 3.32 3.32 3.32 9.12 19.03
Irrigation Potential Created (Th. Ha)
2.42 2.42 2.42 3.06 5.89 11.18
Area Irrigated during Rabi (Th. Ha)
0.75 0.59 0.50 1.81 4.32 7.01
Total
Culturable Command Area (Th. Ha)
140.57 140.57 140.57 140.57 191.18
207.09
Irrigation Potential Created (Th. Ha)
70.63 68.13 66.23 71.86 111.06
124.35
Area Irrigated during Rabi (Th. Ha)
9.75 36.36 40.68 71.75 88.90 123.59
The results are highly encouraging for sample Minor Irrigation Schemes where the CCA,
Irrigation potential and Area irrigated under rabi has increased by more than 200%. In total,
due to creation of additional irrigation infrastructures, completion of ongoing and new
minor irrigation scheme has resulted in increased area under rabi crop by more than 200%.
Impact of the Irrigation Projects on the Farmers
Based on sample survey of 630 farmers benefitted by
the selected sample projects, the impact of these
projects on the increase in irrigated land, cropping
pattern, productivity levels etc., were studied and the
results are presented in the following paragraph.
The average farm holding size was 5.56 acres and there
was no accretion to the land owned after the projects
were implemented. The average irrigated land of the
sample farmers in the pre project period (2009-10) was
2.78 acres which increased to 4.67 acres in 2012-13 with a corresponding decrease in the
rainfed land. There is further scope of increase in irrigated area as few more projects are to
be completed.

52
Table 16 Average land holding and cropping intensity of sample beneficiaries of surface irrigation
projects in MP
Parameter 2009-10 2010-11 2011-12 2012-13
Average rainfed land (acres) 2.78 2.78 2.5 0.89
Average irrigated land 2.78 2.78 3.06 4.67
Average farm holding 5.56 5.56 5.56 5.56
Average gross cropped area 6.56 6.23 6.51 6.89
Cropping intensity (%) 118% 112% 117% 124%
Changes in cropping pattern
Black gram, paddy, and soya bean were the major kharif crops and it was observed that
there was no major shift in cropping pattern in the Kharif season due to the projects nor the
cropped area increased in that season.
Table 17 Kharif cropping pattern of sample beneficiaries of surface irrigation projects in MP
Crop 2009-10 2010-11 2011-12 2012-13
Black gram 0.46 0.46 0.46 0.38
Paddy 0.51 0.52 0.52 0.53
Soybean 0.75 0.75 0.75 0.75
Others 0.23 0.23 0.23 0.18
Kharif Total 1.95 1.96 1.96 1.84
In rabi season, the acreage under wheat increased from 2.14 acres per farm to 3.38 acres,
the entire additional cropped area due to the projects being brought under wheat, besides
shift from gram and lentil.
Table 18 Rabi cropping pattern of sample beneficiaries of surface irrigation projects in MP
Crop 2009-10 2010-11 2011-12 2012-13
Gram 1.96 1.95 1.83 1.52
Lentil 0.21 0.21 0.19 0.17
Wheat 2.14 2.13 2.41 3.38
Others 0.06 0.06 0.07 0.09
Rabi total 4.37 4.36 4.50 5.16
Increase in Productivity and Farm Income
The details of productivity of major crops in the sample farms in the pre project and project
period are presented in Table 19

53
Table 19 Productivity of major crops of sample beneficiaries of surface irrigation projects in MP
Crop 2009-10 2010-11 2011-12 2012-13
Kharif crops
Paddy 1154 1395 1172 1172
Blackgram 223 221 215 225
Soybean 646 678 704 695
Rabi crops
Wheat 886 944 1106 1129
Gram 285 285 280 297
Lentil 794 776 519 604
The yield of major kharif and rabi crops increased during the project period for the
following reasons:
Life saving irrigation available during kharif seasons
Assured irrigation during rabi season
Adoption of HYV /improved varieties of seeds with appropriate package of practices
However the productivity of lentil has gone down showing disinterest by the farmers in this
crop
Major Observations from Field Visits: Uttar Pradesh
As a part of the evaluation study, 17 major, medium and minor irrigation projects were
visited. The district wise projects visited are presented below in table 20.
Table 20 Sample surface irrigation projects visited in UP
Physical progress of sample projects
All the 17 projects are renovation / modernisation / lining of existing canals / water bodies
projects. Therefore no land acquisition problems were encountered. All except one of the
projects were awarded to contractors after open tendering process in 2010-11; the lone
project viz., the Urmil dam project was also awarded after open tender but in February
Mahoba Lalitpur Jahnsi Jalaun Chitrakoot Hamirpur
Salarpur tank Urmila dam Dashrapur tank
Jaklaun pump canal
Pachwara lake Pachwara main canal –RRR Kakrawara main canal Ajrar main canal PT. Deendayal Upadhyay Pathrai dam In Barwar main canal Ajrar tank
Repairs and renovation of 6 bandhies ( 2 projects) Jayawanti tank Kuthond branch
Burdha dam and canal system
Maudaha main canal
3 Projects 1 Project 7 projects 3 projects 1 project 1 project

54
2013. Despite no hurdles in land acquisition, delays were seen in completion of the projects
as could be seen from the following table
Period of Delay No of Project
No delay 7 Upto 6 months delay 0 Upto 7-12 months 5 13-24 months 0 >24 months 5
Of the 5 projects with more than 2 years delay,
four projects are still ongoing and they are
expected to be completed in a years’ time. The
major reason reported for the delay was
providing irrigation and drinking water
facilities for most parts of the year considering
the drought situation in the region and
therefore very less period is available for
renovation and lining works. The status of
construction of physical structures of individual
projects are presented in Table 29 at the end of the chapter
Anticipated and actual cost of the project
The cost of the sample projects and the expenditure incurred against each of the project is
given in Table 21.
Table 21 Sanctioned and actual cost of sample surface irrigation projects in UP
Sl.
No.
Name of the project Total cost
(Rs lakh)
Actual
expenditure
(Rs lakh)
Physical
progress
1 Salarpur tank project 740.27 740.27 Completed
2 Urmil dam project (left bank canal) 405 175 Completed
3 Dashrapur tank project 118.53 118.53 Completed
4 Jakhlaun pump canal (renovation [c.c.
lining])
1902.95 1705.42 Completed
5 6 no bundhies (repair and restoration
of[kadaura])
23 23 Completed
6 Bundhies (repair and restoration of 6 no
[kadaura])
23 23 Completed
7 Pachwara lake (capacity restoration
moderization )
70.99 69.3 Completed
8 Pachwara main canal (restoration &
lining )
305.23 173.27 Completed
9 Kakarwara main canal (restoration and
lining)
Completed
10 Arjar main canal((restoration and lining) Completed

55
Sl.
No.
Name of the project Total cost
(Rs lakh)
Actual
expenditure
(Rs lakh)
Physical
progress
11 Pt. Deendayal Upadhyay Pathrai Dam
(modernization, restoration and lining of
the canal )
561.52 479 Incomplete
12 Arjar tank (capacity
Restoration/moderization )
84.29 84.26 Completed
13 Barwar main canal (restoration and
construction of c.c. lining-0.0000 to
30.880)
684 528.78 Completed
14 Burdha dam & canal system 321.26 321.26 Completed
15 Jaywanti tank (restoration) 587.62 571.62 Incomplete
16 Kuthond branch (restoration of lining) 2528 1379 Incomplete
17 Maudaha Main canal (c-c lining &
restoring section)
1853.95 859.63 Incomplete
10209.61 7251.34
It could be seen there from that many projects have been completed within the sanctioned
cost; few with considerable savings.
Irrigation Potential of Sample Projects (Uttar Pradesh)
The increase in the irrigation potential of these projects was expected to the extent of about
11000 ha at an estimated cost of Rs 10209 lakh, with average per ha cost working out to Rs
1 lakh . The year wise progress in creation of irrigation potential from these projects is given
in Table 22.
Table 22 Year wise irrigation potential of sample surface irrigation projects in UP
Year => 2008-09 2009-10 2010-11 2011-12 2012-13 2013-14
Irrigation potential (ha)
46701 46812 46697 53658 56046 57332
Impact of the Irrigation Projects on the Farmers
Based on sample survey of 870 farmers benefitted by the 17 sample projects, the impact of
these projects on the increase in irrigated land, cropping pattern, productivity levels etc.,
were studied and the results are presented in the following paragraphs.
The average farm holding size was 3.89 acres and there was no accretion to the land owned
after the projects were implemented. The average irrigated land of the sample farmers in the
pre project period (2009-10) was 2.89 acres which increased to 3.37 acres in 2012-13 with
a corresponding decrease in the rainfed land. There is further scope of increase in irrigated
area as few more projects are to be completed.

56
Table 23 Average land holding and cropping intensity of sample beneficiaries of surface irrigation
projects in UP
Parameter 2009-10 2010-11 2011-12 2012-13
Average rainfed land (acres) 1.00 0.86 0.85 0.52
Average irrigated land 2.89 3.02 3.04 3.37
Average farm holding 3.88 3.89 3.89 3.89
Average gross cropped area 5.54 5.68 5.68 5.90
Cropping intensity (%) 1.43 1.46 1.46 1.52
Changes in Cropping Pattern
Arhar, til , soya bean, urd, jowar, maize and moong were the major kharif crops and it was
observed that there was no major shift in cropping pattern in the Kharif season due to the
projects nor the cropped area increased in that season.
Table 24 Kharif cropping pattern of sample beneficiaries of surface irrigation projects in UP
Crop 2009-10 2010-11 2011-12 2012-13
Arhar 0.26 0.25 0.23 0.20
Juwar 0.19 0.19 0.19 0.19
Maize 0.15 0.15 0.15 0.15
Moong 0.19 0.20 0.20 0.19
Soyabeen 0.41 0.41 0.41 0.48
Til 0.27 0.27 0.27 0.27
Urd 0.80 0.81 0.81 0.74
Others 0.19 0.19 0.18 0.19
Kharif 2.46 2.46 2.44 2.42
In rabi season, the acreage under wheat increased from 1.95 acres per farm to 2.32 acres,
the entire additional cropped area due to the projects being brought under wheat.
Table 25 Rabi cropping pattern of sample beneficiaries of surface irrigation projects in UP
Crop 2009-10 2010-11 2011-12 2012-13
Wheat 1.95 2.05 2.07 2.32
Gram 0.65 0.68 0.67 0.67
Peas 0.35 0.36 0.37 0.37
Others 0.12 0.12 0.12 0.12
Total rabi 3.07 3.22 3.23 3.47
Increase in Productivity and Farm Income
The details of productivity of major crops in the sample farms in the pre project and project
period are presented in Table 26

57
Table 26 Productivity of major crops of sample beneficiaries of surface irrigation projects in UP
Crop 2009-10 2010-11 2011-12 2012-13 % increase over 2009-10
Kharif crops
Arhar 219 313 238 264 21%
Juwar 412 461 483 499 21%
Maize 412 503 544 575 40%
Moong 47 61 68 86 83%
Soyabeen 683 720 742 729 7%
Til 82 83 90 92 12%
Urd 164 207 201 247 51%
Rabi crops
Wheat 581 727 681 789 36%
Gram 316 373 384 438 39%
Peas 347 421 458 492 42%
The yield of major kharif and rabi crops increased during the project period for the
following reasons:
Life saving irrigation available during kharif seasons
Assured irrigation during rabi season
Adoption of HYV /improved varieties of seeds with appropriate package of practices
As a result, the average farm income per household increased from Rs 44717 in the pre
project period to Rs 60203 in 2012-13.
Table 27 Average household farm income of sample beneficiaries of surface irrigation projects in UP
Parameter 2009-10 2010-11 2011-12 2012-13
Average household income from agriculture at 2012-13 prices (Rs)
44717 48038 53839 60203
Likely macro impact of surface irrigation projects
The surface irrigation projects enabled the farmers to bring additional area under irrigation
and shift and expand the cropping pattern to remunerative wheat crop. In MP, additional
irrigated area accrued during rabi season. This was devoted to wheat and the area under
wheat in the sample farms increased from 2.14 acres in 2009-10 to 3.38 acres (57%) in
2012-13. In UP also the additional area was brought under wheat due to availability of
irrigation facilities. The area under wheat in the sample farms increased from 1.95 acres in
2009-10 to 2.32 acres in 2012-13 (19% increase). Overall it can be concluded that the
additional irrigated potential created by the surface irrigation projects has been fully
devoted to cultivation of wheat crop in Bundelkhand region. As for productivity, the yield of
wheat in the sample farms in MP increased from 886 kg per acre in 2009-10 to 1129 kg per
acre in 2012-13, a 27% increase due to assured irrigation and adoption of HYV /improved
varieties of seeds with appropriate package of practices. Similarly the yield of wheat

58
increased from 581 kg per acre to 789 kg per acre between 2009-10 and 2012-13 i.e., by
36%. At a macro level the total production of wheat would have increased by 91300 MT in
MP and 69740 MT in UP aggregating all to 161000 MT in the region because of the package.

59
Table 28: Component wise physical progress under sample surface irrigation projects in Madhya Pradesh
Sl. No. Project Name Type of infrastructure Physical Quantity Stage of completion (%)
Stage of completion (%)
Target Unit Achievement
1 Mamon tank Length of main canal 4.86 KM 4.86 100 100
Length of subsidiary and networks
12.57 KM 12.57 100 100
Length of irrigation canals lined under the package (meter)
2 Urmil r.b canal project
Length of main canal 30.09 KM 28.04 90 90
Length of subsidiary and networks
105.39 KM 47.12 45 45
Length of irrigation canals lined under the package (meter)
135.48 KM 75.08 55 55
3 Singhpur barrage project
Unit-i h/w cement : concrete and masonry
88.50 TH. CUM 61.50 70 70
length of main canal 22.68 KM 22.12 95 95
length of subsidiary and networks
127.00 KM 30.00 20 20
length of irrigation canals lined under the package (km.)
149.68 KM 52.12 30 30
4 Rangawan canal project
Length of main canal 40.00 KM 33.55 84 84
Length of subsidiary and networks
85.54 KM 58.54 68 68
Length of irrigation canals lined under the package (meter)
1255.40 METER 92090.00 73 73

60
Sl. No. Project Name Type of infrastructure Physical Quantity Stage of completion (%)
Stage of completion (%)
5 Bariyarpur left bank canal project
Length of main canal 45.00 KM 49.00 100 100
Length of branch canal 30.00 KM 30.00 100 100
Length of subsidiary and networks
412.00 KM 400.00 99 99
Length of irrigation canals lined under the package (meter)
49.00 KM 43.00 88 88
Length of irrigation canals lined under the package (meter)
30.00 KM 15.00 50 50
Length of irrigation canals lined under the package (meter)
412.00 KM 42.00 10 10
6 Narguwan tank scheme
Head works
Dam 1290.00 METER 967.50 75 75
w.w 30.00 METER 25.50 75 75
Length of main canal 8.00 KM 3.60 45 45
Length of subsidiary and networks
Length of irrigation canals lined under the package (meter)
7 Veer Sagar tank scheme
Head work
Construction of protection wall, and various repair work
420.00 METER 420.00 100 100
Resectioning of main canal
1400.00 METER 1400.00 100 100
Re-sectioning of branch & 1100.00 METER 1100.00 100 100

61
Sl. No. Project Name Type of infrastructure Physical Quantity Stage of completion (%)
Stage of completion (%)
minor canals
8 Rongataghat stop dam cum causeway scheme
Head work
Concrete weir 153.00 METER 153.00 100 100
Weirs and cause way 153.00 METER 153.00 100 100
Length of left bank canal
Length of right bank canal
9 Sarkanpur tank scheme
Head work
Repair of sluice 1.00 NO 1.00 100 100
RRR of canal 400.00 METER 400.00 100 100
New masonry canal 861.00 METER 861.00 100 100
10 Satighat tank scheme
Head work
Dam 630.00 METER 630.00 100 100
W.W 186.00 METER 186.00 100 100
Length of left bank canal 1400.00 METER 1400.00 100 100
Length of right bank canal 5500.00 METER 5500.00 100 100
11 Sakariya tank Length of main dam
Length of main canal
Length of subsidiary and networks
Length of irrigation canals lined under the package (meter)
12 Ken anicut Length of main weir 60.00 METER 60.00 100 100
Length of main canal
Length of subsidiary and networks

62
Sl. No. Project Name Type of infrastructure Physical Quantity Stage of completion (%)
Stage of completion (%)
Length of irrigation canals lined under the package (meter)
13 Paharikheda tank
Length of main dam 1080.00 METER 1080.00 100 100
Length of main canal 4.50 KM 4.50 100 100
Length of subsidiary and networks
Length of irrigation canals lined under the package (meter)
14 Lipari tank Length of main dam 1650.00 METER 1650.00 100 100
Length of main canal 11.85 KM 11.50 98 98
Length of subsidiary and networks
46.80 KM 44.46 95 95
Length of irrigation canals lined under the package (meter)
15 Amha tank Length of main dam 2305.00 METER
Length of main canal 1.05 KM 1.05 100 100
Length of subsidiary and networks
10.56 KM 10.56 100 100
Length of irrigation canals lined under the package (meter)
16 Karahi tank Length of main dam 540.00 METER 540.00 100 100
Length of main canal 2850.00 METER 2850.00 100 100
Length of subsidiary and networks
11700.00 METER 11700.00 100 100
Length of irrigation 750.00 METER 750.00 100 100

63
Sl. No. Project Name Type of infrastructure Physical Quantity Stage of completion (%)
Stage of completion (%)
canals lined under the package (meter)cc channel
17 Rampura tank Length of main dam 675.00 METER 675.00 100 100
Length of main canal LBC 3000.00 METER 3000.00 100 100
Length of main canal RBC 3090.00 METER 3090.00 100 100
Length of subsidiary and networks
Length of irrigation canals lined under the package (meter)cc channel
600.00 METER 600.00 100 100
18 Samnapur tank scheme
Length of main canal 11310.00 METER 9600.00 85 85
Length of subsidiary and networks
14770.00 METER 12000.00 81 81
Length of irrigation canals lined under the package (meter)
11310.00 METER 0.00 0
19 Bila feeder canal
Excavation of feeder canal 2194913.00 CUM 1872587.00 85 85
Head work & canal structures
42.00 NO 8.00 20 20
Length of main canal 25.83 KM 19.74 76 76
Length of subsidiary and networks
NIL NA
Length of irrigation canals lined under the package
NIL NA
20 Chanaua bujugrg tank
Length of main canal (LBC)
1.95 KM 0.21 11 11

64
Sl. No. Project Name Type of infrastructure Physical Quantity Stage of completion (%)
Stage of completion (%)
scheme Length of main canal (RBC)
4.50 KM 1.05 23 23
Length of subsidiary and networks (minor)
1.20 KM
Length of irrigation canals lined under the package (meter)
NO PROVISION NO PROVISION
21 Satdhara tank scheme
Head work
Dam 1290.00 METER 1290.00 100 100
w.w. 140.00 METER 140.00 100 100
Length of main canal 14940.00 METER 14400.00 96 96
Length of subsidiary and networks
9800.00 METER 7000.00 72 72
Length of irrigation canals lined under the package (meter)
785.00 METER 785.00 100 100
22 Tikari tank scheme
Excavation of all type soil 323005.00 CUM 288174.00
Rock excavation 51732.00 CUM 46028.00
Earth work 661764.00 CUM 699429.00 98 98
Pitching 41264.00 CUM 41530.00
Boulder toe 21404.00 CUM 17494.00
Excavation of all type soil 255695.00 CUM 132218.00
Rock excavation 25037.00 CUM 10950.00
Cement concrete work 8074.00 CUM 2536.00 48 48
Cement concrete lining 3999.00 CUM 1098.00
Structures 77.00 NO 27.00
Length of main Canal (RBC & LBC)
16.50 KM
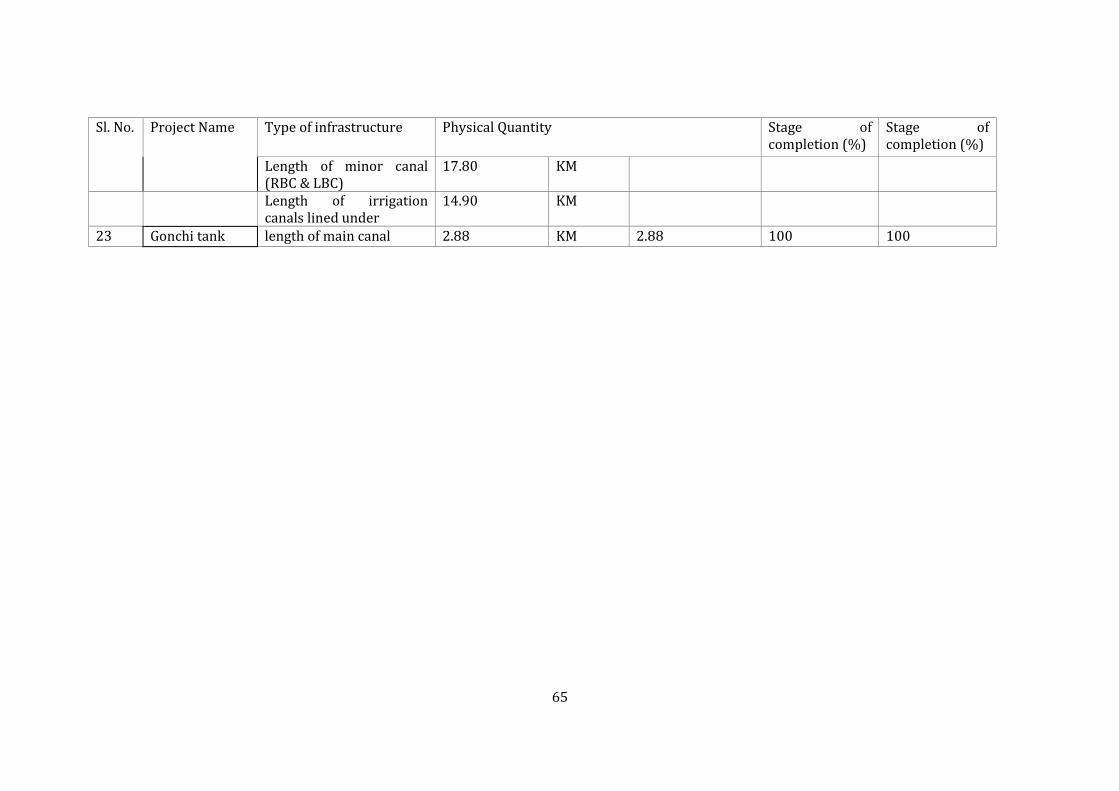
65
Sl. No. Project Name Type of infrastructure Physical Quantity Stage of completion (%)
Stage of completion (%)
Length of minor canal (RBC & LBC)
17.80 KM
Length of irrigation canals lined under
14.90 KM
23 Gonchi tank length of main canal 2.88 KM 2.88 100 100

66
Table 29: Component wise physical progress under sample surface irrigation projects in Uttar Pradesh
SL Project name Type of infrastructure Unit Physical quantity Stage of completion (%)
Target Achievement
1 Salarpur tank project Length of main dam KM 2.97 2.97 100
Quantity of de-silting from dam CUM 400000.00 400000.00 100
Length of main canal KM 10.68 10.68 100
2 Urmil dam project (left bank canal)
Length of irrigation canal lined under the package in meters
5225 2350 45
3 Dashrapur tank project Tank (1) KM 1.50
Tank (2) KM 1.15
Tank (3) KM 1.50
Quantity of de-silting CUM 90000.00 100
Tank (1) KM 4.50
Tank (2) KM 3.60
Tank (3) KM 9.00
4 Jakhlaun Pump Canal (renovation [c.c. Lining])
C.c. Lining of JPC. (in patches) form km. 4.000 to 34.300
13.770 13.770 100
Length of main canal in patches 13.770 13.770 100
Length of subsidiary and networks
Length of irrigation canals lined under the package (meter)
13.770 13.770 100
5 6 no bundhies (repair and restoration of[Kadaura])
Earth work 5320 4721 Completed
Pucca work NO 1.00 1.00 100
Length of main canal
Length of subsidiary and networks
Length of irrigation canals lined under the package (meter)

67
SL Project name Type of infrastructure Unit Physical quantity Stage of completion (%)
Target Achievement
6 Bundhies (repair and restoration of 6 no [kadaura])
Earth work 8605 7442 COMPLETED
Pucca work NO 1.00 1.00 100
Length of main canal
Length of subsidiary and networks
Length of irrigation canals lined under the package (meter)
7 Pachwara lake (capacity restoration modernization )
Restoration of pachwara lake in district Jhansi
Cum 49140.00 49140.00 100
Length of main canal
Length of subsidiary and networks
Length of irrigation canals lined under the package (meter)
8 Pachwara main canal (restoration & lining )
Cement concrete lining (1:2:4 mix & 60 mm thick)
Length of main canal
Length of subsidiary and networks
Length of irrigation canals lined under the package (meter)
9 Kakarwara main canal (restoration and lining)
Cement concrete lining (1:2:4 mix & 60 mm thick)
Length of main canal KM 6.20
Length of subsidiary and networks
Length of irrigation canals lined under the package (meter)
10 Arjar tank (capacity restoration/modernization )
Restoration/modernization of Arjar tank in district Jhansi

68
SL Project name Type of infrastructure Unit Physical quantity Stage of completion (%)
Target Achievement
Length of main canal
Length of subsidiary and networks
Length of irrigation canals lined under the package (meter)
11 Pt. Deendayal upadhyay pathrai dam (modernisation, restoration and lining of the canal )
Canal service road KM 9.50 9.50 KM 100
Restoration canal section KM 2.00 2.00 KM 100
Pucca work on canal NO 29.00 29 NOS 100
Dam work JOB 1.00 1 JOB 100
Length of main canal
Length of subsidiary and networks
Length of irrigation canals lined under the package (meter)
KM 3.75 3.75 KM 100
12 Arjar main canal((restoration and lining)
Cement concrete lining (1:2:4 mix of 60 mm thick)
Length of main canal
Length of subsidiary and networks
Length of irrigation canals lined under the package (meter)
13 In Barwar main canal (restoration and construction of c.c. Lining-0.0000 to 30.880)
Restoration and const of c.c. Lining in Barwar main canal
KM 13.25 10.00 75
Length of main canal KM 30.88
Length of subsidiary and networks KM 22.86
Length of irrigation canals lined under the package (meter)
KM 13.25
14 Burdha dam & canal system Restoration of embankment of ram KM 2.78 2.78 100
Restoration of canals KM 8.15 8.15 100

69
SL Project name Type of infrastructure Unit Physical quantity Stage of completion (%)
Target Achievement
15 Jaywanti tank (restoration) Restoration of Jaywanti KM 3.40 3.40 100
16 Kuthond branch (restoration of lining)
C.c. Lining KM 20.40 8.00 40
Construction of bridge NO 2.00 2.00 100
Repair of bridge NO 13.00 13.00 100
Repair of heads of meter NO 9.00 9.00 100
Restoration of canal KM 107.22 107.22 100
Construction of retaining works M 1205.00 345.00
Restoration of canal KM 185.37 169.50
Length of main canal KM 105.21
Length of subsidiary and networks KM 861.94
Length of irrigation canals lined under the package (meter)
KM 20.40
17 Maudaha main canal (c-c lining & restoring section)
Earth work LAC CUM 2.06 1.40
C-c lining of canal LAC CUM 0.24 0.15
Length of main canal
Length of subsidiary and networks
Length of irrigation canals lined under the package (meter)
12000 5000

70
Chapter 4 Watershed Management
Activities in Uttar Pradesh
New Dug wells, Dug well renovation, Recharge and HDPE Pipe
All the above four activities are intended to benefit individual farmers to judiciously exploit
and distribute ground water resources in their fields. However the first three activities have
been classified under Watershed Development sector while distribution of HDPE pipes has
been classified under water resources sector. The construction of new dug wells were
implemented in four districts; Jhansi, Lalitpur, Chitrakoot and Mahoba.
Deepening/Renovation of existing dug well were undertaken in districts of Jhansi, Lalitpur
and Mahoba. Recharge tanks were constructed for the purpose of recharge of dug wells in all
the districts. New Dug wells and renovation of existing/ old dug well were proposed in
convergence with MGNREGA Scheme and Additional Central Assistance. No new dug wells
were considered in the districts of Jalaun, Banda and Hamirpur. HDPE pipes were
distributed in all the districts. A total of Rs 400 crore constituting 24% of the ACA
allocations were earmarked for the above activities. The amount released was Rs
236 crore (59%), against which Rs 168 crore has been expended. The low level of
financial achievement was due to several implementation problems faced at the field
level.
Physical and Financial Progress
Physical Progress
The total targeted new dug well/blast wells under the package for the phase-I was 8834
against which 4094 are reportedly completed, which 46% of the total target dug wells. The
number of completed dug wells in Chitrakoot is only
19%, the least compared to three other districts;
Jhansi, Lalitpur and Mahoba. The most important
reasons cited by the department for incomplete work
is due to convergence with MGNREGA Scheme, which
do accompany with labour shortage because of
additional works of Panchayat. The problems are also
faced by the department due to sanction and release of
amount by the MGNREGA. The convergence with
MGNREGA Scheme has resulted in considerable delays in completion of work and may dug
wells are still incomplete. There were cases of collapse reported earlier because the wells
were not completed in time as the fund from MGNREGA was not released in time.

71
Table 30 District wise physical targets and achievements of dug wells scheme under Bundelkhand Package in UP
Name of the Scheme District Physical
Target Achieved % Achievement
Construction of New Dug Well/Blast Wells
Jhansi 2617 1338 51%
Lalitpur 2617 1686 64%
Mahoba 1800 726 40%
Chitrakoot 1800 344 19%
Total 8834 4094 46%
Renovation/Deepening of Dug Well/Blast Wells
Jhansi 8900 700 8%
Lalitpur 8900 2046 23%
Jalaun 1600 0 -
Hamirpur* 622 0 -
Banda* 900 0 -
Mahoba* 7040 875 12%
Chitrakoot 2158 333 15%
Total 30120 3954 13%
Dug Well Recharge
Jhansi 8565 162 2%
Lalitpur 8750 3000 34%
Jalaun 2215 599 27%
Hamirpur 910 910 100%
Banda 1360 766 56%
Mahoba 6864 302 4%
Chitrakoot 2200 847 39%
Total 30864 6586 21%
Under Renovation/Deepending of Dug Wells and Blast wells, the progress is not at all
satisfactory as only 13% of the targeted deepening
have taken place. In Jalaun, Hamirpur and Banda
districts, activity of deepening was dropped due its
impracticability. In Jhansi, only 8% of the targets
were deepened. In Lalitpur, although a fair progress
of 23% have been made during the first phase but it
was also found, that only deepening as proposed has
been done on older
wells but the ideal
would have been the proposal should have included the
lining of dug wells as well.
One small pit of the size of 2 m. X 1.5 m. X 1.5 m. and one
bigger pit of the size of 3 m. X 3 m. X 1.5 m. are constructed
in series and they are also connected with a 150 mm.
diameter PVC pipe. The bigger pit is then connected with
the dug well through another PVC pipe of 150 mm.
diameter. It is ensured that both the pits and well are
constructed in series. An artificial catchment is created to facilitate flow of rain water to the
pits and then ultimately to the well.

72
The project is a total failure as the soils in the area are heavy and after the first rain fall the
infiltration rate of water from the pits becomes almost zero. Neither farmer nor the
department officials are convinced about the utility of the dug well recharge pit. It is also not
possible to keep the catchment area clean and therefore dirty and muddy water flows into
the well (if at all there is any flow from the recharge pit to dug well) which pollutes the
water of the well also. GoUP may consider stopping the construction of dug well recharge
pits.
Financial Progress
The financial sanction given for construction of New Dug Wells/Blast Wells (8,834),
Renovation/Deepening of Dug Well/Blast Wells (30,120) and Dug Well Recharge (30,864)
was Rs. 250 crore for the former two and Rs. 46.43 crore for the later respectively. The
target of renovation of old wells and recharge pit structures were quite large and did not off
take satisfactorily. Total expenditure by 2013-14 made out of the total sanctioned budget
was 46% for New Dug wells, 10% for renovation activities and 25% for Dug well recharge.
The district wise financial progress of dug well scheme can be seen in the Table 31
presented below.
Table 31 District wise financial targets and achievements of dug well scheme in UP
Name of the Scheme District Financial (Rs. Crore)
Sanctioned Expenditure ACA Exp. % of Exp to Sanction
Construction of New Dug Well/Blast Wells
Jhansi 74.06 38.50 21.15 52%
Lalitpur 74.06 45.85 16.70 62%
Mahoba 50.94 17.22 8.43 34%
Chitrakoot 50.94 2.52 1.27 5%
Chitrakoot 50.94 2.52 1.27 5%
Total 250.00 104.09 47.55 42%
Renovation/Deepening of Dug Well/Blast Wells
Jhansi 73.87 6.63 2.98 9%
Lalitpur 73.87 12.02 6.33 16%
Jalaun 13.28 - - -
Hamirpur 5.16 - - -
Banda 7.47 - - -
Mahoba 58.43 4.09 1.77 7%
Chitrakoot 17.91 2.52 1.27 14%
Total 250.00 25.26 12.37 10%
Dug Well Recharge
Jhansi 13.87 0.40 0.33 3%
Lalitpur 14.17 5.95 5.37 42%
Jalaun 3.58 1.52 1.29 42%
Hamirpur 1.47 1.35 1.22 92%
Banda 2.20 1.67 1.45 76%
Mahoba 11.12 0.78 0.65 7%
Chitrakoot - - - -
Total 46.43 11.70 10.32 25%
Most of the expenditure which was made in construction of recharge pits was made from
Additional Central Assistance which has not yielded the desired result.

73
Cost of the Project (New Dug Wells/ Blast Wells, Renovation/Deepening of Dug
Wells, Dug Well Recharge)
The estimated cost of new dug wells varied between Rs. 2.83 lakh to Rs. 3.15 lakh, Rs. 0.83
lakh for Renovation/ deepening of old dug wells and Rs. 0.23 lakh for recharge pit. However,
a few of the structures are even found be completed below the estimated cost due to
variation in soil strata. From the sample, the average cost of creating an acre of irrigated
area worked out to be Rs. 84,250 which is far less than the major/ medium irrigation
projects. The average for creating an acre of irrigated area in different districts is presents
below.
Table 32 Cost incurred for creating an acre of irrigated area by new dug wells in UP
District N Total Cost (Rs)
Total Irrigated Area
(Acre)
Cost Per acre of Irrigated
Area
Jhansi 20 6088000 48.6 125267.48 Lalitpur 20 4280222 59.95 71396.53 Mahoba 15 3557829 50.5 70452.05 Chitrakoot 25 5078285 65.8 77177.58 Overall 80 19004336 224.85 84520.06
Impact of the Dug Wells Scheme in Uttar Pradesh
Socio Economic Profile of Sample Respondents
One hundred and twenty five beneficiaries of New Dug well/blast wells and Renovation of
Dug wells were surveyed from four Bundelkhand districts of Uttar Pradesh. The sample
distribution is given below in Table 33 below.
Table 33 Socio economic profile of sample dug well beneficiaries in UP
Particulars Jhansi Lalitpur Mahoba Chitrakoot Total/Overall
Sample 40 40 20 25 125
Average Age 47.1 50.65 50.8 57.96 50
Mean Years of Education
3.72 3.4 0.75 3.8 3.17
SC/ST 4 (10%) 6 (15%) 5 (25%) 2 (14%) 17 (14%)
OBC 34 (85%) 29 (73%) 14 (70%) 14 (56%) 91 (73%)
Others 2 (5%) 5 (13%) 1 (5%) 9 (36%) 17 (14%)
BPL 9 (23%) 11 (28%) 5 (25%) 16 (64%) 41 (33%)
APL 31 (78%) 29 (73%) 15 (75%) 9 (36%) 84 (67%)
Mean Family Size 6.85 7.65 6.7 9.8 7.67
Marginal (Upto 2.5 acre)
28 (70%) 13 (33%) 8 (40%) 15 (60%) 64 (51%)
Small (2.5 to 5 acre) 12 (30%) 26 (65%) 12 (60%) 9 (36%) 59 (47%)
Other (> 2.5 acre) 0 (0%) 1 (3%) 0 (0%) 1 (4%) 2 (2%)
Mean Land Holding 2.26 3.32 3.1 2.63 2.81
The mean beneficiary age is estimated at 50 years with approximately 3 years of schooling
which means that most of the beneficiaries have very little exposure to formal education. Of

74
all the 125 beneficiaries of New Dug wells and Renovation of dug well, 73% belongs to OBC
Category, SC/ST and Other beneficiaries were found to be 14% each respectively. With
respect to economic status, 33% were Below Poverty Line while 67% were Above Poverty
Line. The mean family size works out to be on high side with 7.67, having highest estimates
for Chitrakoot (9.8).
Most of the beneficiaries of dug well and dug well recharge were small (51%) and marginal
(47%). Only 2% of the beneficiaries were found whose land exceeded 5 acres. The overall
average land holding worked out to be 2.81 acre.
Increase in Irrigated Area- District wise
The net land holding available for agriculture among the sample beneficiaries reportedly
sum to approximately 225 acre (N=80). The status of irrigated agriculture among the sample
beneficiaries has significantly improved due to the construction of new dug well as can be
seen from the table below. The area under rainfed agriculture has remained almost the same
but improved in places like Lalitpur and Chitrakoot as many farmers have started cultivating
vegetable crops once the availability of water is ensured.
Status of Rainfed and Irrigated Agriculture after construction of Dug New Wells/Blast Wells
Table 34 Change in status of rainfed and irrigated acreage due to dug well in UP
District Net Land Holding
2010-11 2013-14
Rain-fed (Acre)
Irrigated (Acre)
Rain-fed (Acre)
Irrigated (Acre)
Jhansi 48.6 48.6 21.5 48.6 51.1
Lalitpur 59.95 48.5 40 54.5 59.45
Mahoba 50.5 50.5 37.5 35.54 40.5
Chitrakoot 65.8 28.9 27.5 35.5 54.9
Total 224.85 176.5 126.5 174.14 205.95
Irrigated to rainfed Ratio 0.717 1.18
The ratio of irrigated to rainfed agriculture has shown an impressive results among the
sample farmers. This in simple terms means that a very good proportion of land has been
converted to double cropped area due to assured supply of water. The percentage increase
in irrigated area for the sample farmers is estimated at 63%.
Cropping Pattern over the year in Kharif Season
The cropping pattern of Kharif among the sample beneficiaries of Dug Wells is presented
below. As such the cropping pattern in Kharif season has not seen a major shift except the
crops like Soybean, Paddy, Sugarcane and Vegetables.

75
Table 35 Change in cropping pattern of Kharif crops among dug well beneficiaries in UP
District Crop N 2010-11 2011-12 2012-13 2013-14
Jhansi Groundnut 20 48.6 46.1 47.6 46.1
Lalitpur Soybean 20 28.5 28.5 32 32
Black Gram 19 17.5 17.5 19 19
Green Gram 5 2.5 2.5 3.75 3.75
Mahoba Groundnut 10 15 15 14 14
Green Gram 3 4 4 4 4
Black Gram 4 6.5 6.5 5.5 5.04
Sesame 3 3 3 3 3
Sugarcane 3 3 3 5 5
Vegetable 5 - - 5 5
Chitrakoot Paddy 17 24.5 24.5 31.5 31.5
Pegion Pea 2 2.6 2.6 2.4 2.4
Vegetable 4 1.3 1.3 1.1 1.1
Cropping Pattern over year in Rabi Season
The cropping pattern in rabi season of the sample farmers is presented below.
Table 36 Change in cropping pattern of Rabi Crops among dug well beneficiaries in UP
District Crop N 2010-11 2011-12 2012-13
2013-14
Jhansi Mustard 20 21.5 21 25 24
Wheat 20 27.1 26.1 26.6 27.6
Lalitpur Wheat 20 24 24 39.95 40
Peas 17 14.5 14.5 17 17
Gram 3 1.5 1.5 2.5 2.5
Mahoba Wheat 20 10 10 30 30
Gram 8 14 14.5 3.5 3.5
Lentil 1 2 2 0 0
Peas 8 11.5 11.5 5 5
Chitrakoot Wheat 25 10.7 10.7 38.8 38.8
Gram 11 14.6 14.6 10.9 10.9
Vegetable 17 0.4 0.4 2.8 2.8
Mustard 2 0.3 0.3 0.6 0.6
Barley 2 1 1 0.5 0.5
In contrast to Kharif crops, there has been a significant shift in almost every crop, most
impressive in crops like Wheat and Vegetables. The area under crops that can be grown in
lesser water such as gram, lentils etc have decreased over time.

76
Change in Productivity of Crops
Change in Productivity of Kharif Crop (Kg/Acre)
The productivity of Kharif crop has changed due to assured irrigation through dug wells,
which is result of any additional water required during the stress period. The district wise
change is reported in Table 37 above. Overall the productivity of Kharif Crops taken most
commonly in the region like Soybean, Groundnut, Blackgram, Greengram, Paddy has shown
an improvement. Most significantly for crops like soybean, groundnut and paddy with
percentage increase by 59%, 11% and 76% relative to 2010-11 yield reported by sample
farmers. The productivity of other crops such as blackgram, greengram has estimated to be
increased by 41% and 22% respectively.
Table 37 Change in productivity of Kharif crops (Kg/Acre) among dug well beneficiaries in UP
District Crops 2010-11 2011-12 2012-13 2013-14 % change
Jhansi Groundnut 421.0 448.0 459.5 497.5 18%
Lalitput Soybean 237.7 253.9 356.2 378.5 59%
Urad 100.3 164.4 164.4 183.5 83%
Moong 32.5 37.8 57.0 65.8 103%
Mahoba Groundnut 366.7 393.3 326.7 310.0 -15%
moong 225.0 250.0 225.0 237.5 6%
Sugarcane 1140.0 1260.0 1300.0 1380.0 21%
Sesame 93.3 93.3 96.7 96.7 4%
Urad 384.6 392.3 346.2 307.7 -20%
Vegetable 0.0 0.0 966.7 966.7
Chitrakoot Paddy 582.5 701.8 989.5 1028.1 77%
Pegion Pea 387.1 387.1 387.1 387.1 0%
Potato 7500.0 6200.0 8100.0 9000.0 20%
Tomato 3000.0 3000.0 4000.0 6000.0 100%
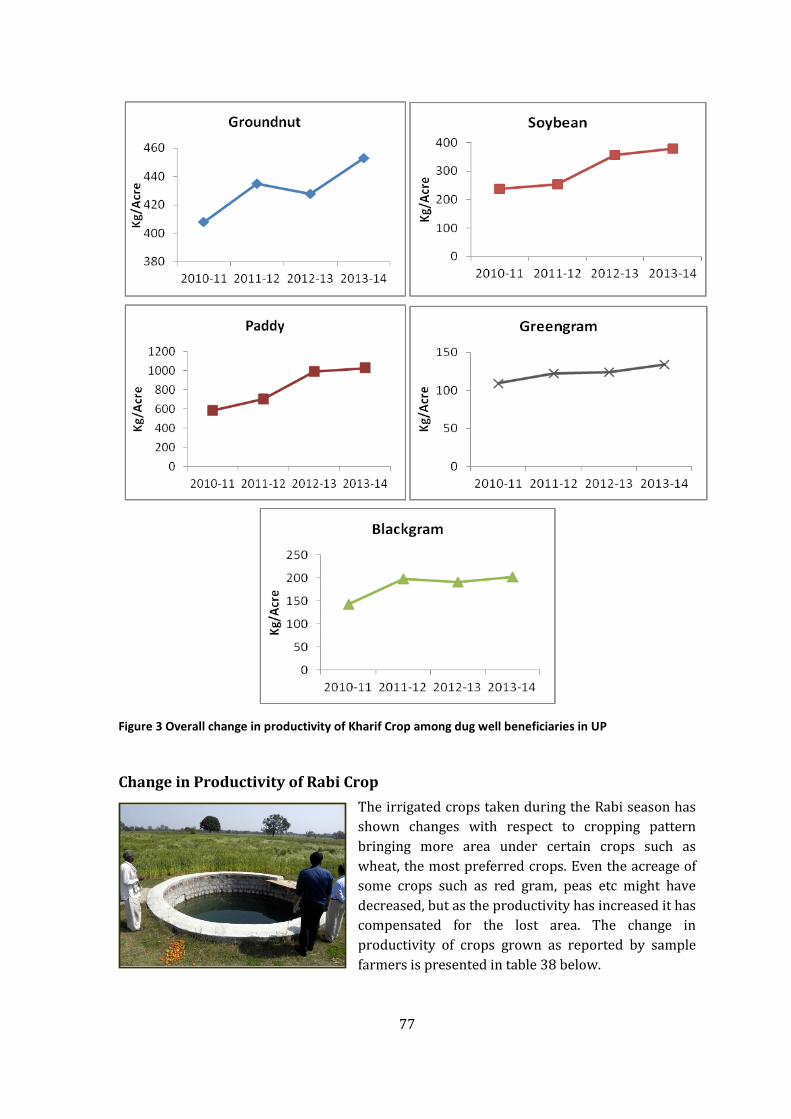
77
Change in Productivity of Rabi Crop
The irrigated crops taken during the Rabi season has
shown changes with respect to cropping pattern
bringing more area under certain crops such as
wheat, the most preferred crops. Even the acreage of
some crops such as red gram, peas etc might have
decreased, but as the productivity has increased it has
compensated for the lost area. The change in
productivity of crops grown as reported by sample
farmers is presented in table 38 below.
Figure 3 Overall change in productivity of Kharif Crop among dug well beneficiaries in UP

78
Table 38 Change of productivity of Rabi Crop (Kg/Acre) among dug well beneficiaries in UP
District Crop 2010-11 2011-12 2012-13 2013-14
Jhansi Mustard 472.1 488.4 583.7 534.9
Wheat 699.3 712.2 885.6 706.6
Lalitpur Wheat 359.8 379.4 749.3 798.6
Peas 274.9 309.2 377.9 408.0
Gram 178.8 193.8 367.5 382.5
Mahoba Wheat 355.6 371.1 807.8 771.4
Peas 590.5 552.9 480.0 520.0
Lentil 250.0 300.0 - -
Gram 504.0 512.0 246.2 442.9
Chitrakoot Wheat 507.4 507.4 759.3 813.3
Gram 525.4 533.9 678.0 745.8
Onion 16666.7 18333.3 22000.0 25555.6
Tomato 15000.0 16000.0 10700.0 10600.0
Vegetables 50000.0 55000.0 73000.0 79500.0
The overall change in productivity of crops such as wheat, gram, peas, mustard, and some
vegetable crops such as onion can be seen in figure below.
The productivity of wheat on average has increased from 445.2 Kg/Acre in 2010-11 to 778
Kg/Acre in 2013-14, which is 74% increase. Similarly, the Gram has recorded productivity of
14% increase during the same period. The other crops such as peas, mustard the estimated
productivity has increased by 20% and 13% respectively.
Since, the farmers have also changed to vegetable crops, the productivity of onion has
increased by 53% from 166 quintal to 255 quintal per acre from 2010-11 to 2013-14,
however for tomato the productivity has shown a decreasing trend.
Figure 4 Overall change in productivity of Wheat and Gram crops among dug well beneficiaries in UP

79
Change in Cropping Intensity
The impact of the Dug Wells in district wise and overall change in cropping intensity is
presented below in Table 39
Table 39 Change in cropping intensity among dug well beneficiaries in UP
District 2010-11 2011-12 2012-13 2013-14 % Point change
Jhansi 200% 192% 204% 200% 0%
Lalitpur 148% 148% 190% 190% 42%
Mahoba 137% 137% 145% 145% 8%
Chitrakoot 86% 86% 137% 137% 52%
Overall 138% 137% 167% 167% 28%
From the table above, the overall cropping intensity has increased on average from 138% in
2010-11 to 167% in the year 2013-14. Comparing the figures for 2010-11 to the recent year
2013-14, the cropping intensity among the sample beneficiaries of dug wells scheme on
average has increased by 28 percentage point. As such there is no increase in cropping
intensity among the sample beneficiaries, while a marginal increase of 8% point is observed
Figure 5 Overall Change in productivity of Mustard, peas, onion and tomato among dug well beneficiaries in
UP

80
in Mahoba. Among the four districts where the new dug well schemes has been
implemented, the farmers of Chitrakoot district has performed relatively better from other
district farmers, despite the progress on overall achievement of physical targets of dug wells
are lowest among the four districts.
Deepening of Dug Wells
Forty five beneficiaries of dug well deepening were interviewed from three districts Jhanis,
Lalitpur and Mahoba. It must be noted that the deepening of dug wells were not
implemented in the Jalaun, Hamirpur and Banda due its impracticability. The progress in
deepening is not satisfactory, as only 10% of the total targets have been met during the first
phase. Out of total 45 dug wells inspected, 60% of them were 5.00 m to 7.00 m deep, 24%
were 7.00 m to 9.00 m deep and the rest 15% were more than 9.00 m deep. The average
depth before deepening was 7.42 m which is reportedly deepened by 4 meters. The average
depth after deepening was found to be 11.63 m. No change in diameter has been done in any
of the wells. The distribution of sample deepened dug wells are presented in table 40 below.
Table 40 Percentage distribution of Deepening of dug wells with respect to depth in UP
Depth of Well Before Deepening After Deepening
No Percentage No Percentage
5.00 m - 7.00 m 27 60% 0 0%
7.00 m to 9.00 m 11 24% 6 13%
9.00 m to 11.00 m 5 11% 18 40%
11.00 m to 13.00 m 2 4% 9 20%
13.00 m to 15.00 m 0 0% 7 16%
15.00 m to 17 m 0 0% 5 11%
45 100% 45 100%
Impact of Deepening of Dug Wells on Ground Water Level
Figure 6 Impact of deepening of dug wells on water column in UP
0.00
2.00
4.00
6.00
8.00
10.00
Before Deepening
After Deepening Before Deepening
After Deepening
Water Column (Mid June) Water Column (Mid June)
1.5
8
6.6
3
3.3
5
8.9
1
0.0
8
4.0
8
4.1
5
6.6
8
1.1
2
6.1
4
0.6
2
1.1
4
0.8
6
5.4
4
3.4
0
7.0
5
Me
ter
Jhansi lalitput Mahoba Overall

81
The average water column during mid June as reported by sample farmers before the well
were deepened was 0.86 meters. After increase in depth by approximately 4.00 meters, the
retention capacity of most of the wells has improved. The average water column during mid
June after the deepening of well is reportedly 5.44 meter. During, rabi period, the average
water column during mid November before was reportedly 3.4 meter which improved to
7.05 meter.
The land which was irrigated to an extent of 40 acre, out of net cultivable area 126 acre
before deepening, due to enhanced water availability all the land is now irrigated. Additional
62 acre of land has also been reportedly brought under irrigation through sharing to
neighbours.
Figure 7 Impact of deepening of dug well on change in irrigated acreage in UP
Income from Agriculture
The household income from agriculture on average has increased from Rs. 26,589.6 to Rs.
42,636.8 after the construction of new dug wells and deepening of existing dug wells.
0 20 40 60 80
100 120 140 160 180 200
Total Cultivable Land
Land Irrigated before Deepening
Land Irrigated after deepening
Additional area brought under
irrigation
Acr
e
Rs. -
Rs. 5,000.00
Rs. 10,000.00
Rs. 15,000.00
Rs. 20,000.00
Rs. 25,000.00
Rs. 30,000.00
Rs. 35,000.00
Rs. 40,000.00
Rs. 45,000.00
HH Income (Before) HH Income (After)
Rs. 26,589.66
Rs. 42,636.84
Figure 8 Change in farm income due to enhanced water availabiltiy among dug well beneficiaries

82
HDPE Pipe Distribution
Hundred percent achievements are reported in
HDPE pipe distribution scheme in all the
Bundelkhand district of Uttar Pradesh. Against the
targeted 17751 beneficiaries to be allocated HDPE
pipes, 18000 beneficiaries are reportedly allocated
the pipes. Each beneficiary was given 600 feet (30
pipes each of 20 ft length) the cost of which varied
between Rs. 23,000 to Rs. 30,000. The pipes were
distributed by the Minor Irrigation Department
entirely on the approved budgetary allocation under ACA. No convergence or beneficiary
contributions were made by the beneficiaries of the scheme.
Though, the HDPE pipes have proven useful in reduction of
conveyance loss and wastage of water, but the selection of
beneficiary in the scheme has not been sturdy enough. Many
beneficiaries who were distributed the pipes were well enough to
buy on their own. Rather it would have been beneficial if the pipes
were distributed among the beneficiaries who have been provided
new dug well or those who are economically weaker to invest on
assets. Selection of beneficiaries may be strengthened. Due to
reduction in losses of water, during conveyance, there has been
reduction in total time required to irrigate the land. On average, there is reduction of 4 hours
for irrigating an acre of land from 10.85 hours to 6.98 hours, which is equivalent of saving at
least 4 litre of diesel amounting to Rs.200 per acre/ per irrigation.
Summing Up
The impact from the completed new dug wells and dug well deepening is quite evident due
to assured irrigation. There has been as significant change in area under irrigated
agriculture. Due to availability of water; during stress period in Kharif, the additional one or
two irrigation has been made possible resulting crop saving and enhanced productivity. The
rabi crop productivity has increased from the pre intervention period and farmers having
access to irrigation now growing gram or lentils have turned to wheat crop; from local to
high yielding variety. The distributions of HDPE pipes have reduced the wastage of water by
reduction in conveyance losses and net saving in time of irrigation. The dug well recharge as
such has not been accepted well by the farmers. The structure is not technically viable due
to heavy soil, mostly black cotton in the region. The impact of new dug wells and dug well
deepening would have multiplied further; given the achievements against the targets were
more. As per the reports and estimates, only 46% and 13% of the new and old dug wells
have been completed. The department should critically review the situation for completion
of new dug wells and renovation of older dug wells at the earliest. The recharge structures
may be dropped from the second phase of the package. The HDPE Pipe distribution system
though may be continued but the beneficiaries’ selection criteria may be strengthened.
Additional, provisioning for pump sets for new dug well beneficiaries may be included in the
package.

83
Activities in Madhya Pradesh
Energization of Kapildhara Wells through Pump Set
The Physical and Financial Achievements
Watershed Management activities in Madhya Pradesh consisted of construction of dug well,
stop dams, watershed management activities in arable land and provisioning of water lifting
devices to new dug wells which are implemented under Kapil Dhara Scheme of MGNREGA.
Total approved budget for the Watershed Management sector in MP was 1300 crore of the
total 3860 crore which 34% of the total approved budget. The allocations provisioned as
Additional Central Assistance (ACA) was Rs 210 crore of which Rs 80 crore was allocated for
energization of new dug wells, which is 4% of the total allocations of ACA of MPs share.
District wise financial and physical targets for establishment of pump sets are given in table
41 below.
Table 41 Physical and financial progress under Pump set distribution scheme of Bundelkhand Package in
MP
Districts Physical (No) Financial (Crore)
Tar
get
(No
of
Wel
ls)
Co
mp
lete
d W
ells
% (
Co
mp
lete
d v
s.
targ
et
Ach
iev
emen
t (N
o o
f P
um
ps)
% (
pu
mp
s vs
. ta
rget
ed w
ells
)
Tar
get
Ach
iev
emen
t
%
Sagar 5668 5906 104 5217 92 12.34 09.69 79
Chhatarpur 11281 9752 86 6761 60 22.56 13.48 60
Damoh 7623 7787 102 7395 97 15.25 14.46 95
Tikamgarh 7754 6684 86 6594 85 15.5 13.18 85
Panna 6474 6241 96 4789 74 13.94 08.93 64
Datia 1200 456 38 302 25 02.40 00.52 22
Total 40000 36826 92 31058 78 81.99 60.26 73
Against the total 40000 targeted wells, 36826 wells have already been constructed. The
districts like Sagar and Damoh has constructed more than the targeted wells which were
sanctioned by the district administration, hence achieving more than 100%. The progress in
Datia is relatively on the lower side as compared to progress in other districts. As can be
seen from the table above, that overall 78% of the targeted wells under the package have
been completed with the installation of pump sets. The highest achievements are observed
in districts of Damoh and Sagar where 97% and 92% of the targeted wells have been
installed with the pump sets. Out of the Rs. 81.99 crore allocations, Rs. 75.93 crore were
received and Rs. 60.26 crore have been spent towards for installing 31058 pump sets. The
average cost for installation of pumpset work out to be Rs. 19402.
Major Observations from Field Visits
The prime objective of providing lifting devices is to provide efficient and effective
management of water resource to achieve enhanced agriculture production resulting in

84
improved livelihoods impacts. The quick impact evaluation with regards to pump sets in this
study was undertaken using data sets collected from 5 districts covering 85 sample
beneficiaries who are benefitted from the scheme.
The socio economic characteristic of respondents of pump set beneficiaries is given in the
table 42.
Table 42 Socio economic profile of pump set beneficiaries in MP
Parameter Sagar Chhatarpur Damoh Tikamgarh Panna Total
Sample 15 20 15 15 20 85 Average Age (Years) 49.4 51.35 36.6 52.86 48.1 47.9 Average Education (Years) 2.3 (3.50)a
SC/ST 29 (34%) OBC 39 (46%) Others 17 (20%) BPL 71 (84%) APL 14 (16%) Marginal (Upto 2.5 acres) 30 (35%) Small (2.5 acre to 5 acres) 50 (59%) Others (> 5 acre) 5 (6%) Average Land Holding (Acre)
3.41 (1.50)a
Average family size 6.43 (2.76)a a Figure in parentheses indicates standard deviation.
Quite a good number of beneficiaries were BPL (84%) and small/ marginal category (94%).
The average land holding estimated for the sample work out to be 3.41 acre. The average
family size is large to an extent of 6 members per household.
From the list obtained, the beneficiaries reportedly received the pump sets were selected
randomly. Out of total 85 beneficiaries, 61 (71%) beneficiaries’ wells were constructed in
the year 2008-09, 2009-10 and 2010-11. Out of 85 beneficiaries 51 installed the pump sets
in the year 2010-11. Nearly 65% of the installation was of diesel pump set and rest 35%
electricity based pumps. 70% of the pumps were of 5HP and rest 30% were of 3 HP.
Characteristic of Wells & Water Availability during Different Seasons
The average dimensions of the wells constructed under Kapildhara and depth to water
levels across the six districts are presented in Table 43.

85
Table 43 Dimension of dug wells and depth to water level in MP
Parameters Sagar Chhatarpur Tikamgarh Damoh Panna Pooled Data
Average Depth of Dug well (m)
11.8 9.66 9.6 11.33 8.66 10.09
Minimum 7.0 4.5 6 7 6.5 4.5 Maximum 16 13 11 18 10.4 18 Average Diameter of Dug well (m)
6.15 4.87 6.74 5.49 6 5.81
Minimum 4.5 4 5.8 4.3 3.8 3.8 Maximum 9.09 7.25 7.1 8 8.6 9.09 Average Water Level- Mid June-BGL (m)
11.25 6.37 6.46 7.93 6.15 7.47
Minimum 6.5 4 3 6 4 3 Maximum 15 9 8 9 8 15 Average Water Level- Mid Nov-BGL (m)
6.76 3.87 4.96 6.13 4 5
Minimum 4 3 3 5 3 3 Maximum 8.5 5 9 9 6 9 Average Water Column during rabi (m)
5.06 5.78 4.83 5.22 4.66 5.12
Minimum 1.5 1 2.5 2 2.6 1 Maximum 9 8 8 12 7 12
Impact of Energization of Dug Wells
The impact of the dugwells and the pumpsets on the
cropping pattern, cropping intensity and yields is
presented in Table 44.
BENEFICIARY OF KAPILDHARA AND ENERGIZATION OF WELL IN SAGAR

86
Table 44 Impact of dug wells and pump sets on cropping pattern and yields: Aggregate of samples in MP
The area under the Kharif cropping season remains almost uniform with very
marginal change as can be seen from the table above.
The most significant change has taken place in rabi cropping. As observed from the
sample data, the area under Wheat production in particular has shown an increase
of 87% due to availability of assured irrigation. The total area under rabi cropping
has also shown an increase by 23% and 14% during 2011-12 and 2012-13.
The productivity of all the crops have increased largely due to the presence of
assured irrigation which during stress period in kharif can be utilized to give
protective irrigation when needed.
It must be noted that although the area under kharif crops has recorded marginal
decrease of 1% to 6% but the productivity has shown a significant improvement.
The highest improvements have been estimated for Paddy and Green Gram of (48-
53) % and (21-24) % respectively.
Due to assured irrigation supplemented by mechanization through pump sets, the
area under the rabi crop has also increased as evident from the rabi to kharif ratio
and increasing trend.
As per the estimates of the sample beneficiaries, the area under rabi crop has
improved from 252 acres to 313 acre and 290 acres during 2011-12 and 2012-13,
which is an increase of 15% to 24%.
The farmers have started taking HYV of wheat post intervention against the local
varieties recording increase by more than twice the previous yield. Before
Parameter 2008-09 2009-10 2011-12 2012-13 % Change
Cropping Pattern-Kharif (Acre) Soybean 74.6 74.6 73.6 73.6 -1% Green Gram 24 24 22.5 23 -(4%-6%)
Black Gram 48.95 48.95 49.45 49.45 1% Paddy 16 16 15 15 -6% Total 163.55 163.55 160.55 161.05 -2% Cropping Pattern- Rabi (Acre) Wheat 85.45 85.45 156.95 159.05 +(84%-86%) Gram 138.9 140 126.25 101.75 - (27%-9%) Lentil 28.5 28.5 27.5 27.5 -4% Mustard 0 0 2 2 Total 252.85 253.95 312.7 290.3 +(15%-24%) Productivity Kharif Crops(Kg/Acre)
Soybean 647.61 665.22 738.81 718.88 +(11%-14%) Green Gram 194.87 215.38 235.89 241.02 +(21%-24%) Black Gram 246.41 253.4 310.96 290.5 +(18%-26%) Paddy 417.38 421.73 639.13 617.39 +(48%-53%) Productivity Rabi Crops (Kg/Acre)
Wheat 572.56 599.97 1326.13 1310.23 +(129%-132%) Gram 353.71 374.5 394.06 387.20 +(9%-11%) Lentil 161.67 175.83 180.83 187.50 +(12%-16%) Cropping Intensity 143% 144% 163% 155% +(12%-20%) Rabi to Kharif Ratio 1.5:1 1.55:1 1.94:1 1.80:1

87
interventions, the yield reported by the farmers harvested 550 to 600 kg/acre on
average which has gone upto 1300kg/acre.
The yield of other rabi crops such as gram, lentil has also recorded increase as can be
seen from the table above.
Figure 9 Overall change in productivity of Kharif and Rabi Crops due to dug wells and pump set in MP

88
Summing up
The programme of installation of pump sets on Kapildhara wells has progressed
satisfactorily despite the fact that the wells have to be constructed from MNREGA funds.
This was possible due to the close coordination between the district administration and the
implementing department. The benefits accruing to the farmers are also significant. On the
aggregate, all the 40000 wells when completed would increase the rabi irrigated area by
about 20000 acres besides providing protective irrigation to crops in kharif season. The
productivity increases augurs well for food security of the farm families.

89
Stop Dams in Madhya Pradesh
The Allocations and Financial Achievements
Stop dams are constructed under the Bundelkhand package in the state of Madhya Pradesh.
The allocations to this activity in MP are presented in Table 45.
Table 45 ACA allocation in Stop Dams under Bundelkhand Package in MP
State Allocation to stop dams
(Rs crore)
Total allocation under the package
(Rs crore)
% allocation to stop dams
Madhya Pradesh 132.48 1958.14 6.63
The projects under this sector are intended to enhance the irrigation facilities and the water
tables in the ground water structures. As against the above allocations, the releases so far
and the expenditure incurred by the respective states are given in Table 46.
Table 46 Allocation, release and expenditure in stop dams under Bundelkhand Package in MP
State Allocation to stop dams
(Rs Crore)
Releases under the package
(Rs. Crore)
Actual expenditure
incurred (Rs. Crore)
% of
expenditure to releases
% of
expenditure to
allocations
Madhya Pradesh 132.48 90 76.99 85.54 58.11
Overall Physical Progress
The status of progress of these projects in the Bundelkhand region is presented as under:
Table 47 Physical progress and financial expenditure of Stop Dam in MP under Bundelkhand Package
District ACA Allocation (Rs. Crore)
Number of Projects Expenditure (Rs. Crore) Total Not
Started In
Progress Completed
Sagar 40.17 84 0 31 53 23.49 Damoh 18.55 53 0 3 50 15.72 Panna 15.78 35 0 19 16 9.87 Chhatarpur 25.43 86 05 19 62 13.93 Tikamgarh 20.88 66 03 31 32 9.31 Datia 16.67 28 0 23 05 4.67 Total 132.48 352 8 126 218 76.99
It could be seen that the stop dams programme is one of the few activities in Madhya
Pradesh, which is not progressing satisfactorily. Out of a total of 352 projects to be
implemented only 218 projects have been completed. Eight projects are yet to be started.
Inaccessibility of the sites is reported to be one of the reasons for slow progress.

90
Major Observations from Field Visits
As a part of the evaluation study, 30 out of 344
projects implemented under the package in MP
were visited in four districts where the numbers
of projects are more. Since, the numbers of
projects are low in Panna and Datia; these two
districts were not covered. The sample projects
for site visits and FGDs were selected based on
the highest fund allocations. The district wise
number of projects visited is given in Table 48.
Table 48 Sample stop dams visited and cost structure
Sl District No. of Sample Projects Visited
No of completed
projects
Cost of Project estimate
(Rs. Lakh)
Expenditure actually incurred
(Rs. Lakh)
1 Chhatarpur 8 8 208.67 142.63
2 Damoh 7 7 515.56 442.77
3 Sagar 7 6 367.05 324.12
4 Tikamgarh 8 7 276.25 244.5
TOTAL 30 28 1367.53 1154.02
The consolidated field level observations are given as under:
Out of 30 sample projects, eight were implemented by Panchayat Raj department
while 21 were implemented by Rural Engineering Services department. The lone
barrage cum stop dam project was implemented by Water Resources Department.
Out of 30 projects visited, 28 are found to be completed while Stop Dam at Sajli in
Sagar and stop dam cum causeway at Pathaghat in Tikamgarh is yet to be completed.
The earth work and CC work are completed in all respect but miscellaneous work
related to the safety of the dam structure is to be completed. The remaining work to
an extent of 50% and 25% is left to be completed.
All the projects were implemented in government land; hence there were no
problem faced in acquiring the land for the construction of the stop dams.
All projects were awarded to contractors through open tender system.
The cost of project varied from a minimum of Rs 19.90 lakh to a maximum of Rs 85
lakh depending upon the number of stop dams constructed under each project and
the corresponding physical dimensions. The barrage cum stop dams project costed
Rs 338 lakh.
Total cost allocated for 30 sample projects was Rs. 13.67 crore of which Rs. 11.54
crore was actually spent on work, which is 84% of the total allocations. The
allocations were made entirely from Addition Central Assistance. No convergence
was reported by the department, either from State/Central CSS/ MGNREGA Scheme.
Consulting agencies were roped in for preparation of DPR, supervision and quality
control due to shortage of manpower with Rural Engineering Services. However,
during the site inspection and field survey by technical staffs a few of the critical

91
observations were made with regards to design of the structure. For example as the
stop dam located at Harpura village in Tikamgar, the entire right embankment was
washed away in the very first rain. The RES has extended the length arbitrarily
without any protective measures. The finishing of the concrete work was not found
upto the mark in terms of line and level. The design provided by the consultant was
generally faulty.
Delay in completion (months) No. of projects
Within the time 10
Delay of 6 months 3
Delay of 6-12 months 4
Delay of 12-24 months 8
Delay of > 24 months 3
Incomplete 2
Total 30
Of the total 30 sample projects, only 10 (33%) projects were found to be completed
on time while there was considerable delay (more than one year) for 13 projects.
Two of the projects are still in progress and the portions related to the protection of
stop dam are yet to be completed.
Impact of Stop Dams
Table 49 Number of stop dams and household benefitted from Stop Dams under Bundelkhand Special
Package in MP
Sl District No. of Projects
No of Stop Dams on Nala
No of HH Benefitted
Before Package
After Package
Before Package
After Package
1 Chhatarpur 8 26 36 530 710
2 Damoh 7 0 11 0 472
3 Sagar 7 3 11 27 211
4 Tikamgar 8 15 23 273 515
TOTAL 30 44 81 830 1908
Out of 30 SD project sites visited, the
number of SD on the existing nalla has
almost doubled due to package
intervention. The household benefitted as
a result of construction of SD exceeded
from 830 to 1908. Hence, additional 1078
HH are benefitted from the construction
of SDs in the sample projects.
Estimating the data of the number of
household benefitted from the sample to
the total number of completed SD
projects (218) in Madhya Pradesh, at 95% confidence interval, it would be in 10852
to 14175.

92
Table 50 Impact of stop dams on water storage, irrigated area and water level in nearby dug wells
Sl District No Storage Capacity (Mcum)
Area Irrigated during Rabi (Ha)
Average Water Level (BGL)
Before Package
After Package
Before Package
After Package
Before Package
After Package
1 Chhatarpur 8 787480 942000 520 720 8.31 8
2 Damoh 7 0 1486440 120 685.96 4.5 2
3 Sagar 7 120000 200455 86 436.5 6.85 3.07
4 Tikamgar 8 0 245800 0 624 11 5
TOTAL 30 907480 2874695 726 2466.46 7.66 4.51
The increased storage capacity due to creation of SDs aggregated 19.67 lakh Mcum
recording an increase of 216% of the pre project storage capacity.
The incremental irrigated area due to these projects aggregated 1740.46 hectares; at
the total ACA allocation of Rs 1367.53 lakh. The marginal cost of creating additional
hectare of irrigated area worked out to Rs. 78,572.
Focussed Group Discussions with farmers
revealed that they could cultivate vegetable
crops in kharif in addition to soya bean, while
in Rabi they introduced HYV of wheat in place
of local variety buoyed by the assured
irrigation facility.
A significant increase in water level has been
reported by the farmers of the sampled
project from all the districts. The water level
increased considerably in Damoh, Sagar and
Tikamgarh by almost 50% due to creation of
water storage. The least recharge is reported in Chhatarpur. On average, the ground
water level increased by 3.15 meter from 7.66 meter to 4.51 meter.
Estimating the data for the total irrigated area from the sample to the total number
of completed SD projects (218) in Madhya Pradesh, at 95% confidence interval, the
irrigated area would have increased in between 12384 ha to 14929 ha.
Once all the 352 stop dams projects are completed, an additional irrigated
area of about 16000 ha would be created in rabi season which would
invariably devoted to wheat. The additional production of wheat in MP due to
stop dams would be 45000 MT.

93
Chapter 5 Agriculture Markets
Financial Allocations and Progress
Storage Godown and Agriculture Markets are an integral part of the Special Bundelkhand
Package as the projects under this sector are intended to enhance the marketing facilities
and post harvest structures especially storage structures towards meeting the requirements
of increased production of agricultural crops consequent upon creation of additional
irrigation potentials and improved soil moisture regime under the Bundelkhand package
As per the estimated need, In Madhya Pradesh, the implemented projects are expected to
create an additional storage capacity of 6.40
lakh MT. Besides, other vital facilities such as
auction platforms, internal roads within the
mandi area, farmer’s facilitation centres,
trader’s facilitation centres, etc are also
expected to rise. MP State Warehousing and
Logistics Corporation Ltd, MP State Mandi
Board and MARKFED have implemented these
projects in Madhya Pradesh.
In Uttar Pradesh, the package envisaged
construction of 7 Specialised mandi yards at the seven district head quarters of the 7
districts of Bundelkhand region in UP and 168 Rural Infrastructure Nuclei at sub district
level.
The allocations to this activity in MP and UP are presented in Table 51
Table 51 Allocation to Agriculture Market Yards, Godown Project under Bundelkhand Package
State Allocation to market yards and
godowns (Rs crore)
Total allocation under the package
(Rs crore)
% allocation to MY and Storage
Godown
Madhya Pradesh 574.50 1958.14 29.33 Uttar Pradesh 693.50 1696.00 40.83 Bundelkhand region 1268.00 3654.14 34.70
Of the total allocations for this sector, an estimated 40% was towards creation of additional
storage capacity and the balance was towards erection of auction platforms, construction of

94
internal roads within the mandi area, farmers’ facilitation centres, trader’s facilitation
centres and other supporting infrastructure.
As against the above allocations, the releases so far and the expenditure incurred by the
respective states are given in Table 52.
Table 52 Financial achievements under Storage and Market Yards projects
State Allocation to market yards and godowns
Releases under the package
Actual expenditure
incurred
% received of allocated
% spent of received
Madhya Pradesh 574.50 573.64 412.65 99.9% 71.9% Uttar Pradesh 693.50 320.00 320.00 46.1% 100.0% Bundelkhand region 1268.00 893.64 732.65 70.5% 82.0%
Madhya Pradesh received 99.9% of its allocated share and has utilised 71.9% of the amount
received. Uttar Pradesh only received 46.1% of its allocated share, and has spent the
complete sum. Less than 50% release to UP was on account of considerable delays in
initiating the implementation of the projects by the concerned departments.
Physical Progress
This section provides a detail of the infrastructure
created under the package. A district wise list of
complete executed projects is available in this
section.
The following is the physical progress of projects
implemented in Madhya Pradesh.
Table 53 Physical progress of Storage and Market Yard
Projects in MP
Madhya Pradesh
Districts Construction of warehouse & marketing infrastructure facility
Development of mini markets run by PACs
Total Completed Percentage Total Completed Percentage
Chatarpur 12 08 66% 06 02 33% Tikamgarh 13 11 84% 05 05 100% Panaa 7 00 - 03 02 66% Datia 7 04 57% 04 01 25% Damoh 12 12 100% 03 02 66% Sagar 15 13 86% 08 05 62.5% Total 67 48 71% 27 17 62%
All the projects implemented by the respective government
have not been completed, however a decent progress was
observed in case of Madhya Pradesh. 71% of the projects
implemented under the head “Construction of warehouse &
marketing infrastructure facility” were found to be
completed whereas 62% of the projects implemented under

95
the head “Development of mini markets run by PACs” were found to be completed.
Few of the projects have already started functioning. Storage godown created under the
package was used by MARKFED and FCI to store the wheat that had been procured during
the month of May 2014. The physical progress was quite satisfactory as compared to the
progress in UP where only a few of the projects have been completed and none of them are
functioning. The following is the progress in UP.
Table 54 Physical Progress under Market Yards and Storage Projects in UP
Uttar Pradesh
Districts Rural Infrastructure Nuclei Special Market Yard Total Completed Status Total Completed Status
Jhansi 25 0 No RIN has been completed. Work
completing ranged in between 10% to 90%
1 0 Work not yet started
Jalaun 21 0 No RIN has been completed. Work
completing ranged in between 30% to 80%
1 0 25%
Lalitpur 22 12 Work has been completed in 12 RINs but no trade has taken
place. For the rest of the project work completed ranged in between 60%
to 90%
1 0 30%
Mahoba 10 0 No RIN has been completed. Work
completing ranged in between 35% to 80%
1 0 35%
Hamirpur 24 8 Work has been completed in 8 RINs but no trade has taken place. Two projects have been
permanently stopped due to land dispute. For
the rest of the project work completed ranged in between 60% to 90%
1 0 38%
Chitarkoot 16 0 No RIN has been completed. Work
completing ranged in between 5% to 80%
0 0 -
Banda 20 0 No RIN has been completed. Work
completing ranged in between 5% to 85%
1 0 20%
Total 138 20 6 0

96
A considerable delay in the construction work was observed in all the districts of Uttar
Pradesh. Deadlines were missed by most of the contractors to whom the work was assigned
through an open tender process. Of the total, only 14.4% projects were completed in case of
RIN. Special Mandi Yard in UP have been sanctioned late and therefore, the projects still
have a decent time left for completion.
Sample Visit & Major Observations during field visits: Madhya Pradesh
As a part of the evaluation study, 20 out of 94 projects implemented under the package in
MP were visited. The following table showcase the breakup of the sample visited district
wise-
Table 55 Sample Market Yards/ Storage Projects visited in MP
District Total projects
Sample Visited
Names of the location/ Project
Chattarpur 18 4 (i) Chandala (ii) Nawgaon (iii) Bamitha (iv) Chatarpur Mandi
Damoh 15 3 (i) Killai (ii) Jabera (iii) Tendukheda Datia 11 3 (i) Dati Market (ii) Basai (iii) Sewada HAAT bazaar Sagar 23 3 (i)Sagar MY (ii) Banda MY (iii) Berhana godown Tikamgarh 17 4 (i)Tikamgarh Mandi ii)Kundeshwar HAAT bazaar
(iii)Shivpuri PAACS (iv)Badora Ghat warehouse
Panaa 10 3 (i) Brijpur HAAT Bazaar (ii) Badagaon Mini Agriculture Market (iii) Raipura warehouse
Total 94 20 -
A satisfactory progress was observed in the progress made at the field level. The following
are the major observation from the field visit-
i. The facilities constructed under the package would be widely used by state
warehousing corporation (SWC). Currently, SWC hires warehouses from private
players
ii. Work under Development of mini markets run by PACS is still under construction
phase in Chattarpur & Panaa. It is expected to be over by August 2014
iii. At Sagar Mandi, one area of concern is the absence of boundary wall in the market
yards leading to poor maintenance and trespassing by animals and anti social
elements
iv. In Panna, MARKFED has completed the construction of godowns, however no hand
over support to PACS have been made. The authorities are yet to take a final decision
on the hand over support
v. The storage godowns on completion need to be accredited and registered with
WDRA so as to provide the benefit of NWR facility to the farmers in the area
Sample Visit & Major Observations during field visits: Uttar Pradesh
As a part of the evaluation study, 25 out of 144 projects implemented under the package in
UP were visited. The following table showcase the breakup of the sample visited district
wise-

97
Table 56 Sample projects of Market Yards/ Rural Infrastructure Nuclei visited in UP
District Total projects
Sample project visited
Names of the location/ Project
Jhansi 26 3 (i) Sakraar RIN (ii) Bhandara RIN (iii) Maanpur RIN
Jalaon 22 4 (i)Special Market Yard (ii) Redar RIN (iii) Kanjausa RIN (iv) Parasan RIN
Lalitpur 23 3 (i)Special Market Yard (ii)Lakhanpura RIN (iii)Targuana RIN
Chitarkoot 16 4 (i) Pahaadi RIN (ii) Hardauri RIN (iii) Biharva RIN (iv) Cheebo RIN
Hamirpur 25 4 (i) Special Market Yard (ii) Rivan RIN (iii) Echauri RIN (iv) Mundera RIN
Banda 21 4 (i)Special Market Yard (ii) Murval RIN (iii)Badokhar RIN (iv)Motiyaari RIN
Mahoba 11 3 (i)Special Market Yard (ii) Bamrara RIN (iii) Bharvara RIN
Total 144 25
The following are the major observation from the field visit-
i. Tenders for construction of RIN have been awarded through open tenders.
ii. In Jhansi, Hamirpur & Lalitpur, two godown of
500 MT were sanctioned in RIN (Rural
Infrastructure Nuclei) as per the project
documents. However, in most of the cases, a
RIN had only one 500 MT godown. The amount
allocated for the second godown has been used
to create boundary wall around the RIN.
iii. In Hamirpur, construction of two RIN has been
permanently discontinued due to a land
dispute.
iv. Details of works with respect to estimated cost, date of start, likely date of
completion, name, phone and address of the contractor were not displayed at all the
RIN.
v. On a FGD conducted on group of farmers & traders at present Mandi, it was observed
that there were concerns about remoteness and proper utilization of infrastructure
in some cases
vi. It was observed that no proper coordination and understanding is arrived amongst
the stakeholders with regard to utilization of the infrastructure being created in RIN.
Besides, RINs with improper connectivity in UP are going to be a challenge for the
Market Committees.
vii. The major concern is whether there will be adequate commodity arrivals in the 137
RINs created under the package in UP. The utility of these huge infrastructure being
created in rural areas will solely depend on the increase in agricultural production
in the area with the limited water resources available in the region

98
viii. A significant delay in the progress of construction work was observed in all the
districts of UP. The following are some of the reasons cited for the considerable
delay-
a. Soil in Bundelkhand region of UP are porous in nature i.e. they hold the
water for a longer period of time thus hampering the construction activity.
Rains in winter were cited as the main reason for delay in the work in
construction of physical structures.
b. The district of Hamirpur has shown the least progress as compared to other
6 districts of UP. Issue with administrative approval was cited as the main
cause for the delay. The parishad headquarter had banned the construction
of godowns in RIN, thereby hampering the work in progress. The order was
reverted on 17/08/13 and thus there has been a considerable delay.
c. In Chitarkoot & Mahoba, the rate approved as per the administrative
approval was less and no contractor was ready to take the work. A new
revised rate was designed and a fresh advertisement was made leading to
the delay.
d. In case of Special Market Yard, the work has been hampered due to land
dispute
Impact of Market Yards and Godowns projects
Most of the projects implemented were under the construction phase and therefore it was
difficult to calculate its impact on the beneficiaries. However, after the field visit and FGD’s
with local farmers & potential beneficiaries, a likely impact could be analysed which is
provided here in this section.
The following table illustrates the likely storage capacity that would is expected to
be created-
Table 57 Storage Capacity created under the package in UP and MP
Godown/Warehouse Capacity under the package ( In MT)
Uttar Pradesh Madhya Pradesh S.No District Storage capacity District Storage capacity 1 Jhansi 17500 Sagar 237100 2 Jalaon 15500 Damoh 51050 3 Lalitpur 16000 Chhatarpur 115850 4 Chitarkoot 10000 Panaa 53500 5 Hamirpur 17000 Tikamgarh 130950 6 Banda 13000 Datia 52000 7 Mahoba 15000 - - 8 Total 104000 640450
A total of 104000 MT of storage is likely to be created in Uttar Pradesh after completing of
work under RIN & Special Market Yard whereas 640450 MT of storage capacity is likely to
be created after the construction of envisaged infrastructure is completed in MP. The new
capacity should be bliss for the government of both the states as it would help them to store
their procured produce and also the farmers who would be able to store their produce

99
rather than go for a distress sale. The following now is the other likely impact of the
program-
i. Increase in the storage capacity in
Madhya Pradesh would lead to better
storage of procured grains. Godowns
created are used by FCI & MARKFED to
store wheat which are being procured
in May 2014.
ii. Newly constructed trading platform at
HAAT bazaar in MP has derived
considerable satisfaction from the
locals. Further, Godown created at the HAAT bazaar would help the local traders to
minimize distress sale which is a common phenomenon at present.
iii. Infrastructure created under PACCS would help the farmer receive assistance under
a single window. This would be a positive support for the co-operative members.
iv. In Uttar Pradesh, RIN is likely to minimize the transportation cost as well as time for
the farmers. Few RINs with good connectivity have shown a positive performance
with all the shops being sold before the start of the formal trading.
v. RIN again is an excellent initiative for a single window availability of requisite inputs
for the farmers. It is definitely going to boost good agriculture practices (GAP)
among the local farmers.
Recommendation
i. The storage godowns on completion need to be accredited and registered with
WDRA so as to provide the benefit of NWR facility to the farmers in the area.
ii. In the future for construction tenders, E tendering mode should only be used. It was
learnt that the work done on the field by contractors selected through E tendering
was more efficient than that selected through open tendering.
iii. Schemes which are large in nature and has a significant importance from the centre
point of view should always be made in consultation with district administration of
the area where projects are implemented. In parts of UP, it was observed that there
was a significant delay in the work done as the district administration did not
understand the need of creation infrastructure under the RIN.
iv. There is an immediate need to analyse a way through for the RIN who are not well
connected. If the issue is not tackled, these RINs are going to be a failure.
v. In Madhya Pradesh, there is a need to initiate the hand over procedures of the
infrastructure created under PAACs. It was observed that many of the godowns
structure sanctioned under PAACs project were completed; however there was no
hand over. The infrastructure was either lying idle or was made informally into use
from the orders of district collectors. A hand over support will result in proper
maintenance and sustainability of the infrastructure created.
vi. In case of almost all the RINs, the complex is barren with buildings. In view of
availability of adequate land, plantation of trees and plants may be considered in the
complex.

100
Chapter 6 Animal Husbandry
The Allocation and Financial Achievements
Animal Husbandry activity taken up during the Phase-I of the package was visited
comprehensively in districts of both the states. Animal Husbandry sector accounted for
about 2% of the total ACA budget allocated to Bundelkhand region. The allocations to this
activity is presented in Table 58
Table 58 Allocation in Animal Husbandry Project under Bundelkhand Package
State Allocated to Dairy Sector
Total Allocation under the Package
% Allocation to Dairy
Madhya Pradesh 39.40 1958.14 2.0%
Uttar Pradesh 33.96 1695.76 2.0%
Bundelkhand region 73.36 3653.9 2.0%
Out of total allocation of Rs. 73.36 crore, the allocation made to Madhya Pradesh and Uttar
Pradesh was Rs. 39.40 crore and Rs. 33.96 crore respectively. The projects under this sector
are intended improve the livelihoods through distribution of goatry units, improve
breed/progeny through natural breeding process using improved breed of buffalo and
artificial insemination process, strengthening infrastructure support by creating fodder
bank to meet fodder demand during scarce period, and create awareness against the
prevailing Anna Pratha in the Bundelkhand Region. Additionally Mobile Health/AI Centres
were also proposed and created in UP. Renovation/ Strengthening of Veterinary Hospitals in
UP was also proposed. As against the allocation, 100% releases were made and 100%
expenses are reportedly made by the Department in MP. In UP, against the allocation of Rs
33.96 crore, Rs. 28.56 crore was released of which Rs. 22.10 crore was reportedly utilized.
The allocation, release and expenditure are presented in the Table 59.
Table 59 Allocation, release and expenditure in Animal Husbandry Sector under Bundelkhand Package
State Allocated to Animal
Husbandry Sector
Release under the Package
Actual Expenditure
% of expenditure
to release
% of expenditure to allocation
Madhya Pradesh 39.40 39.40 39.40 100% 100%
Uttar Pradesh 33.96 28.56 22.10 77% 65%
Bundelkhand region
73.36 67.96 61.50 90% 84%

101
Brief Outline of Animal Husbandry Projects
In Madhya Pradesh, under the AH Sector, the package
extended support for distribution of goats and
Murrah buffalo to individual farmers, establishment
of Artificial Insemination Centres in Collaboration
with NGO (BAIF), establishment of fodder banks, goat
sheds.
In Uttar Pradesh, additional activities of
strengthening infrastructure of existing Veterinary
Hospitals, organize camps for awareness against the
Anna Pratha, and establishment of Mobile Health/AI
Services were supported by the package.
Overall Physical Progress
The status of progress of the dairy projects in the Bundelkhand region is presented as under:
Table 60 Overall physical progress of activities under taken in Animal Husbandry section in UP & MP
under Bundelkhand Package
Activity Unit Madhya Pradesh Uttar Pradesh
Target Achievement % Target Achievement % Distribution of Murrah Buffalo Bull
No. 2403 1723 72% 508 501 99%
Distribution of Goatry Units
No. 5296 3421 65% 2560 2450 96%
Establishment of Fodder Banks
No. 3 3 100% 410 417 102%
Establishment of goat sheds
No. 1 1 100% NA NA NA
Establishment of AI Centers
No. 110 110 100% 120 120 100%
Establishment of Mobile Health Units/ AI Centers
No. NA NA NA 24 24 100%
Modernization of existing Veterinary Hospitals
No. NA NA NA 58 57 98%
Awareness camps against Anna Pratha
No. NA NA NA 4608 4414 96%
i. In MP, 72% of the targeted murrah buffaloes were distributed while the 99% have
been distributed in Uttar Pradesh. Similarly, 96% of the targeted goats have have
been distributed in Uttar Pradesh, while 65% have been distributed in Madhya
Pradesh.
ii. Three fodder banks each in MP and UP have been undertaken. In Madhya Pradesh,
the fodder banks have been constructed in Sagar, Tikamgarh and Panna. In UP the
fodder banks and fodder block makers are constructed/ installed in Jhansi, Jalaun
and Lalitpur. The capacity of each fodder bank is 3000 quintals. All the civil work in

102
MP has reportedly been completed as on the date of visit and operations have also
started. In contrast the civil work of all the fodder stations in UP has been completed
however not yet operational. The fodder block machine has been installed in all the
three centres.
iii. All the AI Centres which is to be operated by BAIF have been set up covering all the
districts falling under Bundelkhand region. A total of 230 centres have been set up in
13 districts of Bundelkhand region from the package.
iv. One room and a meeting hall were proposed to be constructed from the package in
all the veterinary hospitals of all the districts of UP. As per the report, 57 out of 58
structures are constructed from the package. More than 50% of these structures
were found to be incomplete. As in nearly all the districts 1-2 sites were visited and
most of them were incomplete with respect fixtures and fittings, installations of
water supply etc.
Distribution of Goat Units
Goat unit consisting of 10 female goats and one ram of age ranging between 6 months to 18
months were distributed to beneficiaries. The beneficiaries were selected based on the
criteria such as BPL, Landless, Widow etc. The consultations with the Gram Pradhan were
done before distribution of goat units. The cost of each unit (10+1) in Uttar Pradesh
includes the cost of animals (Rs. 35000), insurance cost, ration for 03 months, medicine cost
which accounts to Rs. 43,939 per unit. For MP, the
unit cost account to Rs. 41628 per unit. In MP,
margin money of 20% and 25% of the total cost
of unit were taken from the beneficiaries while in
UP no such provision was made. The concept of
margin money in MP has helped in filtering the
non eligible and non interested beneficiaries but
since no such provision was made in UP, a
significant number of beneficiaries have sold out
the goat units after receiving it from the
department. A sample of 70 units of goatry from
UP and 30 units from MP were selected randomly to study the impact of the activity on the
livelihoods of beneficiaries. The beneficiary’s socio economic profile is presented below in
Table 61 and findings on relative performance of goat distribution among the beneficiaries
of two states are presented in table 62

103
Table 61 Socio economic profile of goatry beneficiaries
Particulars Unit Madhya Pradesh Uttar Pradesh
Sample to be covered No. 30 70
Responses received No. 30 58
Category wise participation
SC/ST No / (%) 7 (23%) 33 (57%)
OBC No / (%) 21 (70%) 23 (40%)
Other No/ (%) 2 (7%) 2 (3%)
APL No/ (%) 5 (17%) 9 (16%)
BPL No/ (%) 25 (83%) 49 (84%)
Status of Beneficiaries
Farmers No/ (%) 18 (60%) 41 (71%)
Landless/Ag. Labour No/ (%) 12 (40%) 17 (29%)
i. Out of 30 goatry sample beneficiaries in MP, 23% belonged to SC/ST category while
70% belonged to OBC category. Nearly 83% of the beneficiaries belonged to BPL
category and 40% were found to be agriculture labour having no land for
agriculture. The rest 60% were marginal and small farmers. No large farmers were
found in the sample.
ii. Out of 58 goatry sample beneficiaries in UP, 57% belonged to SC/ST category while
40% belonged to OBC category. Nearly 84% of the beneficiaries belonged to BPL
category and 29% were found to be agriculture labour having no land for
agriculture. The rest 71% were marginal and small farmers. No large farmers were
found in the sample.
Table 62 Status of goatry units and impact on income of sample beneficiaries
Particulars Unit
Adult Goats Kid Total
Madhya Pradesh
M F T M F T M F T
Total Distribution No. 30 300 330 0 0 0 30 300 330
Kidding No. 0 0 0 97 144 241 97 144 241
Morality No. 2 17 19 6 14 20 8 31 39
Sold No. 178 0 0 0 0 0 0
Animals as on the date of visit No. 23 297 320 91 130 221 114 427 541
Average Income generated through sales
Rs. Rs. 16323
Uttar Pradesh
Total Distribution No. 58 580 638 0 0 0 58 580 638
Kidding No. 0 0 0 84 114 198 84 114 198
Morality No. 32 245 277 0 0 0 32 245 277
Sold No. 130 0 0 0 0 0 130
Animals as on the date of visit No. 44 317 361 84 114 198 128 431 559
Average Income generated through sales
Rs. Rs. 9245
M= Male, F= Female, T=Total

104
i. From the sample surveyed in MP, it is found that all the beneficiaries were having
goat units as given by the department and responded positively with regards to the
impact on the livelihoods. The age of goats at the time of distribution as reported by
the beneficiaries range in between 01 to 1.5 years.
ii. In contrast, out of 70 targeted sample beneficiaries, only 58 beneficiaries could be
contacted during the field visits. Out of the 12 beneficiaries in Chitrakoot, 01 of the
beneficiary was found to have goats while the rest reported mortality or later on
sold whichever survived.
iii. In Madhya Pradesh, from the sample surveyed, it is found that as on the date of visit,
the total number of animal have increased over the period. 144 kids were reportedly
born from 300 female goats. 30 beneficiaries reported selling of 178 goats either
born or from the older stocks received.
iv. In UP the total number of goats have were found to be 559 against the total
distribution of 638 goats among the
sample beneficiaries. 198 kids were
reportedly born from the units
given to the sample beneficiaries
and 130 goats were sold by the
sample beneficiaries.
v. The mortality of goats remained
well controlled to less than 10% in
Madhya Pradesh while in UP, it is
estimated from the sample that
mortality has accounted to extent of 43 %.
vi. The reasons for high mortality of goats in UP as reported by the beneficiaries is
sudden outbreak of diseases (dysentery) as reported by the beneficiaries. Also, the
beneficiaries reported poor quality of animal when supplied. Further, discussions
with several other stakeholders also brought out reasons such as insufficient
quarantine practices were followed at the department level which has resulted in
high mortality. The non suitability of Barbari breed in the climatic condition may be
another reason for high mortality.
vii. The sample beneficiaries from MP have earned income of Rs. 16323 on an average
while in UP, the average net income is Rs. 9425.
Performance of Breed Improvement Activities
Two activities were incepted under the first phase of
Bundelkhand Package for improving the locally available
breed. BAIF (NGO) was drawn into the services for
providing artificial insemination services and second by
inducted improved Murrah Buffalo in every Gram
Panchayat for providing natural breeding services to the
farmers in the village. A total 230 AI centres were opened
covering all the district of Bundelkhand region (110 in MP
and 120 in UP) within three months of the award of work.
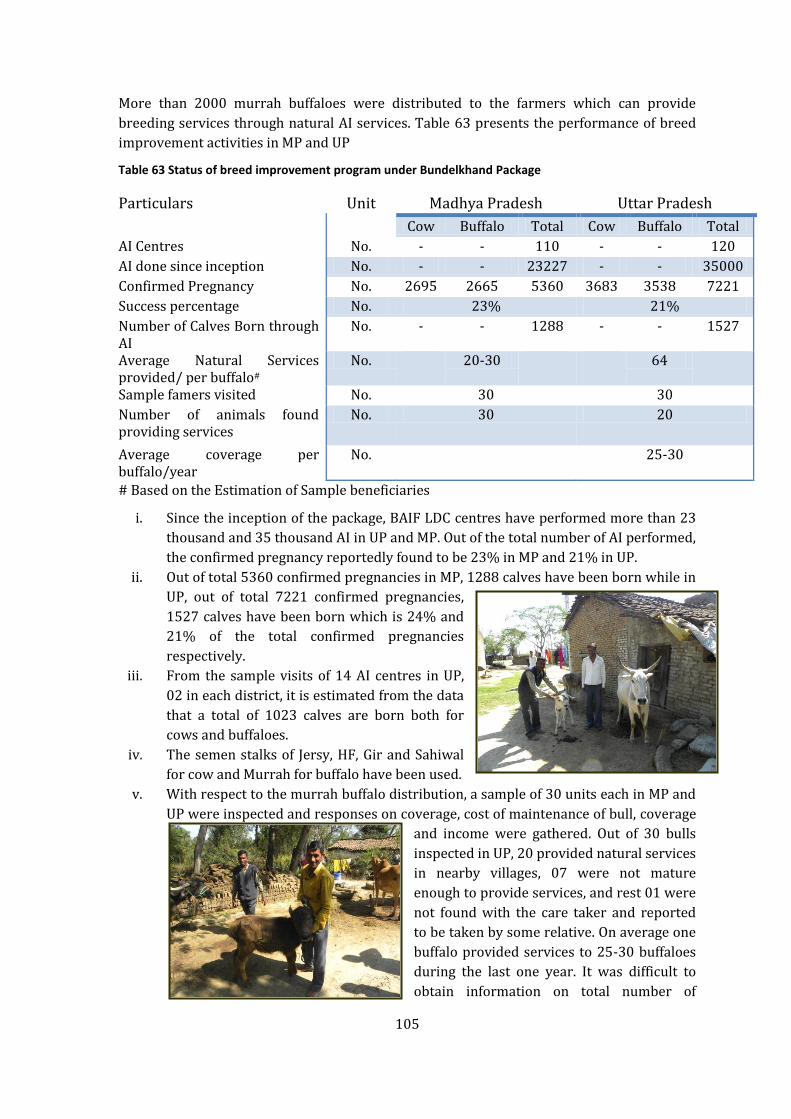
105
More than 2000 murrah buffaloes were distributed to the farmers which can provide
breeding services through natural AI services. Table 63 presents the performance of breed
improvement activities in MP and UP
Table 63 Status of breed improvement program under Bundelkhand Package
Particulars Unit Madhya Pradesh Uttar Pradesh
Cow Buffalo Total Cow Buffalo Total
AI Centres No. - - 110 - - 120
AI done since inception No. - - 23227 - - 35000
Confirmed Pregnancy No. 2695 2665 5360 3683 3538 7221
Success percentage No. 23% 21%
Number of Calves Born through AI
No. - - 1288 - - 1527
Average Natural Services provided/ per buffalo#
No. 20-30 64
Sample famers visited No. 30 30
Number of animals found providing services
No. 30 20
Average coverage per buffalo/year
No. 25-30
# Based on the Estimation of Sample beneficiaries
i. Since the inception of the package, BAIF LDC centres have performed more than 23
thousand and 35 thousand AI in UP and MP. Out of the total number of AI performed,
the confirmed pregnancy reportedly found to be 23% in MP and 21% in UP.
ii. Out of total 5360 confirmed pregnancies in MP, 1288 calves have been born while in
UP, out of total 7221 confirmed pregnancies,
1527 calves have been born which is 24% and
21% of the total confirmed pregnancies
respectively.
iii. From the sample visits of 14 AI centres in UP,
02 in each district, it is estimated from the data
that a total of 1023 calves are born both for
cows and buffaloes.
iv. The semen stalks of Jersy, HF, Gir and Sahiwal
for cow and Murrah for buffalo have been used.
v. With respect to the murrah buffalo distribution, a sample of 30 units each in MP and
UP were inspected and responses on coverage, cost of maintenance of bull, coverage
and income were gathered. Out of 30 bulls
inspected in UP, 20 provided natural services
in nearby villages, 07 were not mature
enough to provide services, and rest 01 were
not found with the care taker and reported
to be taken by some relative. On average one
buffalo provided services to 25-30 buffaloes
during the last one year. It was difficult to
obtain information on total number of
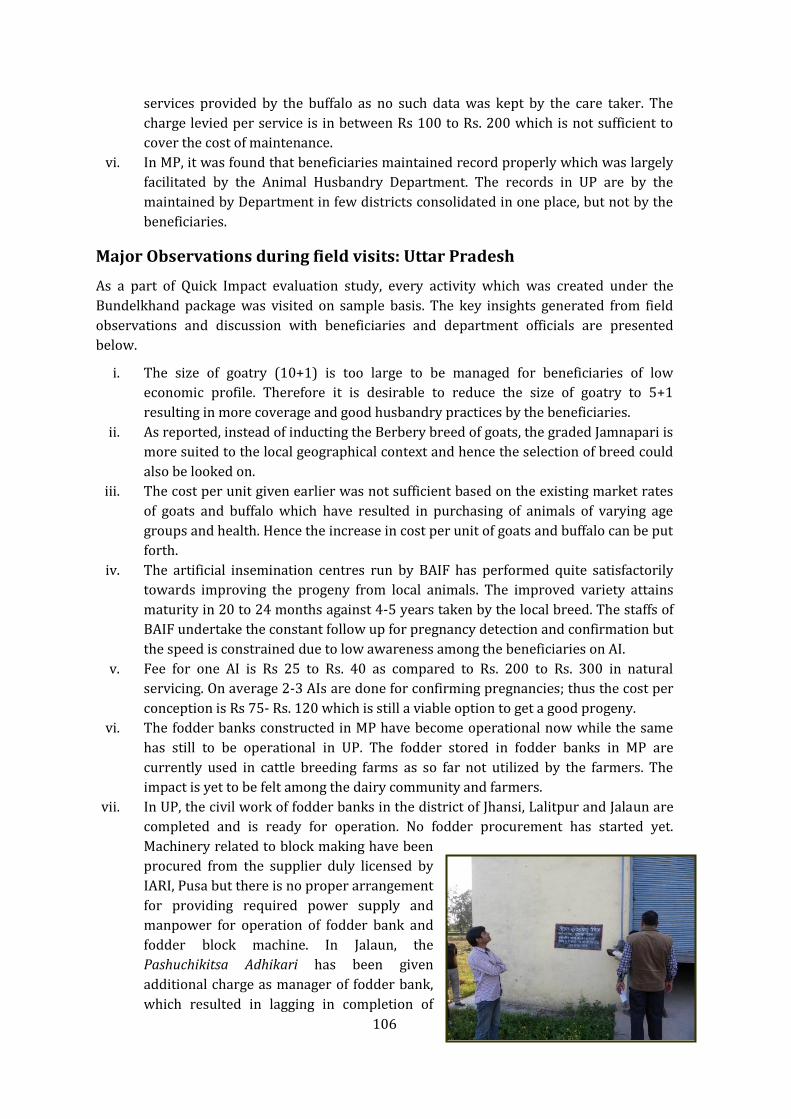
106
services provided by the buffalo as no such data was kept by the care taker. The
charge levied per service is in between Rs 100 to Rs. 200 which is not sufficient to
cover the cost of maintenance.
vi. In MP, it was found that beneficiaries maintained record properly which was largely
facilitated by the Animal Husbandry Department. The records in UP are by the
maintained by Department in few districts consolidated in one place, but not by the
beneficiaries.
Major Observations during field visits: Uttar Pradesh
As a part of Quick Impact evaluation study, every activity which was created under the
Bundelkhand package was visited on sample basis. The key insights generated from field
observations and discussion with beneficiaries and department officials are presented
below.
i. The size of goatry (10+1) is too large to be managed for beneficiaries of low
economic profile. Therefore it is desirable to reduce the size of goatry to 5+1
resulting in more coverage and good husbandry practices by the beneficiaries.
ii. As reported, instead of inducting the Berbery breed of goats, the graded Jamnapari is
more suited to the local geographical context and hence the selection of breed could
also be looked on.
iii. The cost per unit given earlier was not sufficient based on the existing market rates
of goats and buffalo which have resulted in purchasing of animals of varying age
groups and health. Hence the increase in cost per unit of goats and buffalo can be put
forth.
iv. The artificial insemination centres run by BAIF has performed quite satisfactorily
towards improving the progeny from local animals. The improved variety attains
maturity in 20 to 24 months against 4-5 years taken by the local breed. The staffs of
BAIF undertake the constant follow up for pregnancy detection and confirmation but
the speed is constrained due to low awareness among the beneficiaries on AI.
v. Fee for one AI is Rs 25 to Rs. 40 as compared to Rs. 200 to Rs. 300 in natural
servicing. On average 2-3 AIs are done for confirming pregnancies; thus the cost per
conception is Rs 75- Rs. 120 which is still a viable option to get a good progeny.
vi. The fodder banks constructed in MP have become operational now while the same
has still to be operational in UP. The fodder stored in fodder banks in MP are
currently used in cattle breeding farms as so far not utilized by the farmers. The
impact is yet to be felt among the dairy community and farmers.
vii. In UP, the civil work of fodder banks in the district of Jhansi, Lalitpur and Jalaun are
completed and is ready for operation. No fodder procurement has started yet.
Machinery related to block making have been
procured from the supplier duly licensed by
IARI, Pusa but there is no proper arrangement
for providing required power supply and
manpower for operation of fodder bank and
fodder block machine. In Jalaun, the
Pashuchikitsa Adhikari has been given
additional charge as manager of fodder bank,
which resulted in lagging in completion of

107
work in fodder bank and also his absence from the hospital. Thus the work is
reportedly delayed due to non availability of operation and maintenance funds and
man power required to run the unit.
viii. Diesel generator is provided as an
operation to operate the fodder block
machine. In absence of any permanent
source of power, it is doubtful how the unit
will produce fodder block at the
commercially reasonable rates to the
farmers. A significant time has passes since
the installation of machineries and no
progress has been made on sourcing the
fodder. Any further delay in starting the
production will result in a machines getting
depreciated at faster rate.
ix. There is urgent need for placement of separate skilled workers to handle machinery
installed in fodder bank unit along with arrangement of permanent power source
and raw material. Unless the arrangements are made, the entire infrastructure
created will remain in fructuous.

108
Chapter 7 Dairy Development
The Allocation and Financial Achievements
Dairy activity taken up during the Phase-I of the package was visited comprehensively in
districts of both the states. Dairy sector accounted for about 1% of the total ACA budget
allocated to Bundelkhand region. The allocation to this activity is presented in Table 64.
Table 64 Allocation in Dairy Sector under Bundelkhand Package
State Allocated to Dairy Sector (Rs Crore)
Total Allocation under the Package
(Rs Crore)
% Allocation to
Dairy
Madhya Pradesh 21.3 1958.14 1.1%
Uttar Pradesh 26.74 1695.76 1.6%
Bundelkhand region 48.04 3653.9 1.3%
Out of total allocation of Rs. 48.04 crore, the allocation made to Madhya Pradesh and Uttar
Pradesh was Rs. 21.3 crore and Rs. 26.74 crore respectively. The projects under this sector
are intended to revive the cooperative societies, thereby increasing the milk procurement
from the members resulting in additional income generations. As against the allocation,
100% releases were made and 100% expenses are reportedly made, which can be seen in
the Table 65 below.
Table 65 Allocation, release and expenditure in Dairy Sector under Bundelkhand Package
State Allocated to Dairy Sector
(Rs. Crore)
Release under the Package
(Rs Crore)
Actual Expenditure (Rs Crore)
% of expenditure
to release
% of expenditure to allocation
Madhya Pradesh 21.3 21.3 21.3 100% 100%
Uttar Pradesh 26.74 26.74 26.74 100% 100%
Bundelkhand region
48.04 48.04 48.04 100% 100%
Brief Outline of Dairy Projects
In Madhya Pradesh, the major activities undertaken in package are Organization/ revival of
500 Dairy Cooperative Societies, establishment of09 Bulk Milk Coolers, strengthening of

109
milk processing plant at Sagar, procurement of milk and marketing. In Uttar Pradesh, the
activities under taken were organization/ revival of 560 Dairy Cooperative Societies and
their registration, technical investments in improved husbandry practices which include
distribution of de-wormers, mineral mixture, and fodder seed distribution, feed and fodder
distribution, working capital for supporting the milk procurement through DCSs, meeting
transportation cost towards marketing of milk and training. Additionally, one milk
processing plant as Jhansi, strengthening and up-gradation of infrastructure at Chitrakoot
and Jalaun district was also undertaken in the package.
Overall Physical Progress
The status of progress of the dairy projects in the Bundelkhand region is presented as under
in Table 66:
Table 66 Physical progress under Dairy Sector in UP & MP
State Activities Unit Targets Achievement % Achievement
Ma
dh
ya
Pra
de
sh
Organization of DCS No. 500 561 112%
Bulk Milk Coolers No. 9 14 156%
Milk Processing Units (Renovation & Upgradation)
No. 1 1 100%
Average Daily Milk Collection
K.G/ day 25000 36418 145%
Milk Tanker No. 3 3
Utt
ar
Pra
de
sh
Organize DCS No. 560 560 100%
Technical Investment
De-wormer No. of Ben 65198 65198 100%
Mineral Mixture No. of Ben 18480 18480 100%
Berseem Mini Kit No. of Ben 16800 16800 100%
Bajra Minikit No. of Ben 8400 8400 100%
Urea Molasses (link block)
No. of Ben 68400 68400 100%
Animal Feed No. of Ben 93861 70037 75%
Average Daily Milk Collection
K.G/ day 59680 25600 43%
Milk Transportation Cost No. 7 7 100%
Training and Exposure
Exposure Visit No. of Ben 427 427 100%
Promotional Activities No. 679 679 100%
Training of Field Staffs No. of Ben 70 70 100%
Training of Managerial Level Staffs
No. of Ben 28 28 100%
Plant renovation and upgradation
No. 5 5 100%
As can be seen, the progress reported by both the states is almost 100% against the targets.

110
Major Observations from Field Visits: Uttar Pradesh
As a part of Quick Impact evaluation study, every activity which was created under the
Bundelkhand package was visited on sample basis. The sample include, 09 Cooperative
Societies in 05 out of 07 districts of Uttar Pradesh were visited. Also, the milk processing
unit at Jhansi, milk chilling centre at Jalaun and Chitrakoot were also visited and information
was obtained as per the designed check list. Discussions with the beneficiaries/ milk
pourers, secretary of DCS, milk inspectors and officers of processing and chilling centres
were held to obtain their feedback on the benefits generated from the intervention.
Table 67 below gives brief findings of the indicators evaluated during the field visits.
MILK PROCESSING CENTRE ESTABLISHED UNDER BSP IN JHANSI

111
Table 67 Status and impact of dairy development under Bundelkahand Package in UP
Indicators Unit Jhansi Lalitpur Jalaun Chitrakoot Banda Hamirpur Mahoba Total
Bulk Milk Coolers No 6 0 0 5 0 10 0 21 Milk Chilling Centre No 0 1 0 0 0 0 0 1 Milk Processing Plant No 1 0 1 1 0 0 0 3 Capacity LPD 10000 5000 30000 10000 0 0 0 55000 Milk Route Established No 8 1 NA 6 2 4 4 25 No of active routes No 1 0 NA 1 1 4 4 11 Daily Milk Received at BMC/ Chilling Centres (Average)
Litre/day 5000 803 6500 2000 896 960 81.5 16240.5
Total Dairy Cooperative Societies
No 80 80 80 80 80 80 80 560
Non Functional Dairy Cooperatives
No 66 64 9 65 31 67 75 377
Functional Dairy Cooperative Societies
No 14 16 71 15 49 13 5 183
Sample of Dairy Cooperative Societies Visited
No 1 1 0 0 4 2 1 9
Total Members No 32 No Records
found
NA NA 90 122 80 324 Women Members No 2 6 23 4 35 Ratio (Men to Women) 15:1 14:1 4.3:1 19:1 8.25:1 SC/ST Participation No 3 14 21 9 47 SC/ST Participation % 9% 16% 17% 11% 15% Total pourer members No 4 55 44 23 126 Milk Collection Litre/day 09-11 40-50 30-50 59-86 Average/ day (Lean season) Litre/day 9 35 30.75 72.5 Average/ day (Flush Season) Litre/day 20 55 45.84 160 Total Payment disbursed Rupees NA NA NA NA NA NA NA Price Realization Rs./Litre NA Rs.21 - 23 Rs. 22.10 - 29.5 Rs. 10.8-15

112
The progress of the dairy sector in Uttar Pradesh has not achieved the desired results and
most of the societies established are not functioning at present.
i. The milk processing centre at Jhansi of 10000 litres per day capacity is running at
less than half the potential capacity. The average milk collected per day varies
significantly during the flush season and peak season. During the months of October,
November, the average collection goes upto 5000 litters per day which goes down to
400- 800 litres during the lean season. Overall the units are running at significantly
low level.
ii. Out of the targeted procurement of 55000 litres per day, the current procurement
from the seven districts is found to be 16000 litres per day which 70% less than the
desired level for self sustenance.
iii. Out of 25 routes to be activated, only 11 routes are functional as per the reports
obtained during the visits and interaction with the department officials.
iv. Out of 560 Dairy Cooperative Societies which were revived/ organized, 377 (67%)
are sick/ non functional. Although, 183 (23%) are reportedly functional but the
actual number may be less considering the grim situation of dairy.
v. A total of 09 Dairy Cooperative Societies were chosen, 03 randomly from Jhansi,
Lalitpur and Hamirpur, while rest six were chosen in consultation with the
department officials in order to study their relative performance and assess the
actual status. The societies in Jhansi, Lalitpur and the one chosen in Hamirpur are
collecting milk ranging in between 9 litres to 30 litres a day. The best performing
dairies which were shown by the officials collecting milk not more than 40 litres
during the lean season and not more than 90 litres during the flush season. The most
encouraging societies were found in Banda where 4 societies shown were collecting
milk between 40 to 50 litres a day.
vi. Out of total 324 members form 09 DCS, only 126 (38%) members are pouring milk
to the cooperative societies while the rest either sells it to the private collectors or
consume. Only 10% of the members were found to be women, which in terms of
ratio is for every 9 men there is 1 women members.
vii. The price realization from selling of the milk to cooperatives not at the desired level.
The prices paid to the pourers range in between Rs.11.00 to Rs. 15.00 per litre in
Mahoba to maximum of Rs. 22.00 to Rs. 29.00 per litre in Hamirpur. The secretary of
DCS sells after collection to private players, at the rate of Rs 32.00 to Rs. 35 litres
keeping the margin. As there is no incentive for the pourer to sell the milk to
cooperative societies, this defeats the very purpose of creating the Dairy Cooperative
Society.
viii. Even after the renovation of milk processing plant of Jalaun, Jhansi and Chitrakoot,
less than the required supply of the milk has
resulted in sub-optimal utilization of asset
created. In Chitrakoot, the treatment plant is
found to be incomplete. The packaging
machines are installed in Chitrakoot and
Jhansi. A part of milk collected in Chitrakoot is
packed and sold but that is not enough to
reduce to increasing losses of the unit.
ix. In Lalitpur, Rs. 1.00 core working capital is

113
required to run the chilling plant, which is 100% complete. The assets installed is
lying in-fructuous and depreciating at a high rate. Six (06). There is no availability of
water in the chilling centre despite of 06 boring already done in the campus.
x. The transportation cost in all the routes is reportedly high to an extent of Rs 4.00 to
15.00 per litre. The officials of the dairy department informed that the societies are
not getting any transport subsidy and as such cost on transport per litre of milk has
increased substantially and the societies are incurring losses due to high
transportation cost.
xi. At Hamirpur, the concerned dairy development officer reported that Rs. 1.00 crore
payments are pending with Kanpur Milk Union which has become sick and
liquidated. The pending payment has severely affected the payment to pourers. The
average lag in payment reported is 3 weeks but in actual it is more than a month.
Further, with closure of the Kanpur Dairy, the disposal of milk collected at the
chilling centre/ milk coolers has become one of the major bottlenecks.
Major Observations during field visits: Madhya Pradesh
The dairy sector in Madhya Pradesh has shown an impressive progress since the inception
of the package. The funds have been fully utilized and infrastructures have been fully
created and functional. The results presented in Table 68 below the results achieved by the
dairy development department in Madhya Pradesh.

114
Table 68 Status and impact of dairy development in MP
Indicators Unit Sagar Chhatarpur Damoh Panna Tikamgarh Datia Total
Bulk Milk Coolers No 1 3 2 3 3 2 14 Milk Chilling Centre No 0 0 0 0 0 0 0 Milk Processing Plant No 1 0 0 0 0 0 1 Capacity LPD 5000 4500 4500 3000 5000 3000 25000 Milk Route Established No 7 7 6 4 8 7 39 No of active routes No 7 7 4 4 8 7 37 Daily Milk Received at BMC/ Chilling Centres (Average)
Litre/day 12294 6480 3301 2734 8703 7701 41213
Total Dairy Cooperative Societies No 105 96 95 77 140 48 561 Non Functional Dairy Cooperatives
No 7 4 30 1 0 0 42
Functional Dairy Cooperative Societies
No 98 92 65 76 140 48 519
Sample of Dairy Cooperative Societies Visited
No - 5 5 5 5 -
Total Members No 3386 3455 2796 2537 4739 1547 18460 Women Members No 1304 1121 814 654 3101 1035 8029 Ratio (Men to Women)# - 2.15:1 0.01:1 0.42:1 0.59:1 - 1.29:1 SC/ST Participation# No - 18 46 37 13 - SC/ST Participation % 6% 37% 21% 5% - 13.45% Total pourer members No Milk Collection Average/ day Litre/day - 118.18 34.35 81.83 141.65 - 95.12 Total Payment disbursed Rs.(Lakh) 1686.71 1049.21 409.14 478.46 1593.84 806.08 6023.44 Price Realization Rs./Litre 21.9-31.9 14.9-29.6 21.9-29.6 17.4-24.5 # Based on sample cooperative societies visited

115
i. A total of 14 bulk milk coolers were installed
against the targeted 09 and 01 milk processing
plant located in Sagar was renovated and
upgraded to the capacity of 20000 litres per
day. Against the capacity of 20000 LPD, the
plant is operating at a capacity of more than
28,000 LPD.
ii. Total DCS established is 561 against the
targeted 500 DCS of which 519 are functional
on 37 out of 39 established milk routes.
iii. Against the targeted milk collection of 25000 LPD, the current collection is 41213
LPD which is 64% more than the targeted milk collection.
iv. Total membership created through revival/ reorganizing the DCS is 18460 of which
8029 were women member which accounts for 43% of the total members of the
societies. The man to women ratio is much significant in case of Madhya Pradesh
(1:1.29), thus creating favourably the environment to participate in economic
activities and empowerment.
v. Since, the inception of package after revival of dairy sector in Madhya Pradesh, the
amount that has gone to the members of Dairy
Cooperative Societies is Rs. 6023.44 lakh. Thus,
each member family of the cooperative has
been able to generate additional Rs. 8184.00
per annum from the dairy activity which is
quite significant addition to its overall income.
vi. The payments made to pourers are strictly
made on the rates based on SNF and Fat
percentage
vii. The creation of infrastructure and institutionalization of whole process has
benefited the farmers who use to carry milk earlier to large distance of more than 18
Kms as reflected by the farmer of Sagar district. Since, there were no cooperative
societies, the milk was usually sold to private dealer and market was more or less
oligopsonic where there was large number of sellers but few buyers who used to
dictate the terms of trade. The establishment of cooperative societies in have been
able to create a competitive market in the region.
viii. The price realization of milk per litre estimated range in between Rs. 15.00 to Rs.
32.00 depending on the seasons which affect the fat/SNF percentage and milk
productivity.
Recommendation/ Suggestion
i. The viability of dairy sector in all the district of Uttar Pradesh needs to be critically
and comprehensively reviewed before any attempt to expand the activity in the
region. Although, the department demand budgets for expanding the activity and
creating additional infrastructure of Chilling centre/ BMCs but unless the supply
constraints are removed, any further expansion and installation will remain in-
fructuous.

116
ii. The payment lag has to be reduced to a week instead which is currently more than
03 weeks at present, because most of the pourers are small and marginal in the
regions which needs cash more frequently to meet their daily requirement. They
turn to private players because they make payment spot and cash payment.
iii. Breed improvement may be given additional thrust to get new progeny which are
more productive than the exiting cattle/ buffalo population. Although, this appears
to be a long term solution to address the issues of Annapratha and Milk Supply
constraints.
iv. Modernization of existing dairy cooperative societies with Automated Milk
Collection and Testing System will improve transparency and accountability in
overall system which is absent in present system.
v. A more transparent system of reporting using Management Information System may
be established by the PCDF which is completely found lacking and reports obtained
reflect different figures at different places.

117
Chapter 8 Forest & Environment Forests are repository of the bio-diversity. They play a vital role in sustaining the life of
people and are crucial for the food and water security. However, planning and sustainable
management are key art to safeguard forest resources. In absence, degradation appears
which seriously affects the sustainability of crops and natural vegetation. As forests
disappears, the possibilities of rainwater being conserved below the ground decreases thus
resulting in acute water shortage.
Draught has a strong correlation with poor
management of forest resources. Bundelkhand,
which is a draught affected area, soil erosion and
dryness are key characteristics of forest land in
Bundelkhand region. Henceforth, to revive the land
under the forest, it was decided to allocate Rs 314
crore under the package to Forest & Environment.
It was targeted to bring in 60,000 hectares of forest
areas in UP and 2 lakh hectares of forest areas in
MP for integrated conservation and management.
This intervention on the forest land will help in
planting of local grasses and fruit bearing trees which will restore not only the degraded
forests but will also enhance the drinking and ground water availability.
Financial Allocations and Progress
Funding under environment and forest showcased a convergence of ACA, CS and MGNREGA.
The following is the fund allocation-
Table 69 Allocation and Expenditure in Environment & Forest Sector under Bundelkhand Package
State Allocation to Environment & Forest (Rs Crore)
Released under the package (Rs Crore)
Actual Received (Rs Crore)
Actual expenditure incurred (Rs Crore)
% received of allocated
% spent of received
Madhya Pradesh 242 130.03 106.58 105.87 44.04% 99.33% Uttar Pradesh 72 86.9 86.9 31.56 120.69% 36.32% Bundelkhand region
314 216.93 193.48 137.43 61.62% 71.03%

118
Convergence of Funds in Forest and Environment Activities
One important issue with respect to allocation of funds to environment & forest department
pertains to convergence of funds. The following table showcases the funds allocated and
released by different funding sources.
Table 70 Convergence of fund in Forest and Environment activities under Bundelkhand Package
Madhya Pradesh
Total Fund ACA Share CS Share MGNREGA Share Allocated Release Allocated Release Allocated Release Allocated Release 242 130.03 107 107 20 19.36 115 3.67 Uttar Pradesh Total Fund ACA Share CS Share MGNREGA Share Allocated Release Allocated Release Allocated Release Allocated Release 72 86.9 31.56 61.56 5.44 4.34 35.00 21.00
It can be seen there from that ACA funds and MNREGA funds are the two major and equal
sources for the environment and forestry component of the package.
One key observation with respect to release of fund was the huge discrepancies between the
allocated & released. In UP, actual release in ACA contribution was 195% of the allocated
amount whereas MGNREGA release in MP was meagre 3.2% of the allocated amount.
From the figure above, it is clearly evident that except the ACA contribution, others have
failed to contribute as per the allocated share. This was cited as a key reason for delay in
creating said infrastructures under the environment & forest head in UP & MP.
100% 96.8%
3.2%
195.1%
79.8%
60%
0%
50%
100%
150%
200%
250%
ACA CS MGNREGA
Madhya Pradesh
Uttar Pradesh
Figure 10 Convergence of funds from different sources under forest and environment
activities under the Bundelkhand Package

119
Physical Progress
Forest department in Bundelkhand region have undertaken many activities to restore the
lost moisture of the land and improve the ground
water level. Some of the activities undertaken using
the package funds were contour bunding, Earthen
Check dam, Concrete Check dam, deepening of ponds,
etc. The section provides a brief note on the physical
structure envisaged under the special package in
Madhya Pradesh and Uttar Pradesh.
District forest officer implemented the projects under
the Bundelkhand special package in the state of
Madhya Pradesh. Forest Range Officers were assigned
the task of detailed continuous monitoring of the projects implemented. The following is the
progress made in Madhya Pradesh-
Table 71 Area treated and structure created under soil and water conservation activities by Forest Dept.
under the Bundelkhand Package (Madhya Pradesh)
District Total Treated Land
(Hectare)
Number of Structure to be created
Completed In Progress
% completed
Sagar 27784.83 73 73 0 100% Damoh 14464.00 41 41 0 100% Chhatarpur 13266.00 67 67 0 100% Tikamgarh 8844.00 54 48 6 88% Panaa 24320.00 249 249 0 100% Datia 3876.00 21 6 12 28% Total 92554.83 505 484 21 95% Except Tikamgarh & Datia, all the other districts of Madhya Pradesh have been able to
achieve their targets in the stipulated period of time. However, in terms of treatment of
forest area for soil and moisture preservation, despite 95% completion of the envisaged
structures, only 92554.83 hectare of land as against the targeted 2 lakh hectares could be
treated.
In case of Uttar Pradesh, the department officials notified that 100% of the work has been
completed by the forest department. The following table illustrates the number of
infrastructure created and their coverage
Table 72 Physical progress in UP under soil and water conservation activity in UP
Districts Projects Completed (No)
Area Covered (Ha.)
Jhansi 117 12000 Jalaun 45 6000 Lalitpur 103 16000 Mahoba 58 5000 Hamirpur 73 7000 Chitarkoot 100 12000 Banda 19 2000 Total 515 60000

120
It was observed that UP was able to complete the target in terms of area of coverage.
Sample Visit & Major Observations from Field Visits: Madhya Pradesh
As a part of the evaluation study, 18 out of 505 projects implemented under the package in
MP were visited. The following table showcases the breakup of the sample visited district
wise:
Table 73 Area treated by Forest Dept under the Bundelkhand Package in MP
District Total projects
Sample project visited
Total Treated Area (Ha.)
Total Treated area covered
(Ha.)
Sagar 73 0 27784.83 00.00 Damoh 41 0 14464.00 00.00 Chhatarpur 67 8 13266.00 1426.20 Tikamgarh 54 0 8844.00 00.00 Panaa 249 10 24320.00 2674.43 Datia 21 0 3876.00 00.00 Total 505 18 92554.83 4100.63
As the projects were of similar nature and lacked beneficiaries, it was decided to cover 18
sample projects covering a total area of 4100.63 hectare. The following are the major
observations from the field visit-
i. In Panna, forest department have constructed 8 small tanks of 250 meters in length
and 2 meter deep. Besides, 700 percolation pits and 24 percolation tanks were also
constructed. However, on date of visit the percolation pits and tanks both were dried
out.
ii. The area around the created structure was found to have decent density of trees
with a wide coverage of green grass.
iii. All the interventions covered under the sample had no beneficiaries. Thus, it was not
possible to validate the data provided by the department officials.
iv. Sample Earthen Dams infrastructure created in Panaa was damaged and could not
store the water as per the capacity. Forest department cited heavy rains as the
reason for the damage.
v. No Project Details Display Board was erected at the project site / entry point from
the civil area for social audit. Hence it was difficult to distinguish between a package
funded and non package funded structures.
Sample Visit & Major Observations from field visits: Uttar Pradesh
As a part of the evaluation study, 19 of the implemented projects under the package in UP
were visited. The following table showcases the breakup of the sample visited district wise:

121
Table 74 Area treated by Forest Dept. under Bundelkhand Package in UP
District Total projects
Sample project visited
Total Treated Area (Ha.)
Total Treated area covered (Ha.)
Jhansi 117 5 12000 1100
Jalaun 45 3 6000 1125 Lalitpur 103 3 16000 1356
Mahoba 58 4 5000 1076
Hamirpur 73 4 7000 330
Chitarkoot 100 0 12000 0
Banda 19 0 2000 0
Total 515 19 60000 4987
In case of UP, a sample of 19 projects were selected and visited covering an area of 4987
hectares. The following are the major observations from the field visit-
i. The check dams constructed are in ideal locations having anticipated level of water
storage and overflowing during the rainy season. The quality of construction was
found to be satisfactory.
ii. Pond deepening work done in UP have resulted in higher level of water storage and
seasonal fishery activity is undertaken by a beneficiary.
iii. Earthen dams created in Mahoba have no stored water on the date of visit. Even, the
villagers nearby the earthen dam did not experience any change in the level of water
availability with them. However, the department officials propagated that there has
been a significant change with an increase in greenery around the project area.
iv. Structured created by forest department provided a great relief from thirst to milch
animals who are left out in open in accordance with “Anna Pratha” practiced in the
Bundelkhand region. Besides, it also provided drinking water for animals living in
the forest.
v. There was convergence with MANREGA for carrying out the projects. It was also
learnt that work was delayed due to the convergence as the adequate labour supply
was not available.
vi. No Project Details Display Board was erected at the project site / entry point from
the civil area for social audit. Hence it was difficult to distinguish between a package
funded and non package funded structures.
Impact of the Project
Projects implemented under the Forest and
Environment head had a mono objective of checking
the soil erosion by restoring the soil moisture. In both
the states, the land near the project area showcased
an excellent progress. However, not much change
could be observed on those areas which were a bit far
from the project site however fallen under the
catchment area of the project. Based upon the field
visit and interaction with available beneficiaries &

122
department officials, the following impact was observed-
i. In Jhansi district of Uttar Pradesh, where the projects implemented are close to the
catchment area of farmers, it was learnt that pre intervention the land was not found
suitable for cropping however; post intervention farmers are able to grow
groundnut and soybean because of enhanced moisture level downstream.
ii. In Hamirpur, Concrete stop dams created by the forest department have helped in
increasing the level of water in the nearby dug wells. Farmers were satisfied with the
structure and used the water for irrigation of crops cultivated around the stop dam.
iii. On inspection of the timeline of the pictures provided by the department officials of
the project construction, it was observed that in Mahoba the earthen dam created
under the package have improved the greenery around the project to a very large
extent. A decent amount of grass coverage was also observed which made a check on
the soil erosion.
Recommendation
i. First and foremost, GIS mapping of the structure created under the package is a
must. It is impossible to distinguish a structure created under the package and non
package. Audit of such infrastructure is impossible. GIS mapping besides providing
the location details of the structure would also help in maintaining the authenticity
of work.
ii. Under watershed treatment activity, the activities implemented were not planned
but implemented on adhoc basis. It is recommended that watershed approach may
be followed while planning the activity in the forest area.
iii. Concrete stop dam/check dam highlighted a much significant success as compare to
earthen dam in the region of Bundelkhand. It is thus recommended that in near
future, projects should be sanctioned under concrete stop dam/check dam rather
than earthen dams.
iv. Beneficiary’s participation should be encouraged while creating an infrastructure. If
possible, a demand analysis should be made and accordingly the envisaged
infrastructure should be created.
v. Many of the structures visited mostly earthen dam was found to be technically weak
as no pitching and spillways are provided to safeguard the structure in case of heavy
rain. In order to safeguard the earthen check dams, it is suggested that stone pitching
on the upstream side of bunds, provision of masonry spillways for escape of surplus
water and plantation of grasses and shrubs on the bunds should be undertaken.

123
Chapter 9 Rural Drinking Water The region of Bundelkhand is vast and complex in terms of its geographical as well as its
economic, social and political aspects. It is divided between UP & MP comprising of total 13
districts. The region is characterized as a dry area with an annual rainfall of approximate
500 mm. In light of the previous statement, the issues of clean drinking water supply are
important. Keeping in view the demand from the Minister of State in the Ministry of Rural
Development and other Members of Parliament from Bundelkhand the Government on 19th
May 2011 approved an Additional Central Assistance for the State Governments of Uttar
Pradesh and Madhya Pradesh to provide drinking water in the Bundelkhand region.
Financial Allocations and Financial Achievements
A total of Rs. 195.0724 crore (5.34% of ACA allocation) has been sanctioned under ACA for
the Bundelkhand region. The Table 75 highlights the state wise breakup of the total amount
allocated, released and expenditure.
Table 75 Allocation, releases and expenditure in Drinking Water Projects under Bundelkhand Package
State Allocation Releases Expenditure % of expenditure to Allocation
% of expenditure to Release
Madhya Pradesh 103.44 99.74 92.51 96.4% 92.8% Uttar Pradesh 91.63 63.88 57.05 69.7% 89.3% Bundelkhand 195.07 163.62 149.56 83.9% 91.4%
Madhya Pradesh as compared to Uttar Pradesh has been able to better utilize the financial
allocation under the ACA to the respective states. A total of 83.9% of the allocated budget
was released to respective department of both the states whereas 91.4% of the received
budget had been used by both the states.
Financial Progress
This section talks about the fund utilization by the respective departments of both the states.
The following is extent of fund utilization in Madhya Pradesh-
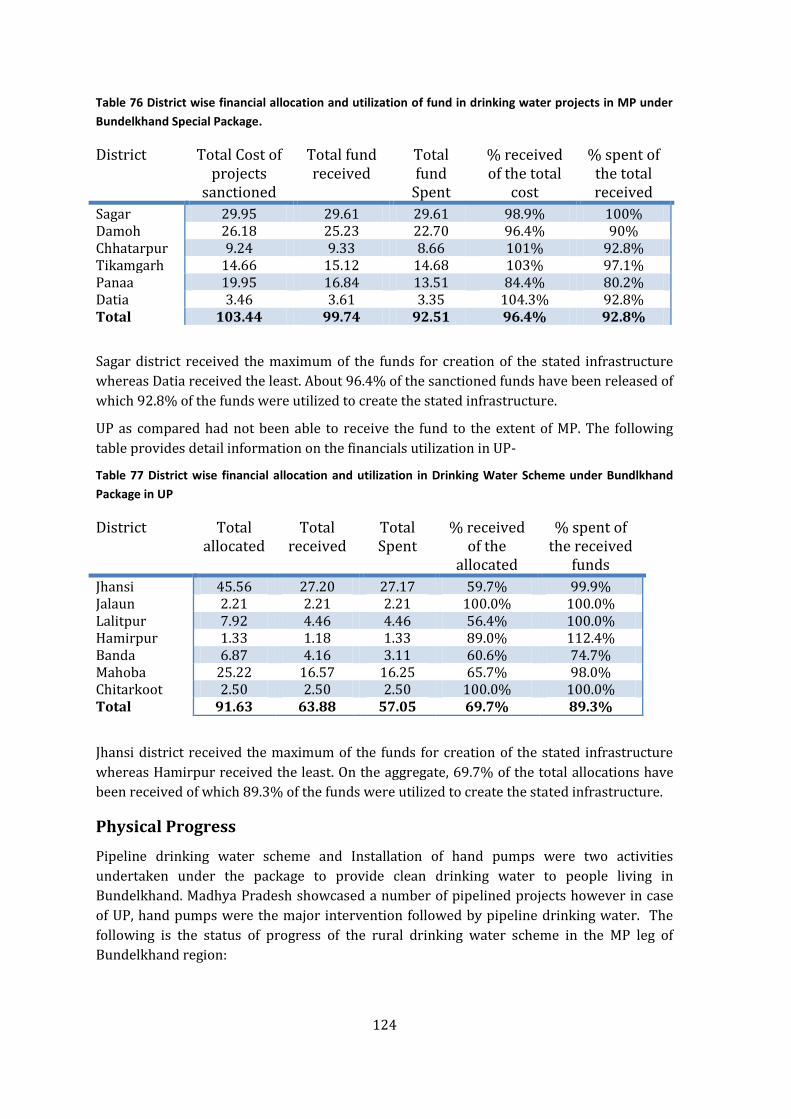
124
Table 76 District wise financial allocation and utilization of fund in drinking water projects in MP under
Bundelkhand Special Package.
District Total Cost of projects
sanctioned
Total fund received
Total fund
Spent
% received of the total
cost
% spent of the total received
Sagar 29.95 29.61 29.61 98.9% 100% Damoh 26.18 25.23 22.70 96.4% 90% Chhatarpur 9.24 9.33 8.66 101% 92.8% Tikamgarh 14.66 15.12 14.68 103% 97.1% Panaa 19.95 16.84 13.51 84.4% 80.2% Datia 3.46 3.61 3.35 104.3% 92.8% Total 103.44 99.74 92.51 96.4% 92.8%
Sagar district received the maximum of the funds for creation of the stated infrastructure
whereas Datia received the least. About 96.4% of the sanctioned funds have been released of
which 92.8% of the funds were utilized to create the stated infrastructure.
UP as compared had not been able to receive the fund to the extent of MP. The following
table provides detail information on the financials utilization in UP-
Table 77 District wise financial allocation and utilization in Drinking Water Scheme under Bundlkhand
Package in UP
District Total allocated
Total received
Total Spent
% received of the
allocated
% spent of the received
funds
Jhansi 45.56 27.20 27.17 59.7% 99.9% Jalaun 2.21 2.21 2.21 100.0% 100.0% Lalitpur 7.92 4.46 4.46 56.4% 100.0% Hamirpur 1.33 1.18 1.33 89.0% 112.4% Banda 6.87 4.16 3.11 60.6% 74.7% Mahoba 25.22 16.57 16.25 65.7% 98.0% Chitarkoot 2.50 2.50 2.50 100.0% 100.0% Total 91.63 63.88 57.05 69.7% 89.3%
Jhansi district received the maximum of the funds for creation of the stated infrastructure
whereas Hamirpur received the least. On the aggregate, 69.7% of the total allocations have
been received of which 89.3% of the funds were utilized to create the stated infrastructure.
Physical Progress
Pipeline drinking water scheme and Installation of hand pumps were two activities
undertaken under the package to provide clean drinking water to people living in
Bundelkhand. Madhya Pradesh showcased a number of pipelined projects however in case
of UP, hand pumps were the major intervention followed by pipeline drinking water. The
following is the status of progress of the rural drinking water scheme in the MP leg of
Bundelkhand region:
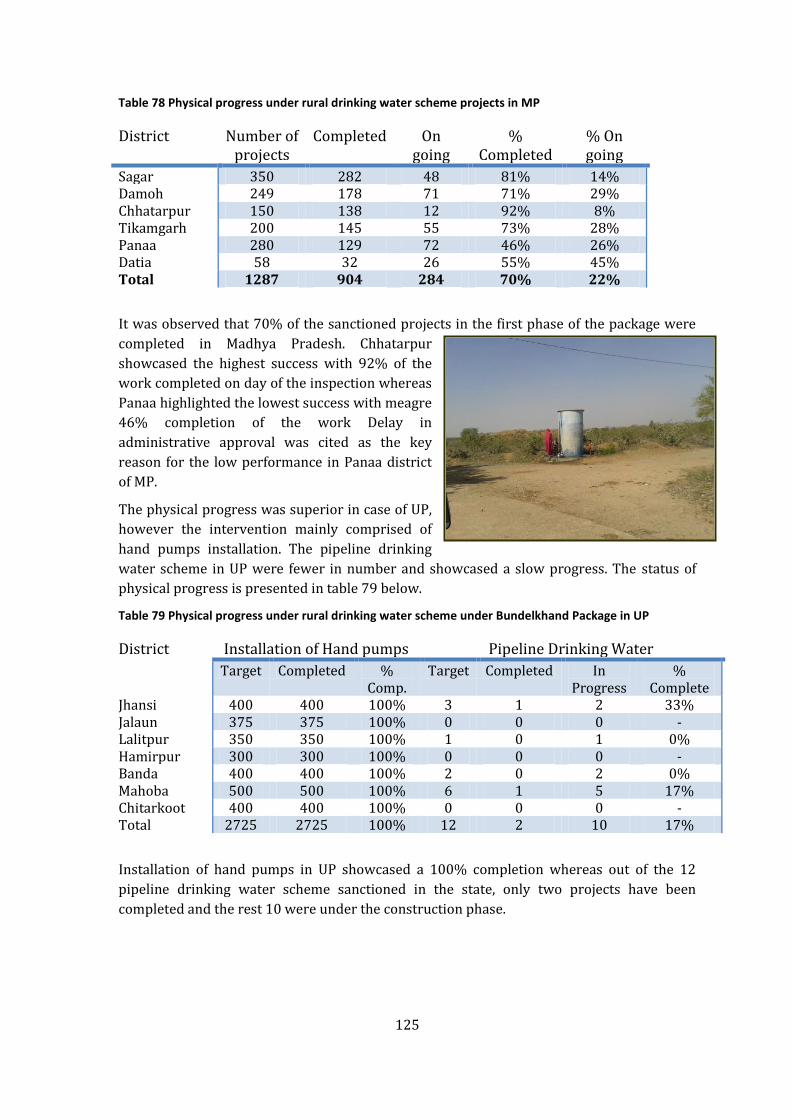
125
Table 78 Physical progress under rural drinking water scheme projects in MP
District Number of projects
Completed On going
% Completed
% On going
Sagar 350 282 48 81% 14% Damoh 249 178 71 71% 29% Chhatarpur 150 138 12 92% 8% Tikamgarh 200 145 55 73% 28% Panaa 280 129 72 46% 26% Datia 58 32 26 55% 45% Total 1287 904 284 70% 22%
It was observed that 70% of the sanctioned projects in the first phase of the package were
completed in Madhya Pradesh. Chhatarpur
showcased the highest success with 92% of the
work completed on day of the inspection whereas
Panaa highlighted the lowest success with meagre
46% completion of the work Delay in
administrative approval was cited as the key
reason for the low performance in Panaa district
of MP.
The physical progress was superior in case of UP,
however the intervention mainly comprised of
hand pumps installation. The pipeline drinking
water scheme in UP were fewer in number and showcased a slow progress. The status of
physical progress is presented in table 79 below.
Table 79 Physical progress under rural drinking water scheme under Bundelkhand Package in UP
District Installation of Hand pumps Pipeline Drinking Water
Target Completed % Comp.
Target Completed In Progress
% Complete
Jhansi 400 400 100% 3 1 2 33% Jalaun 375 375 100% 0 0 0 - Lalitpur 350 350 100% 1 0 1 0% Hamirpur 300 300 100% 0 0 0 - Banda 400 400 100% 2 0 2 0% Mahoba 500 500 100% 6 1 5 17% Chitarkoot 400 400 100% 0 0 0 - Total 2725 2725 100% 12 2 10 17%
Installation of hand pumps in UP showcased a 100% completion whereas out of the 12
pipeline drinking water scheme sanctioned in the state, only two projects have been
completed and the rest 10 were under the construction phase.

126
Sample Visit & Major Observations from Field Visits: Madhya Pradesh
As a part of the evaluation study, 10 out of 904 completed projects implemented under the
package in MP were visited. The Table 80 showcase the breakup of the sample visited
district wise.
Table 80 Total number of schemes and sample projects under rural drinking water schemes visited in
MP
District Total Completed Sample visited
Sagar 350 282 3 Damoh 249 178 2 Chhatarpur 150 138 1 Tikamgarh 200 145 2 Panaa 280 129 2 Datia 58 32 0 Total 1287 904 10
The following are the major observations of the field visits:-
i. Tenders for cistern based pipeline system/tube well have been awarded through
open tenders. PHED, Government of MP has implemented the projects.
ii. Annual maintenance of a system is estimated at Rs. 94000 per annum by PHED,
however monthly charges levied on beneficiaries is Rs. 30 per month which is too
low to meet the operation & maintenance cost. Besides a 50% default in payment of
the monthly charges was observed at the beneficiaries’ level. Understanding the
situation, the long term sustainability of the system is in doubt.
iii. Beneficiaries lacked awareness about the cost & benefit of the implemented scheme
iv. PHED officials informed that it was envisaged that a committee of users would be
formed that will take care of the operations & maintenance of the scheme. However,
despite 6 months of operations, no such committee have been formed. Currently
Gram Panchayat & PHED is jointly looking after the maintenance & operations.
v. Schemes implemented under the project were supply driven rather than based on
demand of the local villagers.
vi. In village Sagauri (Damoh), the project is being non operational as the source of
water is not available. Two wells have been dug but both of them have turned out to
be dry. Rs 11.79 lakh have been invested in the project till the date of evaluation
Sample Visit & Major Observations from Field Visits: Uttar Pradesh
As a part of the evaluation study, 39 out of 2737 projects implemented under the package in
UP were visited. The following table showcase the breakup of the sample visited district
wise-

127
Table 81 Total number of schemes and sample projects under rural drinking water project visited in UP
District Installation of hand pumps Pipeline Drinking water scheme
Total Completed Sample Total Completed Sample Jhansi 400 400 6 3 1 1 Jalaun 375 375 5 0 0 0 Lalitpur 350 350 5 1 0 0 Hamirpur 300 300 5 0 0 0
Banda 400 400 5 2 0 0 Mahoba 500 500 5 6 1 1 Chitarkoot 400 400 6 0 0 0 Total 2725 2725 37 12 2 2
The following are the major observation of the field visit-
i. Tenders for installation of new hand pumps were awarded through open tendering
system
ii. Soakage pit installed under the package failed to achieve its objective. It was
criticized by both the department officials & the local villagers.
iii. It was observed that in many cases hand pumps were used as a private property
rather than a public utility system. The installations are made in private campus,
than on public place.
iv. In case of Hamirpur, hand pumps installed as
per the department notifications were
actually missing on the field level in few of the
cases verified.
v. Pipeline Drinking water scheme in UP is only
implemented in Jhansi, Lalitpur & Mahoba. Of
which, one in Jhansi & another in Mahoba are
complete. During the evaluation, it was
observed that due to high density of hand
pumps in the area, villagers refrained from
using pipeline system as they have to pay for the connection & monthly charges.
Impact of the project on lives of the beneficiaries
Drinking water is a basic need of every human being. Hence it has a wide impact on the lives
of people. Projects implemented under the projects have successfully met the objective of
providing drinking water to number of beneficiaries living by the implemented project. The
following are key other observation that has come out from a detailed Focus Group
Discussion (FGD) with beneficiaries of the project-
Impact in Madhya Pradesh-
i. On a sample basis, a decent impact on the lives of beneficiaries was observed at each
implemented project. All the implemented projects have helped the beneficiaries to
reduce the travel time by a average of 55%
ii. Implemented scheme under the package has improved the supply of drinking water
from an average of 31 LPCD to 55 LPCD in Damoh & Sagar.

128
iii. In Tikamgarh, easy availability of clean water has helped the villagers in improving
sanitation facilities have home. This in turn has improved the hygiene & living
standards of the villagers.
Impact in Uttar Pradesh-
i. New Hand pumps installed under the package has helped people get clean drinking
water throughout the year. Common utility places enjoyed the highest success rate
in terms of number of beneficiaries and popularity
ii. Installed hand pumps under the package have increased the density of hand pump in
villages thereby reducing the manual work of the locals.
iii. Chitarkoot being a tourist place, few hand pumps installed at strategic location have
helped the tourist get clean water during their visit. However, a biased in selection of
beneficiaries for hand pump installation was seen in the area. The SC ST dominated
area lacked the facility whereas the upper caste people had a decent density of hand
pump installed.
iv. Installed drinking water system at Jhansi has highlighted a good success. The
implemented project has helped the beneficiaries receive water without much of
drudgery.
Recommendation
Corresponding departments have decently done their job of providing clean drinking water
to people of Bundelkhand, which was the key objective of funding under the Rural Drinking
water scheme. The following are the major recommendations which would enable the
department officials to further improve the implementation project & work for betterment
of the Bundelkhand area and respective people living here-
i. Projects under the head installation of new hand pumps should not be encouraged
anymore in the area. The area already has a decent density of hand pumps.
Bundelkhand being a dry region, installation of many more hand pumps will result in
a drastic fall in the ground water level which is not a good sign on sustainability.
ii. Projects under the head pipeline drinking water scheme should be encouraged.
People should be made aware of the scheme from a long run sustainability point of
view. A formal discussion on issues with payments & installation charges should
take place between the officials & people and a mutual agreement should be made.
iii. It was difficult to distinguish hand pumps installed under the package from those
who were not installed under the package. A GIS mapping could be a solution to the
stated issue.
iv. Soakage Pit which is an integral part of the current scheme under the head
installation of new hand pumps should be stopped.
v. New pipeline drinking water schemes should be initiated on consultation with
common public/beneficiaries in the area. A potential demand analysis is a must
before sanction of such projects. Also, a user committee should be made from the
potential users of the service to monitor and sustain the project.

129
Chapter 10 Relevance/ Acceptance of Different Intervention Made under the Package as Medium
Long Term Strategies for Drought Mitigation.
Rainfall Situation and irrigation coverage in Bundelkhand
The average annual rainfall of Bundelkhand in Uttar Pradesh is 876.1 mm with a range of
786.6 to 945.5 mm. In Madhya Pradesh portion the average rainfall is 990.9 mm with a
range of 767.8 to 1086.7 mm and is 13% more than the Uttar Pradesh part. About 90% of
the rainfall is received in the monsoon season of July to September in about 30-35 events or
spells.
Figure 11 Normal Annual rainfall (mm) in Bundelkhand districts
Technically speaking the Bundelkhand region falls under rainfed farming areas with more
than 750 mm of annual normal rainfall and the soil moisture situation is better.
The irrigated area averaged 45 – 46% of the net sown area which is also a
satisfactory position.
768
972 985 1065 1070 1087
787 851 851 879 880
940 945
0 100 200 300 400 500 600 700 800 900
1000 1100 1200

130
Table 82 Net sown area and irrigated area (000 ha) in Bundelkhand region
State / district Net sown area
Major and
medium irrigation sources
Minor irrigation sources
Total irrigated
area
% of irrigated area to net sown area
Uttar Pradesh
Lalitpur 299.7 27.45 120.54 147.99 49%
Jhansi 199.9 13.62 35.55 49.17 25%
Jalaun 303.9 37.92 88.6 126.52 42%
Hamirpur 337.1 118.09 96.41 214.5 64%
Mahoba 306 57.24 87.25 144.49 47%
Banda 213.3 46.74 60.97 107.71 50%
Chitrakoot 194.1 8.83 45.97 54.8 28%
Total 1854 309.89 535.27 845.16 46%
% share of sources 37% 63% 100%
Madhya Pradesh
Sagar 498 8.74 131.37 140.11 28%
Damoh 303.4 1.8 118.06 119.86 40%
Panna 235.5 2.67 53.86 56.53 24%
Chhaterpu 363 21.73 216.32 238.05 66%
Tikamgarh 240.1 16.85 170.79 187.64 78%
Datia 212 20.72 64.34 85.06 40%
Total 1852 72.51 754.74 827.25 45%
% share of sources 9% 91% 100%
Bundelkhand
Total 3706 382.4 1290 1672.41 45%
% share of sources 23% 77% 100%
However continuous shortfall in rainfall for 4 years prior to formulation of the package
made the region drought affected. The shortfall increased from 2004-05 to 2007-08.
Figure 12 Shortfall in rainfall in Bundelkhand region
-60
-50
-40
-30
-20
-10
0
10
2004-05 2005-06 2006-07 2007-08
Madhya Pradesh
Uttar Pradesh

131
It is this drought situation that sparked the need for implementation of a drought mitigation
package in Bundelkhand region.
Medium and Long Term Strategies for Drought Mitigation
Drought mitigation should essentially address the issue of enhancing the water availability
for agriculture and consumption besides creating enabling environment for creation of
institutional mechanism to effectively market the increased production. About 90% of the
geological area of Bundelkhand is a hard rock with very poor yield of aquifer, fast depletion
of water table and inadequate rate of replenishment or recharging. Development of ground
water resources is not very dependable or attractive. Watershed management, development
of surface water resources, improving water use efficiency, enhancing biomass productivity
of forest and livestock sector are the most important options of the new strategies.
Watershed management in the upper most forest catchment is the highly prioritized starting
point for integrated development of resources from ridge to valley. Besides, reviving of
traditional dug-wells and tanks, de-silting ponds, command area development and efficient
micro irrigation systems should get high priority. Intensification of diversification,
marketing, value addition, processing and ensuring the risks are also essential to consolidate
gains of enhancing productivity and other mitigative effects. Accordingly the following
medium and long term strategies of drought mitigation were drawn up under the
Bundelkhand package.
Table 83 Medium/long term strategies drawn under the Bundelkhand Package
Medium term strategies Long term strategies
Desilting, renovation, repairs of tanks, check dams, deepening and recharging of about 2.8 lakh dug-wells
Rainwater conservation in trenches, planting of indigenous fruits, fodder trees
Digging of farm ponds and new open wells
Completion of ongoing Rajghat canal project and Bariyarpur barrage
Creation of fodder and feed block banks
Improving efficiency of AI services
Creation of seed banks of extra short duration varieties
Professionally designed integrated participatory treatment of watersheds from ridge to valley system.
Mostly open dug-wells and Recharging of open dug-wells to be encouraged to tap the low yielding ground water potentials
Left Bank Canal at Bariyarpur of Madhya Pradesh should be expedited and Right Bank Canal taken up on priority basis.
Command areas of surface water resources to be developed
In situ conservation of rainwater, contour cultivation, sowing on ridges or raised beds especially in black soils
Modern market converging sale of farm produce, purchase of inputs, warehousing, sample testing services, banks, extension and electronic display system etc.
Seed multiplication and creation of seed banks Breed improvement with Tharparkar, Haryana and
Murraha bulls is necessary. Goat rearing especially of Jamnapari and Barberi to be
encouraged. Liquidation of animal assets for coping with drought Marketing of milk through Consumer institutions and
setting up modern milk processing plants (also for meat and animal related by products)
Development of drought tolerant varieities of filed crops

132
and planting of early bearing fruit crops Weather based insurance (Barsha Bima) Special institutional arrangements like that of Sujala
Watershed of Karnataka Strengthening of Agriculture College
Focus of the Package
The total allocation under Bundelkhand package aggregated Rs 3860 crore in Madhya
Pradesh and Rs 3606 crore in UP. Within the package, the ACA allocation was to the extent
of Rs 1953 crore in MP and Rs 1696 crore in UP. Increasing the irrigated area through major,
medium and minor irrigation projects and increasing the soil moisture regime through
watershed development constituted a major portion of the package allocation and ACA
allocation.
`
Figure 13: Share of irrigation and watershed programmes in Bundelkhand package
Thus about two thirds of the total Bundelkhand package and 50 to 61% of the ACA
allocation were earmarked for irrigation and watershed development programmes.
Essentially, the IWMP funds were converged with ACA funds for integrated watershed
management of arable lands. The IWMP fund convergence was to the extent of Rs 840 crore
in MP and Rs 480 crore in UP. Thus the package has fully focussed on the drought mitigation
activities.
Likely Physical Impact of the Package on Drought Mitigation
Completion of irrigation projects, new minor irrigation schemes, command area
development, and restoration / repairs/ renovation of different water bodies are the
irrigation projects supported by the package. Besides construction / renovation / recharge
of dug wells, distributing pump sets and HDPE pipes for individual farmers are also
supported under the package. Treatment of forest and arable lands for moisture
conservation through stop dams, check dams and regular watershed management practices
69%
61% 65%
50%
67%
56%
0%
10%
20%
30%
40%
50%
60%
70%
80%
Under the package ACA allocation
Madhya Pradesh
Uttar Pradesh
Bundelkhand

133
are also the key activities. The likely physical impact of these activities is summarized as
under:
Table 84 Anticipated impact of the Bundelkhand Package
Madhya Pradesh Uttar Pradesh
Hectares Hectares Increase in irrigated area Command Area Development of Rajghat Project
26,624 Command Area Development of Rajghat Project
69,500
New and ongoing minor irrigation projects (146)
50,232 Betwa Gursarai Canal System 27,000
Bariyarpur Medium Projects(1) 43,850 RRR scheme of canals 28400* Singhpur Barrage Medium Projects(1)
10,200 RRR of water Bodies 10000*
Canal Renovation (3) 24,391 HDPE Pipe distribution 17751* Distribution of Water lifting devices (pump sets)
60,000* Construction of New dug wells / blast wells
13251*
Recharge of dug wells / tanks/ ponds
30,864*
Renovation of dug wells 11,194* Others 300* Total 215,297 Total 208,260 Improvement in soil moisture regime Construction of Stop dams 3530 Treatment of forest area for soil & moisture conservation
200000 Treatment of forest area for soil & moisture conservation
60,000
Treatment of arable lands 400000 Treatment of arable lands 700000 Total 603530 760,000 *: Estimated
Overall the package when fully implemented would result in increasing the irrigated acreage
in the region by 4.23 lakh ha; 2.15 lakh ha in MP and 2.08 lakh ha in UP. This works out to
about 26% of the irrigated area in MP prior to the project and 25% in UP. Thus the additions
would be substantial. The irrigation coverage of the net sown area would increase from 45-
46% to 56% in either states and in the region.
The watershed management activities in arable lands would enhance the moisture regime
by about 4 lakh ha in MP and 7 lakh ha in UP constituting 22% and 38% of the net sown area
in the respective states. Besides, the treatment of forest lands would also enhance the soil
moisture regime in forest lands leading to increased vegetation. Thus overall, it can be
concluded that the package comprehensively addressed the issue of drought mitigation. If
properly implemented and the assets well maintained, the package would transform the
livelihood of the people in the region.
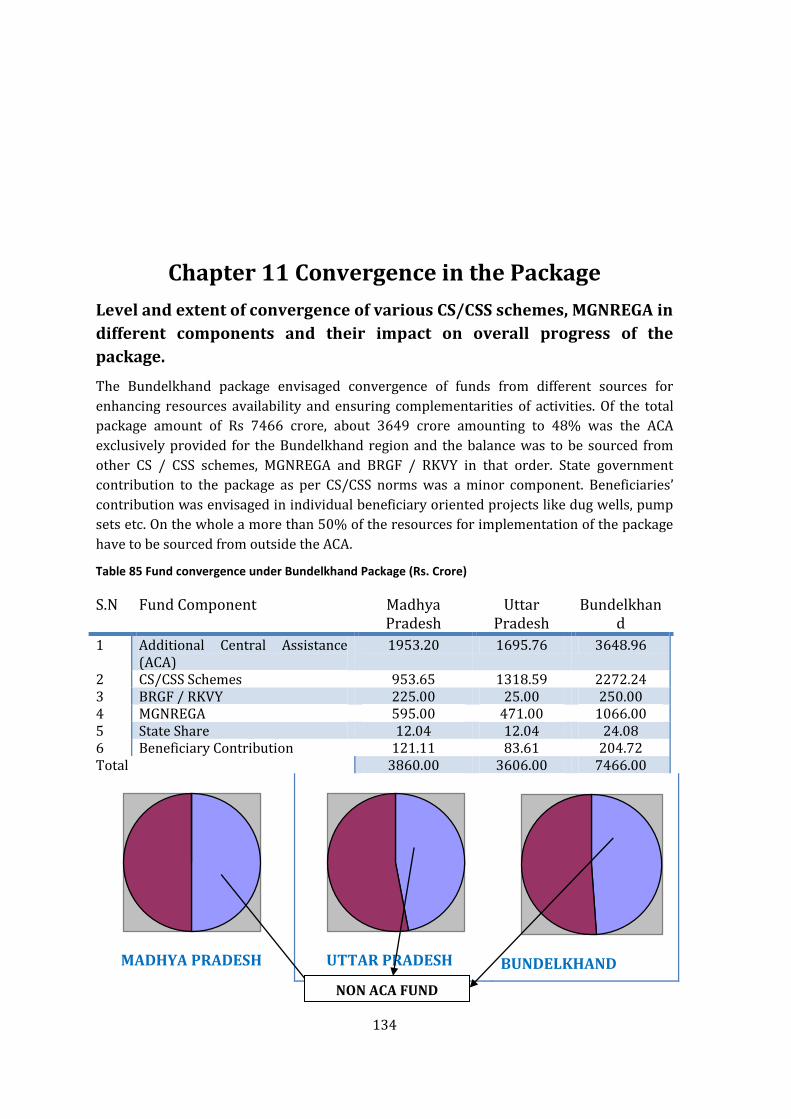
134
Chapter 11 Convergence in the Package
Level and extent of convergence of various CS/CSS schemes, MGNREGA in
different components and their impact on overall progress of the
package.
The Bundelkhand package envisaged convergence of funds from different sources for
enhancing resources availability and ensuring complementarities of activities. Of the total
package amount of Rs 7466 crore, about 3649 crore amounting to 48% was the ACA
exclusively provided for the Bundelkhand region and the balance was to be sourced from
other CS / CSS schemes, MGNREGA and BRGF / RKVY in that order. State government
contribution to the package as per CS/CSS norms was a minor component. Beneficiaries’
contribution was envisaged in individual beneficiary oriented projects like dug wells, pump
sets etc. On the whole a more than 50% of the resources for implementation of the package
have to be sourced from outside the ACA.
Table 85 Fund convergence under Bundelkhand Package (Rs. Crore)
S.N Fund Component Madhya Pradesh
Uttar Pradesh
Bundelkhand
1 Additional Central Assistance (ACA)
1953.20 1695.76 3648.96
2 CS/CSS Schemes 953.65 1318.59 2272.24 3 BRGF / RKVY 225.00 25.00 250.00 4 MGNREGA 595.00 471.00 1066.00 5 State Share 12.04 12.04 24.08 6 Beneficiary Contribution 121.11 83.61 204.72 Total 3860.00 3606.00 7466.00
MADHYA PRADESH UTTAR PRADESH BUNDELKHAND
NON ACA FUND

135
Figure 14 Share of ACA and Non ACA fund in Bundelkhand Package
Under ACA as also the CS, the flow of funds is smooth in the sense that 25 - 50% of the funds
are placed in advance with the states and further flow is ensured once the benchmarks set
for utilisation is achieved. The Sector wise / date wise release of ACA funds to MP and UP is
presented I Exhibits 1 and 2 respectively at the end of this chapter. The ACA funds and the
funds under CS /CSS schemes and RKVY / BRGF are routed through the consolidated funds
of the respective states. Only the MGNREGA funds are with the district administration and
the funds flow is contingent upon completion of certain designated tasks by the rural people.
By its very nature the activities under MGNREGA are taken up by rural households in their
respective villages while the activities supported by ACA / SC / SCC schemes are undertaken
by the line departments under the package. The outcome and implementation of the package
is very much dependent on the flow of funds from non ACA sources.
The releases against the allocated amounts from different sources are presented in Table 86.
Table 86 Release of funds from different sources under Bundelkhand Package
Source Madhya Pradesh Uttar Pradesh
Allocation Release as on 31 March 2013
Release as on 31 March 2014
Allocation Release as on 31
Dec 2012
Release as on 31 March 2014
ACA 1953.20 1880.32 1942.36 1695.76 1212.54 1212.55 CS /CSS 848.00 293.21 455.20 258.92 419.00 RKVY/MNREGA 210.00 33.01 NA 358.60 44.68 6.68
The release of funds under MNREGA has substantially lagged behind the releases under ACA
and CS / CSS schemes. Bulk of CS / CSS funds relate to IMWP under which the funds are
released over a period of 7 years and therefore the gap in releases under CS/CSS as shown
above should not be seen as constraint to implementation of the package.
In Uttar Pradesh, MNREGA funds were to be used in activities like earth works under lining
of canal projects, renovation of dug wells and tanks, watershed management activities in
forest areas. The slow release of funds from MNREGA to some extent would have affected
the progress of the activities as could be seen from the table 87.
Table 87 Physical progress of activities involving convergence of MGNREGA funds in UP
Activity Physical target Achievement Remarks
RRR of canals 39 Only 17 completed; 22 under progress
Full ACA amount released
Construction of New dug wells / blast wells
8834 3219 (36%) 75% ACA released
Recharge of dug wells / tanks/ ponds
30864 5442 (17%) 75% ACA released
Renovation of dug wells 11194 2665 (24%) 75% ACA released
Planning Secretary, Government of UP also opined that involvement of MNREGA funds in the
package has affected the progress of some of the activities.

136
At the same time in MP the involvement of MNREGA resources do not appear to have
affected the progress of implementation of the related activities as could be seen from Table
88.
Table 88 Physical progress of activities involving convergence of MGNREGA funds in MP
Activity Physical target Achievement Remarks
Construction of Stop dams
353 213 Full ACA amount released
Distribution of Water lifting devices (pump sets)
40000 31332 Full ACA amount released
A better coordination between various departments would have helped achieve the
satisfactory position in Madhya Pradesh.
Overall while convergence is good as it enhances the availability of funds from different
sources in a focussed manner to targeted sectors /activities, involving MGNREGA funds in
projects with specific time frame may hamper implementation in a smooth manner. Further
MNREGA works are typically non skilled, while majority of the activities contemplated
involve skilled labour. Therefore it is suggested that MNREGA funds need not be dovetailed
with other programmes of GoI. Where such convergence becomes essential, the state should
ensure better coordination between the implementing departments.

137
Exhibit 1 : Sector wise / Date wise Release of ACA Funds to Madhya Pradesh
Sector / Date of release Amount released in Rs crore
Agriculture 513
28/03/2011 270
15/03/2013 243
Animal Husbandry 72.7
30/08/2010 20.88
05/09/2011 29.46
28/02/2013 10.36
29/03/2013 12
Environment and Forest 107
31/03/2010 23.52
14/02/2012 46.03
27/02/2012 37.45
Rural Drinking water supply 100
27/06/2011 60
05/03/2012 40
Water Resources 878.16
31/03/2010 266.6
30/08/2010 39.871
12/11/2010 114.93
20/01/2011 175.5
09/03/2011 17.75
01/02/2012 119.67
28/02/2013 35.4
08/03/2013 6.274
20/03/2013 66.699
29/03/2013 35.466
Watershed management 210
30/03/2010 71.4
31/03/2012 138.6
Grand Total 1880.86
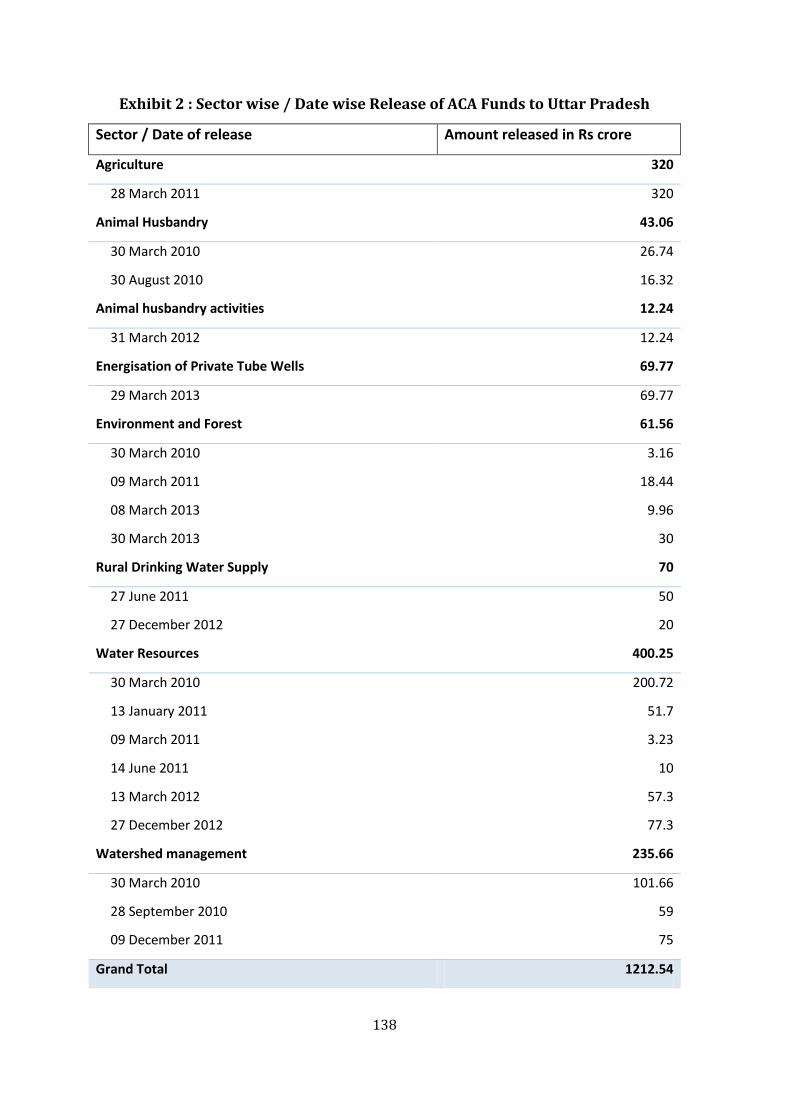
138
Exhibit 2 : Sector wise / Date wise Release of ACA Funds to Uttar Pradesh
Sector / Date of release Amount released in Rs crore
Agriculture 320
28 March 2011 320
Animal Husbandry 43.06
30 March 2010 26.74
30 August 2010 16.32
Animal husbandry activities 12.24
31 March 2012 12.24
Energisation of Private Tube Wells 69.77
29 March 2013 69.77
Environment and Forest 61.56
30 March 2010 3.16
09 March 2011 18.44
08 March 2013 9.96
30 March 2013 30
Rural Drinking Water Supply 70
27 June 2011 50
27 December 2012 20
Water Resources 400.25
30 March 2010 200.72
13 January 2011 51.7
09 March 2011 3.23
14 June 2011 10
13 March 2012 57.3
27 December 2012 77.3
Watershed management 235.66
30 March 2010 101.66
28 September 2010 59
09 December 2011 75
Grand Total 1212.54

139
Chapter 12 Monitoring of the Package
The monitoring of the implementation of the package at Government of India level is done as
under:
Regular visit of technical officers of NRAA
Visit by CEO of NRAA to the states for technical monitoring
Review meeting with Planning Secretary and Senior Officials of the State
Government by NRAA CEO
Meetings of Advisory Body for the Package at Planning Commission
At the state level, the state governments are required to monitor the projects as per their
internal guidelines and NRAA has not prescribed any structured monitoring of the projects
being implemented by the state departments.
Visit of NRAA officials
The visits of technical officers are by and large linked to status of implementation. As the
progress overall was at a better pace in Madhya Pradesh, more number of visits have been
undertaken in that state between 2010-11 and 2012-13.
Table 89 Visit of Technical Officers of NRAA to project sites
State Year No. of visits Coverage of districts
Madhya Pradesh 2009-10 2010-11 6 All the six districts 2011-12 5 All the six districts 2012-13 3 Five districts 2013-14
Uttar Pradesh 2009-10 2010-11 4 Six out of 7 districts 2011-12 3 All the seven districts 2012-13 3 Four districts 2013-14 1 Four districts
The CEO of NRAA has also visited the region as under:
Table 90 Visit of CEO, NRAA to the region
State Year No. of visits
Madhya Pradesh 2009-10 2010-11 2 2011-12 1 2012-13 2 2013-14
Uttar Pradesh 2009-10 2010-11 1 2011-12 2 2012-13 2 2013-14 2

140
The visits both by Technical team and CEO of NRAA to UP during 2013-14 were perhaps
necessitated to ensure speedy completion of projects which by and large were lagging
behind in the state.
Review Meetings with Principal Secretaries and Senior Government
officials of the Implementing departments
Between January 2010 and February 2014, a total of 5 meetings with Principal Secretary
and senior official of Govt of MP was held by NRAA. Similarly in UP, a total 6 meetings have
been held. There is no regularity in organising the meetings as could be seen from the chart
given in Fig --.
Advisory Meetings at Delhi
The Advisory Committee at Delhi is the overall authority for deciding the package
parameters and effecting changes in any of the parameters during the course of
implementation of the package. During the period 2009-10, the Advisory Body had met
three times i.e., in September 2010, June 2011 and December 2011 (Figure 16). There have
been no advisory meetings thereafter.

141
Months from Jan 2010 to February
2014
1 2 3 4 5 6 7 8 9 1
0
1
1
1
2
1
3
1
4
1
5
1
6
1
7
1
8
1
9
2
0
2
1
2
2
2
3
2
4
2
5
2
6
2
7
2
8
2
9
3
0
3
1
3
2
3
3
3
4
3
5
3
6
3
7
3
8
3
9
4
0
4
1
4
2
4
3
4
4
4
5
4
6
4
7
4
8
4
9
5
0
M
P
U
P
Figure 15 Meetings held with senior officials of state governments at state level.
Months from Jan 2010 to February 2014
1 2 3 4 5 6 7 8 9 1
0
1
1
1
2
1
3
1
4
1
5
1
6
1
7
1
8
1
9
2
0
2
1
2
2
2
3
2
4
2
5
2
6
2
7
2
8
2
9
3
0
3
1
3
2
3
3
3
4
3
5
3
6
3
7
3
8
3
9
4
0
4
1
4
2
4
3
4
4
4
5
4
6
4
7
4
8
4
9
5
0
Figure 16 Advisory meetings held at New Delhi

142
Chapter 13 Recommendation and Suggestions
Planning and implementation deficiencies and suggestions
The Bundelkhand package has been implemented by the Governments of Madhya Pradesh
and Uttar Pradesh in accordance with the terms of sanction by NRAA especially with respect
to the cost of the projects sanctioned. A few planning and implementation deficiencies have
been observed which in a way pre-empted realisation of the full impact of the package in
drought mitigation within the stipulated time period. With Bundelkhand II package on the
anvil, the following few critical areas need to be addressed for enhancing the overall impact
of the package.
Delays in implementation of the projects
The major plank of the Bundelkhand package is drought proofing of the region within a time
frame of three years i.e., by 2012-13. However a large number of projects were found to be
on going even during period of field visits i.e., February – May 2014; besides a number of
projects were completed with delay. Some of the projects which experienced significant
delay are include the following
All the market yards projects and rural infrastructure nuclei projects in UP are
ongoing and yet to be completed; administrative delays in taking decision as to the
location of the projects , delays in land acquisition are sighted as the major reasons
All the ground water irrigation projects in UP which support the individual farmers
are found to suffer delays in completion due to convergence of MNREGA projects
with ACA funds for completing the activity
Several minor, medium and major surface irrigation projects in UP experienced
delay due to land acquisition problems, contractors not fulfilling commitment, very
limited work period available for water bodies renovation due to release of water
continually in the canals etc.,
The stop dams projects Madhya Pradesh also suffered delays due to insufficient
man power, tendering and land acquisition problems.
In general in both the states poor response to tendering process resulted in
retendering; besides open tendering in initial stages in UP resulted further delays in
processing
To overcome the above difficulties, the state governments may consider instituting
transparent mechanisms for tendering, land acquisition, tough penalties for way ward
contractors etc. Besides the administration should, with people’s involvement, work
towards increasing the working period during the year. As MNREGA funds are to be released
by the district administration, effective coordination between the implementing
departments and administration has to be ensured from the higher level decision making
authorities in the states.

143
Convergence a hindrance to implementation?
At the time of formulation of the package, convergence of various activities / sectors was
envisaged so as to pool all the resources available for drought mitigation to achieve this
common objective. Accordingly the package was funded by ACA, CS / CSS funds, RKVY,
MNREGA besides state and owners contribution. As already seen from the chapter on
Convergence, while no difficulty has been faced by the implementing authorities in sourcing
funds from other sources, funds availability from MNREGA has been a source of concern and
projects involving partial funding from MNREGA had invariably experienced delays. This is
pronounced in dug well projects and RRR of water bodies, where part of the work is funded
by ACA and the balance from MNREGA. Besides MNREGA funds can be utilised for unskilled
works while most of the projects required skilled labour for execution. In this context, it is
suggested that
Convergence of funds from MNREGA for the same activity may be avoided
In case it is required for funds augmentation, the complete activity has to be funded
from single source
Besides it was also found that there are activities like watershed development in arable
lands, crop production programme for drought mitigation which form part of the package
but fully funded by CS / CSS schemes without any commitment from ACA. Such activities are
not properly monitored and reported to NRAA with the result that monitoring is mostly
restricted to ACA package. The state governments also focus mostly on ACA funded
activities. Therefore an umbrella body including NRAA and the Various Ministries whose
funds are sought to be involved has to review the progress of the package. Alternatively the
focus of NRAA can be only ACA funds without envisaging any convergence from other
sources.
Revisiting projects involving support for individuals
Under the package two types of projects were implemented with reference to the project
entity:
3. Departmentally implemented projects which benefit a large number of farmers in a
geographical area
4. Individual beneficiary projects like dug wells, lifting devices, supply of HDPE pipes,
income generating activities like bull induction, goatery etc.
The latter type of projects were found to suffer from the following
Tentativeness in fixing targets
Complaint of bias in beneficiary selection
Slow progress and inability to ensure proper quality control
Problems in monitoring due to large number of beneficiaries spread over the
districts
Tendency to develop liking for only fully subsidised projects from the government
We are of the opinion that individual beneficiary oriented projects may be taken out of
purview of such packages and they may be implemented like any other CSS with funding
from bankers and individuals. A larger share of subsidy can be envisaged considering the
drought in the region. This would ensure proper implementation, endues and monitoring of
the funds. The complaint of bias in beneficiary selection can also be precluded

144
Post harvest getting equal focus as drought mitigation
The Bundelkhand package was aimed to be a drought mitigation package with focus on
irrigation and watershed management activities. While this was ensured by converging
funds from CS / CSS schemes, it is observed that there was an equal emphasis on post
harvest market infrastructure in terms of market yards and warehouses especially in UP
where post harvest sector was the largest beneficiary of the ACA funding. While these
infrastructure are required to take care of the enhanced production arising out of drought
mitigation activities, they are not immediately needed as the irrigation / watershed projects
will take time to yield full results and the post harvest infrastructure created in anticipation
of the increased production may be fully utilised only after four to five years; till such time
the maintenance of the structures has to be funded from budgetary sources. Besides, the
attention of the funding agency also gets diluted from the drought mitigation activities.
Therefore it is suggested that post harvest infrastructure may be funded with a lag perhaps
with a built in second phase in the package.
Absence of structured monitoring mechanism of the package
In the guidelines relating to the implementation of the package, no structured monitoring
studies / visits had been suggested to the state governments; nor has structured review of
the progress of the package been envisaged both at the state level and NRAA level. While
discussions with the state authorities revealed that they have frequent meetings /
interactions with the implementing departments, it is felt that this has not been effective
especially in UP as could be seen from the delays in project execution; besides proper post
project follow up was lacking especially in diary projects in Uttar Pradesh.
At NRAA level again there are no structured visits; need based visits are undertaken by the
Technical Officer and CEO of the NRAA at different intervals. During the four years of
implementation of the package, the Technical Team has visited the project sites several
times. The CEO has visited the project sites 5 times in MP and 7 times in UP. Meetings with
Planning Secretary and senior officials of the State governments were held only 5 times for
MP and six times for UP. Structured quarterly meetings with Planning Secretaries of the
state governments with structured agenda may be conducted for ensuring speedy and
proper implementation of the package
Absence of structured review by Advisory Body
The advisory body is the apex body in the Planning Commission to sanction the package,
monitor the progress of implementation and advise and approve midcourse correction
during the implementation phase of the package. The meetings of the Advisory Body give
strong signals to the States for effective implementation of the package. It was observed that
between 2009-10 and 2013-14, only three Advisory Body meetings were held one in
September 2010, the second one in June 2011 and the last one in December 2011. Thus
there is no periodicity of the meetings and after no meeting has been held after December
2011. It is suggested that the Advisory Body meets at least once in a half year as it would
transmit the seriousness of the funding agency to the implementing states for faster
implementation of the projects.

145
Inadequate reporting system to NRAA
The reports submitted to NRAA on the physical achievements are aggregates of a large
number of projects and it is difficult to ascertain whether the projects are complete or not.
Many a time, while the reports submitted by the states indicate full achievement of the
targeted physical programme under the sector/ group of similar projects, yet field visits
revealed that many individual projects forming part the sector/ group were ongoing as on
the dates of the consultants field visits and were slated for completion even one year hence.
Thus while at the aggregate level, the targets seem to have been achieved, yet in reality there
exists a gap in achievement which is not captured in the present reporting system of the
states to NRAA. A robust MIS is required that would provide project specific progress on a
quarterly basis needs to be introduced. The services of professional MIS experts may be
availed in developing a robust reporting system and a Project Monitoring Unit can be set up
in NRAA by outsourcing the same from professional consultancy organisations
Absence of concurrent / midterm monitoring and evaluation mechanism
by third parties
By design the package has not envisaged a mechanism for third party monitoring of the
package/ concurrent evaluation. Such processes are necessary component of any
programmes. It is suggested that provision may be made at the time of formulation of the
package for third party monitoring. Professional consultancy organization can be roped in
for this purpose.
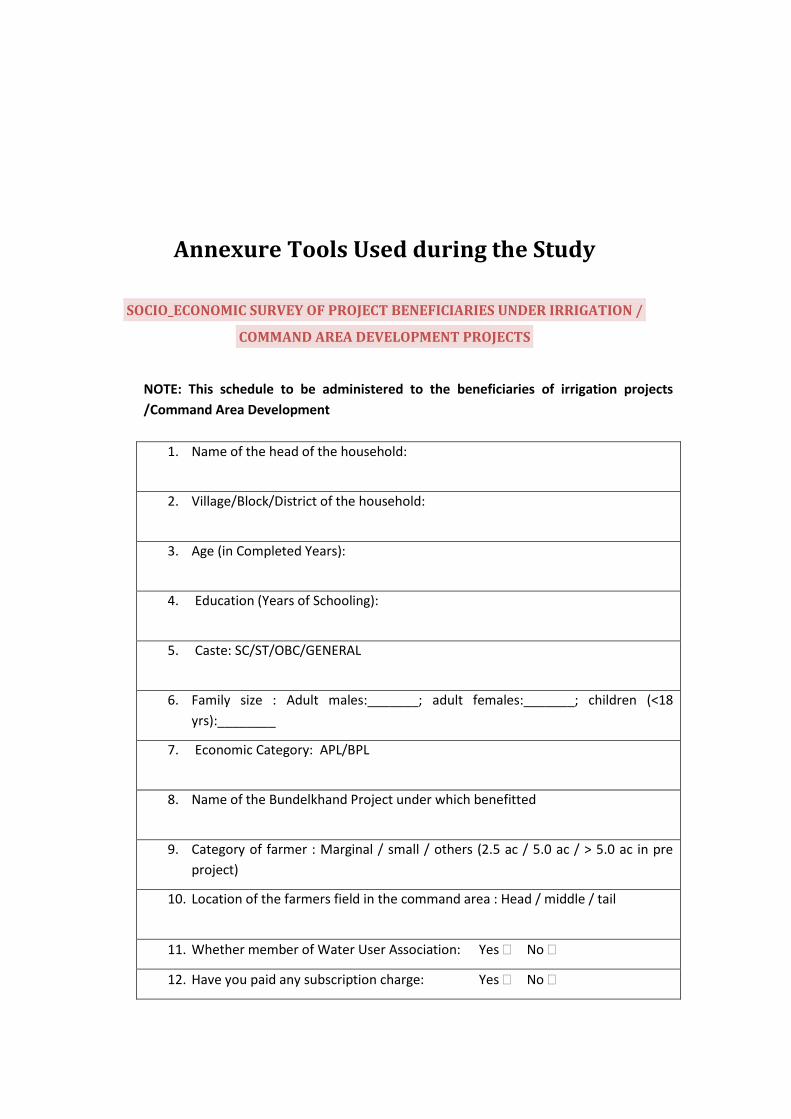
Annexure Tools Used during the Study
SOCIO_ECONOMIC SURVEY OF PROJECT BENEFICIARIES UNDER IRRIGATION /
COMMAND AREA DEVELOPMENT PROJECTS
NOTE: This schedule to be administered to the beneficiaries of irrigation projects
/Command Area Development
1. Name of the head of the household:
2. Village/Block/District of the household:
3. Age (in Completed Years):
4. Education (Years of Schooling):
5. Caste: SC/ST/OBC/GENERAL
6. Family size : Adult males:_______; adult females:_______; children (<18
yrs):________
7. Economic Category: APL/BPL
8. Name of the Bundelkhand Project under which benefitted
9. Category of farmer : Marginal / small / others (2.5 ac / 5.0 ac / > 5.0 ac in pre
project)
10. Location of the farmers field in the command area : Head / middle / tail
11. Whether member of Water User Association: Yes No
12. Have you paid any subscription charge: Yes No

13. What are the charges: Rs.
14. Year from which project benefits accruing to the farmer (please tick)
2009-10 2010-11 2011-12 2012-13
CARE : The year in which the project benefits accrue to the farmer becomes the “project year” for
the beneficiary and the project benefits to be captured from that year to 2012-13 and pre
project details to be collected for three years prior to the “project year”

15. Land holding including owned land / leased in / acquired through mortgage minus leased out / given under mortgage (in acres)
Particular 2007-08 2008-09 2009-10 2010-11 2011-12 2012-13
Ra
infe
d
Irri
ga
ted
Ra
infe
d
Irri
ga
ted
Ra
infe
d
Irri
ga
ted
Ra
infe
d
Irri
ga
ted
Ra
infe
d
Irri
ga
ted
Ra
infe
d
Irri
ga
ted
Own Land (1)
Leased in Land (2)
Land Acquired
through mortgage (3)
Land leased out (4)
Land given on
mortgage (5)
Total (1+2+3-4-5)

16. Cropping pattern (acres)
Crop / Season Rainfed /
Irrigated
2007-08 2008-09 2009-10 2010-11 2011-12 2012-13
Kharif
Rabi
Gross cropped area

17. Seed replacement rate (Area to be given in acre)
Crop / Season 2007-08 2008-09 2009-10 2010-11 2011-12 2012-13
Area
under
Farm
Saved
Seed
Area
under
Certified
seed
Area
under
Farm
Saved
Seed
Area
under
Certified
seed
Area
under
Farm
Saved
Seed
Area
under
Certified
seed
Area
under
Farm
Saved
Seed
Area
under
Certified
seed
Area
under
Farm
Saved
Seed
Area
under
Certified
seed
Area
under
Farm
Saved
Seed
Area
under
Certified
seed
Khariff
Rabi

18. Number of irrigations provided for each irrigated crop
Name of the
irrigated crop
Acreage Number of irrigations provided
2007-08 2008-
09
2009-
10
2010-
11
2011-
12
2012-13
Kharif
Rabi

19. Production (in kg)
Crop /
Season
Rainfed /
Irrigated
No. of
acres
2007-08 2008-09 2009-
10
2010-
11
2011-
12
2012-
13
Rate
per
quintal
during
2012-
13
Kharif
Rabi

20. Annual household income (Rs )
Sl.
No.
Sources of Income 2007-08 2008-09 2009-10 2010-11 2011-12 2012-13
01 Agriculture/farm sources
02 Livestock (sale & products)
03 Wages (agriculture/farm)
04 Wages (non-farm)
05 Wages (MGNREGA)
06 Salaried employment
07 Income from NFS activities
08 Others specify
____________________
Total
21. Days of employment (number of days)
Particulars No. of
members
2007-08 2008-09 2009-10 2010-11 2011-12 2012-13
Family
labour
On farm
employment
Off farm
employment
MNREGA
employment
Hired wage
labourers
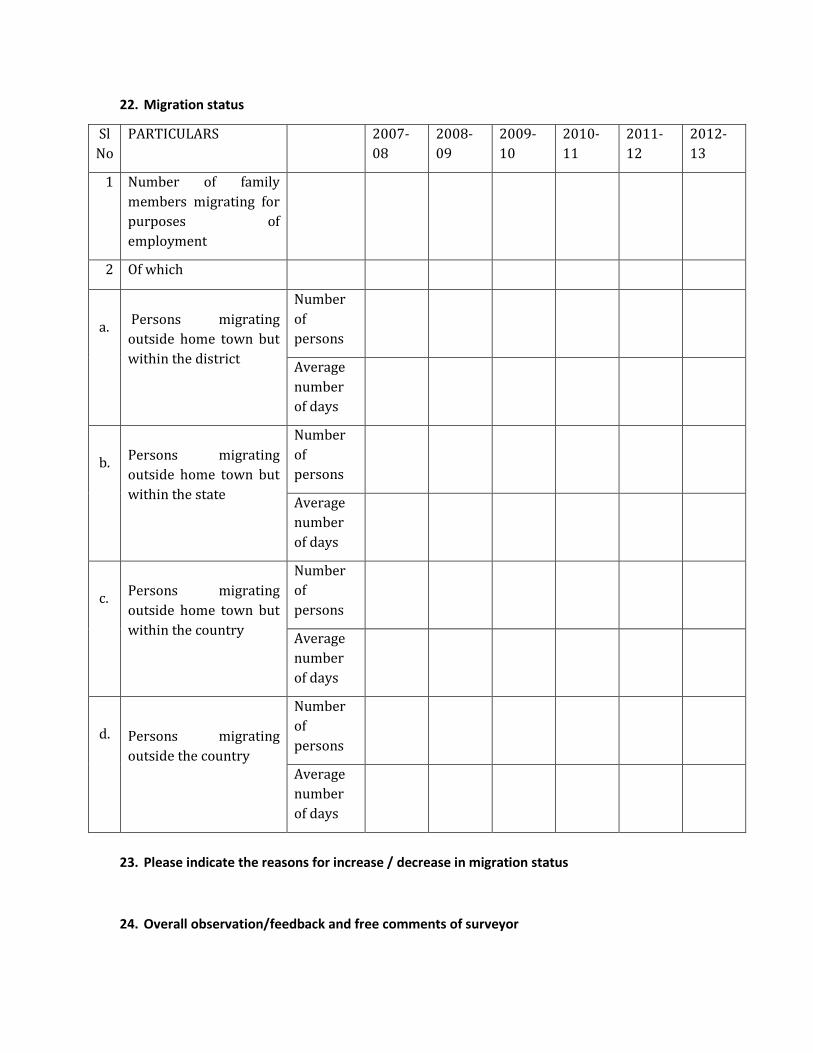
22. Migration status
Sl
No
PARTICULARS 2007-
08
2008-
09
2009-
10
2010-
11
2011-
12
2012-
13
1 Number of family
members migrating for
purposes of
employment
2 Of which
a. Persons migrating
outside home town but
within the district
Number
of
persons
Average
number
of days
b. Persons migrating
outside home town but
within the state
Number
of
persons
Average
number
of days
c. Persons migrating
outside home town but
within the country
Number
of
persons
Average
number
of days
d. Persons migrating
outside the country
Number
of
persons
Average
number
of days
23. Please indicate the reasons for increase / decrease in migration status
24. Overall observation/feedback and free comments of surveyor

DEEPENING OF WELL
1. Name of the household head:
2. Village/Block/District of the household:
3. Age (in Completed Years):
4. Education (Years of Schooling):
5. Caste: SC/ST/OBC/GENERAL :
6. Family size : Adult males: ________; Adult Females:________; Children (<18 yrs):_______
7. Economic Category: APL/BPL
8. Total Land holding (acre)
9. Category of farmer : Marginal / small / others (2.5 ac / 5.0 ac / > 5.0 ac in pre project)
10. Year in which deepening was undertaken: _______________
11. How was the deepening done? Through blasting/ other methods (Specify):
_____________________________________________________________________________________________
___________________________________________________
CARE : The year in which the activity was undertaken becomes the “project year” for the beneficiary
and the project benefits to be captured from that year to 2012-13 and pre project details to
be collected for three years prior to the “project year”
12. Physical dimensions
Total Depth of Well (in meters) : Before Project: ………………… After Project: ……………
Diameter of Well (in meters) : Before Project: ………………… After Project: ……………

13. Cost of the works and sources of funds
I. Cost of Work Amount (Rs)
(a) Cost of deepening
(b) Any other cost incurred
(specify)
Total cost(a+b+c)
II. Source of funds
(a) MNREGA
(b) ACA
(c) Beneficiary contribution
(d) Others
Total(a+b+c+d)
14. Impact of implementation of Deepening on water levels:
(a) Water level (in m., BGL1) in mid June in the well : Before Project………… After
Project…………...
(b) Water level (in m., BGL) in mid November in the well: Before Project……….. After
Project………….
(c) Average Water Column (in m.) in Well during Rabi : Before Project…..…… After
Project………….
1 BGL= Below Ground Level

(d) Total CCA in (Acre) : Before Project..…………… After
Project…………
15. How successful is the deepening of well
Overall observation/ feedback and free comments of Surveyor:

NEW DUG WELLS
1. Name of the household head:
2. Village/Block/District of the household:
3. Age (in Completed Years):
4. Education (Years of Schooling):
5. Caste: SC/ST/OBC/GENERAL :
6. Family size : Adult males: ________; Adult Females:________; Children (<18 yrs):_______
7. Economic Category: APL/BPL
8. Total land holding (Acre):
9. Category of farmer : Marginal / small / others (2.5 ac / 5.0 ac / > 5.0 ac in pre project)
10. Year in which the well was constructed: ____________
CARE : The year in which the activity was undertaken becomes the “project year” for the beneficiary
and the project benefits to be captured from that year to 2012-13 and pre project details to
be collected for three years prior to the “project year”
11. Physical dimensions
Diameter of the well (in meters) :
Depth of well (in meters) :
Type of pumpset : Diesel / Electric :
Purchased pumpset : From package
From own funds
HP of pumpset :

12. Cost of the works and sources of funds
I. Cost of Work Amount Rs
(a) Cost of well
(b) Cost of lifting device installed if
any
(c) Any other cost incurred
(specify)
Total cost (a+b+c)
II. Source of funds
(a) MNREGA
(b) ACA
(c) Beneficiary contribution
(d) Others
Total (a+b+c+d)
13. Impact of implementation on water levels:
(a) Water level (in m., BGL2) in mid June in the well :
(b) Water level (in m., BGL) in mid November in the well:
(c) Average Water Column (m) in Well during Rabi :
(d) Total CCA in Hectares :
2 BGL= Below Ground Level

14. Cropping pattern (acres)
Crop /
Season
Rainfed /
Irrigated
Pre Proejct Year of well
Construction
Post Project
Kharif
Rabi
Gross cropped area

15. Number of irrigations provided for each irrigated crop
Name of the
irrigated crop
Acreage Number of irrigations provided
Pre Project Year of
Construction
of Well
Post Project
Kharif
Rabi

16. Production (in kg)
Crop /
Season
Rainfed
/
Irrigated
No. of
acres
Pre Project Year of
Construction
of Well
Post Project Rate
per
quintal
during
2012-
13
Kharif
Rabi

17. Annual household income (Rs )
Income before construction of Dug Well: ______________________________
Income after Construction of Dug Well: _______________________________
Change in income due to construction of Dug well;________________________
18. Overall observation/ feedback and free comments of Surveyor

MAJOR / MEDIUM/ MINOR IRRIGATION PROJECTS /COMMAND AREA DEVELOPMENT
1. Name of the project:
2. Size of project: Major/ Medium/ Minor
3. Status of project: Ongoing project/ New Project
4. Location and address :
5. Implementing department:
6. Land required for the project:
7. Ownership of land : Government / acquired from farmers/ others
8. Important dates
(a) Date of administrative
approval
(dd/mm/yyyy)
(b) Date of completion of
land acquisition
(dd/mm/yyyy)
(c) Date of floating tenders
(dd/mm/yyyy)
(d) Type of Tendering e-
tendering or open
tendering
(e) Date of award of tender
(dd/mm/yyyy)
(f) Date of commencement
of works
(dd/mm/yyyy)
(g) Expected date of
completion of works as
per contract
(dd/mm/yyyy)
(h) Date of completion /
likely date

(i) Reasons for delay if
any
9. Physical Works taken up/carried out (To be identified by the Surveyor):
Construction of dams / bunds and canals
Excavation of Canal, Sectioning of Canal, Lining of Canal, Construction of Regulator gates,
Laying of Distribution System in the canal command area, Type of Distribution System viz
Open Channel or UGPL.
Renovation, Completion & Repair of Canals, Weir & Check/Stop Dam
De-silting, Re-sectioning of Canal, Repair of Weir/Check Dam, Lining of Canal, Repair of
Regulator gates, Renovation of Distribution System, Replacement of Open Channel
Distribution System with UGPL etc.
Renovation, Completion & Repair of Tanks, Ponds and Bundhies
De-silting, Repair of Fore Shore, Repair of Dam, Catchment Treatment, Repair of Regulator
gates, Renovation of Distribution System, Replacement of Open Channel Distribution System
with UGPL
10. Status of completion of the project (please attach photos)
Type of infrastructure Physical quantity Stage of
completion
(%)
Remarks
Target Achieved
Length of main canal
Length of subsidiary and
networks
Length of irrigation
canals lined under the
package (meter)

11. Cost of project (cost of land if acquired may also be
included) Rs lakh
Type of infrastructure Cost as per project
estimates
Expenditure
actually
incurred
Remarks
12. Sources of funding (Rs lakh)
Sources Allocated
amount
Released
amount
Amount
actually
expended
ACA releases
State contribution
Subsidy under CSS scheme of Govt of
India
Other sources (pl specify)
Total
13. Impact
Particulars 2008-09 2009-10 2010-11 2011-12 2012-13 2013-14
Water storage capacity
Carrying capacity of canal
(cusec/cumec)
Designed
Capacity
Actual Capacity

CCA (ha)
Irrigation potential (ha)
Irrigated area during rabi
season (ha)
Adequacy and reach of irrigation water to farmers in command area
Discharge of
water at head
reach
Quantum of
water reaching
the tail end
Frequency of release of water in the canal system and frequency of disruptions during release
Frequency of
release of water
Frequency of
disruptions
during release
Seepage in cusec in the
lined sections of Canal
Cropping pattern details
under the command
Cropping intensity (%)
Number of villages
benefitted from the
project
Total Number of HH
benefitted from the
Project
14. Process of implementation of the project:
15. Any convergence between various departments in implementing the project? If
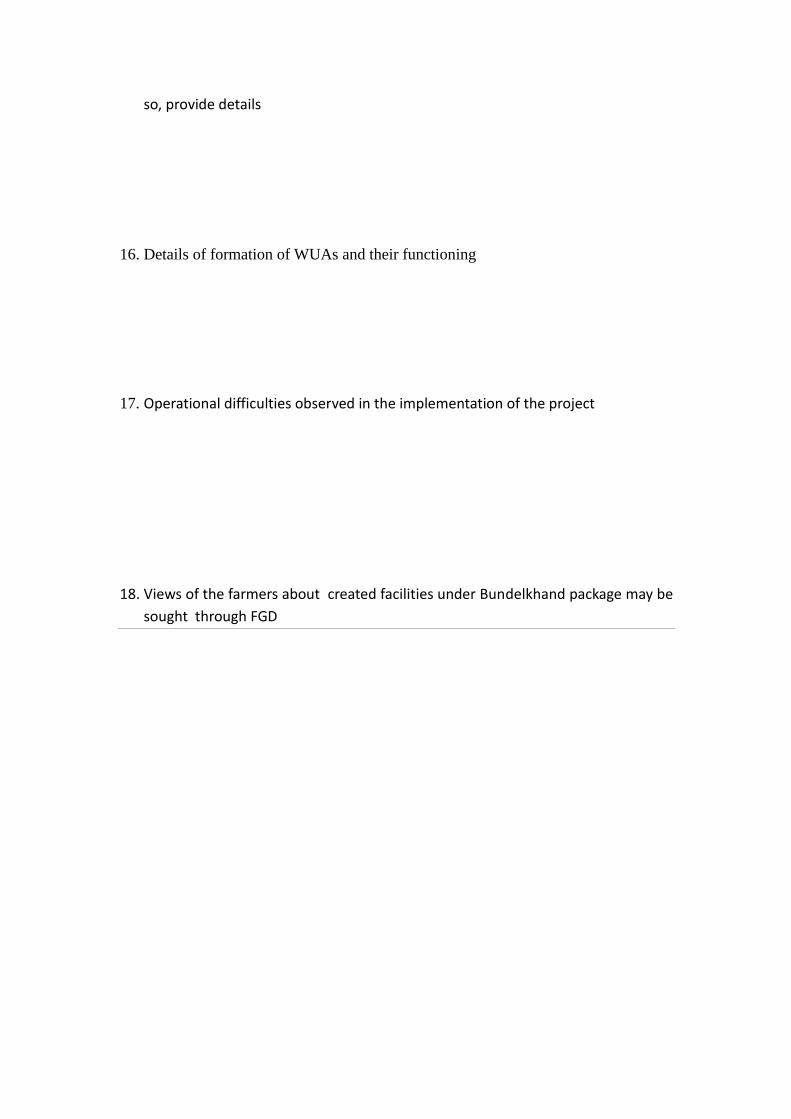
so, provide details
16. Details of formation of WUAs and their functioning
17. Operational difficulties observed in the implementation of the project
18. Views of the farmers about created facilities under Bundelkhand package may be
sought through FGD

CONSTRUCTION OF NEW WEIR, STOP/CHECK DAM
1. Name of the project:
2. Location and address :
3. Implementing department:
4. Land require for the project
5. Ownership of land : Government / acquired from farmers/ others
6. Important dates
Date of administrative approval
(dd/mm/yyyy)
Date of completion of land acquisition
(dd/mm/yyyy)
Date of floating tenders
(dd/mm/yyyy)
Whether E-tendering or Open
Tendering
Date of award of tender
(dd/mm/yyyy)
Date of commencement of works
(dd/mm/yyyy)
Expected date of completion of works
as per contract (dd/mm/yyyy)
Date of completion / likely date
Reasons for delay if any
7. Name of the consulting agency/ Consultant deputed
a. Role of the Consulting agency/ Consultant deputed
b. Whether the role confined till designing or supervision till end of
implementation of project?
_________________________________________________________________________________________

_________________________________________________________________________________________
__________________________________________________________________________
c. Why was consultation taken (To ascertain whether there exist lack of man
power or lack of proficiency among the officials).
_________________________________________________________________________________________
_________________________________________________________________________________________
________
d. Main work of the Rural Engineering Services:
_________________________________________________________________________________________
_________________________________________________________________________________________
________
e. Has the work of package added additional work load among the officials of
the department.
_________________________________________________________________________________________
_________________________________________________________________________________________
________
8. Physical Works taken up/carried out (To be identified by the Surveyor):
Length of the Weir ( in meters)
Height of the Weir ( in meters)
Type of Weir (Diversion Weir/Storage Weir)
Length of the Stop/Check Dam
Height of the Stop/Check Dam
9. Status of completion of the project (please attach photos)
Type of infrastructure Physical quantity Stage of
completion
(%)
Remarks
Target Achieved
10. Cost of project (cost of land if acquired may also be
included) Rs lakh
Type of infrastructure Cost as per project
estimates
Expenditure
actually
incurred
Remarks

Total
11. Sources of funding (Rs lakh)
Sources Allocated
amount
Released
amount
Amount
actually
expended
ACA releases
State contribution
Subsidy under CSS scheme of Govt of
India
Other sources (pl specify)
Total
12. Impact
Year of construction of Stop Dam
Pre
(year to be
written here)
__________ Post
No of stop dams on the
Nalla
No of beneficiaries
Water storage capacity
CCA (ha) direct irrigation
CCA (ha) indirect
irrigation
Irrigated area during rabi
season
Water levels in the nearby
wells
Cropping Pattern

13. Was is right to construct the stop dam (To ascertain opinion of the official on the
need of the project):
__________________________________________________________________
__________________________________________________________________
__________________________________________________________________
_________
14. Any convergence between various departments in implementing the project?? If
so, provide details
15. Number of farmers benefitted from construction of stop dams.
16. How have beneficiaries gained from the construction of stop dam (To ascertain pre
and post status on the cultivation practices of farmers)
17. Operational difficulties observed in the implementation of the project
18. Views of the farmers about created facilities under Bundelkhand package may be
sought through FGD. ( To ascertain from the farmers, area added under
irrigation, number of farmers benefitted from the construction of stop dam,
changes in cropping patter, change in production/ productivity etc and
satisfaction of farmers)

INSTALLATION OF PUMPSETS IN KAPILDHARA WELLS (MP)
1. Name of the head of the household:
2. Village/Block/District of the household:
3. Age (in Completed Years):
4. Education (Years of Schooling):
5. Caste: SC/ST/OBC/GENERAL
6. Family size : Adult males:______; Adult females:_______; Children (<18 yrs):_______
7. Economic Category: APL/BPL
8. Total land holding (acre):
9. Category of farmer : Marginal / small / others (2.5 ac / 5.0 ac / > 5.0 ac in pre
project)
10. Year in which the wells were constructed: ____________
11. Year in which the pumpset was installed: _____________
12. Type of pumpset installed: Diesel/ Electric
13. HP of pumpset: _________________
14. Well constructed through: MGNREGA/ Other schemes
(spcify)________________
15. Labour employed: Family labour/ Hired labour
16. Cost of construction (in Rupees): Rs. ______________________
CARE : The year in which the activity was undertaken becomes the “project year” for the
beneficiary and the project benefits to be captured from that year to 2012-13 and pre
project details to be collected for three years prior to the “project year”
17. Physical dimensions
Diameter of the well (in meters) :
Depth of well (in meters) :

18. Impact of implementation of the works on water levels:
(a) Water level (in m., BGL) in mid June in the well :
(b) Water level (in m., BGL) in mid November in the well:
(c) Average Water Column (m) in Well during Rabi :
(d) Total CCA in Hectares :
19. Cropping pattern (acres)
Crop /
Season
Rainfed
/
Irrigated
Pre
Intervention
Year of
installation
of pumpset
Post
Intervention
Kharif
Rabi
Gross
cropped
area

20. Number of irrigations provided for each irrigated crop
Name of the
irrigated crop
Acreage Number of irrigations provided
Pre Intervention Year of
Installation
of Pumpset
Post
Intervention
Kharif
Rabi

21. Production (in kg)
Crop /
Season
Rainfed
/
Irrigated
No. of
acres
Pre Intervention Year of
Installation
of Pumpset
Post
Intervention
Rate
per
quintal
during
2012-
13
Kharif
Rabi

22. Annual household income (Rs )
Sl.
No.
Sources of Income 2007-08 2008-09 2009-
10
2010-11 2011-12 2012-13
01 Agriculture/farm sources
02 Livestock (sale & products)
03 Wages (agriculture/farm)
04 Wages (non-farm)
05 Wages (MGNREGA)
06 Salaried employment
07 Income from NFS activities
08 Others specify
____________________
Total
23. Days of employment (number of days)
Particulars No. of
members
2007-08 2008-09 2009-10 2010-11 2011-12 2012-13
Family
labour
On farm
employment
Off farm
employment
MNREGA
employment
Hired wage
laborers

24. Migration status
Sl
No
PARTICULARS 2007-
08
2008-
09
2009-
10
2010-
11
2011-
12
2012-
13
1 Number of family
members migrating for
purposes of
employment
2 Of which
a. Persons migrating
outside home town but
within the district
Number
of
persons
Average
number
of days
b. Persons migrating
outside home town but
within the state
Number
of
persons
Average
number
of days
c. Persons migrating
outside home town but
within the country
Number
of
persons
Average
number
of days
d. Persons migrating
outside the country
Number
of
persons
Average
number
of days
25. Did the scheme convergence with MGNREGA brought any benefits to the
farmer?

26. Please indicate the reasons for increase / decrease in migration status
Overall observation/ feedback and free comments of Surveyor

INTEGRATED MARKET YARD COMPLEX/ HAAT BAZARS/ RURAL INFRASTRUCTRE
NUCLEUS
1. Name of the project:
2. Location and address :
3. Implementing department:
4. Land details : Extent of land
5. Ownership of land : Government / acquired from farmers/ others
6. Important dates
(a) Date of administrative approval
(b) Date of completion of land
acquisition
(c) Date of floating tenders
(dd/mm/yyyy)
(d) Date of award of tender
(dd/mm/yyyy)
(e) Name of Construction Agency
(f) Date of commencement of works
(dd/mm/yyyy)
(g) Status of Work Completed In Progress Not yet
started
(h) Expected date of completion of
works as per contract
(i) Date of completion (if
completed)
(j) Likely date of completion
(k) Reasons for delay if any

7. Status of completion of the project (please attach photos)
Type of infrastructure Physical quantity Stage of
completion
(%)
Remarks1
1 Overall observation and remark can be given in additional sheet
8. Cost of project (cost of land if acquired may also be included) Rs.
lakh
Type of infrastructure Cost as per project
estimates
Expenditure
actually
incurred
Remarks2
2 Overall observation and remark can be given in additional sheet

9. Sources of funding (Rs lakh)
Sources Allocated
amount
Released
amount
Amount
actually
expended
(a) ACA releases
(b) State contribution
(c) Subsidy under CSS scheme of
Govt of India
(d) Other sources (pl specify)
Total
10. Coverage of Market Yard (Number and name of villages);
a. Number of villages:
b. Name of villages: _____________________________________________
____________________________________________________________
____________________________________________________________
11. Commodities notified in Market Yard and Market fee being charged;
12. Any convergence between Mandi Board, Warehousing Corporation and
Marketing Federation envisaged? If so, provide details

13. Please collect arrival details of commodities if the project is undertaken in
existing market yards (unit in Metric Tonne)
Commodity 2009-10 2010-11 2011-12 2012-13
14. Operational difficulties observed in the implementation of the project
15. What is role of Traders in Mandi
a. View of Traders
b. Their role
c. Issues faced
d. Prospects
16. Views of the farmers about created facilities under Bundelkhand package
may be sought through FGD (Give detailed write up)

GOATERY UNITS IN BUNDELKHAND REGION
Sl. No. ________
1. Name of the head of the household:
2. Village/Block/District of the household:
3. Caste: SC/ST/OBC/GENERAL
4. Family size : Adult males --------; adult females ---------; children (<18 yrs) ----
---
5. Economic Category: APL/BPL
6. Category of farmer : Marginal / small / others (2.5 ac / 5.0 ac / > 5.0 ac in pre
project)
7. Details of other animals owned : Cows-----; buffaloes-------; others-------
8. Year in which goats were received:
9. Details of goats purchsed :
Particulars Nos of animal given
Age of animal
Cost/animal Date of purchase
Name of breed
Source of Purchase
Male
Female
Total
Major Phenotypic Characters of given animal -------------------------------------------------------
------------------------------------------------------------------------------------------------------------------------
------------------------------------------------------------------------------------------------------------------------
Purpose of goatery unit- Milk production/ Meat production
Tagging details -------------------------------------------------------------------------------------------
10. Cost of animal and sources of funds
Cost of animals
Insurance cost
Transport cost
Total cost
ACA funds

Beneficiary contribution
Other sources
Total funds
11. Income generation : 2012-13
Income through sale of goats and milk
Maintenance cost of animal incl. labour
charges
Net income
12. Number of animals as on the date of visit:
Adult males Adult females Male kids Female kids
13. Opinion survey
1. Criteria followed by the department for selection of the farmer for the
scheme
2. How the quality of the animals was ensured at the time of purchase
3. Who maintains the goat unit
4. What are the feeding practices followed
5. Feeding practices followed

6. Comments on housing to the animal
7. Marketing arrangements
8. Availability of veterinary facilities
9. Any other problems faced by the farmer

SCHEDULE FOR INDUCTION OF BREEDING BULLS IN BUNDELKHAND AREA
Sl. No. ________
1. Name of the head of the household:
2. Village/Block/District of the household:
3. Caste: SC/ST/OBC/GENERAL
4. Family size : Adult males --------; adult females ---------; children (<18 yrs) -------
5. Economic Category: APL/BPL
6. Category of farmer : Marginal / small / others (2.5 ac / 5.0 ac / > 5.0 ac in pre
project)
7. Details of other animals owned : Cows-----; buffaloes-------; others-------
8. Year of Induction of buffalo bull:
9. Details of male buffalo purchased
Date of purchase
Place of purchase
Agency from whom purchased
Name of the breed
Age at the time of purchase (yrs & months)
Tagging details
Major phenotypic characters
10. Cost of animal and sources of funds
Cost of animal
Insurance cost
Transport cost
Total cost
ACA funds
Benreciary contribution
Other sources
Total funds

11. Date on which subsidy amount was deposited in Beneficiaries Bank Account:
___________
Amount deposited: Rs.__________________
12. Details of beneficiaries serviced during last one year: 2012-13
Name of Farmers Location No of
animals
benefitted
Charges taken Remarks
Note - Some beneficiaries may be contacted and their opinion about success rate of
male buffaloes and other related details may be sought.
13. Income generation : 2012-13
Service charges earned
Maintenance cost of animal incl. labour
charges
Net income
14. Opinion survey
1. Criteria followed by the department for selection of the farmer for the scheme
2. What was the earlier practice of breeding in the village and whether the same
has been discontinued

3. How the reliability of bulls is ascertained
4. Charges taken for servicing
5. Health of the animal on the date of visit
6. Feeding practices followed
7. Comments on housing to the animal
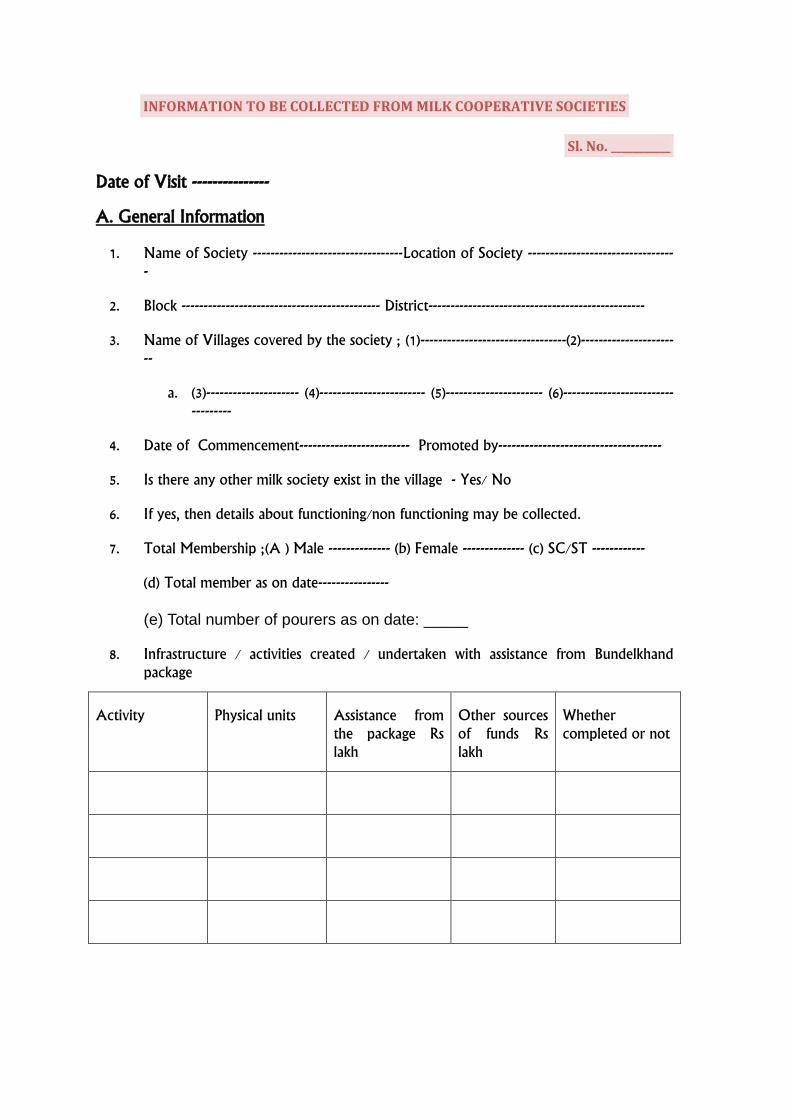
INFORMATION TO BE COLLECTED FROM MILK COOPERATIVE SOCIETIES
Sl. No. ___________
Date of Visit ---------------
A. General Information
1. Name of Society ----------------------------------Location of Society ----------------------------------
2. Block --------------------------------------------- District-------------------------------------------------
3. Name of Villages covered by the society ; (1)---------------------------------(2)-----------------------
a. (3)--------------------- (4)------------------------ (5)---------------------- (6)----------------------------------
4. Date of Commencement------------------------- Promoted by-------------------------------------
5. Is there any other milk society exist in the village - Yes/ No
6. If yes, then details about functioning/non functioning may be collected.
7. Total Membership ;(A ) Male -------------- (b) Female -------------- (c) SC/ST ------------
(d) Total member as on date----------------
(e) Total number of pourers as on date: _____
8. Infrastructure / activities created / undertaken with assistance from Bundelkhand package
Activity Physical units Assistance from the package Rs lakh
Other sources of funds Rs lakh
Whether completed or not

9. Details of Milk Collection/procurement, etc made by the society since inception to 2012-13
Months/ year Total Milk Collection/
month (litres)
Total Payment made to farmers (Rs.)
No of farmers who sold their milk to Society
Remarks
10. Mode of payment and other details of the Society(provided to members) : 2012-13
Particulars Milk rate Per fat % (Rs.)
Payment Made on (pl tick)
Mode of Payment (pl Tick)
Remarks
Cow Milk Weekly basis
Monthly basis
By Cash
Buffaloes Milk By Cheque

11. Details of input provided to members (Feed, etc.) : 2012-13
Type of input Number of members to whom supplied
Total quantity Value (wherever applicable)
Remarks
Cattle feed
AI services
Health coverage
Others (specify)
12. Details of income and expenditure of the society
Particulars 2012-13
Income
Expenditure
Net income
13. Procedure and timing of milk collection by the society
14. Details of marketing channels available in the villages prior to establishment of the
society
15. Comments on the functioning of the society

16. Constraints faced by the society
FGD of society members/ pourers to be done to solicit their experience with the society and
actual status.

SCHEDULE FOR BULK MILK COOLERS AND CHILLING PLANTS
1. Name of the project:
2. Location and address :
3. Implementing department:
4. Land require for the project :
5. Ownership of land : Government / acquired from farmers/ others
6. Important dates
Date of administrative approval
Date of completion of land acquisition
Date of floating tenders
Date of award of tender
Date of commencement of works
Expected date of completion of works
as per contract
Date of completion / likely date
Reasons for delay if any
Date of commencement of operations
7. Status of completion of the project (please attach photos)
Type of infrastructure Physical quantity Stage of
completion
(%)
Remarks
Target Achieved
Plant and machinery
Civil structures

Others
8. Cost of project (cost of land if acquired may also be included) Rs
lakh
Type of infrastructure Cost as per project
estimates
Expenditure
actually
incurred
Remarks
Plant and machinery
Civil structures
Others
Total
9. Sources of funding (Rs lakh)
Sources Allocated
amount
Released
amount
Amount
actually
expended
ACA releases
State contribution
Subsidy under CSS scheme of Govt of
India
Other sources (pl specify)
Total

10. Mechanism of Milk Collection (from producer to BMC/CC to Milk
Plant or Consumer
Milk Marketing system in the coverage
area of the unit (Pre-development
Situation)
Existing Mechanism of Milk Collection by IA
(Post Development Situation)
11. Details of milk routes
Proposed Actual
12. Timing of milk collection and disposal
13. Progress of unit since inception

Months/ Year Av quantity of milk
collected /month
(litres)
Name of Villages/ Milk
Societies covered
during the period
Other Information (if
any)
14. Income and expenditure of the unit
Particulars 2011-12 2012-13
Income
Expenditure
Net income
15. Any convergence between various departments in implementing the project?? If
so, provide details
16. Operational difficulties observed in the implementation /running of the project ;
suggestions for improving the performance

INFORMATION TO BE COLLECTED FROM AI CENTRES
Sl. No: ________
Date of Visit ----------------------
1. Name of AI Centre -------------------------- Location--------------------Block --------------------------
District----------------- Year of Setting up AI centre------------------- IA-----------------------------
Date of Sanction of proposal------------------
Infrastructure facilities available with AI centre;
a) Buildings (owned/ leased) If Leased- Rent/ Month (Rs.) ---------------------
b).- Owned then year of construction---------------- Investment Cost (Rs.) ---------------
2. Nature of assistance provided under Bundelkhand package for AI centre;
Name of Components as per Sanction letter
Proposed / Sanctioned Cost
Actual Cost incurred
Actual infrastructure created
Mode of Execution (Tendering/ Non tendering)
Date of completion
Remarks
2.1. Details of equipments available with AI centre
Name of equipments
Size Year of Purchase Total Cost Remarks
3.Details of Facilities provided by AI centre in the area;
Name of Facilities Charges per Animal Remarks

4. Coverage of the AI centre (No of villages & Animal population)
------------------------------------------------------------------------------------------------------------------------------
5.Details of Staff posted in AI centre
Name of Person QuQualification Experience Salary/month
Permanent / adhoc staff
Other Information
6. Details of Inputs like semen straw, Liquid Nitrogen, etc. Supplied by
Items Name of Agencies Charges/unit Av Quantity consumed /month
Liquid Nitrogen
Cow
Buffaloes
7. Performance of AI Centre since inception.
Month/
Year
No of AI Performed Details of Charges Collected
Success Rate (%)
Cows Buffaloes Cow Buffaloes Cow Buffaloes

8. Impact of AI
No of calves born since starting of AI Centre
Cow Buffalo
Male Female Male Female
9. What is the Process adopted for identification of calves born by the AI centres?
Comments on use of AI facilities and identified bottlenecks --
FGD with AI service availed dairy farmers to be done to get their perceptions

SCHEDUEL FOR CISTERN/OVERHEAD/ TUBEWELL SYSTEMS-UTTAR PRADESH
1. Name of the project:
2. Type of Project: Overhead Cistern based pipeline system/ Tubewells
3. Location and address :
4. Implementing department:
5. Land details : Extent of land
6. Ownership of land : Government / acquired from farmers/ others
7. Important dates
(l) Date of administrative approval
(m) Date of completion of
land acquisition
(n) Date of floating tenders
(dd/mm/yyyy)
(o) Date of award of tender
(dd/mm/yyyy)
(p) Name of Construction Agency
(q) Date of commencement of works
(dd/mm/yyyy)
(r) Status of Work Completed In Progress Not yet
started
(s) Expected date of completion of
works as per contract
(t) Date of completion (if
completed)
(u) Likely date of completion
(v) Reasons for delay if any

8. Status of completion of the project (please attach photos)
Type of infrastructure Physical quantity Stage of
completion
(%)
Remarks1
1 Overall observation and remark can be given in additional sheet
9. Cost of project (cost of land if acquired may also be included) Rs.
lakh
Type of infrastructure Cost as per project
estimates
Expenditure
actually
incurred
Remarks2
2 Overall observation and remark can be given in additional sheet

10. Sources of funding (Rs lakh)
Sources Allocated
amount
Released
amount
Amount
actually
expended
(e) ACA releases
(f) State contribution
(g) Subsidy under CSS scheme of
Govt of India
(h) Other sources (pl specify)
Total
11. Coverage of Drinking Water Scheme (Number and name of villages);
a. Number of villages:
b. Name of villages: _____________________________________________
____________________________________________________________
_
c. Numbers of Households: _________________
12. Water user charges being charged from the households (if any?).
13. Responsibility of Operation and Maintenance by (Name of Agency)?
14. Operational difficulties observed in the implementation of the project

15. Role of Stakeholders
a. Villagers
b. Gram Panchyat
c. Implementing Agency
d. Prospects
16. Views of the farmers about created facilities under Bundelkhand package
may be sought through FGD (Give detailed write up)
a. Has the system been installed correctly?
b. Is the location appropriate?
c. How did you get the drinking water before installation of system (From Beneficiaries)?
d. What has been the change after installation of system?
e. Availability of drinking water during

Month Before Installation of system After Installation of System
1. Available sufficiently
2. Available but not sufficient
3. Available but travel distances
Distance travelled to fetch water
1. Available sufficiently
2. Available but not sufficient
3. Available but travel distances
Distance travelled to fetch water
April
May
June
July
f. For how many months the water was available sufficiently before installation of system
in the village (Number of months)?
g. For how many months the water is available sufficiently after installation of system in
the village (number of months)
h. How the operation and maintenance of the system are done?
i. Any existing problems in context of drinking waters.

NABARD Consultancy Service Pvt. Ltd.
Corporate Office
1st Floor, NABARD Tower
24, Rajendra Place
New Delhi-110125
Email: [email protected]
Website: www.nabcons.com
Top Related