


Languages
Pages
Legal


:"7"114441V.fM!!-.1
REPORT RES O M E
ED 017 606 UD 005 704CONTINUOUS PROGRESS EDUCATION IN THE SEATTLE PUBLIC SCHOOLS,THE PROPOSED SOUTHEAST EDUCATION CENTER. DOCUMENTATION.SEATTLE PUBLIC SCHOOLS, WASH.
PUB DATE 17 JAN 68EDRS PRICE MF$0.50 HC -$2.44 59P.
DESCRIPTORS- *CONTINUOUS PROGRESS PLAN, *SCHOOL ORGANIZATION,FLEXIBLE PROGRESS PROGRESSION, FLEXIBLE FACILITIES, RACIALBALANCE, SCHOOL DISTRICTS, COMMUNITY INVOLVEMENT, TEAMTEACHING, SCHOOL ADMINISTRATION, DATA TABLES (DATA), STUDENTPLACEMENT, RESEARCH, PROGRAM EVALUATION, CURRICULUM DESIGN,STUDENT CHARACTERISTICS, INSTRUCTIONAL TECHNOLOGY, COMMUNITYSCHOOLS, COMPUTER ORIENTED PROGRAMS, DEMOGRAPHY, INTERMEDIATEGRADES, INSTRUCTIONAL STAFF, SEATTLE, WASHINGTON, SOUTHEASTEDUCATION CENTER
THIS REPORT DESCRIBES A PROPOSED CONTINUOUS PROGRESSEDUCATIONAL CENTER WITH AN EXPECTED ENROLLMENT OF ABOUT 3,500RACIALLY MIXED PUPILS AT ALL GRADE LEVELS. (A PRESCHOOL GROUPMAY BE ADDED, THUS RAISING THE TOTAL ENROLLMENT.) NO MORETHAN 50 PERCENT OF THE STUDENTS WILL BE NONWHITE AND NOSINGLE MINORITY GROUP (NEGRO, ORIENTAL, FILIPINO, OR AMERICANINDIAN) WILL CONSTITUTE MORE THAN 33 PERCENT OF THE TOTALENROLLMENT. EACH STUDENT WILL RECEIVE INDIVIDUALIZEDINSTRUCTION AND WILL PROGRESS AT HIS OWN RATE WITHIN ANINDIVIDUALLY DESIGNED PROGRAM OF STUDY. THE ARRANGEMENT OFSPACES AND FACILITIES IN THE CENTER WILL PROVIDE MAXIMUMFLEXIBILITY IN EDUCATIONAL PROGRAMING. IN GENERAL PUPILS WILLBE'GROUPED ACCORDING TO PERFORMANCE CRITERIA. ALTHOUGHLANGUAGE ARTS AND MATHEMATICS WILL BE EMPHASIZED, SCIENCE,SOCIAL STUDIES, FINE AND PRACTICAL ARTS, OCCUPATIONALORIENTATION, AND WORK EXPERIENCE WILL ALSO BE OFFERED. ASWELL AS A REGULAR CONTINUOUS PROGRESS CURRICULUM, LEARNINGPACKETS WITH BUILT -IN BEHAVIORAL OBJECTIVES, PRETESTS,SELF- TESTS, AND POSTTESTS WILL BE USED. THE TEACHER'S ROLEWILL BE ONE.OF TEAM PARTNER, ACADEMIC SPECIALIST, AND GENERALEDUCATOR. IT IS ALSO EXPECTED THAT PARENTS AND OTHERCOMMUNITY RESIDENTS WILL BE INVOLVED IN THE CENTER'SOPERATION. STANDARDIZED APTITUDE AND ACHIEVEMENT TESTS ANDOTHER TRADITIONAL MEASUREMENT INSTRUMENTS WILL BE USED TOEVALUATE THE CENTER'S ACTIVITIES, A COST EFFECTIVENESSTECHNIQUE FOR EVALUATION AND EXPERIMENTATION WILL BE USED TOASSESS THE VALUE OF THE PROGRAM. AS PART OF THE GENERALRESEARCH DESIGN, AN INFORMATION SYSTEM WILL DISSEMINATERELEVANT PROGRAM INFORMATION TO STAFF MEMBERS THROUGHOUT THECENTER. (LB)
0
0
eattle School District's Propotted
st Educati
,
U.S. DEPARTMENT OF HEALTH, EDUCATION & WELFARE
OFFICE OF EDUCATION
THIS DOCUMENT HAS BEEN REPRODUCED EXACTLY AS RECEIVED FROM THE
PERSON OR ORGANIZATION ORIGINATING IT. POINTS OF VIEW OR OPINIONS
STATED DO NOT NECESSARILY REPRESENT OFFICIAL OFFICE Of EDUCATION
POSITION OR POLICY.
CONTINUOUS PROGRESS EDUCATION
IN THE SEATTLE PUBLIC SCHOOLS
THE PROPOSED SOUTHEAST EDUCATION CENTER
DOCUMENTATION
January 17, 1968

DOCUMENTATION FOR THE TASK F(CE STUDY OF
CONTINUOUS PROGRESS EDUCATION
INTRODUCTION
irK
Documents and their authors in this section are included in the following
order:
1. Study Procedures and Resources)
)Task Force
2. Visitations and Consultants )
3. Pupils James Moore
4 Attendance Area Characteristics James Moore
5. Curriculum and Instruction Elmo Little
111
6. Interrelationship of spaces in the Continuous Elmo Little
2rogress Center
7. Staff and Organization Dale Goss
8. Technology Kent Stephens
9. Transportation Kent Stephens
10. Research and Evaluation James Moore
11. Dissemination Dale Goss

- 2
STUDY PROCEDURES AND RESOURCES
777
The tasktisk force members each assumed responsibility for preparing certain of
the documentary statements on the following pages. The group was assisted in
its study of the long-range building needs by staff members of the Maintenance
Department of the Business and Plant Division.
Materials from many school districts throughout the Nation were studied
during the investigation, several schools were visited, and some consultations
were held with educational leaders. The task force suggests that many other
significant school programs be visited and additional consultants interviewed
during the development of specifications.
Outstanding school district programs studied were those at the Farig Ele-
mentary School, Cupertino, California; Valley Winds Elementary School, St.
Louis County; Anniston schools,'Alabama; Theodore, Alabama High School; Troy
City, Alabama schools; Walker Elementary School, Tucson, Arizona; Edgar Ele-
mentary School, Garden Grove, California; Tamura School, Huntington Beach,
California; Thurston Intermediate School, Laguna Beach, California; U.C.L.A.
Campus Elementary School, Los Angeles; Klein Elementary School, Mountain View,
California; Gunn High School, Palo Alto, California; Poway, California, Unified
School District; Oberon Junior High School, Arvada, Colorado; Kullestrand Ele-
mentary School, Jefferson County, Colorado; Nova Schools, Ft. Lauderdale,
Florida; Melbourne, Florida High School; Barrington, Illinois schools; Central
School, Evanston, Illinois; Montgomery County schools, Rockville Maryland;
Meadowbrook Junior High School, Newton Centre, Massachusetts; Western High
School, Lis Vegas, Nevada; Boscow School, Hillsboro, Oregon; Alameda Elementary
School, Ontario, Oregon; Abington, Pennsylvania High School; Dixon High School,
Provo, Utah; Roy, Utah, High School; West Elementary School, Aberdeen,

- 3 -
Washington; Ferris High School, Spokane, Washington; Pittsburgh, Pennsylvania
schools; Flint, Michigan schools; Brentwood Elementary School, Palo Alto,
California; John Marshall High School, Portland, Oregon; Ridgewood High School,
Norridge, Illinois; Middletown High School, Middletown, Rhode Island; West
High School, Cleveland, Ohio; Roosevelt High School, Portland, Oregon; Rex
Putnam High School, Milwaukee, Oregon; John F. Kennedy High School, Cleveland,
Ohio; Glendale Junior High School, Seattle, Washington; Selah High School,
Selah, Washington.
VISITATIONS AND CONSULTANTS
Visited by staff members were: Flint, Michigan; Newton Centre, Massachu-
setts; Palo Alto, California; Mountain View, California; Los Angeles, Califor-
nia; Barrington and Evanston, Illinois; St. 1%1 High School, Chicago.
Among the specialists and educational leaders consulted were: Jerome
Bruner, Harvard; Cyrus Sargent, N.Y.U.; George Brain, W.S.U.; Robert Seltzer,
East Orange, New Jersey; Francis Lanni, Columbia University; Jack A. Lown,
Minneapolis Facilities Consultant; Donald Lieu, Michigan. State; James Russell,
N.E.A.; John Flanagan, American Institutes for Research, Palo Alto; Sidney
Rollins, Brown University; Norton Kristy, Technomics, Inc., Santa Monica;
Madeline Hunter, U.C.L.A. Campus School; William M. Shanner, American Institutes
for Research, Palo Alto; John Coulson and Jack Bratten, Systems Development
Corporation, Santa Monica; Karl Anslem, Brentwood School,, Palo Alto; John
Gwinn, Stanford; Gordon Lee, Columbia; Dale Bolton, University of Washington;
Preston LeBretori, University of Washington; David Beggs, N.A.S.S.P..; J. Lloyd
Trump, N.A.S.S.P.; William Georgiades, U.S.C.; Terrence Hatch, University of
Utah; Glen Ovard, Brigham Young University; Phil Kopher, Las Vegas Schools;
-4
Pence Dacus, Pepperdine College; Gardner Swenson, Curriculum Bank, Laguna
Beach, California.
PUPILS
Feeder Schools
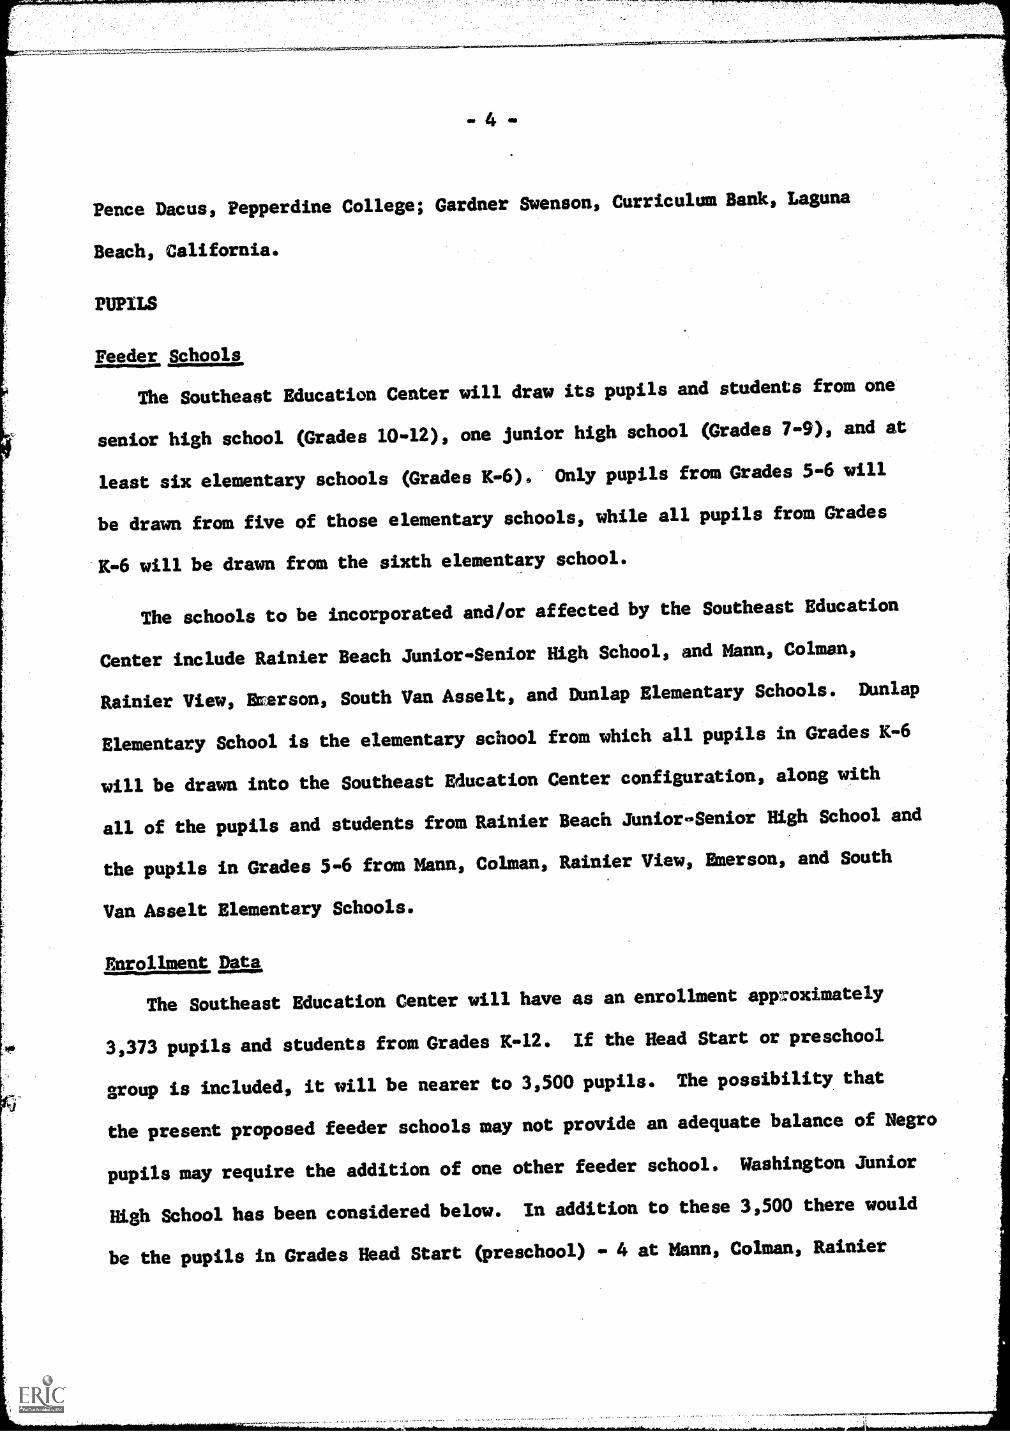
The Southeast Education Center will draw its pupils and students from one
senior high school (Grades 10-12), one junior high school (Grades 7-9), and at
least six elementary schools (Grades K-6). Only pupils from Grades 5-6 will
be drawn from five of those elementary schools, while all pupils from Grades
K-6 will be drawn from the sixth elementary school.
The schools to be incorporated and/or affected by the Southeast Education
Center include Rainier Beach Junior - Senior High School, and Mann, Colman,
Rainier View, arson, South Van Asselt, and Dunlap Elementary Schools. Dunlap
Elementary School is the elementary school from which all pupils in Grades K-6
will be drawn into the Southeast Education Center configuration, along with
all of the pupils and students from Rainier Beach Junior-Senior High School and
the pupils in Grades 5-6 from Mann, Colman, Rainier View, Emerson, and South
Van Asselt Elementary Schools.
Enrollment Data
The Southeast Education Center will have as an enrollment approximately
3,373 pupils and students from Grades K-12. If the Head Start or preschool
group is included, it will be nearer to 3,500 pupils. The possibility that
the present proposed feeder schools may not provide an adequate balance of Negro
pupils may require the addition of one other feeder school. Washington Junior
High School has been considered below. In addition to these 3,500 there would
be the pupils in Grades Head Start (preschool) - 4 at Mann, Colman, Rainier
- 5 -
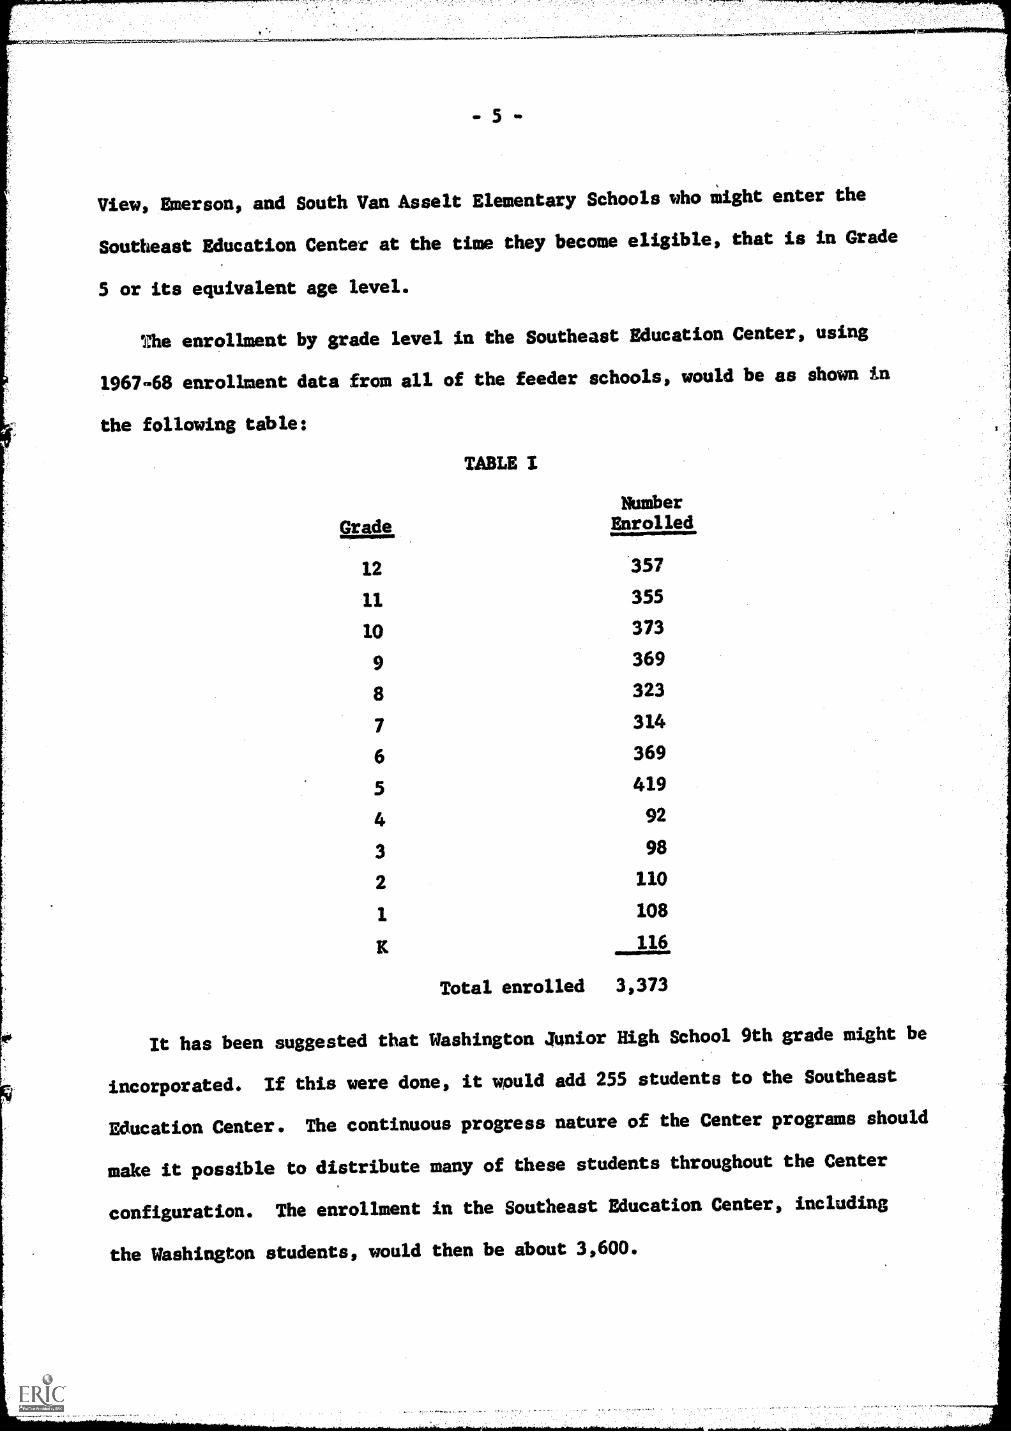
View, Emerson, and South Van Asselt Elementary Schools who might enter the
Southeast Education Center at the time they become eligible, that is in Grade
5 or its equivalent age level.
The enrollment by grade level in the Southeast Education Center, using
1967-68 enrollment data from all of the feeder schools, would be as shown in
the following table:
TABLE I
Grade
NumberEnrolled
12 357
11 355
10 373
9 369
8 323
7 314
6 369
5 419
4 92
3 98
2 110
1 108
K 116
Total enrolled 3,373
It has been suggested that Washington Junior High School 9th grade might be
incorporated. If this were done, it would add 255 students to the Southeast
Education Center. The continuous progress nature of the Center programs should
make it possible to distribute many of these students throughout the Center
configuration. The enrollment in the Southeast Education Center, including
the Washington students, would then be about 3,600.

7'7:7 ;77, 77-7,-,.!. 7
-6
Racial Characteristics
One of .he most important criteria for the selection of feeder schools for
the Southeast Education Center was that of racial distribution and a partial
easing of de facto segregation at some of the central city schools, namely,
Mann and Colman Elementary Schools. The possible inclusion of Washington
JUnior High School is part of this criterion. In the next table (Table 2) is
a breakdown of this distribution, including numbers and percentages by grade
level and for the Center as a whole.
The relatively large numbers and percentages of non-white and Negro pupils
in the Southeast Education Center for Grades 5.6 are the result of the incor-
poration of pupils in those grade levels from the feeder elementary schools,
mainly Mann and Colman Elementary Schools. Most (205) of the Negro pupil total
(305) drawn into the Southeast Education Center are in Grades 5-6, and Mann
and Colman provide approximately 86 percent (176) of them.
The Final Report by the Seattle Citizens School Progress Planning Committee
(August, 1967) contained recommendations to the effect that an ideal racial
"balance" in the Center would include no more than 50 percent non-white and
no more than 33 percent any minority group enrollment. This would mean that
the Southeast Education Center would incorporate, for example, Negro pupils to
a maximum of approximately 33 percent of the total enrollment so long as the
inclusion of Japanese, Chinese, Filipino, American Indian, and other racial
groups did not raise the total non-white enrollment over the 50 percent upper
limit. The Final Report did not specify a lower limit, that is, a minimum en-
rollment of these racial groups; thus, it was necessary to come up with a
suijested minimum figure and use that as a basis for including feeder schools
with, among other criteria, sufficient Negro pupils to raise the proportion of

TABLE 2
RACIAL DISTRIBUTION OF STUDENTS
IN THE SOUTHEAST-EDUCATION CENTER
Total
White
Nonwhite
Negro
Japanese
Chinese
Filipino
Am. Ind.
Other
Gr.
Enroll.
7.
No.
%No.
%No.
7.
No.
%No.
7.
No.
%No.
%No.
12
327
89.8
294
10.2
33
2.9
94.2
13
1.9
6.7
2.1
1.5
2
11
355
89.8
319
10.2
36
2.9
10
4.2
14
1.9
7.7
2.1
1.5
2
10
373
89.8
335
10.2
38
2.9
10
4.2
15
1.9
7.7
3.1
1.5
2
9369
86.0
317
14.0
52
4.0
16
6.1
22
.8
31.4
5.3
11.3
5
8323
86.0
278
14.0
45
4.0
13
6.1
19
.8
25
.3
11.3
5
7314
86.0
270
14.0
44
4.0
13
6.1
20
.8
21.4
4.3
11.3
4
6369
63.5
234
36.4
135
25.8
96
6.0
21
1.6
61.1
41.1
41.0
4
5419
63.5
266
36.4
153
25.8
109
6.0
23
1.6
71.?
51.1
51.0
4
492
83.8
77
16.2
15
5.2
56.6
51.3
12.3
2.3
1.6
1
398
83.8
82
16.2
16
5.2
56.6
61.3
12.3
2.3
1.6
1
2110
83.8
92
16.2
18
5.2
66.6
71.3
12.3
2.3
1.6
1
1108
83.8
90
i6.2
18
5.2
66.6
71.3
12.3
2.3
1.6
1
K116
83.8
97
16.2
19
5.2
56.6
71.3
22.3
3.3
11
HS
48
83.8
40
16.2
8.
5.2
26.6
21.3
12.3
1.3
1.6
1
TOTAL
3421
81.5
2791
18.4
630
8.9
305
5.2
181
1.3
47
1.2
42
.7
21
1.0
34
pupils from that racial group to a significant amount. The minimum figure for
any racial minority group was approximately 10 percent, but it was believed
necessary to keep it around 15 to 20 percent for Negro pupils if possible.
Table 2 indicates that even with the inclusion of Mann and Colman Elemen-
tary Schools the percentage (8.9) of Negro pupils in the Southeast Education
Center would be far below the upper limit set by the Final Report, well beow
the "if possible" lower limit of 15 to 20 percent believed desirable for the
Southeast Education Center, and even below the absolute minimum of 10 percent.
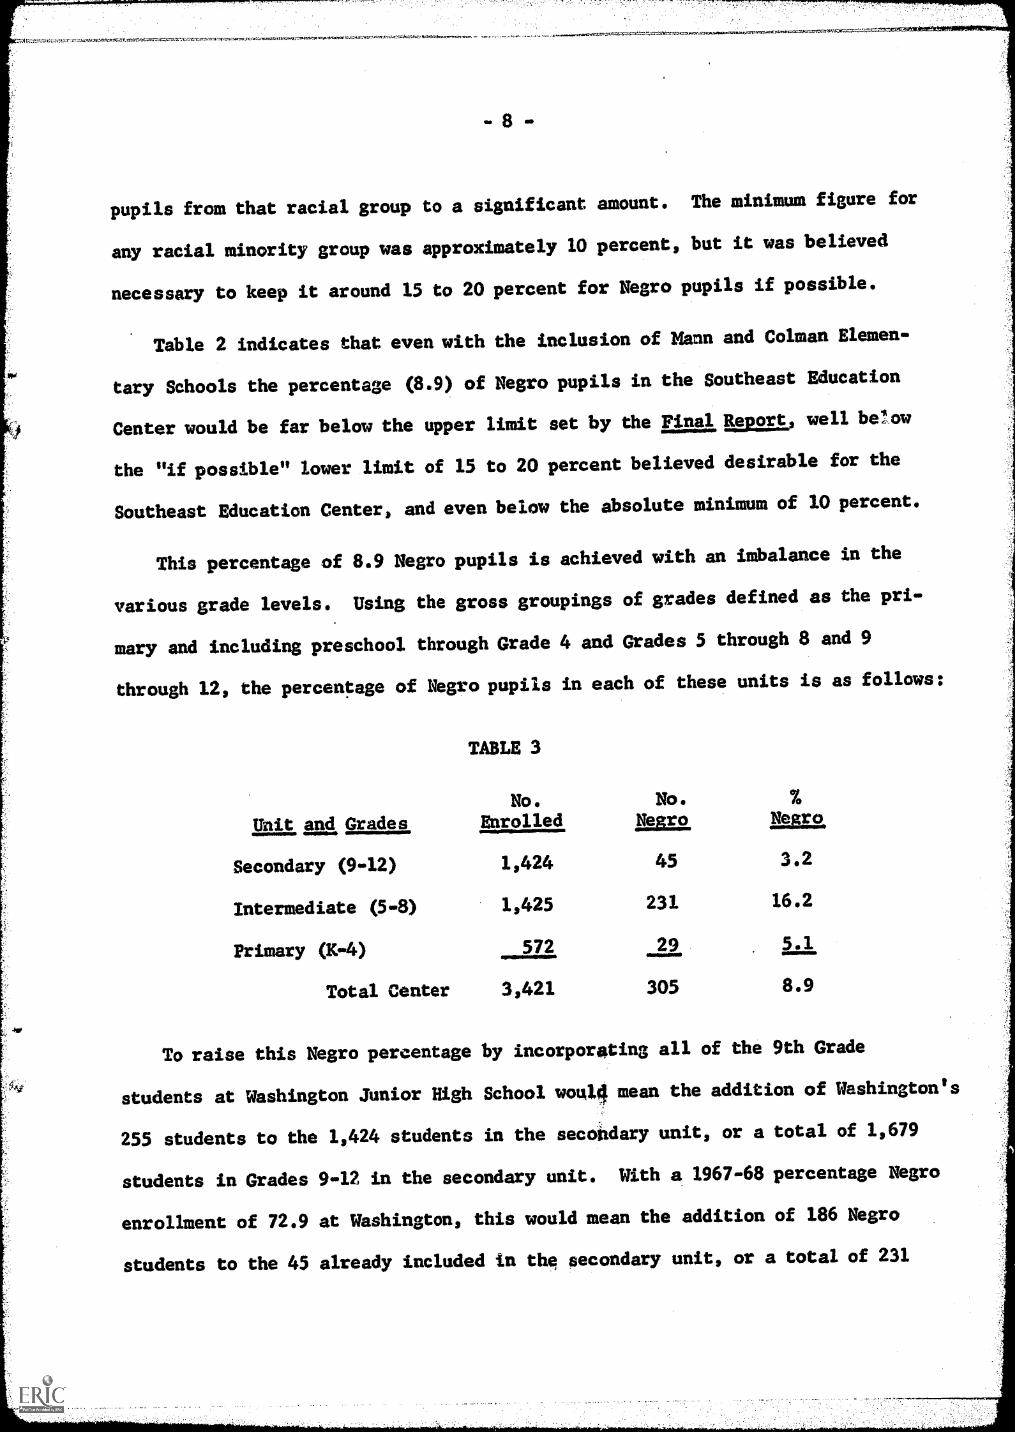
This percentage of 8.9 Negro pupils is achieved with an imbalance in the
various grade levels. Using the gross groupings of grades defined as the pri-
mary and including preschool through Grade 4 and Grades 5 through 8 and 9
through 12, the percentage of Negro pupils in each of these units is as follows:
TABLE 3
No. No. %
Unit and Grades Enrolled Negro libgrok
Secondary (9-12)
Intermediate (5-8)
Primary (K-4)
Total Center
1,424 45 3.2
1,425 231 16.2
572 29 5.1
3,421 305 8.9
To raise this Negro percentage by incorporating all of the 9th Grade
students at Washington Junior High School woul4 mean the addition of Washington's
255 students to the 1,424 students in the secondary unit, or a total of 1,679
students in Grades 9-12 in the secondary unit. With a 1967-68 percentage Negro
enrollment of 72.9 at Washington, this would mean the addition of 186 Negro
students to the 45 already included in the secondary unit, or a total of 231
Negro students in Grades 9-12 in the secondary unit. The final percentage of
Negro students in the secondary unit would then be 13.7. The final total of
Negro students and pupils in the Southeast Education Center would become 491,
a percentage of 13.3 in a combines enrollment of 3,676 in the Southeast Educa-
tion Center for all racial groups.
The essential point, however, is that a significant number and percentage
of Negro pupils an' a relatively proportionate number and percent of other
racial groups will be incorporated in the Southeast Education Center so that
the needs of integrated education and, importantly, an adequate research design
for the Southeast Education Center are met.
School Attendance Characteristics
An important measure of the home-and-school situation in any school attend-
ance area in Seattle is in the form of attendance data, defined in this case as
absenteeism, suspension rate, and drop-out rate. Increases in such rates can
usually be attributed to a combination of school program and home environment
factors which, together, make it virtually impossible for a pupil and student
to conform to the requirements of a school or to maintain an active and healthy
interest in the ongoing school programs. Such an increase is also positively
correlated with an increase in poor home living conditions, both physical as
well as psychological. It would be safe to assume that census tracts, such as
R4A, and perhaps R5A, would produce more of such conditions and thus would have
an inordinate share of the pupils and students who are absent, suspended, or
who drop out of school.
Table 4 is a summary of attendance data (where applicable) for the schools
involved in and affected by the Southeast Education Center over a two-year
period, 1964-66. The data covers absenteeism, suspension rates, and drop-out

1.1 7-77:77.7.77.7.77,7'77T .777771.1.777.1777.77r..j.r,r17/1CfWMIWINMNIPlfnqpigqgigfir-
10-
rates and is in the form of rates and ranks.
The ranks refer to the standing of each school in its own group, senior
highs in the senior high grouping, junior highs in the junior high grouping,
and elementary in the elementary school grouping. For the ranks to be meaning-
ful, keep in mind that they are based on 12 senior high schools, 18 junior high
schools, and 86 elementary schools.
The two-year period is divided into two separate years so that changes from
one year to the next might be seen clearly.
Mann and Colman Elementary Schools are included in the list purely for com-
parison purposes, because they will be feeder schools to the Southeast Education
Center. Otherwise, our references are to the schools in and near the. Southeast
Education Center attendance area (immediate vicinity).
Rainier Beach Senior High School has increased in all three of these indices,
absenteeism, suspensions, and drop-outs, while the city as a whole (senior highs)
increased in only two, absenteeism and drop-outs. However, the junior high
school changed its rank in only the suspension rate, from second to fourth,
meaning that it now has a higher relative suspension rate than it had.
Rainier Beach Junior High changed its ranks in two areas, absenteeism and
suspensions. It now has a higher relative absenteeism than before and a lower
relative (and absolute) suspension rate than before.
The data for the elementary schools is not as meaningful as it is for the
senior and junior high schools mainly because suspensions are not commonly used
as indices for pupils in the elementary school age levels. However, there are
some comparisons to be made, especially inter-school.

TABLE 4
Rainier Beach
1964-65
Rate
ABSENTEEISM
1965-66
Rank
Rate Rank
SUSPENSIONS
1964-65
1965-66
Rate
Rank
Rate
Rank
DROPOUTS
1964-65
1965-66
Rate
Rank
Rate
Rank
Senior High
5.53
76.12
72.27
22.63
44.39
46.13
4
City Senior High
(12)
5.95
-6.65
-4.14
-3.72
-5.59
-6.90
-
Rainier Beach
Junior High
4.11
25.57
5.5
2.27
10
1.71
61.49
15
1.11
14
City Junior High
(18)
5.20
-6.36
-2.64
-3.35
-.95
-.88
-
Mann
6.27
82
6,40
76
1.93
85
.80
78.5
-..
..
-
Colman
6.03
80
7.64
84
.75
76
.94
81
--
--
Dunlap
5.63
74
5.95
61
1.52
69.5
.15
47
--
NO
-
Emerson
4.31
25
4.75
17
-..
--
-U
s4.
-
Rainier View
3.83
74.95
24.5
.47
67
.23
55
-V
D-
-
South Van Asselt
4.70
-4.37
7..
--
--
ON
Ole
-
City Elementary
(86)
4.88
5.54
-.28
-.25
--
-..
.

- 12 -
-777"-57-7
Mental Ability, and Achievement
In the following tables are data on the general mental ability and achieve-
ment levels for pupils and students who would be involved in the Southeast
Education Center. Because of the nature of the Seattle Public Schools' city-
wide testing program, such data are for Grades 4, 6, 8, and 10, rather than for
all grades from K through 12.
Tables were prepared of mental ability test scores for the pupils typically
in Grade 4 in the six feeder elementary schools, Mann, Colman, Rainier View,
Emerson, South Van Asselt, and Dunlap Elementary Schools.
Each table includes the actual distribution of intelligence quotients for
each school. At the bottom of each table is shown the number of pupils, the
mean IQ, and the standard deviation of IQ's in the distribution. Thus, not
only is it possible to compare the means for each school with each other
school, but also the actual distributions of the numbers of pupils with IQ's
in the total range. For example, Rainier View had 55 pupils whose mean IQ was
110. The lowest IQ for Rainier View was in the 69-71 cell, and the highest
was in the 132-134 cell, a range of 66 IQ points. At the same time, for Mann,
there were 35 pupils whose mean IQ was 92. The lowest IQ for Mann was in the
75-77 cell, and the highest was in the 111-113 cell, a range of 39 IQ points.
Thus, although Rainier View perhaps had one pupil with a lower IQ than the
lowest Mann pupil, the range at Rainier View was larger, and, over-all, the
result was a generally higher IQ level at Rainier View than at Mann.
Tables prepared for this study are available in the Research Office for
examination.
Other tables show the achievement test scores in four areas, reading,
language, arithmetic computation, and arithmetic problem solving and concepts
- 13 -
for the same pupils.
The achievement test scores are in terms of standard scores for the sake
of making comparisons easy and clear. Standard scores, as used here, are based
on a mean of 50 and standard deviation of 10, so that every increase of 5
points is perhaps significant.
One of the first things clear in the data in all of these tables is the
fact that there are extremes in the student and pupil groups for each school;
that is, high and low pupils in terms of mental ability and achievement. It
is hypothetically possible to divide the pupils into workable groups according
to achievement or mental ability. It is even possible the schools have no
effective program for pupils below a certain achievement and/or mental ability
level. Pupils with IQ's above 75 and below 90 are difficult to place in a
typical, regular school program as it is defined in most of Seattle's schools
today. This kind of pupil is, in effect, locked into a system which does not
allow for his own unique speed and anode of learning. The data in all of the
studies of test scores indicate that the proportion of pupils who would be in
the Southeast Education Center with this level of mental ability and achieve-
ment (just below average to very low average) is between 15 to 25 percent. In
a feeder school, such as Rainier View, the proportion would be 10 to 12 percent,
while in a school such as Mann the proportion would be 50 to 65 percent. Cer-
tainly in the continuous progress-type program these types of pupils would be
able to find their level quickly and perhaps would adjust to what would then
be a "regular program."
Other Pupil trsonnel Characteristics (Based On An Analysis, of the Emerson
School Blurb)
The type of pupils coming to the Southeast Education Center from feeder

- 14 -
schools, such as, Emerson, Rainier View, and Dunlap, and to some degree from
South Van Asselt, can be described as follows:
1. Twenty-eight percent of them have been in two or more schools prior to
coming to the feeder school.
2. Two percent of them have a history of health problems which have inter-
fered with some school work.
3. Ten percent of them have been referred to a social worker for home-and-
school problems.
4. Eleven percent of them have been referred to a school psychologist for
individual. evaluations, both for emotional and academic reasons.
5. Twenty-two percent of them have received at least one year of reading inv.
provement instruction.
6. Eleven percent of them have been involved in an able learner program of
some type (for example, the Accelerated Primary Program).
7. Oue percent of them has had speech improvement training.
8. Eighty-five percent of them have intact homes in which the real father and
mother are present.
9. Their attendance record shows an absenteeism rate of five percent of school
days.
10. Their mean grade point average in reading, language, arithmetic, social
studies, and science is C+.
11. Ten percent of them have a citizenship record that is less than satisfactory.
12. Five percent of them have a promotion record that is less than satisfactory.

- 15 -
Enrollment DI:Feeder School
The probable enrollment in all of the schools in grade groupings is summar-
ized in the table below.
EstimatedNumber to beAttending
Intermediate
NumberRemaining (All figures are based on
Participating School School Behind 1967-68 enrollment data)
Mann 53 360 (Grades Head Start through 4)
Colman 155 463II
South Van Asselt 54 173II
Dunlap 199 524II
Emerson 225 624Is
Rainier View 102 30211
Rainier Beach Jr. High 637 369 (Grade 9)
Rainier Beach Sr. High 0 1,055 (Grades 10 through 12)
ATTENDANCE AREA CHARACTERISTICS
In recent years, perhaps as in the past, the voting public in the area
surrounding the proposed Southeast Education Center (Rainier Beach Junior -
Senior High and Dunlap Elementary Schools) has generally supported the annual
school levies submitted for popular voting. The support has not been, except
for one year (March, 1962) overwhelming, but it has been, with the exception
of one or two cases, favorable and greater than for the city of Seattle as a
whole. In Table 5 is a breakdown of the voting results for eight special
levies in the past, showing only the "Yes" numbers and percentages and using
Rainier View, Emerson, Dunlap, Brighton, Graham Hill, and Van Asselt Elementary
Schools' voting stations as the standard for the Rainier Beach area and also
- 16 -
showing the over-all Seattle city result.
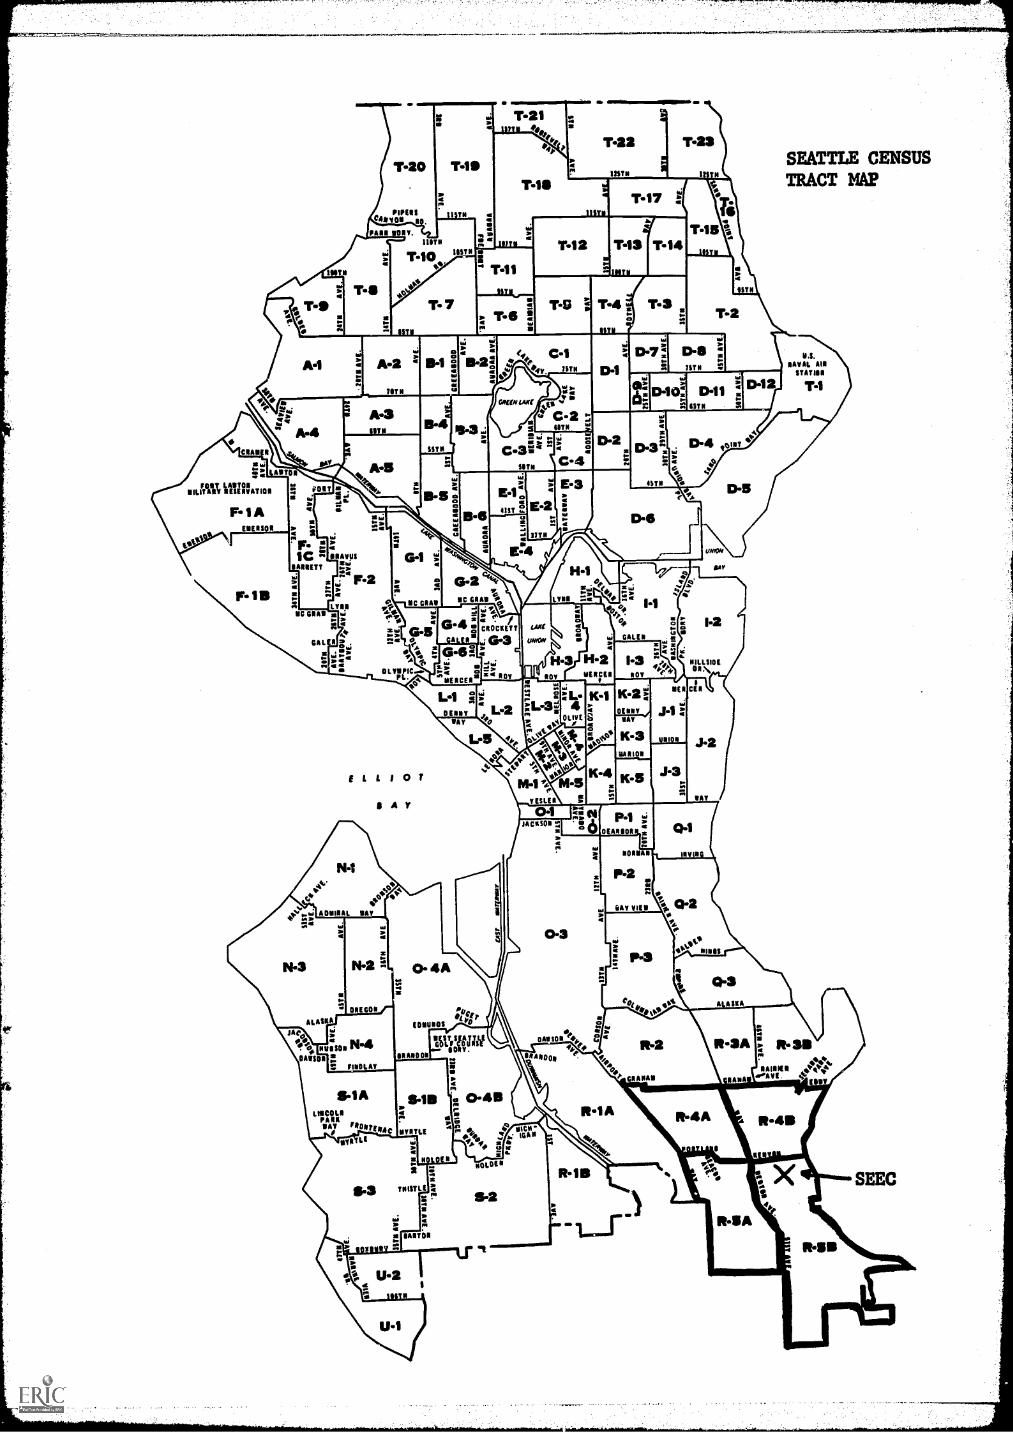
Figure 1 is a census tract map of Seattle. It shows that the attendance
area being described in the special levy results is enclosed within census
tracts R4A, R4B, R5A, and R5B. In its Population and Housing, Data report of
August, 1965, the Xing County United Good Neighbors agency provided some socio-
economic and population-housing data on this attendance area which give some
insights into the people and children enclosed within the area. Tables 6, 7,
and 8 summarize some of this data.
Two tracts are below the city average on the socioeconomic scale used by
Ring County United Good Neighbors, R4A and R5A. Both of these tracts are on
the west side of the Rainier Beach area and generally are in the South Van
Asselt and Dunlap attendance zones. Tract R4A in the northwestern quarter of
the area, around the South Van Asselt zone, is perhaps the most critical tract
since it is the lowest of all four tracts on the socioeconomic scale and is
basically a tract in which there are relatively young people with a divorce
rate that is higher than the city average, living in housing units which are
more crowded than the city average, on incomes which are more than $2,000 below
the city average, with less than a completed secondary school education. This
is a tract which includes at least one major Seattle low-income housing project,
and this fact alone accounts for much of the difference between census tract
MA and the other three tracts.
The other three tracts are relatively well off or at least are not critical
in as many areas as is R4A. They, for the most part, are composed of fairly
stable home owners with incomes and educational levels that are at, near, or
above the city average. They could be classed as generally in the true middle
class worker and white collar category.
T40
EIPEN1%youPANE SONY.
1 N
T411
TAPat
111
T4110
TN
MTN
T40 IOTA
T7
111
I T-21111111
.14e04, p
IOTA
74
a
7, T41
T -22
11571
143
11 1-S'1%6 2
a
A4 43' 14 t 1154 Li It'o. "A4 aa 41, TsTN
CIAO Itoa
Fat LAWTONMILITARY RESERVATION
F 1AEMUS I
ACTON
115
+VONT
1 CMANNETT
at
a
NC GNAW
GAL
P.
14
ADMIRAL RAro:
1+3
aaa .4
,111 a 4.0
TOTE
/NAVASski
F2LYNG
a4.4aaN;
1o1 1. a2.a
A5
aWa ala
P.
71.44.0 0asi
i aa aon
NC CNA,
OLYMPIC...PL.
ELLIOT
N4
M A Y
O
ALASKA
OREGON
JACO
IA, MANION N4EAMON
FINDLAY
WO; LANE
S:.11.1
C3 t".46
SETA
G4NC GNAT 0.0
E-1:LIST
E:4
1O1 3o.IC a
11.
"C-2(ITN
7.17
111T4OITA
04
N
TsT45
!MTN
STN
T -2
D-7 0-85 MN
M
040:
E -2
1/TN
434 .1. CR trOCKTA 6ET.3
X 4 NOT
G41F.is .
asonMERCER:
0
C404
E -3a
es
a
H-1oee
1.70.
LYNN r.
H3ROT
40TH
0.11II3TN
0-12
0.4 AtINT 41:k
6f ti!
06
14-2NIACIN
GALEN11=2
O 4A
L53*
MONO
BRANDON
WEIN IS?AO Y.
1111411
LINCOLNPANEMAT 14".14c
et 1. t
3.3
541aMYRTLE
a
SE
TNISTLE
N
aANTON
tka11/TN
a
0411aa
1.**
41`titiW
M1TESLER
N
K2DENNY
VAT
1C4MARION
04JACKSON
a
:a 14a 6
04
31.
P.4 ;00111
NORMAN
EAT VIER
NEN
.14
NI
P.
as
UNION
SAY
1-2
HILLSIDEANN
CEN
.1-2
VAT
Q4
INNING
, Q4
a
ar.
°USDA 8e,4,,NANOoli
SICEa..* %GAN
NOLD EN
3-2
R115
P.3
CO
14
MIAMI
%i"11" NINNY
I G4A ASIA
SEATTLE CENSUSTRACT MAP
NAVAL AINSTATION
T4
111.4/1 1.31N
RAINIER 4E041NANA a'AVII. 44.
I
R45A
R413
SEEC

March, 1962
Voting Unit
Total
Yes
Rainier View
392
347
Emerson
1872
1648
Dunlap
1127
986
Brighton
783
682
Graham Hill
1017
857
Van Asselt
1464
1300
7.
88.6
88.0
87.5
87.1
84.3
88.8
Seattle city
....
..
84.5
TABLES
SPECIAL LEVY RESULTS
March, 1963
May, 1963
February, 1964
Total
Yes
%Total
Yes
7.
Total
Yes
%
318
219
68.9
273
202
74.0
318
235
73.9
1447
899
62.
1343
868
64.6
1708
1146
67.1
940
598
63.6
770
526
68.3
1012
723
71.4
592
310
52.4
522
319
61.1
731
469
64.2
821
495
60.3
795
508
63.9
946
672
71.0
1071
680
63.5
947
629
66.4
1201
854
71.1
--
....
56.8
--
....
.
60.7
..-
--
67.1
November, 1964
November, 1965
January, 1966
November, 1966
Voting Unit
Total
Yes
%Total
Yes
%Total
Yes
%Total
Yes
%
Rainier View
609
430
70.6
230
171
74.3
229
192
83.8
681
394
57.6
Emerson
2711
1746
64.4
830
635
76.5
926
683
73.8
2457
1329
54.1
Dunlap
1716
1167
68.0
748
574
76.7
836
654
78.2
1642
931
56.7
Brighton
1390
880
63.3
570
392
68.8
660
486
73.6
1004
559
55.7
Graham Hill
1520
989
65.1
794
575
72.4
889
662
74.5
1323
728
55.0
Van Asselt
2306
1602
69.5
834
662
79.4
983
767
78.0
1478
895
'60.5
Seattle city
-a.
--
63.5
...
--
73.6
--
--
72.9
--
--
58.1
Data
-19-
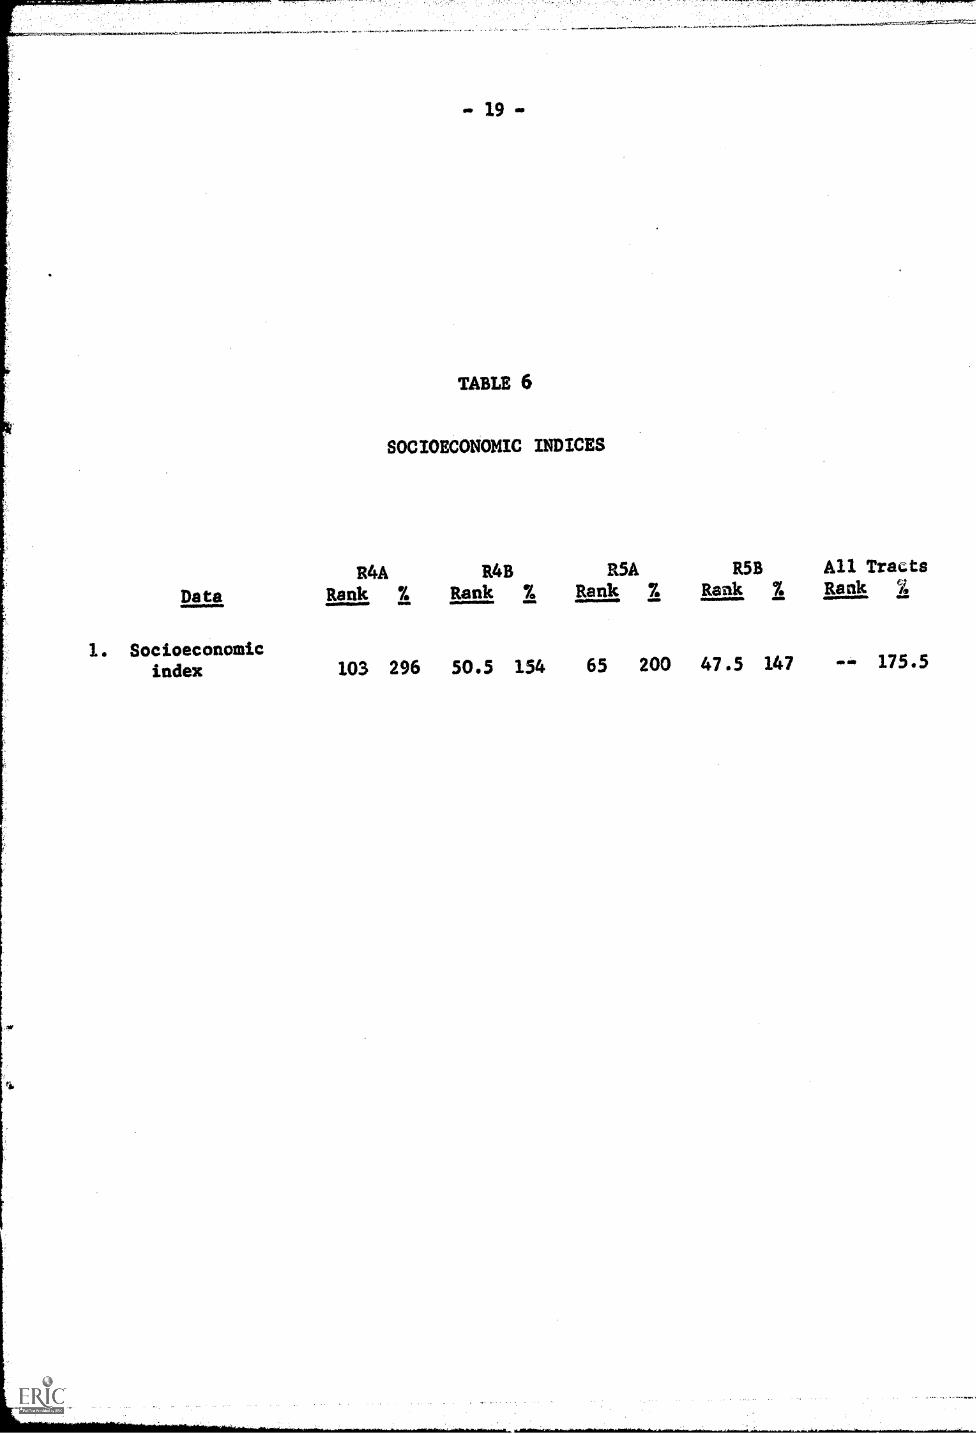
TABLE 6
SOCIOECONOMIC INDICES
R4A R4B R5A R5B All Tracts
Rank 7. Rank 7. Rank 7. Rank 7. Rank %
1. Socioeconomicindex 103 296 50.5 154 65 200 47.5 147 175.5
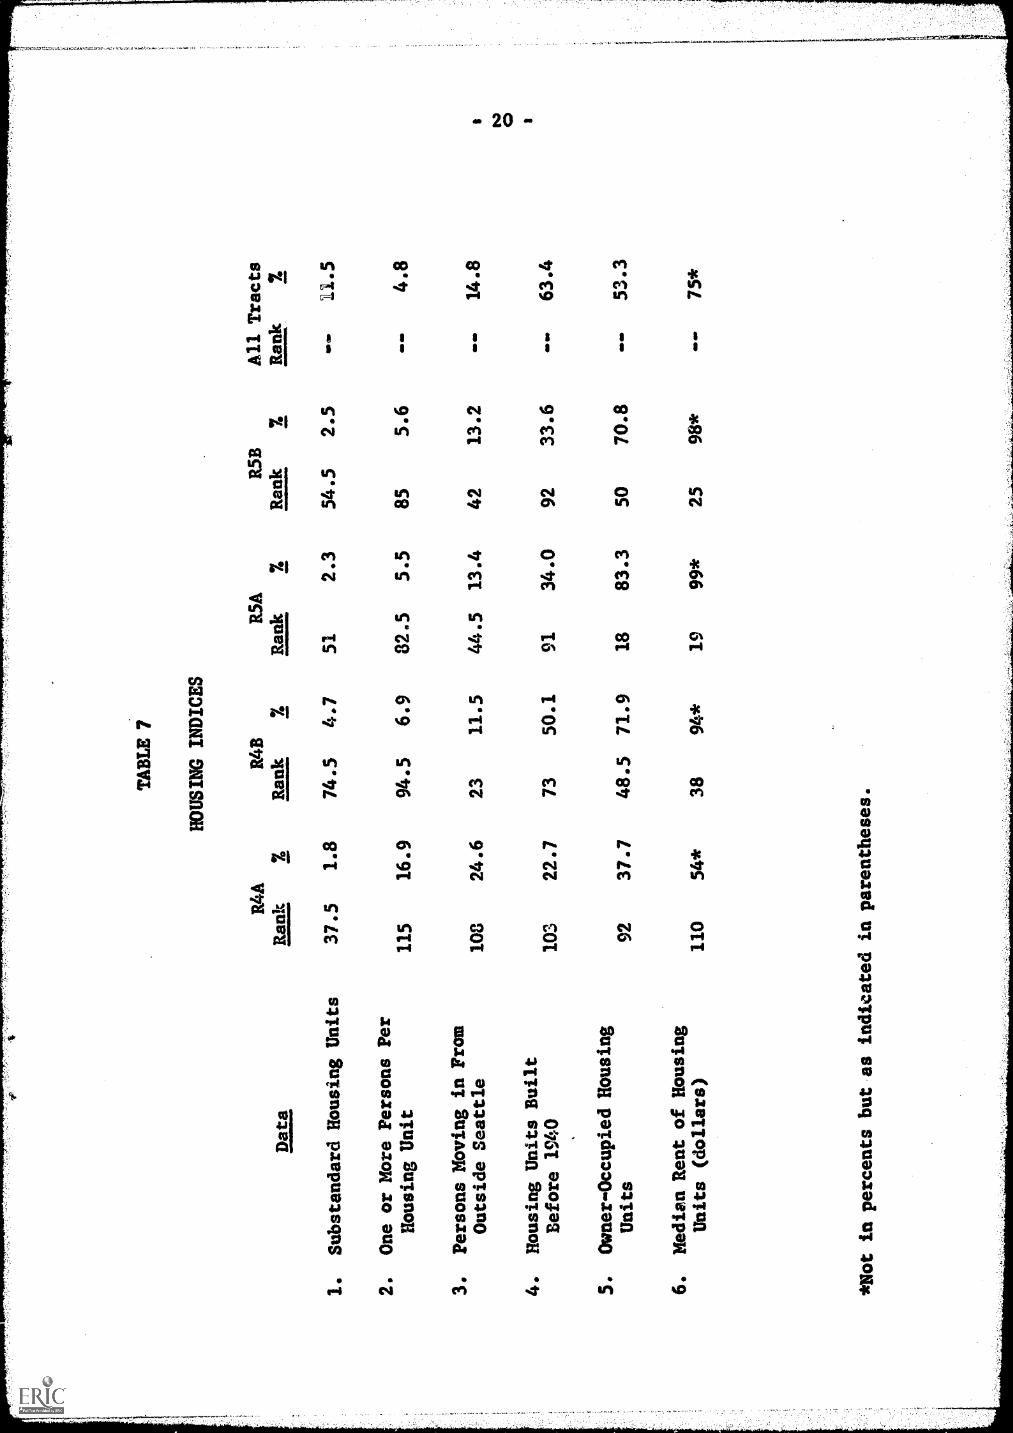
TABLE 7
HOUSING INDICES
Data
R4A
Rank
7
R4B
Rank
R5A
Rank
7.
R5B
Rank
7.
All Tracts
Rank
7.
1.
Substandard Housing Units
37.5
1.8
74.5
4.7
51
2.3
54.5
2.5
li.5
2.
One or More Persons Per
Housing Unit
115
16.9
94.5
6.9
82.5
5.5
85
5.6
4.8
3.
Persons Moving in From
Outside Seattle
108
24.6
23
11.5
44.5
13.4
42
13.2
--
14.8
4.
Housing Units Built
Before 1940
103
22.7
73
50.1
91
34.0
92
33.6
63.4
5.
Owner-Occupied Housing
Units
92
37.7
48.5
71.9
18
83.3
50
70.8
--
53.3
6.
Median Rent of Housing
Units (dollars)
110
54*
38
94*
19
99*
25
98*
de e
V75*
*Not in percents but as indicated in parentheses.

TABLE 8
1.
Data
R4A
Rank
POPULATION
%R4B
Rank
INDICES
%lt5A
Rank
7.
R5B
Rank
%All Tracts
Rank
7.
Population 65 Years &
Older
93.5
7.2
83.5
8.3
105
5.9
102
6.2
-_
12.0
2.
Children 7-14 Years of
Age
018.1
22
16.4
52
14.4
14
16.9
--
10-15
3.
Median Age of Females
(years)
115
22.1*
91
30.6*
101
28.2*
103
27.9*
--
35.0*
4.
Median Age of Males
(years)
115
17.8*
94.5
28.6*
S`3
28.7*
97
27.7*
--
33.1*
a
5.
Negro Percent of
I%)
Population
97
3.9
79
.4
95
3.1
75
.3
--
4.8
6.
Nonwhite Percent of
Population
98
21.6
91
5.4
94
10.9
79
2.9
--
8.4
7.
No. of Persons Per House-
bold (numbers)
93.5*
22.5
3.3*
30
3.2*
17.5
3.4*
--
2.7*
8.
Females Widowed or
Divorced
36
22.3
73.5
16.0
101.5
11.4
96
12.6
--
20.0
9.
Median School Years
Completed (years)
92
11.1*
67
12.1*
59
12.2*
59
12.2*
--
12.2*
10.
Percent of Professional
and Managers
107
14.1
52
25.2
94
17.5
54
25.0
--
27.0
11.
Median Family Income
(dollars)
109
4,623*
37.5
7,320*
60
6,792*
44
7,171*
--
6,942*
12.
Percent Change in
Population 1960-64
56
1.0
911.5
415.4
11
8.7
--
1.2
*Not in percents but as indicated in parentheses.

-22-
CURRICULUM AND INSTRUCTION
A continuous progress curriculum is one which permits each student to pro-
gress at his own best rate through programs designed for him. His program of
studies is individually tailored to meet his interests, abilities, aptitudes.
In addition to individualized programs, continuous progress learning demands
individualized instruction.
High priority is given to the basic skills and concepts in language arts
and mathematics. Emphasis also is placed upon the study of the sciences and
social studies. To balance and to complete the curriculum, opportunities are
offered in the fine and practical arts and in health and physical education in
occupational orientation and work experience. The sum total of educational
experiences is not taught in isolation but is presented in a well coordinated,
integrated whole.
The curriculum is based on what is known about child growth and development,
the unique learning characteristics of children, and their need for a well
designed continuum of educational experiences.
The structure of the curriculum is sequential and spiral grouping of con-
cepts, understandings, knowledges, and facts. The curriculum emphasizes basic
skills, values, and attitudes necessary to function in a democratic society.
Constant attention is given to the improvement of pupil performance. The
variety of performance levels is adjusted to meet the capabilities of the
student. In order to clearly understand the pupil's educational behavior, ob-
jectives in each part of each subject are stated as behavioral changes. The
evaluation instruments are used by the staff to measure behavioral changes.
Flexible grouping of pupils is based primarily on performance criteria.

- 23 -'11A
t.
The variety of instructional-learning groupings includes teaching and guidanc
partner instruction, small group instruction and discussion, as well as some
large group instruction.
The separate elements of the teaching-learning process impinge upon each
other; thus, appropriate group size is determined not only by learning objective
and learner style but also by expressed preference about teacher activity, media,
materials, mode, and relationship.
Concept and skill centered learning packets are prepared where appropriate
continuous progress curriculum is not available. These learning packets are
designed to help students achieve at their own best rates. The student then,
with the assistance of the teacher, selects a continuous progress learning
packet which is part of his continuum of experiences.
Built into the packet is a pre-test which will indicate to the instructor
and to the student whether or not it is appropriate for the student to proceed.
The learning packet contains diversified methodologies. Its varied content
includes materials appropriate for a wide variety of learning styles. The
behavioral objectives contained in the lesson are guides for the learners. As
each student achieves an objective, he proceeds to the next, then again selects
from the suggested learning activities and materials.
After the student achieves all of the behavioral objectives in each learning
packet, he takes a self-test. If the self-test results indicate to the stuient
that he is ready for a new concept and/or skill, he requests the final test.
Upon the successful completion of this final test, the pupil may elect to pro-
ceed to the next appropriate learning experience or he may elect in-depth or
quest study. Usually this is in keeping with his special interests. The dia-
gram below illustrates this process.

Broad TeachingEducational LearningGoals Objectives
777
- 24 -
Pre-1..test
DiversifiedContent
ResourceMaterials
Diversified Resource
!Teaching Persons
TestPost
Teaching-LearningObjectives
Such a teaching-learning process always provides many opportunities for
pupil-teacher interaction. Often these interactions take the form of seminars
or discussions.
The teacher in such a continuous progress program plays a unique role. Be
monitors each student's progress, diagnoses learning problems, prescribes possible
alternative learning situations and evaluates each student's progress. In brief,
the teacher becomes a diagnostician, programmer, evaluator, counselor, instructor,
and communicator. A systematic approach to teaching and learning emerges within
a flexible framework wherein teachers in teams and as individuals evaluate each
pupil's progress. Staff personnel including counselors, curriculum specialists,
and researchers assist teachers in making decisions about pupils and the teach-
ing-learning processes.
Teachers work in a team effort to develop appropriate, relevant, and chal-
lenging curricula and instructional strategies necessary to individualize
instruction. They pool their talents to develop a wide variety of educational
offerings designed to enhance teaching and learning. They work to develop
diversified methodologies recognizing that any single concept may be learned
through any number of approaches and that each learner has his own unique
learning styles.
The instructional staff with the aid of counselors and other consultants
develops evaluation instruments which measure the learning progress of each

- 25 -
pupil. These instruments will measure both quality and quantity of pupil per-
formance in terms of pre-stated behavioral goals. Pupil progress reports to be
used by the staff in the center differ markedly from conventional and multipur-
pose grade reports. Extensive data regarding the pupil's learning and forgetting,
his emotional and social progress, and his changing interests and needs are
recorded. Such records enable the school staff to design appropriate learning
pathways for the pupil.
The ongoing in-service educational programs for the staff of the center
keep administrators, teachers, and others concerned with the school program
abreast of key innovations emerging in education. Experimental and pilot studies
in schools here and elsewhere offer a wealth of ideas/and are a continuous source
of supply for the Education Center. Considerable assistance from local colleges
and universities will enable the director of in-service education to plan, pre-
pare and evaluate the pre-service and in-service education of the professional
staff. In a sense, the Education Center can become a valuable source of infor-
mation for the universities and colleges, and, likewise, the colleges and
universities can become a valuable resource for staff of the center.
INTERRELATIONSHIP OF SPACES IN THE CONTINUOUS PROGRESS CENTER
It is generally accepted that the curriculum and the learning process deter-
mine the nature of the facility. From this it is apparent that with the shift
of emphasis from group-paced teaching to self-paced learning, the opportunity
for multiple experiences, wide curriculum choices, and increased movement by
the student, the continuous progress center will differ markedly from conven
tional schools.
The need for flexible and convertible spaces in the continuous progress
center cannot be overemphasized. There are four modes of flexibility which

-26-
need to be considered. First, the instructional groupings call for a variety
of spaces, sizes, and functional capabilities. In the continuous progress
center, the variety of spaces combined with effective, flexible scheduling will
provide an opportunity to develop an individualized learning program. Some
spaces may be quite specialized, while others will provide for varying degrees
of multi-use capability.
A second mode of flexibility in the continuous progress center will be the
capability of immediate change. In the day-to-day operation of the school, it
will be possible to convert certain spaces immediately with an absolute minimum
of time and effort. Such changes are apt to be necessary during the school
day and generally take the form of temporarily reducing or expanding spaces in
order to separate or bring together groups or activities. Such flexible spaces
may need operable walls, readily moved by teacher or pupil. The educational
center should use such temporary dividers as see-through book shelves, movable
furniture, or simple space dividers.
A third move of flexibility will be the long-range changeability or con-
vertibility of space. Instructional and learning activities that take place
in the center are expected to change from year to year. The demands for space
rearrangement, therefore, must be flexible to accommodate and encourage new
and better learning patterns and instructional strategies.
A fourth factor of flexibility in the continuous progress center will be
that of expandability. As enrollments fluctuate, it will be necessary to accom-
modate pupils in an orderly expansion of numbers. It appears appropriate then
to plan structures which possess this capability.
Reflecting the flexible school program and schedule, building spaces will
be varied in size and planned specifically for the kinds of activities in which

-27-
students learn best. Flexible spaces for large group instruction, flexible
spaces for group interaction and suitable spaces for independent study will be
provided.
The recommended sequence of pupil activities in a continuous progress pro-
gram may be expressed:
Introduction ...Independent Study SeminarN*.3
Introductionor 0.0°7 or or or
Large Group ' Laboratory Study Group.-'...".).Large Group
Instruction Instruction Instruction
Independent study areas are spaces in which are found most of the learning
activities of pupils. They form the core of activity and should be centrally
located.
Surrounding the key spaces for independent study are areas where pupils
engage in seminar and in discussion. Such spaces are often small and accom-
modate from 8 - 18 pupils. They may have been larger spaces which have been
converted to smaller spaces by temporary visual and accoustical dividers. Thus,
the number and sizes of such spaces may vary according to need.
A third kind of space is the area devoted to investigation through a labora-
tory or an inquiry approach. Students in groups of 15 - 30 engage in personal
or partner studies in such key areas of learning as language, science, fine
arts, and practical arts. Specialized equipment and supplies for these indi-
vidual learning programs are found there. The open laboratory concept will be
used. This will allow students to work in the laboratories and shops at any
time that is convenient, provided that spaces in these facilities are available.
A fourth variety of spaces includes those areas appropriate for large group
instruction. They will include a flexible auditorium, little theater, gymnasium

-28-
or fieldhouse, and playfields.
A fifth kind of space will be given to auxiliary functions. This will
include administrative spaces, office and clerical work rooms, custodial,
receiving, and disbursement areas. Spaces will be needed for such specialists
as nurses, psychologists, programmers, counselors, technicians, and data pro-
cessors. Conference rooms for the resident staff as well as suitable conference
space for visitors will be needed.
A sixth allocation of space should be devoted to parking areas, walkways,
courts, and outdoor instructional areas.
The arrangement of spaces in the continuous progress center will provide a
myriad of learning opportunities for pupils in transition from the self-contained
classroom situations of the elementary school to the departmentalized programs
of the high school.
There are a number of possible arrangements of spaces appropriate to the
continuous progress center. Below is a sketch which shows one possible com-
bination.

- 29 -
1. Learning resource center
2. Seminar and small group discussion
3. Learning laboratories
4. Large group instruction and/or gymnasium
5. Auxiliary spaces
6. Parking and outdoor educational spaces

- 30 -
FACILITY SPACES AND THEIR FUNCTIONS IN THE
CONTINUOUS PROGRESS LEARNING CENTER
Kind of Space Number Required
% ofTotalBldg.Space
FlexibilityRequire..
meats
ConvertibilityRequirements
Learning resource 1 main center andsatellite centers
30..35% Fixed Space rearrangewent within thecenter only
Seminar and dis-cussion
4 main buildings(1 in each school)
20-25% Flexible Future conver-sion possible
Learning labora.-tories
In ea.th of the mainschools to accommo-date most subjects
30-35% Some fixedand someflexible
Somewhat capablof converti-Witty
Large groupinstruction
1 flexible use 10-157.
auditorium
Flexiblehousingcapability120/240/720students
Space rearrangemeat only bymoving interiorwalls
Auxiliary spaces 10 required for 110-157.
administrativeand supportingservices
Both fixedandflexible
i

- 31 -
STAFF AND ORGANIZATION
The proposed members and kinds of staff members and their functions are
based upon the new educational concepts inherent in continuous progress educa-
tion.
New Emerging, Role of the Leacher
The teachers will become both general educators as well as specialists.
As general educators and team partners, the teachers will be expected to con-
tribute to several basic educational functions. These are: (1) diagnosing
learning problems, (2) preparing appropriate instructional programs, (3) teach-
ing in the areas of the teacher's specialities, (4) evaluating the effectiveness
of the programs, (5) counseling a certain number of pupils, (6) communicating
with other staff members and parents.
To a far greater degree than ever before this will place highly professional
responsibilities upon the teachers. Not only will teachers grapple with ques-
tions of what is to be taught but how it should be taught. They will be respon-
sible not only for the preparation and application of programs but for the
effectiveness of their efforts.
In expecting highly professional output from teachers, the School District
also assumes new responsibilities. The School District policies and regulations
must permit sufficient decision-making latitude. The District must provide
appropriate staff development programs and adequate on-site specialists for
teachers to learn and become comfortable in their new roles. Further, teachers
can become effective only if schedules are flexible for both theft team and
individual assignments and if they are relieved of many nonprofessional duties.
There would be several important criteria for selecting teachers, including:

gpiver7RmumpowimPlIMIIIIIIr
-32 -
1. Teaching skills.
2. Depth of experience in one or more subject fields.
3. Ability to apply the newer methods to teaching.
4. Ability to diagnose individual learning problems, to develop curricula and
to measure performance.
5. Ability to communicate with parents.
6. Skill to counsel and guide a home room unit through a continuous range of
successful learning experiences.
7. Sensitivity to individual behavioral needs of children.
Articulation
Continuous progress implies that the school must maintain flexibility for
staff assignments, use of facilities, progress of pupils, interrelationship of
programs.
Conimunity. School
The community school concept implies not only that the school share its
resources with the community but that, conversely, a greater effort be made by
the community to provide support for the school.
An important need of large city systems is to close the communication gap
between schools and the community. The Southeast Education Center will involve
parents and other residents directly in the planning, evaluating, and communi-
cating procedures through the establishment of a Southeast Education Center
advisory council by the Seattle School Board. All interests of the community
will be represented on the council, as will the community college and adult
and other agency interests. This proposed semi-autonomous sub-board will not
preempt the prerogatives and assigned legal authorities of the Seattle School
Board, but will serve as catalyst, evaluator, investigator, interpreter, and

-33-
modifier. This segment of the Southeast Education Center system in itself will
become a model for future extension of the District's efforts to reduce the
communications gap.
In any large urban environment there are abundant opportunities to bring
people with significant experiences, talents, and skills to the schools. There
are in the Seattle area outstanding people in almost every field of endeavor,
from sports to medicine. There are physicists, mathematicians, painters,
musicians, writers, lawyers, public officials, craftsmen, architects, mechanics--
practically an unlimited reservoir of talent.
Extensive use of these resources would be made by the center to present to
the pupils a broad spectrum of the cultural, social, economic, and racial
aspects of the community and at the same time reinforce and expand the learning
activities.
Conversely, opportunities to take children to community resources would be
greatly expanded by the center's bussing arrangements.
Both situations will expand the total as well as the educational environ-
ments of the children.
SOecial,FUnctions of the Center
As a research, development, demonstration, and dissemination center, this
institution will provide invaluable information to the School District for its
long-range planning and development decisions.
The center will become a laboratory for demonstrating new teaching tech-
nologies, new administrative patterns, new community relationships, new instruc-
tional procedures, new staff development programs, new organizational patterns.
The list of research opportunities will become much longer as the programs
-34-
evolve. Needless to say, appropriate 1:;:lecial staff members and resources will
be required to make evaluations and interpretations of the outcomes.
Role of Administration
A central over-all administration will be required if efficient articulation
of programs, pupils, staff, facilities, and planning is to emerge.
Because the staff support and development role is vastly more significant
in a development and demonstrating' setting, the central center administrative
group should consist of various specialists who would serve all schools in the
center.
Articulation also should appear among the center schools and its feeder
schools. The extent to which the center administration can or should assume
this responsibility required further investigation by the planning staff.
Aganization,
The organization below is proposed as necessary and adequate to assume the
responsibilities assigned:to the center.

SOUTHEAST EDUCATION CENTER
PROPOSED ORGANIZATION AND STAFF
Director
Assistant Director
for Operations
6 Specialists
Technology (2)
Communications (1)
Transportation(1,
Research (1)
Records (4
1
Coordinator
Secondary
Instruction
Assistant Director
for Pupil Services
9 Specialists
Curriculum & Instruction (2)
Health (3)
Educational Psychology (1)
Counseling (2)
Activities & Athletics (1)
Coordinator
Intermediate
Instruction
Teachers (146)
Ratio
(1-24)
Instructional Aides
nicians (35)
Ratio
(1-100)
Secretaries, Clerks
ists (16)
Ratio (1-220)
and Tech-
& Special-
I
Coordinator
Primary
Instruction
NIM
ION
Iftw
alm
osom
meN
t

"---77.777777,--770PrwanswiwiTa
-36 -
TECHNOLOGY
To perform effectively the roles so often assigned to it, education must
become more efficient. Electronic data processing is not an advanced art in
the field of education. Information processing is for the most part still
accomplished on paper by pencil, pen, or typewriter. Innovations in curriculum
and instruction utilizing the computer are still in the research and development
stages.
In view of the more extensive use of the computer in other fields and indus-
try, one must conclude either that EDP methods cannot solve educational problems
or educators as yet lack knowledge of the potential of EDP and how to implement
it at a practical level.
When the computer has been applied appropriately to educational data, it
has reduced the amount of professional time and energy needed for clerical
operations, processing, developmental work, resource utilization and in depth
inquiry not previously possible in a manual system. The most valuable result
of the introduction of computer technology to education has been in the devel-
opment and backup of educational software. This has necessitated a "systems
approach" to schedules, procedures, objectives, assumptions, and rules.'
Following is a breakdown given by John I. Coodlad in his text Computers
and Information, Systems in Education of the problems in education appropriate
for electronic data processing followed by his recommendations. Included are
some additions by the task force which are important to the Seattle School
District.
Raw Data
-37 -
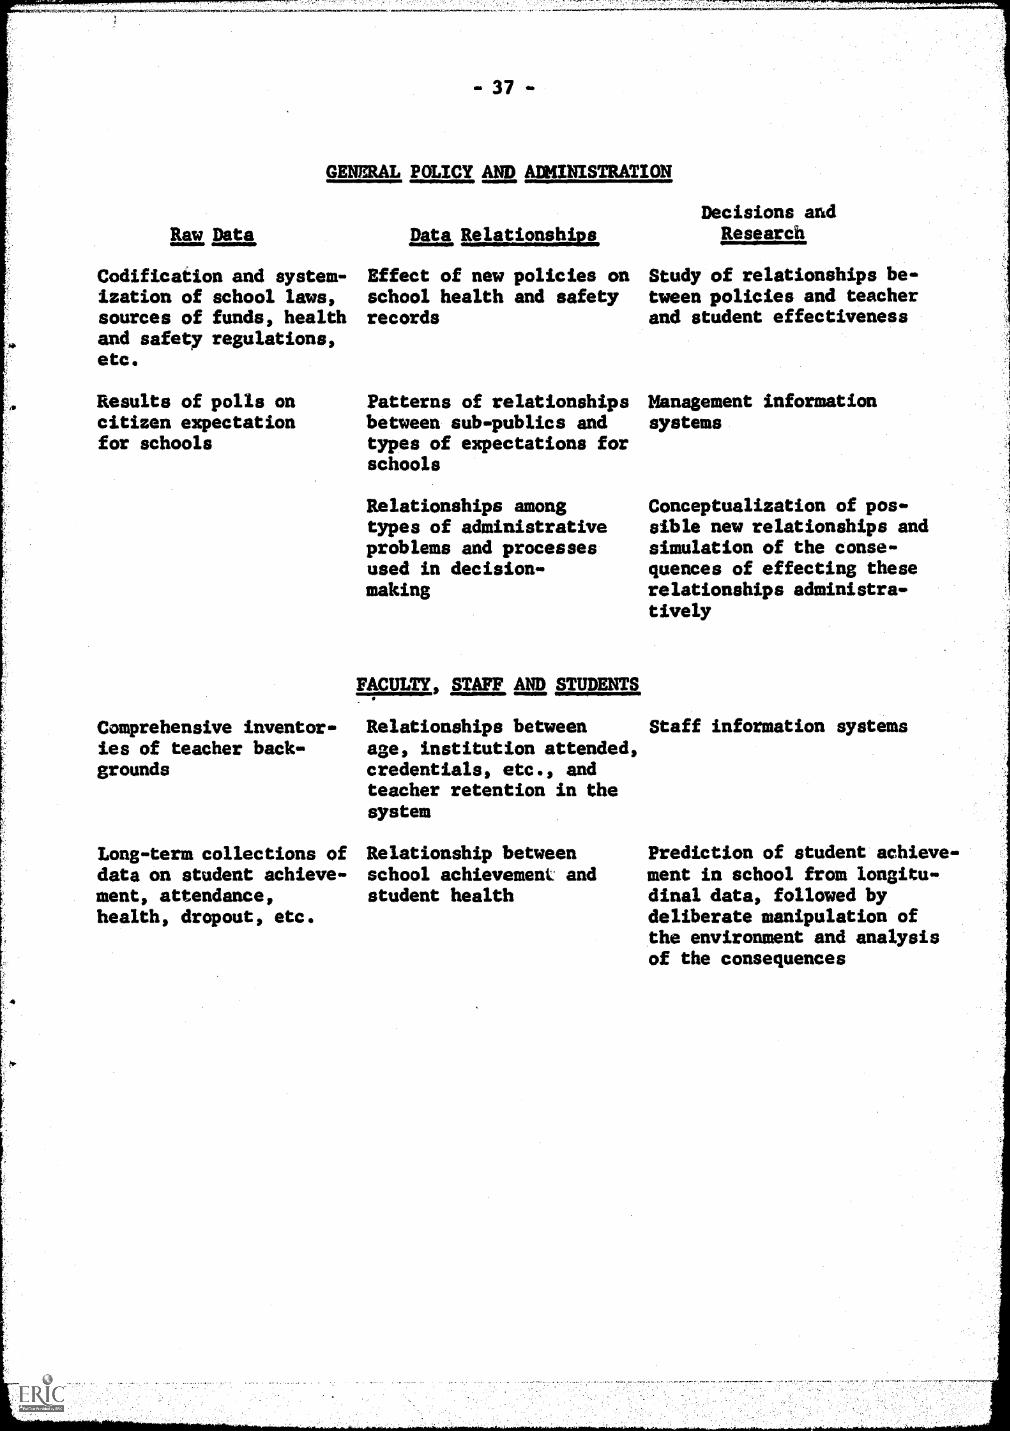
G2PAL POLICY AND ADMINISTRATION
Codification and system-ization of school laws,sources of funds, healthand safety regulations,etc.
Results of polls oncitizen expectationfor schools
Comprehensive inventor-ies of teacher back-grounds
Long-term collections ofdata on student achieve-ment, attendance,health, dropout, etc.
Decisions andData Relationships Research
Effect of new policies on Study of relationships be-school health and safety tween policies and teacherrecords and student effectiveness
Patterns of relationshipsbetween sub-publics andtypes of expectations forschools
Relationships amongtypes of administrativeproblems and processesused in decision-making
FACULTY, STAFF AND STUDENTS
Relationships betweenage, institution attended,credentials, etc., andteacher retention in thesystem
Relationship betweenschool achievement: andstudent health
Managementsystems
information
Conceptualization of pos-sible new relationships andsimulation of the conse-quences of effecting theserelationships administra-tively
Staff information systems
Prediction of student achieve-ment in school from longitu-dinal data, followed bydeliberate manipulation ofthe environment and analysisof the consequences

Raw Data
ws
Statistics on schoolcosts broken into bud-geted categories
Maintenance of assessedevaluation statisticsand data pertaining toproportion of Districtincome spent on educa-tion
Cost statistics on all
aspects of school con-struction and mainte-nance
BUDGET AND FINANCIAL SUPPORT
Data Relationships,
Relationships betweenfinancial support andvarious evidences ofschool productivity
FACILITIES
Relationships betweencosts of various types of
construction and costs of
maintenance
Decisions andResearch
Decisions pertaining toschool bond referendums and
building construction inrelation to alternative pre-dictions of populationgrowth and financial support,together with calculationspertaining to how much newindustry will be attractedby new and better schools
Manipulation of facilitiesto test hypotheses growingout of observations from
Data Relationships
CURRICULUM, INSTRUCTION, AND MATERIALS
Number of students invarious patterns ofcurriculum
Student responses onprogrammed lessons and
courses
Storage and retrieval of
data on student assign-ment to individual in-struction, large groups,small groups, etc.
Relationships between Computerized instructional
student high school cur- programs
ricula and later academicand work careers
Relationships betweenresponses and age, IQ,past achievement, etc.
Relationships betweenstudent assignment andvarious aspects ofstudent success
Study of student learningstyles and various provi-sions for them, such asdifferent sizes and typesof groups
Manipulation of the instruc-tional-grouping environmentto test hypotheses growingout of observations at Data
Relationships
- 39 -
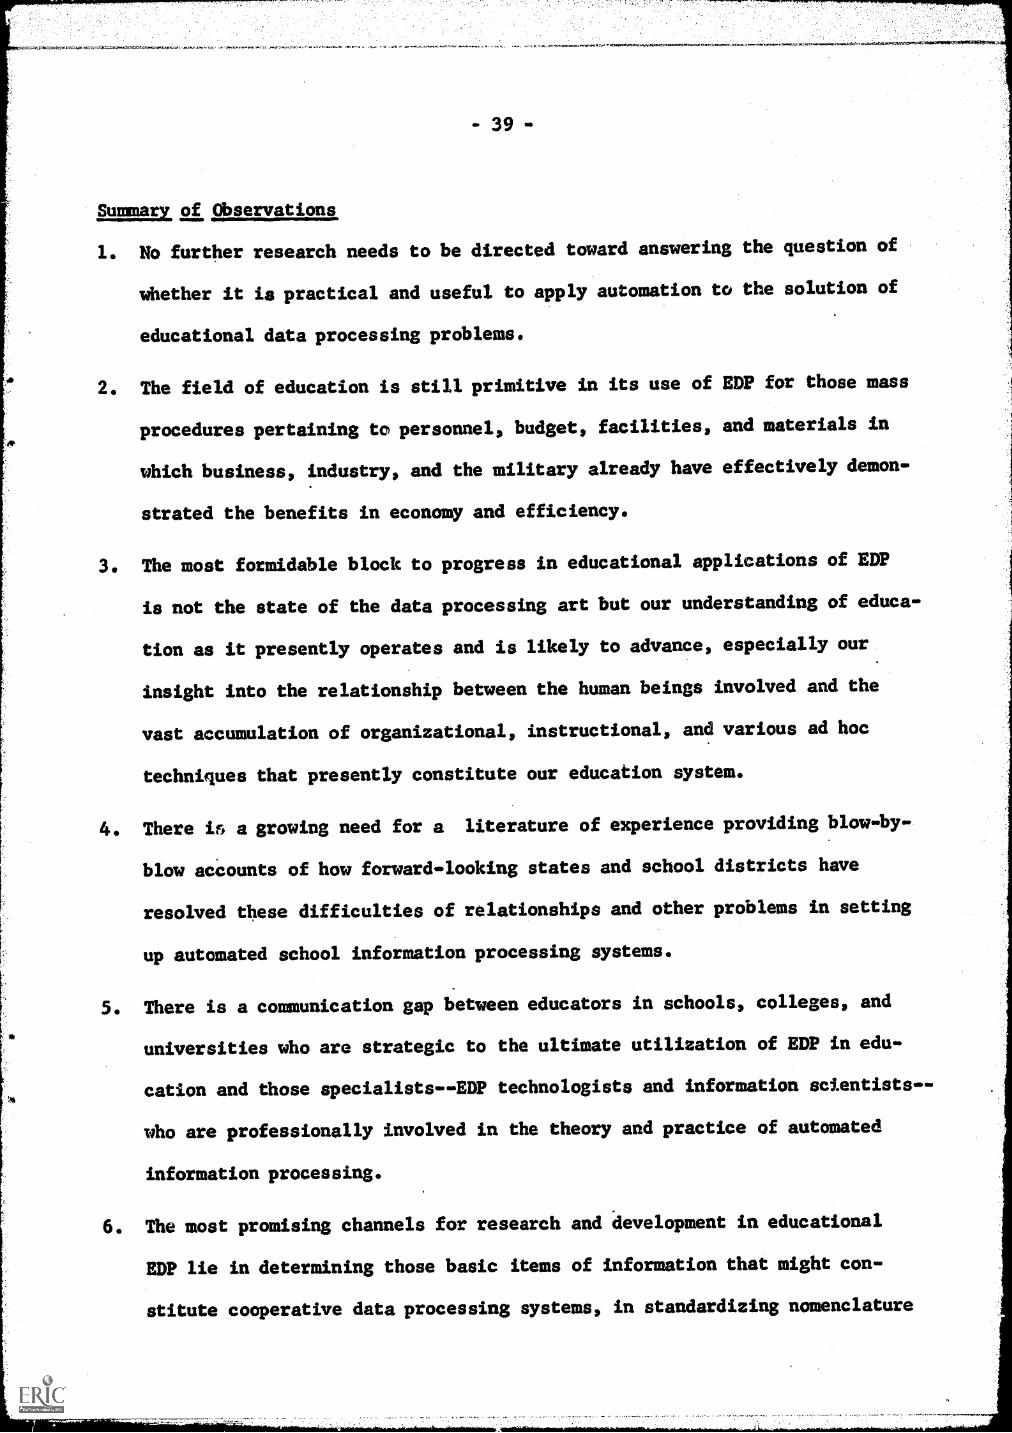
Summary of Observations
1. No further research needs to be directed toward answering the question of
whether it is practical and useful to apply automation to the solution of
educational data processing problems.
2. The field of education is still primitive in its use of EDP for those mass
procedures pertaining to personnel, budget, facilities, and materials in
which business, industry, and the military already have effectively demon-
strated the benefits in economy and efficiency.
3. The most formidable block to progress in educational applications of EDP
is not the state of the data processing art but our understanding of educa-
tion as it presently operates and is likely to advance, especially our
insight into the relationship between the human beings involved and the
vast accumulation of organizational, instructional, and various ad hoc
techniques that presently constitute our education system.
4. There i5 a growing need for a literature of experience providing blow-by-
blow accounts of how forward-looking states and school districts have
resolved these difficulties of relationships and other problems in setting
up automated school information processing systems.
5. There is a communication gap between educators in schools, colleges, and
universities who are strategic to the ultimate utilization of EDP in edu-
cation and those specialists - -EDP technologists and information scientists- -
who are professionally involved in the theory and practice of automated
information processing.
6. The most promising channels for research and development in educational
EDP lie in determining those basic items of information that might con-
stitute cooperative data processing systems, in standardizing nomenclature

-40-
and definitions, in providing for system and subsystem compatibility, in
resolving the interface problems between educational processes and tech-
nological processes (including the training of personnel to effect this
interface), in investigating the potentiality of automation as an aid to
educational innovation and experimentation, in studying and effecting
instructional decisions, and in demonstrating tested procedures that might
serve 83 models.
7. Fund granting agencies, in considering requests for financial support, are
being urged to look for the significance of a given project to education,
its relevance to a wide range of applications, its possibilities in re-
moving persistent roadblocks, its possibilities for dissemination and
replication, its potentially cumulative contributions to knowledge, its
possibilities for maximizing scarce resources, its provisions for field
testing, its contributions to efficiency, and its possibilities for self-
sustainment.
8. Fears that automation will bring into education the anonymity and dehumani-
zation now apparent in many aspects of daily life--even fear of the manipu-
lation of individuals by robots--exist in many minds. Such fears must be
reckoned with.
Robert Egbert in his paper "The Computer in Education: Malefactor or
Benefactor"2 nicely summarizes our recommendation for the Southeast Education
Center.
When "computers" and "education" are mentioned together, one might visualize
the computer as a tool for scientific research, as a teaching aid for instruct-
ing students in the use of computers, or as a device for helping in the business
operations of an educational institution. In these three roles, the computer
41 -
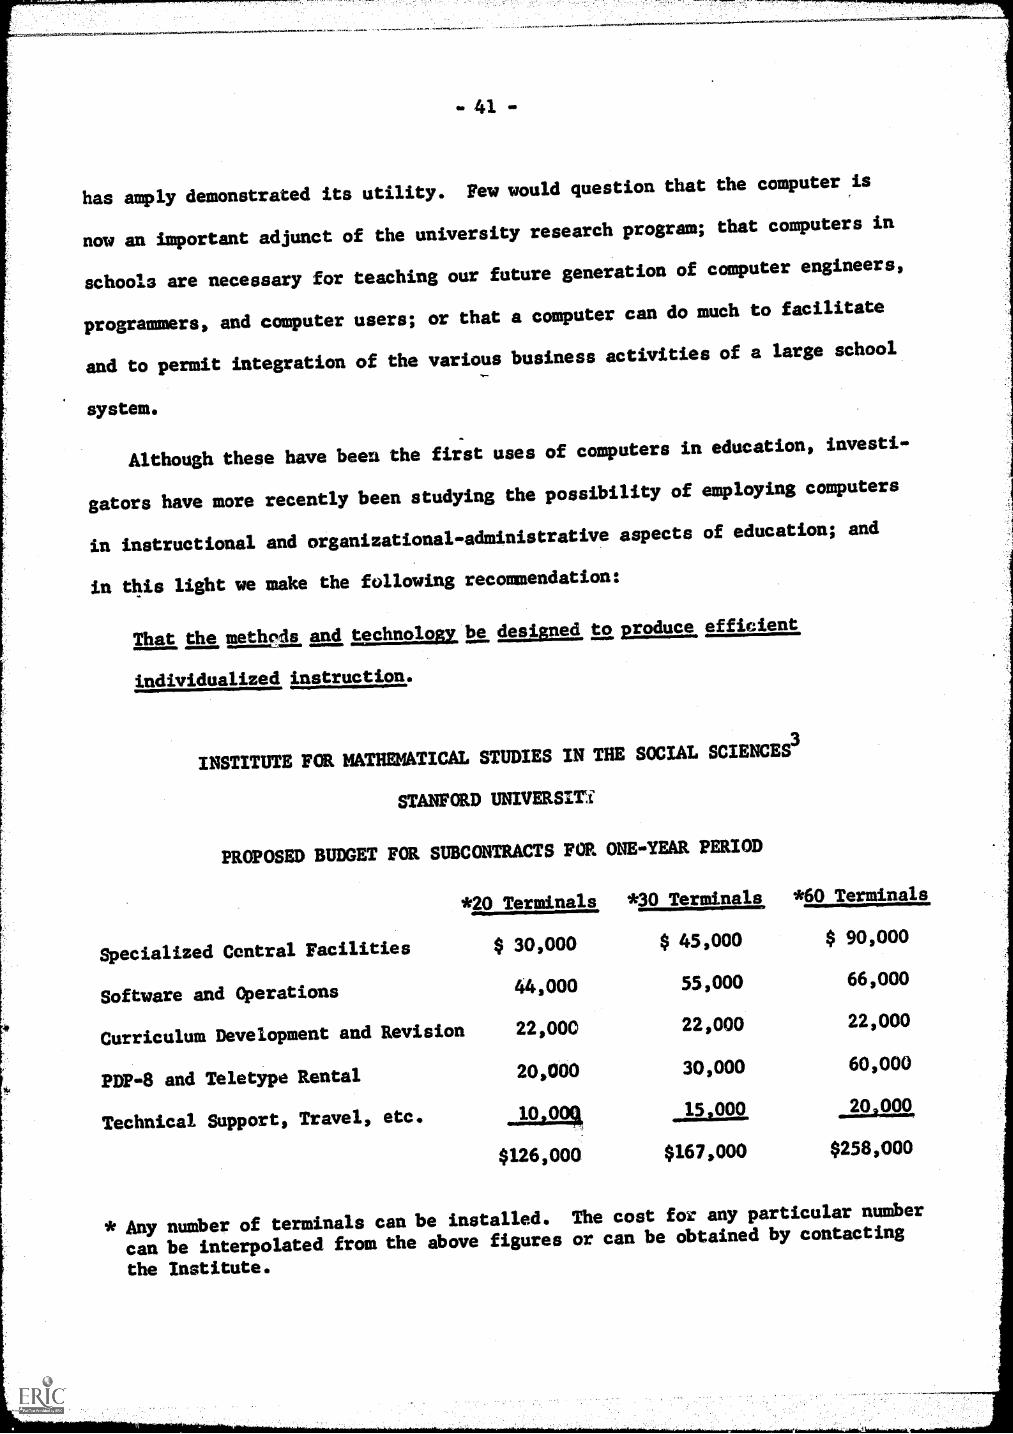
has amply demonstrated its utility. Few would question that the computer is
now an important adjunct of the university research program; that computers in
schools are necessary for teaching our future generation of computer engineers,
programmers, and computer users; or that a computer can do much to facilitate
and to permit integration of the various business activities of a large school
system.
Although these have been the first uses of computers in education, investi-
gators have more recently been studying the possibility of employing computers
in instructional and organizational-administrative aspects of education; and
in this light we make the following recommendation:
That the methpis and technology be designed to produce efficient
individualized instruction.
INSTITUTE FOR MATHEMATICAL STUDIES IN THE SOCIAL SCIENCES3
STANFORD UNIVERSITY
PROPOSED BUDGET FOR SUBCONTRACTS FOR ONE-YEAR PERIOD
*20 Terminals *30 Terminals *60 Terminals
Specialized Central Facilities
Software and Operations
Curriculum Development and Revision
PDP-8 and Teletype Rental
Technical Support, Travel, etc.
$ 30,000
44,000
22,00C
20,000
10 0
$126,000
$ 45,000 $ 90,000
55,000 66,000
22,000 22,000
30,000 60,000
15,.000 _20A14
$167,000 $258,000
* Any number of terminals can be installed. The cost for any particular number
can be interpolated from the above figures or can be obtained by contacting
the Institute.

-42-
77-
NOTE: The above figures do not include three major items:
1. Teacher workshop, the cost of which varies depending upon (a) whether the
workshop is held outside or in the school system; (b) whether university
credit is given to the participating teachers (this would involve tuition
payments to the university); and (c) the length of the workshop (one to
four weeks, depending on prior training of teachers).
2. Telephone line costs which vary from about $1.25 per mile per month for
systems more than 1,000 miles from Stanford to $3.65 per mile per month
for systems within the State of California.
3. Charges for placing terminals at locations other than primary terminus
in the school system. Costs include $50 per terminal per month plus local
line charges to each outlying terminal.
BXBLIOGRAPHY
1. Goodlad, John I.: Computers and Information Systems in Education. Los
Angeles. Harcourt, Brace & World, Inc., 1966,
2. Egbert, Robert L.: The Computer in Education: Malefactor or Benefactor.
Santa Monica, California, 1963.
Stanford University, Institute for Mathematical Studies in the Social
Sciences, Stanford, California. Letter from Max Jerman.

43 -
TRANSPORTATION
Consultation with state, county, outside school districts, and inside our
on District brought out alternatives with respect to transportation planning.
(1) Seattle School District No. 1 can develop its own inhouse transportation
system; (2) Seattle School District No. I can utilize commercial transportation
services such as offered by Seattle Transit, Grayline Tours, Yellow Cab, Rapid
Transit, etc.; (3) Seattle School District No. 1 can develop a transportation
system of its own in limited form and simultaneously utilize commerciai trans-
portation services; (4) Seattle School District No. 1 can plan the continuous
progress center without a transportation system.
Based on current costs of our Voluntary Transfer Program and bids for our
Junior High Transfer Program, it is estimated that each student transported to
the Southeast Education Center would cost $0.85 per day for a yearly cost of
$155.55 per pupil per year (this cost is for an all commercially serviced
program).
Currently, the State pays 90% of all transportation costs. Approximately
300 busses per year are purchased in the State at an average cost of $15,000
for each bus.
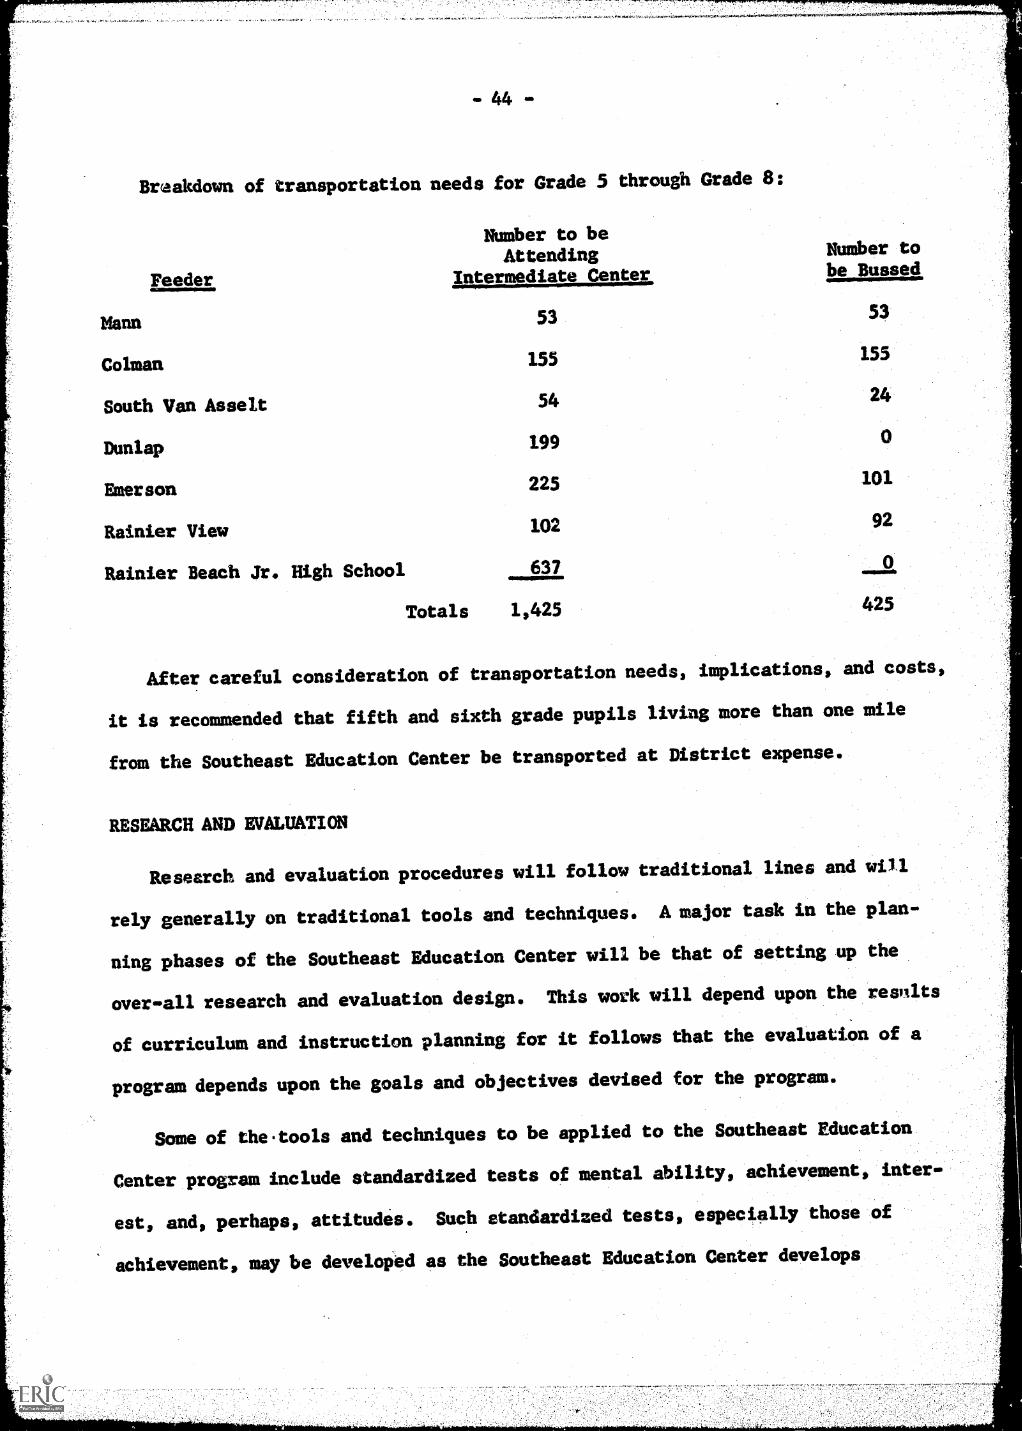
It is estimated that transportation costs for the Southeast Education Center
for the first year will amount to $65,025 for 425 fifth and sixth grade pupils.
-44-
Breakdown of transportation needs for Grade 5 through Grade 8:
Feeder
Number to beAttending
Intermediate Center
Number tobe Bussed
Mann 53 53
Colman 155 155
South Van Asselt 54 24
Dunlap 199 0
Emerson 225 101
Rainier View 102 92
Rainier Beach Jr. High School 637 0
Totals 1,425 425
After careful consideration of transportation needs, implications, and costs,
it is recommended that fifth and sixth grade pupils living more than one mile
from the Southeast Education Center be transported at District expense.
RESEARCH AND EVALUATION
Research and evaluation procedures will follow traditional lines and will
rely generally on traditional tools and techniques. A major task in the plan-
ning phases of the Southeast Education Center will be that of setting up the
over-all research and evaluation design. This work will depend upon the resnits
of curriculum and instruction planning for it follows that the evaluation of a
program depends upon the goals and objectives devised for the program.
Some of the tools and techniques to be applied to the Southeast Education
Center program include standardized tests of mental ability, achievement, inter-
est, and, perhaps, attitudes. Such standardized tests, especially those of
achievement, may be develoPed as the Southeast Education Center develops
-45-
primarily because, with the achievement tests, there is a need for a, different
perspective of pupils, namely, concept and skill level learning rather than
general achievement learning.
Thus, concept-skill level tests' of achievement are vital to teacher evalua-
tion and diagnosis of pupil learning and learning difficulties, as well as to
program evaluation. It would not make sense to discard all of the test devel-
opment and data collected in the present Seattle city-wide testing program for
it looms as a possibility to research the present standardized tests for possible
use as skill-level measures. This would be fairly simple so long as we have an
accumulation of test answer sheets with which to do item analyses.
The above point, regarding the accumulation of answer sheets, points up
one important step during the Southeast Education Center planning phases. That
is the development of base line data on present programs and systems so that
later comparisons may be made when the Southeast Education Center is in opera-
tion. This applies not only to standardized testing but to all other tools,
techniques, and the over-all research design. It also applies to one new evalu-
ation technique--the cost/effectiveness research technique--to be used in the
Southeast Education Center as a model for evaluation and research and development
procedures of the future. In the interim before the Southeast Education Center
becomes reality, it would be important to apply all research and evaluation
techniques against the present program and sr: dm, including the cost/effective-
ness technique.
The Southeast Education Center will let d itself well to all kinds of small
research projects, some generated from outside the system, but most generated
Zrom within the Center by staff members. It will take coordinated efforts to
make such projects possible without disrupting the over-all evaluation design

that would be more critical and could be easily affected by minor factors, for
example, special achievement testing of small groups that would invariably
change the over-all achievement test results as they are collected routinely.
One of the important areas to be included in the over-all research design
is that of teacher diagnosis of pupils' learning speeds and modes and diffi-
culties. Mich of this can be handled with a carefully-planned program using,
for the most part, group tests rather than individual tests of mental ability
and/or achievement. The value of individual testing is lost in the face of
mass demand for information on many pupils, not just one or two. Such diagnosis
based on group tests has sound basis and can be made possible, but it will
require some psychometric research iv. the planning phases for the Southeast
Education Center. Based as it were on group tests, such a system of diagnosis
can easily be understood and used by classroom teachers with a minimum of in-
struction and follow-on, so long as the research information simplifies test
score data into decision-making information.
In the final analysis the questions about the Southeast Education Center
narrow to one, practical question that stems from a point of view that is tied
to the present program, namely, what will the Southeast Education Center accom-
plish that the present program is not already accomplishing? Perhaps the
answer lies in the belief that the Southeast Education Center will perhaps not
change the present program so much as it will change the present system of
operation, including the handling of pupils' needs and interests.
One basic application of the continuous progress-type of program is that
in tying together the various systems-owith-a-systemunits, that is, what is
presently known as elementary, junior blab, and senior Idaschools. In the
past and to a significant degree today these units do not work together as a

- 47 -
cooperative system, for example, staff members at the junior high school unit
level argue that they should not test for the senior high schools, which means
that, in Seattle, if the senior high schools want to use the results of the
Differential Aptitude Tests, then that test should be given by the senior high
schools, not by the junior high schools in ninth grade (giving it in ninth
grade made it possible to have the results by the summer of the year the pupils
entered tenth grade and, therefore, for some early planning for programs such
as the prevocational training program).
If the Southeast Education Center contributes to a better and more contin-
uous working relationship among all levels, then research and evaluation tech-
niques should show that its value to such system function would place the
Southeast Education Center in a favorable position; thus, the need for an ade-
quate research design early in the planning phases.
Central to the successful function of the Southeast Education Center is a
coordinated effort to provide information about all parts of the Southeast
Education Center to staff members as they need such information. This opens up
another facet of the research design, that is the measure of how effectively
the Southeast Education Center accomplishes the information-collecting -and -
dispensing function as compared with the present system. Figure 1 illustrates
one kind of information system which is computer oriented but is under the
control of the various components of the system, or the. Southeast Education
Center in this Instance. This kind of information system will contribute much
to the success of the Southeast Education Center and will be part and parcel
of the over-all research design that will, among others, provide ideas about
computer- assisted operation, its flexibility, its practicality, and, most
importantly, its cost/effectiveness in implementing the continuous progress-
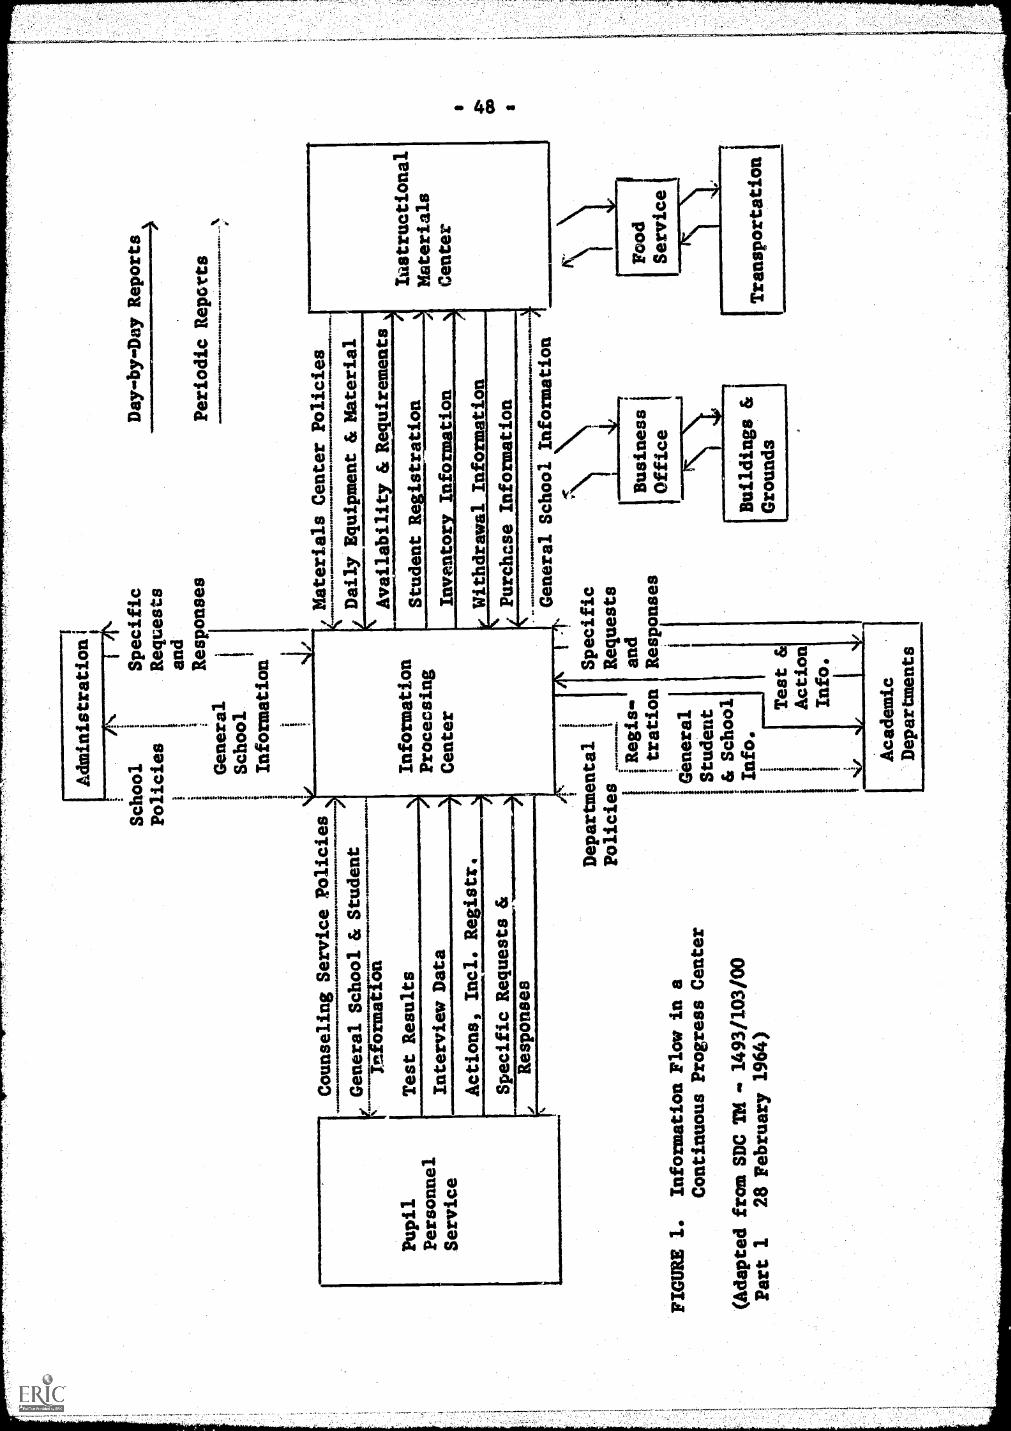
Pupil
Personnel
Service
Administrations
School
Policies
General
School
Information
Counseling Service Policies
IC General School & Student
Test Results
Specific
Requests
and
Responses
Interview Data
Actions, Incl. Registr.
Specific Requests &
Responses
FIGURE 1.
(Adapted
Part 1
Information Flow in a
Continuous Progress Center
from SDC TM - 1493/103/00
28 February 1964)
Information
Processing
Center
!
Departmental
Policies
,...___
1'Regis-
!!tration
1
General
;Student
I & School
Info.
11
i1
I1
1 i w
...
Test &
Action
Info.
Academic
1
Specific
Requests
and
Responses
Day -by -Day Reports
Periodic Reports
Materials Center Policies
*.m
oot.
Daily Equipment & Material
Availabilit & Requirements
Student Registration
Inventory Information
<Withdrawal Information
Purchase Information
1111
.1rs
......
...0*
.imin
f.11.
......
..IM
General School Information
Departments
4/Business
Office
Buildings &
Grounds
1
Instructional
Materials
Center
Food
Service
I
1Transportation

-49 -
type of program. This information system will also contribute significantly
to the general research and experimentation analyses resulting from the appli-
cation of tools and techniques to the Southeast Education Center program and
the collection of data frog that program.
The cost/effectiveness evaluation technique referred to above is, as has
been indicated, a new tool or technique in evaluation and experimentation and,
to some observers, seems a little foreign to the area of evaluation, and yet
this technique is clearly related to what any trained research-and-experimenta-
tion person knows is experimental design. Experimental design and cost/effective-
ness technique are based on the need to define and describe a system so that
any data collected from the system are interpretable. It is possible with a
good experimental design to analyze all of the factors which affect the system
and to gradually modify the system to eliminate the irrelevant and insignificant
factors and "beef up" the relevant and significant factors. This is precisely
what an adequate cost/effectiveness technique can accomplish. The only differ-
ence between calling one technique an experimental design, and the other tech-
nique a ccst/effectiveness technique, is mainly in their respective contexts;
the experimental design is rooted in scientific research while the cost/
effectiveness technique is rooted in financial accounting. The cost/effective-
ness technique also perhaps lends itself well to an over-ail experimental
design but actually the cost/effectiveness techniques can rely heavily on an
adequate experimental design in accomplishing its, essentially, "good business
practice" task.
One of the most recent attempts to apply cost /effectiveness procedures or
technique to the educational setting was that by Technomics, Inc., 1455
Eineteenth Street,. Santa Monica, California, under a grant from the U. S. Office
77-
-50-
of Education dealing with evaluation of the effectiveness of projects funded
under Title I of ESEA 1965. Although much of the work of Technomics staff
members was frustrating, one of the outgrowths of the attempt was what Tech-
=mice refers to as The Educational Observatory: A Model for Rational Planning,
(a proposal dated June 13, 1967, which is pending pickup by interested school
districts). This is a proposal to do systematic planning within a school
system toward a Logical application of learning theory principles and a con-
current application of experimental design and cost/effectiveness procedure
so that the factors which are irrelevant and insignificant can be eliminated
and their costs transferred to other more relevant and significant factors
within the system.
Finally, one of the most important concerns c2 the Southeast Education
Center is that it makes it possible for students and pupils to move through
the system at the various learning rates and modes found individualized in any
group. One of the major research and evaluation portions of the over-all
design will begin with reasonable expectations for what should be learned in
any given subject area over any given period of time. This will be based on
psychometric and curriculum research findings combined with pupil personnel
data which would have a major part in determining learning rates and modes.
Follow-on would occur as the continuous progress program developed, and such
follow-on would provide data with which to evaluate the degree of success of
students in pursuing learning and which factors in the system are relevant
and important to such pursuit, Isolating the factors will be the one area of
greatest difficulty, but in its difficulty it will provide additional research
data on how feasible it is to set up expectations for learning, to measure the
progress of pupils through that learning, and to identify the relevant and
significant factors. Thus, the Southeast Education Center becomes a vehicle

- 51 -
for doing research in the area of educational objectives-curriculum-instruction
that would contribute locally and nationally to educational and psychological
theory.
There are many tools and techniques, both traditional as well as new, that
will be applied to the Southeast Education Center in all of the research and
evaluation attempts. These include experimental design, cost/effectiveness
procedures, psychometric research and development, standardized tests (mental
ability, achievement, interest, attitudes), student/pupil reaction questionnaires,
staff/administrative reaction questionnaires, visitor/expert reaction question-
naires, parent/community reaction questionnaires, but are not limited to these.
The Southeast Education Center is visualized as a research-development-
demonstration vehicle which can lend itself well to model simulation and
laboratory school-type implementation. The findings from such simulation and
implementation can be used in modifying other parts of the Seattle system and
cut down on the amount of isolated research that now goes on to answer questions
about the system. On the other side, it also cuts down on the problems of trying
out new models and innovations which might have adverse effects on the system,
mainly by limiting them for the most part to the Southeast Education Center.
DISSEMNATION
The method of disseminating information about the program, according to the
information content, will be through press releases, brochures, lectures, con-
ferences, and television programs. Further, in developing plans for the South-
east Education Center, ample opportunities will be given citizens that they may
react to the plans as they are being developed.
All information before it is disseminated will be tested against the criteria
listed for Title III projects, that is for clarity, validity, pervasiveness,
impact, timeliness, and practicality.
Specific methods for disseminating information will be developed during the
first phase of work within the framework mentioned above.
Dissemination will begin at the inception of the project in the form of
public, as well as staff, meetings with the visiting consultants. These meet-
ings will help participants understand the concept and establish the foundation
for evaluating later reports. Full mass media coverage will be provided the
consultants.
We will expect the Southeast Education Center advisory council to assume
important functions in disseminating information and in establishing an
effective liaison between the community and the School District.
We will expect the State Office of Public Instruction to assist materially
in disseminating information about the Southeast Education Center.
At the national level, ERIC, the consultants, and the participating founda-
tions will interpret and distribute information.
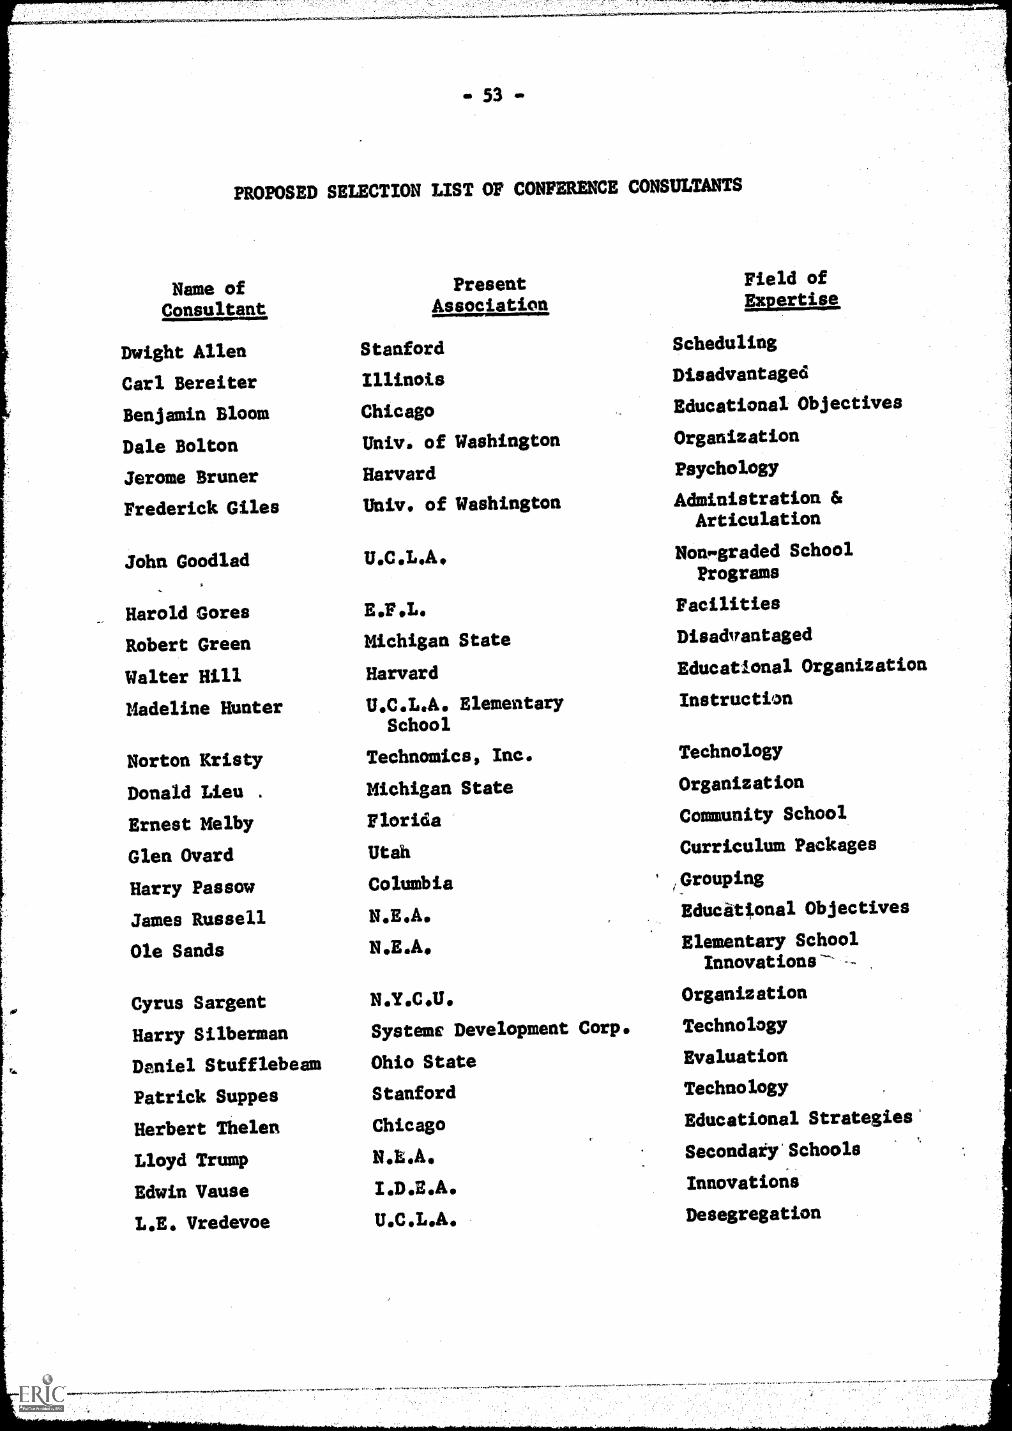
53
":,.-7..7.7-7.7" 7.::::.:77.1`.7
PROPOSED SELECTION LIST OF CONFERENCE CONSULTANTS
Name ofConsultant
Dwight Allen
Carl Bereiter
Benjamin Bloom
Dale Bolton
Jerome Bruner
Frederick Giles
John Goodlad
Harold Gores
Robert Green
Walter Hill
Madeline Hunter
Norton Kristy
Donald Lieu .
Ernest Melby
Glen Ovard
Harry Passow
James Russell
Ole Sands
Cyrus Sargent
Harry Silberman
Daniel Stufflebeam
Patrick Suppes
Herbert Thelen
Lloyd Trump
Edwin Vause
L.E. Vredevoe
PresentAssociation
Stanford
Illinois
Chicago
Univ. of Washington
Harvard
Univ. of Washington
N.E.A.
U.C.L.A.
E.F.L.
Michigan State
Harvard
U.C.L.A. ElementarySchool
Technomics, Inc.
Michigan State
Florida
Utah
Columbia
N.E.A.
N.Y.C.U.
Systems Development Corp.
Ohio State
Stanford
Chicago
N.E.A.
I.D.E.A.
U.C.L.A.
Field ofExpertise,
Scheduling
Disadvantaged
Educational Objectives
Organization
Psychology
Administration &Articulation
Nonmgraded SchoolPrograms
Facilities
Disadvantaged
Educational Organization
Instruction
Technology
Organization
Community School
Curriculum Packages
;Grouping
Educational Objectives
Elementary SchoolInnovations--
Organization
Technology
Evaluation
Technology
Educational Strategies'
Secondary' Schools
Innovations
Desegregation
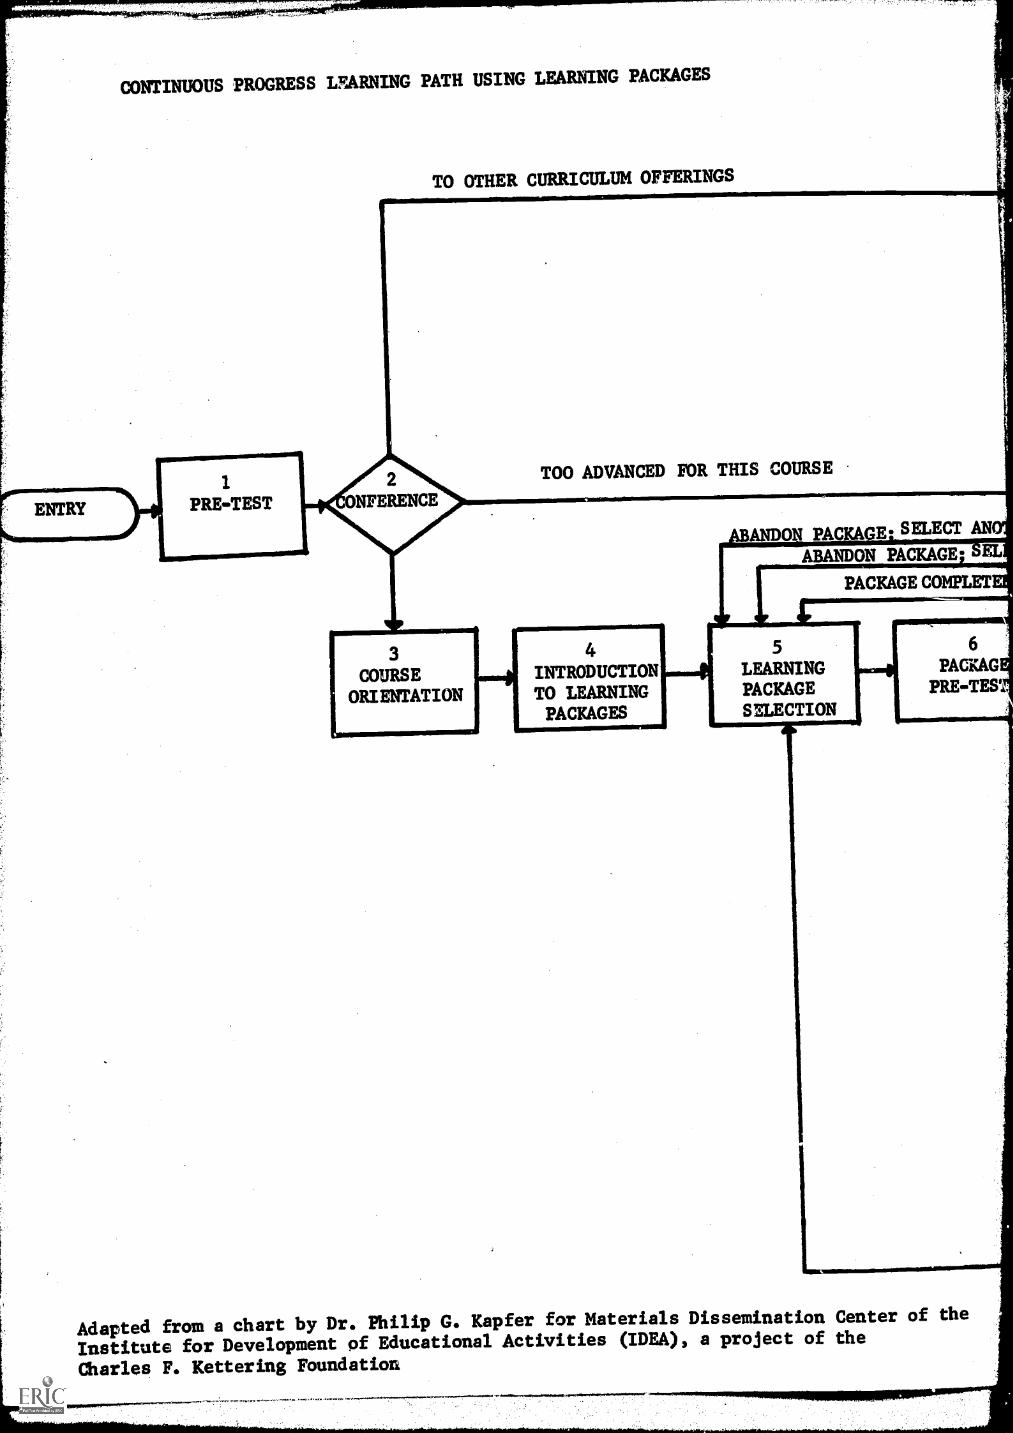
ENTRY
CONTINUOUS PROGRESS LEARNING PATH USING LEARNING PACKAGES
1
PRE-TEST
TO OTHER CURRICULUM OFFERINGS"sr
TOO ADVANCED FOR THIS COURSE
3
COURSEORIENTATION
0 4INTRODUCTIONTO LEARNINGPACKAGES
.ABANDON PACKAGE. SELECT ANELABANDON PACKAGE
fp5
LEARNINGPACKAGEPACKAGESELECTION
PACKAGE COMPLET
6
PACKAGPRE-TEK
Adapted from a chart by Dr. Philip G. Kapfer for Materials Dissemination Center of the
Institute for Development of Educational Activities (IDEA), a project of the
Charles F. Kettering Foundation

'7777777
180.4
QUALITY ANDQUANTITY
MARKS GIVEN
ANOTHER
17
COURSEPOSTTEST
SELECT ANO
7
CONFERENC pRormln TO POST-TEST
w1:4445
CiMg54AI 504 A4
8
LEARNINGPACKAGE
011111111111011
9
SELF-TEST
FURTHER STUDY NEEDED
PROCEED TO QUEST
11
LEARNINGPACKAGEPOST-TEST
2
ONFERENC
13
QUESTACTIVITYSELECTION
11AcTurrnQUEST14 15
RESOLUTION
PACKAGE COMPLETED: SELECT ANOTHER
4,.#44,ioto50.rav-'
COURSE COMPLETEDPROCEED TO EXIT

1777=7-r:7I7.T.7.r.2r.nn
CREDITS
This document was prepared for the Superintendent of the SeattlePublic Schools, Forbes Bottomly, by the Task.Force on.ContinuousProgress Education.
Task Force Members
Chairman: Dale Goss, Director of Planning and Research
Elmo Little, Administrative Assistant forLeadership Training Program
James Moore, Research Assistant
Kent Stephens, Director of Business Services
The study of facility requirements was directed by Walter Larsen,Director of Facilities, assisted by Erving Easton, Coordinatorof Bui:ding Planning; Phillip Smith, Supervisor of Building Plan-ning; Carl Andresen, Supervisor of Maintenance; Tom Smith,Supervisor of Drafting Room; Elaine Peterson, architect.
The reports were prepared and compiled under the direction ofPhyllis Skoog, secretary, Planning and Research Department,assisted by Helen Baker, Dorothy Boe, Shirley Hect, MaxineKlein, Robin Sheehan.
Maps were prepared by Dan Kaylor.
Top Related