


Languages
Pages
Legal


Report of the Chief Medical Officer
Dr. Merceline Dahl-Regis
Commonwealth of The Bahamas
2004-2008


1 Foreword 12 Executive Summary 23 Acknowledgements 44 Acronyms and Conventions 55 Introduction 66 Physical & Political Description 77 Population Demographics 9
7.1 Population Trends 97.2 Population Mortality Trends 12
8 Sector Policies, Plans & Supporting Systems 178.1 Policies to Guide Delivery of Services 178.2 Plans, their Assessments and Evaluations 178.3 Legislation in Support of Service Delivery 178.4 Health Information 18
9 Health Infrastructure 199.1 Organizational Structure 199.2 Service Delivery 209.3 Facilities 219.3.1 Hospitals 219.3.2 Health Centres 239.4 Resources 259.4.1 Manpower 259.4.2 Health Services Financing 26
10 Health Services & Programmes 2810.1 Maternal and Child Health 2810.2 Expanded Programme of Immunization 3110.3 School Health Services 3210.4 Infectious Disease Surveillance 3510.5 HIV/AIDS 3710.6 Tuberculosis 4210.7 Non-communicable Diseases & Injuries 4410.8 Mental Health Services 4610.9 Oral Health Services 4710.10 Nutrition 4910.11 Health Promotion & Education 5010.12 Healthy Lifestyles Initiative 5010.13 Prison Health Services 50
TABLE OF CONTENTS

11 Environmental Health Services 5211.1 Water and Sewerage Management 5211.2 Solid Waste Management 5211.3 Food Safety – Establishments Inspected and Passed; Training of Food Handlers 5211.4 Vector Control – Aedes Aegypti Indices; Rodent Control Activities 5311.5 Port Health – Inspections and Results 55
12 Hospital Services 5612.1 In-patient 5612.2 Laboratory 5612.2.1 Emergency Response 5712.2.2 Outpatient Services 60
13 Health Situation 6213.1 General Population 6213.2 Population Sub-groups 6413.2.1 Infants 6413.2.2 Children Aged 1-4 years 6413.2.3 Children, Aged 5-14 years 6613.2.4 Adolescents Aged 15-24 years 6613.2.5 Persons Aged 25-44 years 6713.2.6 Persons Aged 45-64 years 67
14 Conclusions 6914.1 Summary of Achievements 6914.2 Future Strategic Foci 6914.3 Recommendations and Proposals/Plans for the Future 70
15 References 7116 Tables and Figures 72

MInistry of Health, Commonwealth of The Bahamas 1
The Chief Medical Officer’s (CMO’s) Report 2004-2008 is the third in a series of published reports that describes the health status of the peoples of The Bahamas. Since 1963, the Government of The Bahamas has made health care available to all citizens through the Department of Public Health. In more recent times the revised Health Act of 1999 supported the mission of the Ministry of Health which is to “ensure that the highest quality of services for health promotion, health protection and healthcare are accessible to all residents of The Bahamas in order to achieve optimal health.” Guided by this mission The Ministry of Health continues to operate from a social model whereby improvements to health and well-being are achieved by directing efforts to-wards addressing the social and environmental determinants of health, among others.
The national healthcare system consists of three key components: the Ministry of Health, the Department of Public Health, and the Public Hospitals Authority, the latter of which was established by an act of Parliament in 1999. Recognizing that the Ministry cannot provide health services by itself, it partners with non-governmental organizations, and other private agencies to provide a comprehensive approach to healthcare for its residents.
The status of a nation’s health, like an individual’s, is largely a matter of choices. This report describes the health system’s perfor-mance and identifies choices and possible linkages with related programmes. Data in this report can be used to guide design of national health services strategic plans and can provide direction to major programme priorities impacting the health outcomes of residents across the Bahamian archipelago.
The Bahamas’ health care system has seen many improvements that include expansion of specialists’ services. This has resulted in growing health expenditures, many of which are technology driven. It is vital that we strike a balance among preventive services, primary care services, and curative services. During the period 2004-08, gains were made, however we were not successful in re-orienting health services, nor has there been a corresponding redistribution of resources that helps in striking such a balance. This redistribution must include appropriate funding for the three sectors of public health (human, environmental and veterinary) which will be the key to the success of improving the social determinants of health.
Moving forward, we must integrate environmental services with health services and balance primary health services and curative services, in order to make changes on those core determinants of health that will move us toward better results, thereby improv-ing the lives of the residents of The Bahamas.
The data presented in this report underscore the necessity of accurate data to support the analysis in the overall assessment and evaluation of interventions to serve the health needs of the people of The Bahamas.
Optimal results are achieved when individuals also make healthy choices
Dr. Merceline Dahl-RegisChief Medical Officer31 December 2010
1 FOREWORD

2 Annual Report of the Chief Medical Officer
The period 2004-08 has proven to be a challenging time for the Ministry of Health (MOH). Many changes have occurred, in the health sector nationally and globally, that have impacted the health of the Bahamian people. Throughout this period, the MOH has transitioned through several organizational structures. Initially, the Government directed the inclusion of the Department of Environmental Health Services (DEHS) in MOH; later it reassigned DEHS to a newly created Ministry of Environment. The separation of public health activities in DEHS to another Ministry has been one of a series of challenges encountered by MOH in managing public health threats, emergencies and events.
The country has focused attention on social factors impacting health issues, including a rise in violence resulting from urbanization and economic problems. Nevertheless, the level of governmental commitment to health strategies and services has remained constant, despite an economic downturn. For its part, the MOH has worked to sustain the Bahamian people’s health in the face of these mounting challenges.
The MOH adopted the WHO guidelines for food health/food safety, assuming full responsibility for training food handlers in food safety—shifting from physical exam and stool examination-based health certification to a knowledge-based food handlers certification process, in compliance with internationally accepted guidelines for food safety. Consequently, we have had zero outbreaks of foodborne illness in the community.
The World Health Assembly revised the International Health Regulations (IHR (2005)), and The Bahamas became a signatory at the 58th World Health Assembly. This revision laid the solid groundwork for capacity building in surveillance—nationally, regionally, and internationally—as well as strengthening port health surveillance. Pandemic planning incorporated a multitude of agencies; it sought to develop a national response to emerging threats posed by Influenza A (H5N1). The IHR (2005) came into effect in June 2007; and in 2008, The Bahamas conducted an assessment of its capacity to provide surveillance, response, and control for possible public health emergencies of international scale and scope. This established inter-sectoral, inter-ministerial, inter-departmental, and interagency networks and strengthened private-public partnerships for health promotion and prevention.
The MOH also conducted the “Chronic Noncommunicable Diseases (CNCD) Prevalence Study and Risk Factor Survey” in 2005, aimed at identifying determinants of CNCD’s that contribute to the burden of disease in The Bahamas. The Healthy Lifestyles initiative was launched; a new MOH initiative aimed at increasing awareness—and reducing the impacts—of chronic non-communicable diseases on residents of The Bahamas. With the prevalence of hypertension and diabetes both on the rise, the Ministry of Health sought innovative approaches to strengthen community involvement in managing these epidemics.
The MOH also resourced the scaling up of access to antiretroviral therapy (ART) for persons infected with HIV/AIDS, and it has provided medications free of charge to all persons meeting treatment criteria. This has been beneficial in reducing both the level of hospitalizations and deaths associated with HIV/AIDS—moving it from one of the top one or two causes of death to the #4 cause of death by 2008. Gilead began production of the antiretroviral drug Viread® (tenofovir) in Grand Bahama. This drug has contributed to the management of AIDS locally and globally.
In addition, in 2006 The Bahamas successfully managed a malaria outbreak on the island of Great Exuma through cooperative efforts by the Department of Public Health (DPH) and DEHS with significant support from the Pan American Health Organization (PAHO). Commendation for our management of this outbreak internationally was echoed by US Centers for Disease Control and Prevention. We have been cited for “textbook” management of an outbreak, resulting in rapid containment of a potential public health threat of global concern.
2 ExECuTivE SuMMARy

MInistry of Health, Commonwealth of The Bahamas 3
The Department of Public Health began a restructuring exercise in 2006 and continued into 2007, which included the introduction of management teams in polyclinics aimed at increasing efficiency and improving patient care. These polyclinics aligned with regionalized groups of Family Island services and each polyclinic assumed responsibility for referral services for their regional cluster and to provide support for the staff resulting in a more efficient referral system and continuity of care. Extended hours for patient care were reintroduced in the polyclinics to meet increased patient demand for services.
In 2008, oncology services relocated to newly renovated facilities in Princess Margaret Hospital, enabling oncology care to be provided for persons with cancer in a setting that is more spacious and more appropriately equipped.

4 Annual Report of the Chief Medical Officer
The production of this report would not be possible without the assistance of managers of the National Programmes and their support staff , including Ms. Camille Deleveaux and staff in the Health Information and Research Unit; Ms. Margaret Daxon and staff in the Chronic Noncommunicable Disease Unit; Dr. Cherita Moxey; Ms. Amelia Collie; and many other personnel throughout the Ministry of Health, the Department of Public Health and the Department of Environmental Health Services. Appreciation is extended to Ms. Sandra Smith and Mrs. Kathy Johnston of the Planning Unit in the Ministry of Health. Gratitude is also extended to Ms. Sherrylee Smith for editing the report. Special thanks are extended to the Pan American Health Organization/World Health Organization (PAHO/WHO), whose sponsorship of Ms. Yvette Holder, Consultant Epidemiologist and Biostatistician, enabled this report to come to fruition. Particular thanks are given to Dr. Merle Lewis (PAHO) for her inspiration and continued support.
3 ACkNOWLEDgEMENTS

MInistry of Health, Commonwealth of The Bahamas 5
- No cases recorded… Data not availableABG Arterial Blood GasAIDS Acquired Immune Deficiency SyndromeAnti-HBS Antibody to Hepatitis B Surface AntigenARI Acute Respiratory InfectionART Antiretroviral TherapyATT Attenuated Tetanus ToxoidBP Blood PressureCAREC Caribbean Epidemiology CentreCCAC Community Counseling and Assessment CentreCDR Crude Death RateCLAP Latin American Centre for PerinatologyCMO Chief Medical OfficerCMV CytomegalovirusCNCD Chronic Non-Communicable DiseasesCSF Cerebral Spinal FluidCVA Cerebro-vascular AccidentDEHS Department of Environmental Health ServicesDHSS Dengue Haemorrhagic Shock Syndromedmft decayed, missing, and total deciduous teethDMFT Decayed, Missing and Filled permanent TeethDOT Directly Observed TherapyDPH Department of Public HealthDPT Diphtheria, Pertussis and Tetanus VaccineEMS Emergency Medical ServicesENT Ear, Nose and ThroatEPI Expanded Programme on ImmunizationGBHS Grand Bahama Health SystemGC GonnococcalGDP Gross Domestic ProductG/E GastroenteritisGm(s) Gram(s)GPC General Practice ClinicHAV Hepatitis A VirusHb HaemoglobinHBsAg Hepatitis B Surface AntigenHBV Hepatitis B Vaccine HCV Hepatitis C VirusHIRU Health Information and Research UnitHIB Haemophilus influenza type B vaccineHIV Human Immunodeficiency Virus
HMP Her Majesty’s PrisonHR Human ResourceHTLV 1 & 2 Human T-Lymphotrophic Virus 1 & 2ICU Intensive Care UnitIHR International Health RegulationsIMR Infant Mortality RateL.E. Life ExpectancyMCH Maternal and Child HealthMDG Millennium Development GoalsMOH Ministry of HealthMMR Measles, Mumps and Rubella vaccineMTCT Mother-to-child TransmissionNICU Neonatal Intensive Care UnitOB ObstretricsPAHO Pan American Health OrganizationPET Pre-Eclamptic ToxaemiaPHA Public Hospitals AuthorityPHAC Public Health Agency of CanadaPKD Polycystic Kidney DiseasePMTCT Prevention of Mother-to-child TransmissionRTA Road Traffic AccidentRTI Road Traffic InjuryPMH Princess Margaret HospitalPSW Private Surgical WardRMH Rand Memorial HospitalSCBU Special Care Baby UnitSIP Perinatal Information SystemSLE Systemic Lupus ErythematousSRC Sandilands Rehabilitation CentreSTD Sexually Transmitted DiseaseSTI Sexually Transmitted InfectionTB TuberculosisUA Urine AnalysisUHCG Urine Human Chorionic GonadotrophinVDRL Venereal Disease Research Laboratory (Test)URTI Upper Respiratory Tract InfectionWHO World Health OrganizationYPLL Years of Potential Life Lost
4 ACRONyMS AND CONvENTiONS

6 Annual Report of the Chief Medical Officer
The Report of the Chief Medical Officer is intended to offer information about the performance of the health care system and the overall health of the population. This document provides a forum for discussion of health determinants that impact residents of the country and describes the impact that programmes designed to improve the health of our residents have had on the country. Further, it allows one to examine the relationship between health policy and the technical outputs that occur as a result of our national programmes. The use of data in this report can help policymakers and programme managers guide their development of interventions aimed at decreasing morbidity and mortality and promoting good health.
The Chief Medical Officer’s Report also evaluates the performance of the health system, in identifying gaps in programmes and coverage, in order to improve upon currently available services. This report paints a picture of the nation’s health status, as evidenced by the progress made toward the achievement of the Millennium Development Goals (MDGs).
Throughout the time period covered by most of this report, MOH has been challenged with major changes in its organizational structure, especially the migration and return of Environmental Health Services. As a key member of the public health team, the Department of Environmental Health Services is an essential component of the environmental management of determinants of health; as such, whether they are organizationally included in the Ministry of Health or situated in a parallel agency, they are critical to our attainment of improved health within the nation.
5 iNTRODuCTiON

MInistry of Health, Commonwealth of The Bahamas 7
The Commonwealth of The Bahamas comprises an archipelago of some 700 islands situated in the Caribbean Sea. Fewer than 40 are inhabited. Most of our 300,000 Bahamians live on two main islands, New Providence, with the Commonwealth’s capital Nassau, and Grand Bahama.
The country’s economic mainstays are tourism and banking, both of which contribute to give the country one of the highest per capita Gross Domestic Products (GDP) in the English-speaking Caribbean. The per capita GDP had been increasing steadily until 2008, when the country began to experience the cascading consequences of the global economic downturn, including a decrease in tourist arrivals (Table 1). Household income declined in 2008 to pre-2007 levels, although inequality in income distribution widened slightly—a marginal decrease in the Gini coefficient demonstrating a continued trend from 2001 (Gini coefficient of 0.5745 (Bahamas Survey of Living Conditions, 2001)).
Table 1. Socio-Economic indicators
yEAR Per capita gDP1,2
H/hold income3,4, 5 gini Coeff.2 unemployment
Rate%3,4
2004 19,281.4 39, 626 … 10.2
2005 20,132.6 38, 891 … 10.2
2006 22,060.9 43, 421 … 7.6
2007 22,448.7 45, 221 0.45 7.9
2008 22,102.2 43, 459 0.44 8.7
1 At current market pricesSources: 2 World Statistics Pocketbook/United Nations Statistics Division (Economic Commission of Latin America and the Caribbean)3 Department of Statistics, The Bahamas in Figures, 20074 Idem. 2008 Labour Force and Household Income Survey5 Idem. 2009 Labour Force and Household Income Survey (in print)
Generally, the Commonwealth of The Bahamas has an active labour force. Participation rates have hovered around 76% for the past decade and participation continues beyond the retirement age (Table 2). Unemployment rates had been less than 10% since 2005 and youth unemployment has decreased slightly from 18.9% to 17.6%. Notable, too, is that 67% of the labour force is employed by the private sector. However, public service remains the largest employer, employing 31% of all employed persons. It is surmised that many persons, upon their retirement from public sector jobs, then are employed by the private sector.
30% of the labour force reported having no educational certificate—i.e., had passed no national examination. As expected, this rate is higher among the unemployed than among the employed, 45.0% and 28.6% respectively (Table 3). Men were more likely to have no educational certificate than women among both unemployed (52.0% vs. 40.2% respectively) and employed persons (35.2% vs. 21.6% respectively).
6 PHySiCAL AND POLiTiCAL DESCRiPTiON

8 Annual Report of the Chief Medical Officer
Table 2. Labour Force by age and sex, All Bahamas, 2008
Labour Force by Age, gender and Employment Status
AgE gROuP Total Labour Force Employed Labour Force unemployed Labour Force
Total Women Men Total Women Men Total Women Men
N % N % N % N % N % N % N % N % N %
15-19 10,785 6 4,425 5 6,360 6 8,120 5 3,130 4 4,990 5 2,665 16 1,295 14 1,370 18
20-24 21,790 11 10,205 11 11,585 12 18,705 11 8,395 10 10,310 11 3,085 19 1,810 20 1,275 17
25-34 47,225 25 23,475 25 23,750 24 42,605 24 20,750 25 21,855 24 4,620 28 2,725 30 1,895 25
35-44 48,735 25 25,565 27 23,170 24 45,600 26 23,870 28 21,730 24 3,135 19 1,695 19 1,440 19
45-54 38,685 20 18,870 20 19,815 20 36,420 21 17,710 21 18,710 21 2,265 14 1,160 13 1,105 15
55-64 18,165 9 8,360 9 9,805 10 17,505 10 8,070 10 9,435 10 660 4 290 3 370 5
65 and over 5,185 3 1,675 2 3,510 4 5,020 3 1,605 2 3,415 4 165 1 70 1 95 1
Not Stated 1,025 1 585 1 440 0 945 1 555 1 390 0 80 0 30 0 50 1
Total 191,595 100 93,160 100 98,435 100 174,920 100 84,086 100 90,835 100 16,675 100 9,075 100 7,600 100
Table 3. Labour Force by highest examination passed, 2008.
LABOuR FORCE By HigHEST ExAMiNATiON PASSED AND SEx:2008
ALL BAHAMAS
ExAMiNATiON PASSEDTOTAL LABOuR FORCE EMPLOyED uNEMPLOyED
TOTAL % WOMEN MEN TOTAL WOMEN MEN TOTAL WOMEN MEN
None 57,730 30 21,775 35,955 50,130 18,130 32,000 7,600 3,645 3,955
BJC/Pitman/RSA, Etc. 30,000 16 14,920 15,080 27,000 13,200 13,800 3,000 1,720 1,280
GCE O Level/BGCSE 35,770 19 20,040 15,730 32,555 18,035 14,520 3,215 2,005 1,210
GCE ‘A’ Level/Associate Degree 17,745 9 11,005 6,740 17,220 10,515 6,705 525 490 35
Degreed Persons 25,765 13 14,110 11,655 25,150 13,830 11,320 615 280 335
Professional (Non-University)/ Other Trade Certificate 22,085 12 10,485 11,600 20,835 9,895 10,940 1,250 590 660
Not Stated 2,500 1 825 1,675 2,030 480 1,550 470 345 125
Total 191,595 100 93,160 98,435 174,920 84,085 90,835 16,675 9,075 7,600

MInistry of Health, Commonwealth of The Bahamas 9
7.1 POPuLATiON TRENDS
Fig. 1. Distribution of population by age and sex, 2004.
05,00010,00015,00020,000
Male
0-45-910-1415-1920-2425-2930-3435-3940-4445-4950-5455-5960-6465-6970-7475-7980+
0 5,000 10,000 15,000 20,000
Female
0-45-9
10-1415-1920-2425-2930-3435-3940-4445-4950-5455-5960-6465-6970-7475-79
80+
05,00010,00015,00020,000
Male
0-45-910-1415-1920-2425-2930-3435-3940-4445-4950-5455-5960-6465-6970-7475-7980+
0 5,000 10,000 15,000 20,000
Female
0-45-9
10-1415-1920-2425-2930-3435-3940-4445-4950-5455-5960-6465-6970-7475-79
80+
Fig. 2. Fig.2. Population distribution by age and sex, 2008.
0 5,000 10,000 15,000 20,000
Male
0-45-9
10-1415-1920-2425-2930-3435-3940-4445-4950-5455-5960-6465-6970-7475-79
80+
0 5,000 10,000 15,000 20,000
Female
0-45-9
10-1415-1920-2425-2930-3435-3940-4445-4950-5455-5960-6465-6970-7475-79
80+
0 5,000 10,000 15,000 20,000
Male
0-45-9
10-1415-1920-2425-2930-3435-3940-4445-4950-5455-5960-6465-6970-7475-79
80+
0 5,000 10,000 15,000 20,000
Female
0-45-9
10-1415-1920-2425-2930-3435-3940-4445-4950-5455-5960-6465-6970-7475-79
80+
Source: Department of Statistics
Population pyramids are evolving from a triangular shape to one like a barrel with a shrinking base, narrow apex and a bulging centre from which the labour force is drawn (Figs. 1-2). Given a low dependency ratio of 0.54, each person of employable age (15-59) needs to support less than one additional person who is not employed.
7 POPuLATiON DEMOgRAPHiCS

10 Annual Report of the Chief Medical Officer
Table 4. Basic Demographic indicators, 2002 - 2008
Year
indicator 2002 2003 2004 2005 2006 2007 2008
Estimated Mid-Interval Population 312,100 316,298 320,800 325,200 329,500 334,000 338,300
Estimated # women 15-44 age group 79,800 80,700 81,400 82,100 82,900 83,200 83,800
Total Births 5,270 5,132 5,250 5,654 5,390 5,937 5,562
Live Births 5,216 5,054 5,154 5,548 5,296 5,854 5,480
Live Birth Rate (per 1,000 pop.) 16.7 16.0 16.1 17.1 16.0 17.5 16.2
Live Births (Registered*) for females 15-44 years 4,866 4,942 5,099 5,531 5,232 5,146 5,088
General Fertility Rate (live births per 1,000 females 15-49 yrs) 58.2 56.1 55.5 50.0 55.4 61.1 56.7
Total Fertility Rates 1.92 1.87 1.90 2.05 1.93 2.14 2.00
Total Number of Deaths 1,827 1,666 1,736 1,824 1,730 1,798 1,862
Deaths Rate (per 1,000 pop.) 5.9 5.3 5.4 5.6 5.2 5.4 5.5
Stillbirths 54 90 96 106 94 83 82
Stillbirth Rate (per 1,000 total births) 10.4 17.8 18.6 19.1 17.7 14.2 15.0
Natural Increase 3,414 3,388 3,418 3,724 3,566 4,056 3,618
Natural Increase Rate (per 1,000 pop.) 10.9 10.8 10.6 16.5 10.8 12.1 16.0
Infant Deaths 87 87 89 109 96 103 98
Infant Death Rate (per 1,000 live births) 16.7 17.2 17.3 19.6 18.1 17.6 17.9
Perinatal Death Rate (per 1,000 total births)** *(2006, estimated occurrence)
… 21.2 22.3 25.9 24.8 28.5 23.2
Neonatal Deaths *(2006, estimated occurrence)* … 30 30 72 69 81 66
Neonatal Death Rate (per 1,000 livebirths)* … 5.9 5.8 13.0 13.0 13.8 12.0
Maternal Deaths (Registered) 0 2 2 5 0 4 3
Child Deaths (1-4 Years) … 10 15 18 8 6 15
Child Mortality Rate (per 10,000 children) … 3.9 6.5 7.8 3.4 2.7 6.5
Sources: Department of Statistics and Health Information & Research Unit, Ministry of Health

MInistry of Health, Commonwealth of The Bahamas 11
Fig. 3. Trends in population growth and associated factors, 1998 - 2008
27,0000
28,0000
29,0000
30,0000
31,0000
32,0000
33,0000
34,0000
35,0000 Est. Pop.
200820072006200520042003200220012000199919980
5
10
15
20
25Livebirth Rate Nat. Incr.
20082007200620052004200320022001200019991998
# of
Per
sons
Per 1
,000
pop
ulat
ion
Source: Department of Statistics
The natural increase of population varied between 10.6 and 12.1 persons per 1000, contributing to a stable average annual population growth of 1.9% for the past decade (Fig. 3).
Fig. 4. Age-specific fertility rates by age-group, 2004 - 2008
0
20
40
60
80
100
120 20082007200620052004
45-4940-4435-3930-3425-2920-2415-19
Per 1
,000
pop
ulat
ion
Age Group
Source: Health Information and Research Unit
A slight increase in fertility rates was seen in all age-groups, including the 15-19 year old group (Fig. 4). This overall increase in all age groups peaked in 2007, with a decrease in 2008, however the rates never returned to the levels of 2004.

12 Annual Report of the Chief Medical Officer
7.2 POPuLATiON MORTALiTy TRENDS
As death rates stabilized, so did life expectancies, with gains becoming relatively smaller (Table 5). Male life expectancy has steadily increased, while female life expectancy has varied slightly but remains greater than male life expectancy.
Table 5. Life expectancy at birth, 1980 – 2008
ca. 1980 ca. 1990 ca. 2000 2008
L.E. C.D.R. L.E. C.D.R. L.E. C.D.R. L.E. C.D.R.
Male 64.3 7.9 68.3 5.9 69.9 6.1 71.0 6.2
Female 72.1 5.0 75.3 4.6 79.4 4.7 76.7 4.8
Source: Department of Statistics
Fig. 5. Mortality rates – crude death rate per 100,000 pop., infant, neonatal and perinatal mortality rates per 1000 livebirths, and stillbirth rates per 1000 livebirths, 1998 - 2008
0
5
10
15
20
25
30
Crude Death Rate
Stillbirth Rate
Perinatal MR
Neonatal MR
IMR
20082007200620052004200320022001200019991998
Rate
s
Year
Source: HIRU
Stillbirth rates, and hence, perinatal mortality rates show a rising trend (Fig. 5). Neonatal deaths more than doubled in 2005, from 30 to 72; although decreasing from then onwards, these remained higher than previous levels (Tables 4, 6). Also notable was an increase in late neonatal deaths to 25 in 2005 from 8 the previous year, with no significant decline in subsequent years. The apparent increase may be due to improved reporting. It is remarkable that this was also the year of greatest natural increase.

MInistry of Health, Commonwealth of The Bahamas 13
Table 6. Foetal and infant Deaths by age, 1999 - 2008
yEAR FOETAL DEATHS REgiSTERED iNFANT DEATHS By AgE TOTAL iNFANT DEATHS
<6 days 7-27 days 28 days-11mths. Registered Est. Occurrences*
1999 75 18 14 17 49 85
2000 63 19 10 23 52 78
2001 51 8 15 14 37 68
2002 54 … … … … 87
2003 90 19 11 24 54 87
2004 96 21 8 27 56 89
2005 86 40 25 36 101 109
2006 72 30 23 26 89 96
2007 83 31 21 17 69 103
2008 82 29 11 31 71 98
*Based on institutional census.N.B. Differences between tables on infant deaths due to late registration.Source: Registered Deaths, Department of Statistics and Health Information & Research Unit
Table 7. Crude deaths rates (per 100,000 pop.) and ranks for leading causes of death, 2004 – 2008.
Condition 2004 2005 2006 2007 2008
CDR Rank CDR Rank CDR Rank CDR Rank CDR Rank
Hypertensive Dis. 67.0 1 58.1 1 51.9 2 42.5 1 46.7 2
HIV/AIDS 49.8 2 48.6 2 56.4 1 39.8 2 34.6 4
Cerebrovascular Dis. 38.9 3 41.8 3 31.9 5 37.7 4 43.7 3
Ischaemic Heart Dis. 34.9 4 38.7 4 47.6 3 38.0 3 48.5 1
Diabetes Mellitus 27.1 5 29.2 5 29.7 6 28.1 5 24.2 5
Cancer of the Breast 24.8 6 25.1 6 32.5 4 25.6 7 25.4 10
Cancer of the Prostate 23.7 7 23.4 7 25.0 7 25.9 6 35.8 7
Motor Vehicle Inj. 15.6 8 19.1 8 14.0 9 14.7 9 13.9 8
Homicides 13.7 9 16.9 9 17.9 8 24.9 8 22.5 6
These nine conditions, namely hypertensive disease, HIV/AIDS, cerebrovascular disease, ischaemic heart disease, diabetes, motor vehicle injuries, homicides, cancer of the breast in women and of the prostate in men, accounted for roughly half of all deaths each year – 53.4% in 2004, 48.1% in 2005, 54.2% in 2006 and 45.2% in 2007 (Table 7, Figs. 6, 7) . Hypertension has remained the single leading cause of death in all years, except 2006 and 2008, when it was replaced by HIV/AIDS (2006) and ischaemic heart disease (2008). Most noteworthy is the marked increase in homicide rates, which have almost doubled in four years, where males were nine times more likely to be murdered than females. Also noted are decreases in the rates of deaths due to cancer of the breast in females and HIV/AIDS, although the death rates due to HIV/AIDS for males were almost one and a half times higher than that for females. Death due to diabetes is the only rate that has remained constant over time, despite population-based interventions that have been initiated.

14 Annual Report of the Chief Medical Officer
Fig. 6. Leading causes of death, 2004, 2005
Hypertensive Diseases (I10-I15)HIV Disease (AIDS) (B20-B24)Cerebrovascular Diseases (I60-I69)Ischemic Heart Diseases (I20-I25)
Diabetes (E10- E14)Land Transport Accidents (V01-V89)
Assault (homicide) (X85-Y09)Malignant Neoplasm of Female Breast (C50 in Women)
Malignant neoplasm of prostate (C61)Heart failure and complications and ill-defined heart disease (150-151)
Hypertensive Diseases (I10-I15)
HIV Disease (AIDS) (B20-B24)Cerebrovascular Diseases (I60-I69)Ischemic Heart Diseases (I20-I25)Diabetes (E10- E14)Certain Conditions Originating in the Perinatal Period (P00-P96)
Land Transport Accidents (V01-V89)Assault (Homicide) (X85-Y09)Malignant Neoplasm of Female Breast (C50 in Women)Heart failure and complications and ill-defined heart disease (I50-I51)
2004
2005
Based on PAHO’s Standard List for Leading Causes of Death, 2006 (ICD10)Source: Department of StatisticsPrepared By: Health Information and Research Unit, Ministry of Health 02/07
Hypertensive Diseases (I10-I15)HIV Disease (AIDS) (B20-B24)Cerebrovascular Diseases (I60-I69)Ischemic Heart Diseases (I20-I25)
Diabetes (E10- E14)Land Transport Accidents (V01-V89)
Assault (homicide) (X85-Y09)Malignant Neoplasm of Female Breast (C50 in Women)
Malignant neoplasm of prostate (C61)Heart failure and complications and ill-defined heart disease (150-151)
Hypertensive Diseases (I10-I15)
HIV Disease (AIDS) (B20-B24)Cerebrovascular Diseases (I60-I69)Ischemic Heart Diseases (I20-I25)Diabetes (E10- E14)Certain Conditions Originating in the Perinatal Period (P00-P96)
Land Transport Accidents (V01-V89)Assault (Homicide) (X85-Y09)Malignant Neoplasm of Female Breast (C50 in Women)Heart failure and complications and ill-defined heart disease (I50-I51)
2004
2005
Based on PAHO’s Standard List for Leading Causes of Death, 2006 (ICD10)Source: Department of StatisticsPrepared By: Health Information and Research Unit, Ministry of Health 06/07

MInistry of Health, Commonwealth of The Bahamas 15
Fig. 7. Leading causes of death, 2006, 2007
HIV Disease (AIDS) (B20-B24)Hypertensive Diseases (I10-I15)Ischemic Heart Diseases (I20-I25)Cerebrovascular Diseases (I60-I69)
Diabetes (E10- E14)Certain Conditions Originating in the Perinatal Period (P00-P96)Assault (Homicide) (X85-Y09)Malignant Neoplasm of Female Breast (C50 in Women)
Land Transport Accidents (V01-V89)Malignant Neoplasm of Prostate (C61)
Hypertensive Diseases (I10-I15)HIV Disease (AIDS) (B20-B24)Ischemic Heart Diseases (I20-I25)Cerebrovascular Diseases (I60-I69)
Diabetes (E10- E14)
Assault (Homicide) (X85-Y09)
Certain Conditions Originating in the Perinatal Period (P00-P96)Land Transport Accidents (V01-V89)
Malignant Neoplasm of Female Breast (C50 in Women)Heart Failure and Complications and Ill-Defined Heart Disease (I50-I51)
2006
2007
Based on PAHO’s Standard List for Leading Causes of Death, 2006 (ICD10)Source: Department of StatisticsPrepared By: Health Information and Research Unit, Ministry of Health 06/07
HIV Disease (AIDS) (B20-B24)Hypertensive Diseases (I10-I15)Ischemic Heart Diseases (I20-I25)Cerebrovascular Diseases (I60-I69)
Diabetes (E10- E14)Certain Conditions Originating in the Perinatal Period (P00-P96)Assault (Homicide) (X85-Y09)Malignant Neoplasm of Female Breast (C50 in Women)
Land Transport Accidents (V01-V89)Malignant Neoplasm of Prostate (C61)
Hypertensive Diseases (I10-I15)HIV Disease (AIDS) (B20-B24)Ischemic Heart Diseases (I20-I25)Cerebrovascular Diseases (I60-I69)
Diabetes (E10- E14)
Assault (Homicide) (X85-Y09)
Certain Conditions Originating in the Perinatal Period (P00-P96)Land Transport Accidents (V01-V89)
Malignant Neoplasm of Female Breast (C50 in Women)Heart Failure and Complications and Ill-Defined Heart Disease (I50-I51)
2006
2007
Based on PAHO’s Standard List for Leading Causes of Death, 2006 (ICD10)Source: Department of StatisticsPrepared By: Health Information and Research Unit, Ministry of Health 01/2010

16 Annual Report of the Chief Medical Officer
Fig. 8. years of potential life lost (yPLL) 2002-2006
0
1,000
2,000
3,000
4,000
5,000
6,00020062005200420032002
Cere
brov
scul
ar
Dise
ases
Acci
dent
al D
rown
ing
& Su
bmer
sion
Fem
ale
Brea
st C
ance
r
Hype
rten
sive
Dise
ases
Cong
enita
Mal
form
atio
ns
Isch
aem
icHe
art D
isea
se
Land
Tran
spor
t
Assa
ult
(Hom
icid
e)
Perin
atal
Con
ditio
nsHIV
Dise
ase
YPLL
Age Group
Source: HIRU
When mortality is measured using Years of Potential Life Lost (YPLL), HIV/AIDS outranks hypertension as the leading cause of mortality (Fig. 8), because people with hypertension generally die later in life. For this reason, too, perinatal conditions and congenital anomalies ranked highly. Most troubling was a four-fold increase in YPLL due to homicides, the result of more deaths at increasingly younger ages.

MInistry of Health, Commonwealth of The Bahamas 17
8 SECTOR POLiCiES, PLANS & SuPPORTiNg SySTEMS
8.1 POLiCiES TO guiDE DELivERy OF SERviCES
The National Food and Nutrition Policy and Agenda for Action for The Bahamas
The Government of The Commonwealth of The Bahamas recognizes the correlation between the social determinants and health outcomes. A healthy population is more productive, better able to learn and acquire skills, and more apt to engage in socially acceptable leisure and pleasure activities.
Notably, there is a close interrelationship between food, nutrition, levels of physical fitness and health status. Good nutrition leads to proper growth and development, protects against diseases and reduces health care costs. The health and well being of a population are dependent upon a good quality food supply system that is accessible, affordable, available, and sustainable. These fundamental elements of food security contribute significantly to quality of life. Low levels of physical fitness and lack of exercise are considered independent risk factors for many of the CNCDs, including hypertension, diabetes mellitus type 2, coronary heart disease, and some cancers.
The Ministry of Health and the Ministry of Agriculture and Marine Resources recognize this important relationship and the need for a comprehensive policy on food and nutrition. In collaboration with other government ministries, a multi-sectoral committee was established to review the current food, nutrition and health situation, and set guidelines for improving food and nutrition security for all segments of the population and the many visitors to the country. The result was the development of the Food and Nutrition Policy and Agenda for Action, which was proposed in 2008 by the Ministry of Health as a draft document, but not yet ratified.
8.2 PLANS, THEiR ASSESSMENTS AND EvALuATiONSThe National Health Service Strategic Plan 2006-2015 was drafted in 2005 but not given final approval. While this plan was not finalized, portions of the draft document helped to guide programmes during the period of this report.
8.3 LEgiSLATiON iN SuPPORT OF SERviCE DELivERyThe following pieces of legislation have been prepared and/or enacted to facilitate delivery of quality health services to the people of the Commonwealth of The Bahamas.
Draft Revision of The Medical Act
The draft Medical Act, which will repeal the existing Act, makes the Medical Council more effective by establishing it as a more autonomous body with four committees: a preliminary Proceedings Committee, an Education Committee, a Health Committee and a Professional Conduct Committee. It is expected that the Act, once passed, will provide administrative structures to: (1) better regulate the medical profession, (2) upgrade doctors’ skills through its continuing education requirements, and (3) better safeguard the public through improved means of receiving and responding to complaints.
Amendment to The Dental Act
A Bill for an Act to Regulate the Practice of Dentistry will repeal and replace the existing Dental Act, and will modernize and expand law and policy governing the practice of dentistry in The Bahamas by establishing statutory committees within the Dental Council. Clause 4 of the Bill establishes an Education Committee, a Health Committee, a Preliminary Proceedings Committee, and a Disciplinary Committee.

18 Annual Report of the Chief Medical Officer
The Nurses and Midwives Act
The drafted Bill aims at addressing certain gaps in the existing Nurses and Midwives Act, Chapter 225. New provisions address the extended roles of nurses and midwives, the registration of specialty nurses and nurse practitioners, and their continuing professional education. Further provision is made to require practicing nurses and midwives to hold a license from the Nursing Council upon prescribed conditions. A requirement for ongoing medical education will be added as one of the criteria in the licensing of nurses and midwives.
The Health Services Act (Chapter 231) The Health (Amendment) Rules 2010
An amendment to Rule 77 of the Health Services Act was proposed to facilitate new requirements for the certification of food handlers, as opposed to previous requirements based on an examination by a medical practitioner.
The Health Services Act, Chapter 231) Public Health Emergency Rules
The new Public Health Emergency Rules are proposed to bring The Bahamas into compliance with International Health Regulations (2005) of the WHO, adopted by the 58th World Health Assembly on May 23, 2005.
8.4 HEALTH iNFORMATiON
iPHIS plans
The Integrated Public Health Information System (i-PHIS) is an automated client health record and reporting system that supports interventions by public health providers, including tracking, follow-up, case management, and public health reporting. The system is intended to provide access to all client records by multiple health care providers across The Bahamas. In February 2003 the Public Health Agency of Canada’s (PHAC) i-PHIS application was presented to representatives from the Department of Public Health. The application was found to meet most of the key requirements for the Department of Public Health in The Bahamas.
A pilot study was conducted in June 2004 and evaluated a few months later in November. The evaluation team recommended that The Bahamas proceed in implementing i-PHIS across The Bahamas. Implementation of i-PHIS began in March 2007 and has continued since. Challenges remain, however, in terms of connectivity across the archipelago and for adequate computer support among the country’s 30 inhabited islands.

MInistry of Health, Commonwealth of The Bahamas 19
9 HEALTH iNFRASTRuCTuRE
9.1 ORgANizATiONAL STRuCTuRE
The Ministry of Health’s organizational structure has experienced four challenging years, with various agencies added to or removed from the Minister’s portfolio during this time. Additions to the Ministry’s organizational structure diverted attention from other matters impacting the country’s health during these years.
Organizational Structure 2004-06 (February)
The Ministry of Health and the Environment was re-structured, with two of the three arms of public health under its authority: the Departments of Public Health and Environmental Health Services. Veterinary public health was placed under the authority of the Ministry of Agriculture.
Organizational Structure 2006-07 (February)
Ministry of Health and National Insurance For one year, the MOH became Ministry of Health and National Insurance. This change aligned with the Government’s initiative to provide universal health insurance (National Health Insurance). The resulting organizational structure moved the Department of Environmental Health Services to another Ministry; however, the Public Analyst’s Laboratory remained under the Ministry of Health.
Organizational Structure 2007 (February – May)
Ministry of Health, National Insurance and Public Information The Ministry of Health and National Insurance expanded for three months, to include Public Information, which included Bahamas Information Services and the Broadcasting Corporation of The Bahamas, Radio and Television Broadcasting.
Organizational Structure 2007 (May-June)
Ministry of Health In May 2007, a new Government of The Bahamas was elected. Subsequent Cabinet appointments included a Minister for Health, whose portfolio included both the Ministry of Health and the Department of Environmental Health.
Organizational Structure 2007-2008 (July)
Ministry of Health and Social Development (including DEHS) The Ministry of Health, which included the Department of Environmental Health Services, expanded to include Social Development for a little over a year.
Organizational Structure 2008 (September)
Ministry of Health (excluding DEHS and Social Development) In September 2008, Cabinet re-assignments resulted in the Minister with responsibility for Health retaining only the Ministry of Health.
Organizational Structure 2004-2008
Public Hospitals Authority (PHA) PHA’s organizational structure remained stable from 2004-08, maintaining responsibility for three government hospitals, the primary health care system in Grand Bahama (Grand Bahama Health System), for shared services by the Bahamas National Drug Agency and Materials Management Directorate, and for the Emergency Medical Service.

20 Annual Report of the Chief Medical Officer
Department of Public Health
The Department of Public Health was under the direction of the Director of Public Health during the period 2004-07. DPH was placed under the Office of the Chief Medical Officer from November 2007 to March 2009, during which time MOH conducted a search to fill the position of the Director of Public Health.
9.2 SERviCE DELivERy
Primary health care is the core foundation of public health care services. This is delivered through a network of 28 health centres, 33 main clinics, and 35 satellite clinics dispersed across 30 inhabited islands. Through these local facilities, medical and nursing staff conduct general ambulatory care clinics and chronic non-communicable disease clinics that service patients with hypertension and diabetes, as well as specialized services through antenatal, postnatal and immunization clinics provided as part of a maternal and child health (MCH) programme, as well as school health and oral health clinics.
These different types of clinics include:
• Healthcentre:ahealthfacilitywithresidentmedicalofficerandnursingstaff—offersovernightbedsforpatientsand deliveries; offers ambulatory care, X-ray facilities, MCH services, and other specialized care.
• Mainclinic:ahealthfacilitywitharesidentand/orvisitingmedicalofficer,orwitharesidentnursebutnoovernight bed facility—offers MCH services and minimal emergency care.
• Satelliteclinic:asmallfacilityforvisitingmedicalandnursingstaff—usuallyprovidedforpeoplelivinginremoteareas.
Other national programmes that support the MOH’s primary health care thrust include:
• HealthEducationandPromotion
• PrisonHealth
• InfectiousDiseaseSurveillance
• NationalHIV/AIDSProgramme
• ChronicNon-CommunicableDiseaseSurveillance
• HealthyLifestylesandNutrition
• DepartmentofEnvironmentalHealthServices
• HealthInformationandResearchUnit
Complementing the primary health care system are three public hospitals and their services to in-patients and out-patients:
• ThePrincessMargaretHospital, (PMH)—400+ bed acute care facility that is the country’s referral institution located in Nassau, New Providence. Its services/clinics include physiotherapy, speech therapy, occupational therapy, neurodevelopment, dialysis, ophthalmology, ear, nose and throat (ENT), obstetrics, oncology, oral health, orthopaedics, paediatrics, psychiatry, dermatology, surgery, and general medicine.
• TheRandMemorialHospital (RMH)—85-bed hospital located on Grand Bahama, offering antenatal and postnatal clinics, paediatrics, gynaecology, psychiatry, orthopaedics, ophthalmology, ENT, surgery and general medicine.

MInistry of Health, Commonwealth of The Bahamas 21
• TheSandilandsRehabilitationCentre (SRC)—367-bed psychiatric and geriatric hospital in New Providence, offering a variety of mental health services including detoxification and occupational therapy.
The health system also includes private hospitals, Doctors Hospital and Lyford Cay Medical Facility and a chain of walk-in clinics, private practitioners and private medical offices.
9.3 FACiLiTiES
9.3.1 HOSPiTALS
Table 8a. Hospital Statistics, 2004 – 2008.
Princess Margaret Hospital 2004 2005 2006 2007 2008
Number of Beds 423 405 405 405 405
Number of Discharges 15,212 14,846 14,876 14,969 15,874
Average Length of Stay 6.8 6.8 7.7 7.8 7.2
% Occupancy 69.6 70.4 81.4 82.0 80.2
Total Outpatient Visits 119,622 145,779 141,988 132,215 142,247
Rand Memorial Hospital
Number of Beds 86 85 85 85 85
Number of Discharges 4,861 4,870 4,961 4,832 5,184
Average Length of Stay 3.2 3.3 3.3 3.2 3.2
% Occupancy 52.6 51.8 52.8 50.2 54.6
Total Outpatient Visits 56,036 60,827 60,848 64,618 68,196
Doctors Hospital
Number of Beds 72 72 72 72 72
Number of Discharges 2,887 3,051 3,104 3,168 3,060
Average Length of Stay 3.7 4.1 4.0 4.2 4.3
% Occupancy 40.4 47.8 47.0 50.7 50.0
Total Outpatient Visits 12,976 14,826 15,155 10,039 10,155
Lyford Cay Hospital
Average Outpatient Visits … … … … 7,020
Source: HIRU, Ministry of Health; Lyford Cay Hospital

22 Annual Report of the Chief Medical Officer
In-patient stays at PMH were longer than those of RMH and Doctor’s Hospital (Table 8a). Although PMH’s in-patient mortality rate decreased during the past ten years, it remains nearly twice that of the other two institutions (Fig. 9). PMH serves as a primary referral hospital for the country. RMH refers severely ill patients to PMH under a transfer agreement for more specialized services. Lyford Cay Hospital does not support inpatient services and currently only provides outpatient services to its clientele.
Fig. 9. Hospital in-patient death rates, 1997 – 2008.
0
1
2
3
4
5
6 PMH
RMH
Doctors
200820072006200520042003200220012000199919981997
Rate
/100
,000
Pop
ulat
ion
Year
Source: HIRU, Ministry of Health
Table 8b. Hospital Statistics, Sandilands Rehabilitation Centre, 2004 – 2008.
Psychiatric Hospital 2004 2005 2006 2007 2008
Number of Beds 367 367 367 367 367
Number of Discharges 1,044 1,099 1,258 1,231 1,191
Average Length of Stay 108.4 102.0 92.6 92.7 95.3
% Occupancy 84.3 90.1 90.9 89.3 88.4
Total Outpatient Visits* 22,548 21,471 20,660 20,849 21,293
geriatric Hospital
Number of Beds 128 128 128 128 128
Number of Discharges 49 36 28 32 23
Average Length of Stay 610.0 767.3 867.2 672.3 829.1
% Occupancy 88.5 88.7 83.5 82.0 77.9
* These outpatient visits are held at the Community Counseling and Assessment Centre; figures estimated for 2007 and 2008.

MInistry of Health, Commonwealth of The Bahamas 23
The average length of stay in the geriatric hospital is reflective of its function as primarily a custodial facility for the elderly. This extended length of stay speaks to the need for service costing under different models. The cost of providing services in a nurs-ing home setting, with a greater emphasis on custodial care and less utilization of skilled staff in institutions, is a more efficient financing mechanism.
9.3.2 HEALTH CENTRES
Table 9. Community Health Centre Service Statistics, BAHAMAS, 2004-2008
New Providence 2004 2005 2006 2007 2008
Antenatal Clinic 23,117 25,848 24,831 27,076 25,957
Postnatal Clinic 9.432 10,047 11,778 10,811 8,857
Child Health Clinic 61,561 59,470 61,734 65,258 63,559
School Health Clinic 31,727 24,903 36,841 37,396 35,947
Other Clinic Services 108,161 97,894 95,086 101,715 93,821
Other Domiciliary Services 16,131 18,150 13,765 15,656 18,482
Total Outpatient Visits 250,589 236,312 244,035 257,912 246,623
grand Bahama and the Family islands
Antenatal Clinic 9,309 9,519 9,622 9,590 9,245
Postnatal Clinic 4,072 4,729 5,521 6,026 5,850
Child Health Clinic 38,022 34,759 36,916 36,386 37,247
School Health Clinic 28,049 26,254 26,834 27,338 26,595
Other Clinic Services 127,658 128,297 131,954 142,754 142,097
Other Domiciliary Services 21,174 24,028 24,271 27,988 28,593
Total Outpatient Visits 228,284 227,586 235,118 250,082 249,627
Source: HIRU

24 Annual Report of the Chief Medical Officer
Persons living in the Family Islands have made greater use of outpatient clinics. This is evidenced by an outpatient visit ratio of 3.38 visits per person compared to 1.13 per person for New Providence and 1.57 per person for Grand Bahama. This may be the result of greater access to and/or utilization of private facilities on New Providence. The total number of outpatient visits (Table 9) in New Providence remained relatively stable from 2004-08, while in Grand Bahama and the Family Islands the trend appears to be increasing with time.
Fig. 10. Clinic visits in New Providence, grand Bahama and the Family islands, 2004 - 2008
0
10,0000
20,0000
30,0000Grand BahamaFamily IslandsNew Providence
20082007200620052004
Fig. 11. Home visits in New Providence, grand Bahama and the Family islands, 2004-2008
0
10,0000
20,0000
30,0000Grand BahamaFamily IslandsNew Providence
20082007200620052004

MInistry of Health, Commonwealth of The Bahamas 25
9.4 RESOuRCES
9.4.1 MANPOWER
Statistics for the health professions’ human resource (HR) capacity for 2004-08 (Table 10) reflect an overall increase across all disciplines. In 2003, MOH recognized the need to maintain an adequate HR capacity in the nursing profession, in light of health care worker migration; thus, they developed a Nursing Recruitment and Retention Plan that prevented further mass migration of nurses from the system. The University of the West Indies Medical School saw an increased enrollment of Bahamian medical students, which is reflected in the increasing number of physicians in the work force, particularly from 2006-08.
Table 10. Human resources per 10,000 population, 2004 – 2008.
Health Care Workers2004 2005 2006 2007 2008
# Rate # Rate # Rate # Rate # Rate
Physicians 720 22.4 756 23.2 849 25.1 907 27.2 947 28.0
Dentists 76 2.4 77 2.4 78 3.1 78 2.3 79 2.4
Registered Nurses 792 24.7 812 25.0 832 24.6 1004 31.4 1029 32.1
Trained Clinical Nurses 445 13.8 480 14.8 460 13.6 502 15.7 515 16.1
Pharmacists 158 4.9 140 4.3 156 4.9 142 4.4 138 4.1
Nutritionists & Dietitians 16 0.5 15 0.5 11 0.3 15 0.5 11 0.3
Radiographers 49 1.5 59 1.8 58 1.8 54 1.7 56 1.7
Med. Lab. Technologists 123 3.8 116 3.6 125 3.9 102 3.2 102 3.0
Source: Health Professions Council, Bahamas Medical Council, Bahamas Dental Council,

26 Annual Report of the Chief Medical Officer
9.4.2 HEALTH SERviCES FiNANCiNg
Table 11. Annual Health Budgets 2003/2004-2008/2009
RECuRRENT ExPENDiTuRES
Department 2003/2004 2004/2005 2005/2006 2006/2007 2007/2008 2008/2009
Ministry of Health 9,652,124 9,911,680 9,960,913 10,852,257 18,971,627 19,202,679
Department of Environmental Health 23,084,386 25,929,089 26,042,597 28,330,522 33,187,604 1
Department of Public Health 19,323,932 20,143,494 20,626,198 23,804,235 27,597,797 29,883,366
Public Hospitals Authority 108,611,339 118,948,888 127,926,488 142,420,539 164,364,206 174,140,170
Total 160,671,781 174,933,151 184,556,196 205,407,553 242,121,234 223,226,215
Capital Expenditures
Ministry of Health & Department of Public Health … 1,558,415 1,736,877 1,846,000 4,086,000 3,900,000
Public Hospitals Authority … 5,535,698 6,169,618 6,467,890 6,182.739 2,000,000
Department of Environmental Health Services … 148,396,480 5,332,954 5,615,186 6,958,683 2
Totals … 155,490,593 13,239,449 13,929,076 11,727,419 5,900,000
Source: finance Department, Ministry of Health:1. Department of Environmental Health Services was no longer under the Ministry of Health budget in 2008/2009.2. Department of Environmental Health Services was no longer under the Ministry of Health budget in 2008/2009.

MInistry of Health, Commonwealth of The Bahamas 27
Fig. 12. Expenditure on health activities, 2006 -2008
0
50
100
150
200
250
300
Department of Env. HealthDepartment of Public HealthPublic Hospitals AuthorityMinistry of Health
2008/20092007/20082006/2007
$000
,000
Fiscal Year
Source: Planning Unit, Ministry of Health
The Ministry of Health operates under a continuously increasing annual budget, which by fiscal year 2007/08 had reached roughly 242 million dollars. The majority of that budget was allocated to recurrent expenditures, the largest portion assigned to the Public Hospitals Authority for the inpatient management of health services. Outside of the MOH operational budget, the Department of Public Health operates the smallest portion of the health budget—while maintaining primary health care services on approximately 30 inhabited islands throughout the archipelago. The 2008/09 budgetary decrease reflects deployment of the Department of Environmental Health Services to another Ministry (Fig. 12).

28 Annual Report of the Chief Medical Officer
10.1 MATERNAL AND CHiLD HEALTH
Table 12. Summary of antenatal services, coverage and utilization, 2004 – 2008.
Service & Coverage 2004 # %
2005 # %
2006 # %
2007 # %
2008 # %
# Pregnant women 4214 4330 4290 4606 4500
< 15 years 96 2.3 29 0.7 30 0.7 38 0.8 22 0.5
15-19 years 925 22.0 774 17.9 813 19.0 875 19.0 860 19.1
5+ gravid 219 5.2 208 4.8 270 6.3 244 5.3 200 4.4
Seen in <16 wks 1985 47.1 2115 48.8 2103 49.7 2098 45.6 2024 45.0
3+ visits @ 36 wks. 1457 81.6 1419 71.3 1668 89.7 1609 91.5 1689 77.8
High BP 234 5.8 219 5.2 315 8.0 315 7.1 227 5.3
Hb<10gm 460 11.5 400 9.6 389 9.7 302 7.1 290 7.2
Positive sugar 147 3.6 138 3.3 144 3.5 126 2.9 71 1.7
Positive albumin 291 7.2 379 9.1 465 11.5 432 9.7 331 7.9
GC Positive 273 8.3 239 7.0 188 5.1 390 10.4 275 7.3
VDRL positive 95 2.5 76 1.9 38 1.1 92 2.2 78 2.0
New cases of PET 139 3.3 200 4.6 144 3.4 147 3.2 135 3.0
New cases of eclampsia 4 0.1 19 0.4 25 0.6 7 0.2 3 0.1
New cases of severe anaemia 51 1.2 32 0.7 32 0.7 23 0.5 16 0.4
Source: Health Information and Research Unit
10HEALTH SERviCES & PROgRAMMES

MInistry of Health, Commonwealth of The Bahamas 29
Table 13a. Summary of perinatal information (Maternal indicators) 2005 – 2008
indicator 2005 # %
2006 # %
2007 # %
2008 # %
Mothers 4902 4713 5268 5021
Mothers with pathology 202 4.1 184 3.9 265 5.0 140 2.8
“ “ “ - multiple pregnancies 59 1.2 61 1.3 80 1.5 53 1.7
“ “ “ - previous hypertension 13 0.3 20 0.4 29 0.6 9 0.2
“ “ “ - preeclampsia 70 1.4 60 1.3 105 2.0 48 1.0
Prenatal visits 4616 94.2 4415 93.7 4934 93.7 4419 88.0
No visits or no data 286 5.8 298 6.3 334 6.3 302 6.0
Premature labour 788 16.1 665 14.1 724 13.7 677 13.5
Delivery - C-section 1083 22.1 1139 24.2 1339 25.4 1281 25.5
Contraceptive advice 2266 46.2 1020 21.6 2888 54.8 2469 49.2
Source: PAHO/WHO CLAP Perinatal Information System (SIP)
Table 13b. Summary of perinatal information (Neonatal indicators), 2005 - 2008
indicator 2005 # %
2006 # %
2007 # %
2008 # %
Births 4838 4681 5220 4965
Small for dates 549 11.3 490 10.5 662 12.7 611 12.3
Large for dates 358 7.4 334 7.1 295 5.7 323 6.5
Apgar score 4-6 484 10.0 467 10.0 449 8.6 354 7.1
Apgar score 0-3 92 1.9 47 1.0 49 0.9 49 1.0
Premature newborn 719 14.9 614 13.1 680 13.0 616 12.4
Low birth weight (<2500 gms) 528 10.9 505 10.8 617 11.8 576 11.6
Very low birth weight (<1500 gms) 123 2.5 110 2.3 126 2.4 126 2.5
Extremely low birth weight (<1000 gms) 53 1.1 49 1.0 53 1.0 57 1.1
Breast feeding 1102 22.8 1462 31.2 1206 23.1 1027 20.7
Source: PAHO/WHO CLAP Perinatal Information System (SIP)

30 Annual Report of the Chief Medical Officer
Coverage of pregnant women by the antenatal service was high, with over 75% of pregnant women having 4 or more visits before term (Table 12). More than 94% of pregnant women received documented antenatal care, with an average number of visits which ranged from 7.4 per mother in 2005 to 6.5 in 2008 (Table 13A).
This coverage rate has evolved in response to the proportion of women at risk for perinatal complications: 20-25% were teenage pregnancies that included an annual average of 43 pregnancies in teens younger than 15 years of age (range 22-96), 4%-6% were highly multigravid, 5%-8% had high blood pressure and another 2%-4% had indications of diabetes or gestational diabetes . The incidence of anaemia has decreased from one in nine pregnant women in 2004 to one in 14 in 2008, resulting in an equally marked drop in new cases of severe anaemia. The proportion of women with gonococcal infection (range 5.1-10.4%) and women with positive syphilis serology (range 1.1-2.5%) highlights the need for greater education and contact tracing.
Given the above, 12-16% of deliveries have had the potential for adverse outcomes. That they do not lead to such outcomes underscores the effectiveness of our integration of MCH services at all levels, from clinic to hospital. The increasing rate of deliveries by Caesarean section, as evidenced in Table 13A, clearly indicates the need for monitoring trends and identifying determinants that contribute to these higher risk procedures which impact length of stay.
One area warranting attention is the promotion of breast-feeding. At the Maternity Ward of PMH, over 90% of mothers breastfed, but at the RMH, less than half the mothers breastfed (36%-45%) (Table 13B). At the Private Surgical Ward of the PMH, that percentage decreases to approximately 15%.
Table 14. Summary of Post natal and infant Child Health Services
Service & Coverage2004 2005 2006 2007 2008
# % # % # % # % # %
# Deliveries 3036 3294 4042 4438 3886
Home visit in 3 days 2056 67.7 2341 71.1 2351 58.2 2477 55.8 1503 38.7
2+ home visits in <10 days 1616 53.2 1744 52.9 2263 53.9 2270 51.1 1129 29.2
Clinic <6 wks post delivery 2466 81.2 2513 76.3 2337 55.6 2571 57.9 2711 69.8
Contraceptive use 2429 80.0 2463 74.8 2239 53.3 2295 51.7 2686 69.1
Hb <10gm 99 4.0 195 7.7 111 4.9 160 7.5 113 2.9
High BP 250 7.1 374 10.7 215 6.5 237 6.8 332 8.5
Positive sugar 8 0.2 105 3.2 28 0.9 30 0.9 42 1.1
Postpartum haemorrhage. 1 0.0 - - 1 0.0 2 0.1
Puerperal Sepsis 3 0.1 - - 1 0.0 17 0.4
1st postnatal home visit <10 days 2918 96.1 3126 94.9 1715 42.4 4403 99.2 2830 72.8
1st child health clinic visit < 1 month 2156 71.0 2240 68.0 1845 45.6 2730 61.5 2476 63.7
Solely breast-fed @ 4 wks 274 24.3 366 22.0 424 28.5 394 21.4 325 23.9
Solely breast-fed @ 12 wks 64 19.0 96 12.5 73 11.6 127 31.7 82 17.1
Overweight @ 1 yr. 4 0.1 - 10 0.3 4 0.1 -
Abnormal hearing 32 1.1 3 0.1 36 0.9 28 0.6 14 0.4
Source: Health Information and Research Unit

MInistry of Health, Commonwealth of The Bahamas 31
In the years prior to 2008, more than half of all new mothers had received a home visit within 3 days of delivery and two more home visits one week later (Table 14). The percentages of new mothers with hypertension were not insignificant, ranging between 6.5% and 13.7%. A higher than usual number of cases of puerperal sepsis occurred in 2008.
With the exception of 2006, rates of home visits of the newborn within 10 days were very high with nurses achieving near perfect coverage in 2007. Breast feeding rates were low: less than one-quarter of babies are solely breast fed at 4 weeks, with the exception of a surge that was seen in 2007 as a result of the return of certified lactation specialists. Unfortunately, this increase was not sustained, and while it had not returned to previous levels, the percentage of new mothers that solely breast fed at 4 weeks had again begun to decrease.
Table 15. Reasons for attendance (first visits only) at child health clinics, 2004 – 2008.
Condition 2004 2005 2006 2007 2008
URTIs 11579 13074 13079 12537 10789
Ear disorders 1609 1339 1129 1469 1697
G/E 1053 691 885 1195 1074
Injuries* 661 654 558 747 838
Ringworm 403 516 431 491 602
Eye disorders 520 551 521 570 589
Scabies 326 205 168 170 226
Thrush 472 432 444 417 456
Acute bronchitis 267 294 246 382 462
* Includes poisoningsSource: Health Information and Research Unit.
Because it is difficult to identify new cases or measure the catchment populations to truly determine incidence of diseases leading to a child’s first visit to the clinic, the relative magnitude of first visits is used as a proxy comparator. Notably, respiratory infections were the premier reason for first attendance at health centres by children aged less than five years (Table 15).
10.2 ExPANDED PROgRAMME OF iMMuNizATiON (EPi)
The EPI programme has maintained high levels of coverage (Table 16) despite challenges such as:
• Inefficientstockmanagement
• Poormaintenanceofrefrigerators,thusthreateningthecoldchain
• Conflictwithnewchildhealthpolicyrequiringthatallchildrenbeseenbyaphysicianbeforebeingimmunized.
The result of an efficient and effective immunization programme has been the decline or eradication of most vaccine preventable conditions over the past two decades. “The last recorded cases of vaccine preventable diseases were:
• Poliomyelitis(Morethan30yearsago)
• Diphtheria(1988)
• Mumps(1995)
• Pertussis(1996)

32 Annual Report of the Chief Medical Officer
• Measles(1997)
• Rubella&CongenitalRubellaSyndrome(1998)
• Tetanusneonatorum(1998)
• Tetanus(2007)
• Haemophilus Influenza type B (2004)”
(EPI Report, 2009).
The first case of tetanus in twenty years occurred in 2007 in an unvaccinated Haitian national.
In 2006, Hepatitis B vaccine was introduced to school children aged 5-19 as part of the School Health Programme (Table 16).
Table 16. immunization coverage rates, 2004 - 2008
vaccine 2004 2005 2006 2007 2008
DPT 93% 93% 95% 95% 94%
HIB 93% 93% 95% 95% 94%
Hep B 93% 93% 96% 93% 90%
Polio 92% 93% 94% 95% 94%
MMR 89% 84% 88% 96% 90%ATT 86% 94% 99% 94% 93%
Source: Department of Public Health
10.3 SCHOOL HEALTH SERviCES
The School Health Services Programme provides preventive and curative medical and dental care. These services are available without cost to students attending government primary and secondary schools throughout The Bahamas. The major objective of this programme is to ensure that students are physically and mentally healthy, “so they can derive maximum benefits from their education and achieve their fullest potential (Draft Food and Nutrition Policy, 2008).”
Table 17. Results of health screening of grade i students, 2004 - 2008
Service & Coverage 2004 2005 2006 2007 2008# % # % # % # % # %
Children screened 2750 2006 3713 3294 3841
High BP 43 1.6 17 0.9 43 1.2 24 0.7 126 3.3
Hb<10gm 122 4.4 90 4.5 242 6.5 344 10.4 77 2.0
Sugar positive 10 0.4 23 1.2 29 0.8 2 0.1 27 0.7
Vision problem 153 5.6 152 7.6 200 5.4 164 5 153 4.0
Hearing defect 3 0.1 1 0.0 34 0.9 6 0.2 2 0.1
Underweight 80 2.9 49 2.4 133 3.6 93 2.8 72 1.9
Overweight 131 4.8 70 3.5 233 6.3 287 8.7 355 9.2
Dental caries 959 34.9 520 25.9 807 21.7 1020 31 908 23.6
Source: Health Information & Research Unit

MInistry of Health, Commonwealth of The Bahamas 33
Table 18. Results of health screening of grade 6 students, 2004 - 2008
Service & Coverage 2004 2005 2006 2007 2008
# % # % # % # % # %
Children screened 3349 2508 3980 3850 4275
High BP 36 1.1 30 1.2 101 2.5 47 1.2 164 3.8
Hb<10gm 82 2. 5 98 3.9 219 5.5 297 7.7 61 1.4
Sugar positive 9 0.3 15 0.6 20 0.5 10 0.3 11 0.3
Vision problem 590 17.6 350 14 506 12.7 527 13.7 393 9.2
Hearing defect 16 0.5 10 0.4 21 0.5 75 2.0 6 0.1
Underweight 103 3.1 44 1.8 106 2 .7 78 2.1 46 1.1
Overweight 356 10.6 238 9.5 420 10.6 703 18.3 707 16.6
Dental caries 637 19.0 399 15.9 765 19.2 720 18.7 633 14.8
Table 19. Results of health screening of grade 10 students, 2004 - 2008
Service & Coverage2004 2005 2006 2007 2008
# % # % # % # % # %
Children screened 2844 1242 3009 2845 3280
High BP 53 1.9 30 2.4 118 3.9 113 4.0 103 3.1
Hb<10gm 135 4.8 49 4.0 102 3.4 163 5.7 169 5.2
Sugar positive 19 0.7 5 0.4 89 3.0 6 0.2 15 0.5
Vision problem 300 10.6 18 15 372 12.4 409 14.4 325 9.9
Hearing defect - 42 3.4 26 0.9 45 1.6 1 0.0
Underweight 160 5.6 75 6.0 106 3.5 185 6.5 57 1.7
Overweight 540 19 155 12.5 421 14.0 673 23.7 426 13.0
Dental caries 654 23 268 21.6 650 21.6 646 22.7 747 22.8
Source: Health Information & Research Unit
Significant numbers of children with vision problems and dental caries, and to a lesser extent, with anaemia and hypertension, were seen at all grade levels (Tables 17 - 19). The situation with respect to oral health will be discussed further under that section.

34 Annual Report of the Chief Medical Officer
Fig. 13. Percentage of children screened at school health clinic who were overweight
0
10
20
30Grade 10Grade 6Grade 1
20082007200620052004
%
Year
Source: Health Information and Research Unit
Not only is the percentage of overweight children increasing in each and every cohort of school entrants, but in general, the higher the grade, the greater percentage of overweight children. It would appear then firstly, that with each year, increasing numbers of school entrants are overweight and secondly, as the children age and progress through the grades, more of them become overweight (Fig. 13).
The 10.6% of Grade 6 school children in 2004 who were overweight increased to 13.0% by Grade 10 four years later—inferring a 0.6% increase each year. These data suggest that of the 2008 Grade 1 entrants, 14.6% or one in every seven children will be overweight by Grade 10. This highlights the importance of monitoring trends and patterns in order to evaluate the impact of programmatic changes on health outcomes.

MInistry of Health, Commonwealth of The Bahamas 35
Fig. 14. Percentage of children screened at school health clinic who had high blood pressure.
0
1
2
3
4Grade 10Grade 6Grade 1
20082007200620052004
%
Year
Source: Health Information and Research Unit
Although the numbers of school children with high blood pressure are small and must be interpreted cautiously, the increase in percentages of these school children over the years as they enter Grade 1, (from 1.6% in 2004 to 3.3% in 2008) , Grade 6 (from 1.1% to 3.8%) and Grade 10 (from 1.9% to 3.1%) as well as within the same cohort (1.1% of sixth-graders in 2004 to 3.1% when these students enter Grade 10) is still cause for alarm as a portent of increased morbidity in later life (Fig. 14).
These trends underscore the need to analyze data promptly and to use that data to alter programme direction and develop interventions that will prevent further poor health outcomes and reduce the occurrence of preventable diseases such as hypertension and diabetes.
10.4 iNFECTiOuS DiSEASE SuRvEiLLANCE
19 cases of malaria occurred on the island of Great Exuma between May-June, 2006 due to Plasmodium falciparum, imported and then locally transmitted. These cases were successfully treated by chloroquine and primaquine with no associated mortality, and other effective interventions including active case-finding, treatment of cases, and mosquito control, stopped transmission within 30 days (Surveillance Report)

36 Annual Report of the Chief Medical Officer
Table 20. Reported cases of infectious diseases and syndromes to CAREC, 2004 - 2008
Disease/syndrome 2004 2005 2006 2007* 2008*
Acute haemorrhagic conjunctivitis 408 416 650 … …
Ciguatera poisoning 214 199 139 23 70
Dengue fever & DHSS 1 0 0 … 1
Food-borne illness 876 907 634 4429 ..
Gastroenteritis in <5 year olds 1279 825 1418 1640 ...
Gonococcal infections 111 99 104 … …
Influenza-like disease (ARI) 4143 259 2904 1913 …
Leptospirosis 0 1 0 … 1
Malaria imported (introduced) 1 1 30 (19) … 7(2)
Fever with rash 1 4 4 3 …
Fever with neurological signs … … 37 14 …
Undifferentiated fever … … 232 … …
Meningitis due to H. influenzae 1 0 1 … …
Acute flaccid paralysis 0 1 2
Salmonellosis 20 17 10 7 4
Shigellosis 12 11 6 3 2
Syphilis 398 376 … … …
Tuberculosis (all forms) 47 48 64 48 49
Typhoid fever 1 0 2 … 2
Viral hepatitis … … .. 1 2
Tetanus … … … 1
Chicken Pox 1129 376 476 200 121
Undifferentiated fever … … 356 185 …
Pneumonia … … … … 4
Source: Surveillance Report, Public Health Department
The surveillance of notifiable diseases evolved to include surveillance of syndromes and other selected conditions over the period 2004-06 . Some discontinuity in reported cases was reflected during the transition period. Nevertheless, reports indicated that respiratory conditions, food and water-related illness and sexually transmitted diseases were the diseases with the highest incidence (Table 20).

MInistry of Health, Commonwealth of The Bahamas 37
10.5 Hiv/AiDS
HIV positive rates among pregnant women have remained stable during the review period (Table 21).
Table 21. Hiv positivity rates among pregnant women screened, 2004 - 2008
Year 2004 2005 2006 2007 2008
Positivity Rate 3.0% 2.8% 3.1% 2.5% 2.0%
Fig. 15. MTCT Rates, 1995-2008
0
10
20
30
40
50
60
Total
Not on ART
On ART
20082007200620052004200320022001200019991998199719961995
Rate
/100
,000
Pop
ulat
ion
Year
The HIV screening of antenatal women and treatment of those who are positive has steadily improved so that whereas in 1995, of 79 women screened positive, only 15 were on treatment, in 2008, of 89 women screened positive, 80 were on treatment (Table 22). Moreover, transmission rates in mothers on treatment decreased to 0.0. The artifactual increase in 2008 transmission rates among women highlights the challenges of managing prevention of mother to child transmission (PMTCT) in a highly mobile immigrant population that travels easily between countries in the Region during the gestational period and returning to The Bahamas for delivery of their infants and thus preventing the administration of effective antiretroviral therapy (Fig. 15).

38 Annual Report of the Chief Medical Officer
Table 22. Hiv Mother-to-Child Transmission Rates, 1995-2008
AN On Treatmenta AN Not on Treatmentb Total AN
year
No.
Rate
No.
Rate
No.
Rate+ve ANs
+ve infants +ve ANs +ve
infants +ve ANs +ve infants
1995 15 1 6.7 64 10 15.6 79 11 13.9
1996 67 7 10.4 37 11 29.7 104 18 17.3
1997 48 9 18.8 37 13 35.1 85 22 25.9
1998 39 3 7.7 29 3 10.3 68 6 8.8
1999 51 2 3.9 26 4 15.4 77 6 7.8
2000 51 4 7.8 29 6 20.7 80 10 12.5
2001 71 1 1.4 23 1 4.3 94 2 2.1
2002 81 2 2.5 23 4 17.4 104 6 5.8
2003 88 0 0.0 18 3 16.7 106 3 2.8
2004 83 0 0.0 22 1 4.5 105 1 1.0
2005 74 0 0.0 30 1 3.3 104 1 1.0
2006 88 0 0.0 19 1 5.3 107 1 0.9
2007 76 0 0.0 28 3 10.7 104 3 2.9
2008 80 0 0.0 9 5 55.6 89 5 5.6
Note: Figures for 1996 and 2005 have been revised on 06/08 to include two new cases identified in June, 2008. In addition, women who were not on treatment in 2003 and 2004 include one pregnant woman who tested negative antenatally but tested positive post-delivery.a Antenatals on treatment refers to those on a treatment regimen for pregnant women.b Includes mothers who: i) had no antenatal care (some of whom may have been on treatment prior to pregnancy); ii) were not located; iii)
delivered prior to being treated, e.g, late attendees, premature labour; iv) had abortions, miscarriages, stillbirths or intrauterine deaths before or after treatment; v) were on treatment prior to this pregnancy and did not take the required regimen for pregnancy; vi) had no treatment before or during pregnancy; or vii) refused treatment.

MInistry of Health, Commonwealth of The Bahamas 39
Table 23. Hiv Surveillance of selected populations, 2004 – 2007, Bahamas
Hiv
year Populations Number Screened Number Positive Percent Positive
2007
Blood Donors 9346 41 0.4
Antenatals 3880 98 2.5
All STD Patients 1349 52 3.9
2006
Blood Donors 4846 14 0.3
Antenatals 3443 106 3.1
All STD Patients 683 36 5.3
2005
Blood Donors 5173 20 0.4
Antenatals 3597 102 2.8
All STD Patients 730 42 5.8
2004
Blood Donors 5210 12 0.2
Antenatals 3645 105 2.9
All STD Patients 879 36 4.1
Fig. 16. New Cases of AiDS, by gender and year, August 1985-December 31, 2008, Bahamas
0
50
100
150
200
250
300
350
400 FemaleMale31
Dec
embe
r 200
820
0720
0620
0520
0420
0320
0220
0120
0019
9919
9819
97
1996
1995
1994
1993
1992
1991
1990
1989
1985
-198
8
Num
ber
Year
Source: Health Information and Research Unit

40 Annual Report of the Chief Medical Officer
From 1997, AIDS incidence has shown an overall decline, while at the same time the gender differential is decreasing towards a more even distribution of cases between the sexes (from a male to female ratio of 1.7 in 1988, to 1.9 in 1998 and 1.4 in 2007 and 1.6 in 2008), (Fig. 16). Nevertheless, AIDS continued to predominate among males as seen in Fig. 17 while a more even gender distribution is seen among the non-AIDS cases. This was not always the case, for at the start of the epidemic there were more male non-AIDS cases than female but by 1993, the gap had closed (Fig. 18). The distribution of cases by age and sex revealed a gender ratio that was more inclined to females in the lower age-groups (Fig. 19).
Fig.17. Cumulative Number of Reported Hiv infections, by Sex as of December 31. 2008, Bahamas
0
2,000
4,000
6,000
8,000
10,000
12,000
TotalFemalesMales
Total InfectedNon-CasesAIDS Cases
Num
ber
Year
Sources: Infectious Diseases Division, Public Health Dept. and HIRU.

MInistry of Health, Commonwealth of The Bahamas 41
Fig. 18. Current Non-AiDS Hiv infections, by Sex and Reported year, Bahamas, 1985-2008
0
50
100
150
200
250
300
350
400
450
500MaleFemale
31 D
ecem
ber 2
008
2007
2006
2005
2004
2003
2002
2001
2000
1999
1998
1997
1996
1995
1994
1993
1992
1991
1990
1989
1985
-198
8
Num
ber
Year
Source: Department of Public Health – Infectious Disease Department & HIRU
Fig. 19. Cumulative cases by age-group & Sex as at 31 December 2008
0
200
400
600
800
1,000
1,200
1,400
Female
Male
65+55-5945-4935-3925-2915-195-9<01
Num
ber
Year
Sources: Department of Public Health – Infectious Disease Department & HIRU

42 Annual Report of the Chief Medical Officer
10.6 TuBERCuLOSiS
Table 24. Status of Tuberculosis cases, BAHAMAS, 2004 – 2008
Characteristics 2004 # %
2005 # %
2006 # %
2007 # %
2008 # %
Male 36 76.7 34 70.8 39 60.9 28 58.3 36 73.5
Female 11 23.3 14 29.8 25 39.1 20 41.7 13 26.5
Bahamian 32 68.1 32 68.1 48 75.0 26 54.2 32 65.3
Non-Bahamian 15 31.9 16 33.3 16 25.0 22 45.8 11 34.7
Culture +ve 39 83.0 41 85.4 60 93.8 40 83.3 47 95.9
Culture -ve 1 2.2 0 0 0 0 0 0 2 4.1
Culture Unk 7 14.9 7 14.6 4 6.2 8 16.7 0 0
Ex-Pulmonary 6 12.8 5 10.4 7 11.3 6 12.5 5 11.1
Pulmonary 41 87.2 43 89.6 57 89.1 42 87.5 44 89.8
Smear +ve 34 82.9 33 76.7 47 82.4 34 81.0 34 77.3
Smear –ve 6 14.6 9 20.9 10 17.5 5 11.9 9 20.4
Smear Unk. 1 2.4 1 2.3 0 0.0 3 7.1 1 2.3
Dead 8 17.0 13 25.0 17 26.6 7 14.6 7 8.2
Total 47 48 64 48 49
New TB cases 47 45 60 45 46
Source: Department of Public Health
The Tuberculosis (TB) incidence rate hovered around 15 per 100,000 population for the period under review; prevalence was estimated at between 3-8 per 100,000 population (Fig. 20). TB cases were more likely to be male and Bahamian (Table 24). Direct Observed Therapy Short-Course(DOTs) coverage in 2007 was 100%. On average, 18.7% of the new smear positive cases died and 25% defaulted, so that the success rate was only 63%. Of those smear-positive patients who were re-treated, the success rate increased to 71% but the death rate also increased to 21%.
There was one multi-drug-resistant case during the period 2004-08. HIV prevalence in the TB population was at least 10 times higher than in the general population (Fig. 20). During 2008, the HIV co-morbidity rate in female TB cases was less than 25%, but during the remainder of the time period co-morbid rates between the sexes differed little, ranging over the review period from 25% to 55% (Table 25).

MInistry of Health, Commonwealth of The Bahamas 43
Fig. 20. incidence and prevalence of TB and co-morbid Hiv, Bahamas, 1990-2008 Source: WHO Country TB database
35
30
25
20
15
Rat
e pe
r 1
00
,00
0R
ate
per
10
0,0
00
Per
cent
(lo
g xs
cale
)P
erce
nt p
er 1
00
,00
0P
erce
nt
Rat
e pe
r 1
00
,00
0
Bahamas New ss(+)Retreatment
1990 1995 2000 2005
1990 1995 2000 2005
1990 1995 2000 2005
1990 1995 2000 2005
1990 1995 2000 2005
35
30
25
20
15
Bahamas Prevalence (all forms) Mortality excluding PLWHAMortality including PLWHA
1994 1996 1998 2000 2002 2004 2006Bahamas Treatment Success Rate
HIV Prevalence in TBHIV in General Population
101.5
101
100.5
6
5
4
3
2
1
80
60
40
20
0
15
10
5
0
40
35
30
25
20
15
10
5
Bahamas Incidence (all)Notified New and Relapse

44 Annual Report of the Chief Medical Officer
Table 25. Distribution of Tuberculosis cases by co-morbidity with Hiv and sex, Bahamas, 2004 – 2008
year 2004 2005 2006 2007 2008
Morbid State
All TB TB/Hiv All
TB TB/Hiv All TB TB/Hiv All
TB TB/Hiv All TB TB/Hiv
Male 36 15 42% 34 14 41% 39 21 54% 28 8 29% 36 14 39%
Female 11 5 45% 14 6 43% 25 11 44% 20 5 25% 13 3 23%
TOTAL 47 20 43% 48 20 42% 64 32 50% 48 13 27% 49 17 35%
Source: Surveillance Unit, Department of Public Health
10.7 NON-COMMuNiCABLE DiSEASES & iNjuRiES
Of all non-communicable diseases, hypertension may be the most prevalent and the condition generating the greatest need for health care. Not only is hypertension the leading cause of mortality, it is, after injuries, also the next leading non-infectious condition responsible for hospital discharges followed by diabetes, with which it is frequently a co-morbid condition, especially among the elderly (Fig. 21).
Fig. 21. Selected conditions as percentages of total discharges (excluding deliveries) from Princess Margaret and Rand Memorial hospitals, 2004 – 2008
0
2
4
6
8
10
12
14
Hypertension
Ischaemic H.D.
AIDS
Slow Fetal Growth
Injuries and Poisonings
Diabetes
StrokeA.R.I.20082007200620052004
% o
f Tot
al D
isch
arge
s
Year
Sources: Health Information & Research Unit; Statistics Unit, Public Hospitals Authority
The register of 65+ year olds with hypertension and/or diabetes yielded prevalence rates of 620 and 252 per 10,000, respectively, for these two medical conditions in this age set.
Hypertension is the principal reason for a majority of new clients seeking care at health centres (Table 26). Diabetes was the second leading diagnosis among new clients. Significant numbers of new clients also attended the health centres for treatment of injuries, either road traffic injuries (RTI) or industrial accidents, and mental health conditions, as well as for arthritis.

MInistry of Health, Commonwealth of The Bahamas 45
Table 26. New cases attending Primary Health Clinics for selected non- communicable conditions
Condition 2004 2005 2006 2007 2008
Hypertension 1094 792 1443 1384 1505
Diabetes Mellitus 856 530 334 815 702
Arthritis 367 308 468 647 504
RTIs 384 405 445 486 486
Industrial Accidents 198 205 212 282 213
Schizophrenia 127 120 132 121 115
Epilepsy 86 91 90 116 78
Sickle Cell Anaemia 43 55 89 47 62
Alcohol Dependence 52 46 31 64 49
Mental Retardation 22 7 17 3 8
Source: Public Health Department
The need for dialysis as a result of the complications associated with hypertension and diabetes is another major component of the utilization of health services. There were 139 persons on dialysis at the Princess Margaret Hospital in 2007, the vast majority of whom were hypertensive, with and without diabetes (Fig. 22). The other conditions present in dialysis patients were diabetes only, systemic lupus erythematous (SLE) and polycystic kidney disease (PKD).
Fig. 22. Patients on dialysis at Princess Margarget Hospital by underlying condition, 2007
HypertensionHypertension with DiabetesDiabetesSLE
PKDOther
2007
Source: Dialysis Unit, Princess Margaret Hospital
Although not reflected in hospital discharge statistics, cancers are a major cause of ill-health. As seen earlier (Page 13), neoplasms of the prostate and breast rank among the top ten causes of mortality in males and females, respectively. Data from the Princess Margaret Hospital show that the most common sites are indeed breast and prostate, followed by colon/rectum and uterus/ovary (Fig. 23).

46 Annual Report of the Chief Medical Officer
Fig. 23. Summary of cancer sites by gender, Princess Margaret Hospital, 2008
Oral Cavity & Pharynx-7 5%Lung & Bronchus-8 5%Pancreas-2 1%Kidney & Renal Pelvis-1 1%Urinary Bladder-1 1%Colon % Rectum-18 12%Prostate-64 42%Non-Hodgkin Lymphonia-6 4%Melanoma of the Skin-2 1%Leukemia-1 1%
All Other Sites-42 28%
Thyroid-4 2%Lung & Bronchus-3 1%Breast-92 45%Kidney & Renal Pelvis-3 1%Ovary-3 1%Uterine Corpus-12 6%Colon & Rectum-20 10%Non-Hodgkin Lymphonia-5 2%Melanoma of the Skin-0 0%Leukemia-0 0%
All Other Sites-63 31%
Males152
Females205
Source: Princess Margaret Hospital, New Providence
10.8 MENTAL HEALTH SERviCES
Mental health services are provided under the umbrella of the Ministry of Health through both the Department of Public Health and the Public Hospitals Authority. The Sandilands Rehabilitation Centre (SRC) provides in-patient psychiatric and mental health care, including a three hundred and sixty-seven bed inpatient unit in New Providence. Off-site, SRC has one out-patient facility, the Community Counseling and Assessment Centre (CCAC). The Rand Memorial Hospital in Grand Bahama also provides inpatient mental health services through the Diah Ward. Additional programmes for mental health services in the Department of Public Health include adolescent services, the male health initiative, community health clinics, and psychiatric services offered through the Family Islands’ Community Clinics.
Discharges from the Sandilands Rehabilitation Centre and the Diah Ward of the Rand Memorial Hospital indicate a rate of 414.3 discharges per 100,000 population for mental illness, with an average length of stay of more than 90 days, varying between 92.5 days in 2004 and 95.3 days in 2008. The most common conditions presenting for treatment were schizophrenia and disorders due to psychoactive substance abuse (Fig. 24). Males were three times more likely than females to be hospitalized for mental health conditions.

MInistry of Health, Commonwealth of The Bahamas 47
Fig. 24. Patients treated in mental health facilities by diagnosis
0
10
20
30
40
50
60
70
80
90
100 OtherMood DisordersPersonality DisordersNeurotic DisordersSchizophreniaSubstance Abuse
SRCDiah WardCCAC
Perc
enta
ge
10.9 ORAL HEALTH SERviCES
The Oral Health Services Unit within the Department of Public Health provides services through regular clinics at some community health facilities, Her Majesty’s Prison and Sandilands Rehabilitation Centre, as well as through visits to schools and some Family Islands. The thrust of the programme is to move away from extractions and towards preventive and restorative care, especially for children.
From 2002 to 2006, there was a small but steady improvement in the percentage of children who were caries-free in Grades 1 and 6, with a concomitant reduction in the decayed, missing and filled permanent teeth (DMFT) score (Tables 27, 28).
Table 27. grade 1 Caries Prevalence Trends, 2002 - 2006
year # students Screened % caries- free # person with
decayed teeth# decayed
teeth dmft
2002/3 1693 51.03 829 3012 3.60
2003/4 2120 53.87 952 3505 3.58
2004/5 2106 55.60 935 3251 3.48
2005/6 2197 56.16 838 3368 3.49

48 Annual Report of the Chief Medical Officer
Table 28. grade 6 Caries Prevalence Trends, 2002 -2006
year # students Screened
% caries-free
# persons with decayed permanent
teeth
# decayed permanent teeth DMFT
2002/3 1864 77.20 389 708 1.70
2003/4 2579 77.08 591 932 1.67
2004/5 2565 81.95 462 709 1.54
2005/6 2071 80.61 498 780 1.56
Source: Oral Health Services, Department of Public Health
Each year, among Grade 1 students, as many as 4 children may have 10 or more decayed primary teeth. The high percentage of children in Grade 1 with dental caries highlights the need for increased attention to preventive oral health efforts and greater use of sealants in children. Among older children, the decayed permanent teeth score (D), consistently contributed 97% to the DMFT score.
Internationally established goals indicate that at least 50% of 5-6 year olds should be caries-free, and that the average DMFT for 11-12 year olds should be less than 3. The Bahamas has achieved the first goal and aims to better it, while working toward the second goal.
Fig. 25. School Dental Services-Clinical Activity Trends 2002-2006
0
500
1,000
1,500
2,000
2,500
3,000 ExtsRest. TxsPrevious Txs.# Pts. Seen
20062005200420032002
Num
ber

MInistry of Health, Commonwealth of The Bahamas 49
As can be seen from Fig. 25, there has been a decrease in the number of patients seen by the school dental services. This may be due to the increased number of dental clinics at community centres whose proximity to home or work may make them more convenient for parents. Nevertheless, the marked increase in preventive and restorative treatments among children from 2005-06 also has been a result of greater efforts at prevention and restoration with the operation of the several dental clinics and introduction of a surveillance programme within the school dental service. However, medical and dental officers express concern that the clinics’ goals are not being met, due to human as well as equipment constraints. Fig. 26 shows a breakdown of preventive care at selected dental clinics throughout The Bahamas.
Fig. 26 Preventive Dental Treatments Rendered by Clinic-New Providence & Family islands-2006
0
100
200
300
400
500
600
700 Fluoride TxChild ProphyAdult ProphySealants
FSCFGCSBCEECSDCSo. Eleu.ExumaG.H. Eleu.Abaco
Num
ber
10.10 NuTRiTiON
As noted earlier, the currently small but rising percentage of overweight Bahamian children is a cause for alarm. Diabetes is a disabling medical condition and a costly one for society. Low breast-feeding rates may be a contributing factor to increasing obesity among children, since breast-feeding often is replaced with high but “empty” caloric food choices.
School screening data (Tables 17 - 19) revealed increasing rates of obesity across the spectrum of childhood. These data demonstrated that in Grade 1, obesity ranged from 4.8% to 9.2% of children screened. This rate increased for Grade 6, which had fluctuating rates (low of 9.5% in 2005 to a high of 18.3% in 2007) and was demonstrated in 16.6% of the children screened in 2008. Grade 10 screening indicated an even greater percentage of children who were overweight—as much as 23.7% of screened individuals in 2007 (range 12.5-23.7%).
Additionally, anaemia in children and pregnant women (about 5% each in the two groups), is also an indicator of food choices lacking in nutritional value. The Nutrition Department offers counseling to those referred from clinics. These are usually extreme cases. The Department has taken a proactive approach, initiating a garden-based learning project that complements the education of vendors and the setting of standards for school tuck shops, while supporting the activities of other departments such as the Healthy Lifestyle Initiative and the Health-Promoting Schools Initiative.

50 Annual Report of the Chief Medical Officer
10.11 HEALTH PROMOTiON & EDuCATiON
Efforts are underway to build a national policy on health promotion. The Department also has launched a Health-Promoting Schools Initiative, with a sensitization workshop and identifying school focal points as the basis of school-based health promotion committees. The Department does not have in-house recording and reporting capability and utilizes resources to support their services. This does not allow for a strategic and systematic approach to the optimal development of these services.
The Department has produced the following media presentations – “Joining Hands for Health”, “My Life, My Future”, and “Foundations for Healthy Living”, as well as a segment in the Ministry of Education’s Learning Resource Section, “A Time for Education”. The Department also has introduced a system of identifying educational needs for wellness promotion in fundamental health priority areas of concern.
10.12 HEALTHy LiFESTyLES iNiTiATivE
The Healthy Lifestyles Initiative was launched in October 2005 with the goal of reducing the levels of morbidity, disability and premature deaths associated with lifestyle-related diseases (CNCD)—diabetes, hypertension, chronic respiratory disease, heart disease, and cancer. The Healthy Lifestyles Initiative was designed to reduce the prevalence of risk factors that lead to CNCDs, specifically: smoking, physical inactivity, an unhealthy diet, and poor nutrition. Using a population health approach and collaborative efforts with government agencies, private services, churches, schools, and other NGO’s, the Healthy Lifestyles Initiative has sought to promote health and prevent disease. The initiative focuses on physical activity and healthy eating, and on the relationship of these activities to healthy weights. This initiative also incorporates risk factor screening, including glucose and cholesterol screening and body mass index determinations and documentation in Healthy Lifestyle Passports.
In 2006, Healthy Lifestyles screened 5,000 persons. That number increased to 8,360 people who were screened and counselled at 119 locations during 2007. The Healthy Lifestyles Initiative conducted 116 health fairs or screening sessions in 2007, an increase from the 70 that were conducted in 2006.
10.13 PRiSON HEALTH SERviCES
The Prison Health Initiative provides access to comprehensive health services for inmates of Her Majesty’s Prison (HMP). These services include: routine medical evaluations, managing chronic non-communicable diseases, acute minor medical emergencies, infectious disease management, drug demand reduction, and routine dental care. Mental and psychological health care continue to be provided by personnel from the government owned psychiatric hospital at Sandilands Rehabilitation Centre. Daily dental care is provided by a Dentist.
HMP’s clinic is a collaborative effort staffed by people from both the Department of Public Health and National Security. It is staffed by two full-time physicians, three part-time senior physicians, two registered nurses (one of whom is a Public Health Nurse Coordinator for Prison Health Services), as well as two trained clinical nurses (one trained in psychiatry), four trained clinical nurses (who are also Prison Officers), a part-time pharmacist, and a phlebotomist-aide.
Upon admission, all inmates are tested for the presence of communicable diseases. On average, 2,458 persons are admitted to HMP annually; of these, 13.8% are infected with tuberculosis, 2.0% are infected with HIV, 1.8% are infected with syphilis, and 1.7% are infected with Hepatitis B.

MInistry of Health, Commonwealth of The Bahamas 51
Table 29. Prison Health Screening, 2004-2008
iNDiCATORS 2004 2005 2006 2007 2008
Total admissions 2549 2633 2356 2284 2469
Male 2447 2471 1774 2146 2290
Female 102 162 166 138 179
Average number of admissions per month 212 … 196 190 206
Total persons <35 years of age 1701 1813 1658 1604 1792
Total persons 35+ years of age 848 820 698 680 677
Total return visits 1017 1158 1124 822 1266
Return visits within one year 206 201 141 135 157
Total number persons with positive Mantoux skin test 381 362 267 338 343
Number released before Mantoux skin test read … 369 … … 190
Return visits with previously known positive Mantoux skin test 394 383 275 … 398
Total chest X-rays completed 312 229 129 188 233
Number of persons released before chest X-ray completed 73 71 138 150 110
Total HIV positive 58 61 46 43 36
Total Hepatitis B positive 53 46 47 34 30
Total VDRL (Syphilis) Positive 54 58 50 29 30
Total General Complaints seen 3288 4009 4227 2952 4227
Source: Prison Health Services

52 Annual Report of the Chief Medical Officer
11.1 WATER AND SEWERAgE MANAgEMENT
Sewerage disposal continues to pose a challenge in the Family Islands. Although most premises are connected to a septic tank, roughly 40% have no effluent system attached (e.g., soak away). Pump-out systems are limited or in many instances not available, and any final sewage disposal infrastructure is practically non-existent. The Department of Environmental Health Services (DEHS) continues to advocate for change in this regard, taking opportunities to advise owners and in a few instances to initiate legal actions. The various responsible agencies for providing infrastructure are aware of these needs, but have indicated a financial inability to act. Monitoring and evaluating systems are implemented for the few wastewater treatment plants that exist, which are primarily associated with hotels and related establishments.
Water quality remains a challenge and DEHS routinely tests water samples to ensure the health and safety of water for the people of The Bahamas. One hundred and thirty-three (133) of five hundred and nineteen (519) water samples taken were found to be fully satisfactory, however, of these, 97 (18.7%) had no chlorine present.
11.2 SOLiD WASTE MANAgEMENT
There has been an improvement in the management of solid waste since the introduction of modified landfills. Transfer stations and barging now are available for the disposal of waste in some islands and settlements. However, these resources are incomplete and still many open dumps continue to be used.
The component of waste collection and recycling has lagged behind and as a result indiscriminate dumping continues to be a problem. While the legal framework has assigned components of general sanitation, derelict vehicle disposal, and the management of open dump sites to local government councils in the Family Islands, often financial resources are reportedly inadequate to fully implement these decisions. One result has been that DEHS often has only partially funded work for these items.
11.3 FOOD SAFETy – ESTABLiSHMENTS iNSPECTED AND PASSED; TRAiNiNg OF FOOD HANDLERS
825 of 917 (93.5%) of food handlers were approved for vending permits.
The Health Inspectorate Division of DEHS is responsible for monitoring all food establishments and itinerant vendors. This division is present in all the major Family islands. The division is also involved in training food handlers. Imported meats and meat products are inspected upon entry to ensure they meet all requirements. The Port Health Officer in New Providence conducted the inspections. All imported meats and meat products were deemed satisfactory.
Table 30. Annual Meat Statistics, New Providence, 2004-2008
year Weight Number of cases
2004 399,537,198.8 2,319,168.2
2005 165,556,404.7 11,648,929.5
2006 134,996,778.0 2,492,223.3
2007 156,481,148.3 2,690,142
2008 45,787,931 1,035,877
Source: Department of Environmental Health Services
11ENviRON MENTAL HEALTH SERviCES

MInistry of Health, Commonwealth of The Bahamas 53
Inspections are also conducted at food stores and warehouses to ensure proper storage and refrigeration. Challenging situations have arisen, with expired food items being offered for sale. Five food establishments were closed temporarily due to their ineffective compliance with environmental standards.
In 2004, the Ministry of Health assumed sole responsibility for issuing food handlers’ certificates. This was initiated in conjunction with a mandatory 4-hour safe food course for all food handlers. The mandatory safe food course began in New Providence and by 2005 had been expanded to include Long Island, Eleuthera, Andros, Cat Island, Abaco and Exuma and the Cays. Islands without resident trainers were supported from the Central programme in New Providence. The training programme trained an average of three hundred (300) persons weekly and included five (5) international Serve-Safe instructors capable of training other instructors across The Bahamas. Training for Serve-Safe instructors was expanded to Grand Bahama in 2006, when sixteen (16) trained instructors were introduced, enabling Grand Bahama to provide more consistent Serve-Safe food safety training to food handlers on that island.
In 2006, the Health Services Act, Chapter 216, Rule 77 was amended to facilitate a new legislative requirement for the certification of all food handlers, including all persons connected with the production, storage, transportation, or care of food stuffs. It was the responsibility of the owners and operators of food establishments to ensure that all their workers had current, valid food handlers’ certificates, which must be made available upon request by an authorized Health Officer.
Food safety training is now available in most of the larger inhabited Family Islands. Support from the Central Programme continues to provide services when any gaps in the system are recognized.
Table 31. Food Handlers Training Sessions
Fiscal year 2004 2005 2006 2007 2008
Number of Food Handlers Trained 12,042 18,771 19,481 21,243 21,670
Number of International Safe Serve Instructors … … 19 21 21
11.4 vECTOR CONTROL – AEDES AEgyPTi iNDiCES; RODENT CONTROL ACTiviTiES
To increase Anopheles larval control efficiency in Exuma, DEHS implemented an aquatic weed control programme to limit or eliminate growth of aquatic weeds that provide harborage for larvae and create a physical barrier to the larvicide. While the initial application of herbicides via airboats has been successful, the maintenance phase—with its introduction of sterilized grass carp—has suffered a setback. This was due largely to the increased average salinity levels in the ponds, resulting in fish mortality. The airboat has served to increase coverage of larvicidal applications and considerably reduce the time needed for chemical application.

54 Annual Report of the Chief Medical Officer
Fig. 27. 2008 Exuma Anopheles Larval Total Average
0.0
0.1
0.2
0.3
0.4
0.5
0.6
0.7
0.8
0.9
EW52
EW50
EW48
EW46
EW44
EW42
EW40
EW38
EW36
EW34
EW32
EW30
EW28
EW26
EW24
EW22
EW20
EW19
Inde
x
Epidemiological Week
Source: DEHS
Fig. 28. Exuma Human Bait Collection Total Average, 2008
0
2
4
6
8
10
12
14
16
18
5251504948474645444342414039383736353433323130292827262524232221201918
Mos
quito
per
Man
per
Hou
r Ind
ex
Epidemiological Week
NR
NR
NR
NR
NR
NR
NR
NR
NR
NR
NR
NR
Source: Department of Environmental Health Services

MInistry of Health, Commonwealth of The Bahamas 55
Many cleanup initiatives in New Providence and the Family Islands have resulted in a cleaner environment and in reducing the sources for breeding Aedes aegypti mosquitos. Other efforts to be proactive include providing information to the news media, advising the public of the availability of assistance, ensuring their premises are kept free of any man-made water holding containers. Where these containers are needed, they are managed so that they do not collect water. Relevant educational activities such as lectures and displays have been conducted in many schools and at numerous health and career fairs.
Rodent control operations were conducted extensively in New Providence, Grand Bahama and in island settlements requiring treatment. Surveillance measures and the application of treatment involving the placement of bait stations containing anti-coagulant rodenticide have been the method of choice.
Of special note was a rodent control and conch shell cleanup conducted on Bayshore Road and the settlement of West End, Grand Bahama. This project offered an excellent example of a public-private partnership effort in addressing the need for remedial action. As a result of this coalition and collaboration, rodent infestation was reduced considerably, the shoreline was cleared of piles of conch shells, and derelict boats and other debris were removed.
11.5 PORT HEALTH – iNSPECTiONS AND RESuLTS
In compliance with the International Health Regulations (2005), port health has responsibility for the inspection and issuance of ship sanitation certificates and ship sanitation exemption certificates for all international vessels. During the period January 2004 through December 2008, the Port Health Officer in New Providence inspected a total of 133 vessels (75 cruise ships, 53 freight vessels and 5 pleasure craft) and issued ship sanitation exemption certificates. No sanitation measures were required.

56 Annual Report of the Chief Medical Officer
12.1 iN-PATiENT
Table 32. Hospital utilization by service, PMH and RMH, 2008
Service Discharges Patient Days Ave. length of stay No. of beds
PMH RMH PMH RMH PMH RMH PMH RMH
Intensive Care Unit 115 88 2895 804 25.2 9.1 9 4
Medical/Surgery 8,690 2,662 69,329 8,436 8.0 3.2 229 33
Obstetrics/Gynaecology 5,671 1,645 14,222 3,750 2.5 2.3 50 19
Paediatrics 1,619 620 21,017 1,752 13.0 2.8 68 12
Neonatal ICU 537 35 11,485 390 21.4 11.1 5
Psychiatry - 224 - 1,841 - 8.2 - 12
Source: Kurt , Salmon & Associates
Average length of stay was consistently longer at Princess Margaret Hospital than at Rand Memorial Hospital, for all units with the exception of Obstetrics and Gynaecology which were similar in length (Table 32).
12.2 LABORATORy
Table 33. Laboratory tests at Princess Margaret Hospital by type of test, 2004-2008
Department 2004 2005 2006 2007 2008
Haematology - # Tests: … 61,194 74,785 76,090 70,715
Microbiology:
# Tests 94,982 … … … …
# Specimens 31,834 32,079 32,264 37,367 42,233
Blood Bank - # Tests: 40,354 32,643 39,806 42,580 48,599
Transfusion Medicine - # Tests: 58,745 57,748 55,006 63,064 70,848
Cytology:
# Non-Gynae 364 269 297 350 295
# Papsmear slides 6,888 7,888 7,663 7,629 8,249
Histology - # Slides: 22,903 26,607 29,196 28,491 27,515
Chemistry: … … … ... …
Serology: … … … … …
Stat Lab - # Tests … … … … 514,274
Blood Bank tests include: Cross-match, Patient blood group, Direct coombs test, Indirect coombs test Transfusion medicine tests include: HIV, HBsAg, Corzyme,Anti HBS, HepB Conf (began February 2008), RPR, CMV (began June 2007), HTLV1/2, HCV, HAVStat Lab tests include: WBC (Haematology), Chemistry, UA (Microbiology), UHCG (Microbiology), ABG (Chemistry), CSF (Microbiol-ogy and Chemistry)
12HOSPiTAL SERviCES

MInistry of Health, Commonwealth of The Bahamas 57
The reporting of laboratory statistics has been challenged by an inadequate Laboratory Information System, which was not capable of providing statistical reports (Table 34). Within those Departments able to provide statistics, the increasing volume of tests also reflects the increasing number of discharges seen in Princess Margaret Hospital (Table 8A).
12.2.1 EMERgENCy RESPONSE
Table 34. Accident & Emergency Department – contacts by age, sex, 2004 - 2008
FACiLiTy 2004 2005 2006 2007 2008
PRiNCESS MARgARET HOSPiTAL (PMH):
1) # Visits 47,263 48,947 50,920 52,114 51,746
2) # Registered 57,695 59,832 60,285 61,936 66,649
- Gender:
Male 28,224 29,496 29,682 30,407 32,629
Female 29,469 30,334 30,601 31,528 34,018
- Age Groups:
<1 2,292 2,645 2,447 2,740 2,862
1-4 6,395 6,002 5,874 5,964 6,413
5-14 7,564 7,418 7,501 7,422 9,549
15-24 9,627 9,770 10,394 10,818 11,530
25-44 18,649 19,135 19,259 19,261 20,810
45-64 8,275 9,829 9,954 10,623 11,738
65+ 4,893 5,033 4,856 5,108 5,746
RAND MEMORiAL HOSPiTAL (RMH):
1) # Visits 4,886 4,541 4,303 4,162 4,209
2) # Registered … … … ... …
Source: Keane System, Public Hospitals AuthorityDefinition:1) Visits - INDICATE patients seen and treated by medical staff in the A&E department.2) Registered - INDICATE persons registered in A&E for medical care, but DOES NOT INDICATE the actual persons seen and treated by medical staff as patients may leave the department before receiving medical attention.
The volume of visits to the Accident and Emergency Department has been increasing over the previous five years. Data from 2004-08 (Table 34) demonstrates a roughly equal distribution of males and females. Children 0-4 years of age now account for approximately 9% of the Bahamian population, however, this age group accounts for about 15% of the Accident and Emergency population.

58 Annual Report of the Chief Medical Officer
Table 35 – New Providence emergency Response Data, 2004 – 2008.
Call Type
2004 2005 2006 2007 2008
# callsAve.
Response Time
# callsAve.
Response Time
# callsAve.
Response Time
# callsAve.
Response Time
# callsAve.
Response Time
TRAuMA Calls; 2853 3011 3210 3641 3745
Airplane Crash 4 1 7 8 5
Assaults/Rape 405 0:21:05 419 0:23:31 423 0:22:23 614 0:20:15 726 0:19:56
Bomb/explosion/Major disaster 4 10 0:17:56 2 1 2
Burn victims/Explosion 42 0:14:00 44 0:14:13 30 0:14:47 31 0:17:35 27 0:24:05
Electrocution 7 6 0:16:54 6 0:15:00 6 0:10:54 3 Falls/Back Injuries (Traumatic) 421 0:23:28 407 0:25:14 514 0:20:55 560 0:19:59 573 0:20:56
Gunshot Wound 132 0:12:35 121 0:12:46 146 0:12:38 193 0:13:56 204 0:13:38
RTA, Traumatic Injuries (specify) 1601 0:16:38 1699 0:17:19 1781 0:17:32 1911 0:17:52 1897 0:17:05
Stabbing 237 0:19:04 304 0:16:28 301 0:19:29 317 0:19:48 308 0:15:46
Medical Calls: 2330 2352 2401 2805 2993
Carbon Monoxide/Inhalation Hazmat 0 2 1 2 3 0:10:58
Cardiac/Respiratory Arrest/Death 581 0:21:45 606 0:20:59 612 0:22:28 688 0:19:47 723 0:21:17
Near Drowning/Diving Incident 33 0:18:27 52 0:15:50 41 0:16:09 46 0:13:20 40 0:18:11
Poisoning/Overdose/Ingestion 91 0:19:55 78 0:32:07 79 0:22:59 85 0:18:19 99 0:23:22
Stroke/CVA 198 0:22:00 201 0:25:07 200 0:22:24 239 0:22:38 243 0:24:22
Unconscious/Breathing Problem 1427 0:19:27 1414 0:21:07 1468 0:20:12 1745 0:19:21 1885 0:20:11
Ordinary Problem Calls: 6469 7264 7041 7074 7298
Abdominal Pains/Problem 509 0:27:38 478 0:31:40 431 0:28:41 491 0:26:28 548 0:27:44
Allergies/Hives/Med-Reactions 14 0:21:30 23 0:19:54 35 0:18:07 25 0:12:31 46 0:17:56
Animal Bite(s)/Attack(s) 13 0:14:40 11 0:21:11 13 0:14:11 8 0:20:28 15 0:26:01
Asthmatic 306 0:19:49 401 0:19:46 286 0:20:11 327 0:17:52 390 0:21:35
Choking 10 0:16:23 9 0:14:55 11 0:14:58 10 0:10:46 14 0:19:41
Diabetic Problem(s) 377 0:19:16 469 0:21:41 450 0:22:31 445 0:21:34 856 0:22:49
Eye Problem(s)/Injuries 6 0:05:41 11 0:16:33 6 0:16:10 7 0:28:49 15 0:28:10
Fainting/Fits/Convulsions 1363 0:19:06 1646 0:19:30 1576 0:18:49 1585 0:18:35 1688 0:18:28
Fracture(s)-Lower 125 0:25:11 126 0:28:27 107 0:23:53 99 0:26:30 117 0:26:58
Fracture(s)-Upper 49 0:25:49 66 0:26:30 52 0:18:56 40 0:24:29 42 0:22:29
Lacerations/Haemorrhage 564 0:21:13 698 0:22:38 590 0:23:17 490 0:22:20 421 0:24:17
Maternity/childbirth/BBA 1012 0:20:49 1039 0:22:47 1037 0:23:00 1098 0:21:56 1037 0:23:42
Ordinary Sickness/Sick Call 1097 0:30:32 1149 0:33:14 1173 0:32:43 1207 0:29:25 1151 0:34:10
Psychiatric/Suicide Attempt 584 0:46:37 656 0:53:17 750 0:48:39 725 0:54:35 745 0:43:19
Unknown Problem (Person Down) 111 0:15:32 139 0:15:43 112 0:21:00 110 0:18:32 120 0:18:59
Vomiting/diarrhea 329 0:27:47 343 0:32:25 412 0:26:53 407 0:23:13 393 0:30:34
Transfer Patient 2563 0:47:38 2157 1:02:01 2172 0:51:30 2266 0:44:49 2640 0:49:16
Brought in Dead 218 0:15:32 281 0:17:46 284 0:19:10 247 0:18:53 301 0:16:49

MInistry of Health, Commonwealth of The Bahamas 59
Road traffic injuries, loss of consciousness, convulsions and childbirth are the major defined reasons for use of emergency services in New Providence (Table 35). The volume of calls handled through the EMS system has increased on an annual basis. Response time, however, has not increased to any great extent, when compared over time.
Table 36 – Abaco Emergency Response Data, 2006-2008
Call Type
2006 (10 Months) 2007 2008
# callsAve.
Response Time
# callsAve.
Response Time
# callsAve.
Response Time
TRAuMA Calls; 39 52 72
1p1.302 1 0:05:00Assaults/Rape 5 0:03:00 1 0:02:00 2 0:05:00Bomb/explosion/Major disaster 1Burn victims/Explosion 1 0:03:00 2 0:05:00Electrocution 1 0:02:00Falls/Back Injuries (Traumatic) 2 0:04:00 13 0:11:00Gunshot Wound 2 0:19:00 3 0:05:00RTA, Traumatic Injuries (specify) 31 0:12:00 47 0:07:00 46 0:10:00Stabbing 5 0:04:00
Medical Calls: 12 26 38
Carbon Monoxide/Inhalation HazmatCardiac/Respiratory Arrest/Death 3 0:05:00 7 0:04:00 11 0:06:00Near Drowning/Diving Incident 3 0:05:00 3 0:04:00Poisoning/Overdose/Ingestion 3 0:04:00Stroke/CVA 1 0:17:00 2 0:03:00 2 0:03:00Unconscious/Breathing Problem 8 0:05:00 14 0:06:00 19 0:06:00Ordinary Problem Calls: 43 56 73Abdominal Pains/Problem 1 0:06:00 5 0:06:00Allergies/Hives/Med-Reactions 1 0:24:00Animal Bite(s)/Attack(s) 1 0:07:00Asthmatic 1 0:04:00ChokingDiabetic Problem(s) 2 0:04:00 4 0:05:00Eye Problem(s)/InjuriesFainting/Fits/Convulsions 11 0:05:00 11 0:04:00 15 0:03:00Fracture(s)-Lower 2 0:11:00 5 0:05:00 6 0:06:00Fracture(s)-Upper 2 0:07:00 1 0:08:00Lacerations/Haemorrhage 9 0:06:00 7 0:04:00 8 0:07:00Maternity/childbirth/BBA 2 0:03:00 2 0:04:00 7 0:03:00Ordinary Sickness/Sick Call 13 0:08:00 8 0:05:00 7 0:04:00Psychiatric/Suicide Attempt 1 0:06:00 5 0:04:00Unknown Problem (Person Down) 5 0:04:00 9 0:05:00 16Vomiting/diarrhea 2 0:05:00 3 0:07:00
Transfer Patient 71 96 0:06:00 120 0:06:00Brought in Dead 1 0:04:00 1 0:04:00

60 Annual Report of the Chief Medical Officer
The Public Hospitals Authority/Emergency Medical Services (EMS) assumed responsibility for emergency medical service in Abaco in 2006. Road traffic injuries, loss of consciousness, and convulsions are the major defined reasons for use of emergency services in Abaco (Table 36).
12.2.2 OuTPATiENT SERviCES
Table 37. Outpatient attendances by institution, type of service and year.
FACiLiTy / AREA 2004 2005 2006 2007 2008
PRINCESS MARGARET HOSPITAL (PMH):
Accident & Emergency 47,263 48,947 50,920 52,114 51,746
General Primary Care Clinics: 40,043 42,624 35,589 32,150 28,598
General Practice Clinic 36,910 39,629 32,362 29,471 26,063
Civil Servants Clinic 3,133 2,995 3,227 2,679 2,535
Specialty Clinics(a): 32,316 54,208 55,600 57,808 61,903
Asthma Clinic 618 559 611 643 467
Comprehensive Clinic 1,847 1,544 1,382 1,416 1,337
Dental Clinic - 5,626 5,397 4,598 4,568
Dialysis Clinic - 1,367 1,503 1,399 1,711
ENT Clinic - 2,734 2,741 2,677 3,029
Eye Clinic - 4,500 4,645 5,399 6,023
Medical Clinic 8,663 8,642 8,998 9,306 9,983
OB High Risk Clinic 1,414 - - - -
Obstetric Clinic (includes OB High Risk & GYNAE clients) - 4,315 4,733 4,907 5,233
Oncology Clinic - 1,019 1,241 1,473 1,879
Orthopaedic Clinic - 9,829 8,700 10,420 11,090
Paediatric Clinic 6,300 3,286 3,427 3,169 3,902
Skin Clinic 3,975 3,374 4,042 3,954 3,724
Surgical Clinic 9,499 5,894 6,534 6,802 7,310
Urology Clinic - 1,519 1,646 1,645 1,647
Total Outpatient Attendances (PMH) 119,622 145,779 142,109 142,072 142,247
RAND MEMORIAL HOSPITAL (RMH):
Accident & Emergency 4,886 4,541 4,303 4,162 4,209
General Practice Clinic 34,439 36,773 37,892 41,321 44,011
Specialty Clinics: 16,732 19,513 18,653 19,135 19,976
Surgical Clinic 2,989 3,547 2,907 3,563 3,785
Medical Clinic 4,619 5,553 4,777 5,457 5,433
Antenatal Clinic 2,937 3,432 3,394 3,374 3,102
Gynae Clinic 814 849 941 994 1,025
ENT Clinic 214 247 256 258 238
Pediatric Clinic 900 999 997 1,132 1,106

MInistry of Health, Commonwealth of The Bahamas 61
FACiLiTy / AREA 2004 2005 2006 2007 2008
Postnatal Clinic 413 539 524 607 624
Psychiatric Clinic 1,021 1,013 1,239 1,299 1,490
Chest Clinic 248 244 257 309 450
Orthopedic Clinic 399 407 996 579 864
Ophthalmology Clinic 2,133 2,683 2,365 1,563 1,859
Oncology Clinic 45 - - - -
Total Outpatient Attendances (RMH) 56,057 60,827 60,848 64,618 68,196
SANDiLANDS REHABiLiTATiON CENTRE (SRC):
Community Counselling & Assessment Centre (CCAC) - contacts … 21,474 20,660 … …
Psychiatric Clinic 1,864 1,898 2,042 2,807 2,520
Ann’s Town Geriatrics Clinic 908 930 978 809 794
Total Outpatient Attendances (SRC)(b) … 24,302 23,680 … …
Source: Medical Records Departments - PMH, RMH and SRC, Public Hospitals Authority(a) Specialty clinic visits (PMH): In 2005, seven additional clinics began reporting: Dental, ENT, Eye, Urology, Dialysis, Oncology and Orthopaedics. (b) Total outpatient attendances (SRC) excludes: Podlewski psychiatric visits, day program attendances by adults & adolescents and outpatient child &
adolescents visits.
Use of clinic facilities in all three government hospitals indicates an increasing reliance on government-sponsored services. Of note, at the Princess Margaret Hospital services have increased significantly in the Medical, Obstetrical High Risk, Oncology and Orthopaedic Specialty Clinics; at Rand Memorial, services have increased significantly in the Gynaecology, Psychiatric, Paediatric and Orthopaedic Specialty Clinics (Table 37). The number of attendees at the General Practice Clinic (GPC) and the Civil Servants Clinic at PMH has been decreasing while the number of GPC attendees has been increasing at the Rand Memorial Hospital.

62 Annual Report of the Chief Medical Officer
13.1 gENERAL POPuLATiON
After allowing for infant mortality, it is to be expected that mortality rates for the elderly are far higher than those for younger age groups (Fig. 29). But fewer deaths and lower mortality rates in those age groups still represent a substantial loss of potential life. The gender differential rates, especially between 15 and 44 years, are significant and may be attributable to vehicular and work-related injuries and HIV/AIDS.
Fig. 29. Age-specific death rates, per 100,000 popn. by gender, 2007
0
500
1000
1500
2000
2500
3000
3500
4000
4500
5000
FemaleMale
65+ Years45-64 Years25-44 Years15-24 Years5-14 Years0-4 Years
Deat
h Ra
te
Age Group
Approximately half of all mortality was due to chronic non-communicable diseases, as well as to HIV/AIDS (which has been decreasing), cancers of the breast and prostate, injuries, and especially homicides, which have been increasing. The disparity between the population’s mortality profile and that of morbidity, if measured by hospitalizations, is telling (Table 38). Whereas many hospitalizations are due to acute respiratory infections and appendicitis, hernia and intestinal obstruction, relatively fewer deaths have resulted. This stands in stark contrast to cancers of the breast and prostate, which accounted for 0.6% and 0.2% of all discharges, excluding deliveries, but which are responsible for 2-3% of deaths.
13HEALTH SiTuATiON

MInistry of Health, Commonwealth of The Bahamas 63
Table 38. Percentage distribution of discharge diagnoses, 2004-2007, excluding deliveries
Discharge diagnosis2004 2005 2006 2007
PMH RMH PMH RMH PMH RMH PMH RMH
ARI 6.9 4.2 6.4 4.8 7.6 5.2 5.9 4.7
Hypertensive disease 4.3 3.5 4.0 3.3 3.9 5.3 4.2 5.4
Ischaemic heart disease 0.9 2.9 1.1 2.4 1.1 1.8 1.3 3.2
Intestinal infectious diseases 3.0 3.9 1.2 2.1 2.0 2.5 1.8 1.3
Diabetes mellitus 2.8 2.6 3.6 2.6 3.3 2.3 3.8 3.1
Appendicitis, hernia, intestinal obstruction 2.7 2.4 2.9 2.1 3.0 2.1 2.8 3.4
HIV/AIDS 2.3 0.5 3.5 0.4 4.3 0.7 3.3 0.7
Cerebrovascular diseases 2.2 1.4 2.3 1.6 2.0 2.1 2.8 2.2
Slow fetal growth 1.0 0.6 2.6 0.9 2.0 0.7 1.8 1.1
Respiratory disorders, perinatal 0.7 0.9 1.6 2.2 1.3 1.6 1.0 1.4
Injuries, poisonings and other external causes* 15.8 14.4 14.0 13.6 14.8 10.7 14.2 10.8
Mental and behavioural disorders+ 1.0 6.2 1.0 7.7 1.0 6.5 1.0 7.0
* This is a group and therefore not strictly comparable with the other conditions, but the data does not permit further breakdown into individual external causes
+ Unlike RMH, there is no psychiatric ward at PMH.

64 Annual Report of the Chief Medical Officer
13.2 POPuLATiON SuB-gROuPS
131.21 iNFANTS
Respiratory disorders specific to the perinatal period were a leading cause of infant mortality, with cause-specific death rates at their highest for the decade. Also at their highest point for the decade were death rates for bacterial sepsis of the newborn (Fig. 30).
Fig. 30. Mortality rates per 1,000 livebirths, of leading causes of infant mortality, 1996 – 2008, Bahamas
0.0
1.0
2.0
3.0
4.0
5.0
Respiratory Disorders Specific to the Perinatal PeriodRemainder other Conditions in the Perinatal PeriodDiseases of the Respiratory System
Bacterial Sepsis of NewbornObstetric Complications and Birth Trauma
Congenital Malformations, Deformations, Abnormanlities
2008200720062005200420032002200120001999199819971996
Rate
/1,0
00 L
ive
Birt
hs
Year
Hospital discharge data integrates infants into a 0-4 year old age group, so it is not possible to identify morbid conditions that relate specifically to infants.
13.2.2 CHiLDREN AgED 1-4 yEARS
For the past two years of available mortality data, injuries constituted the leading cause of death among 1-4 year olds, although there seems to be a general downward trend (Fig. 31). It is heartening to note that since 2000, AIDS-related deaths among children under 5 have been near zero. Except for one infant death in 2005 and one death in the 1-4 year old group in 2000 and again in 2002, there were no AIDS deaths in this age group up until 2006.

MInistry of Health, Commonwealth of The Bahamas 65
Fig. 31. Age-specific mortality rates per 10,000 population of the leading causes of death in children aged 1-4 years, 1996-2006, Bahamas
0.0
0.5
1.0
1.5
2.0
2.5
3.0
3.5
4.0
4.5
5.0
External CausesAIDSCongenital Malformations, Deformations, AbnormanlitiesDiseases of the Respiratory System
20062005200420032002200120001999199819971996
Rate
/10,
000
Child
ren
1-4
Year
s
Year
Morbidity in under-5 year-olds was due mainly to respiratory infections, followed by intestinal infectious diseases and injuries (Table 39). This agrees with data from community health services. Discharges for slow foetal growth and perinatal respiratory disorders were of infants. Disparities between PMH and RMH for perinatal respiratory disorders may be related to the transfer of high risk neonates to PMH because of the availability of specialized services (i.e. NICU/SCBU) at PMH.
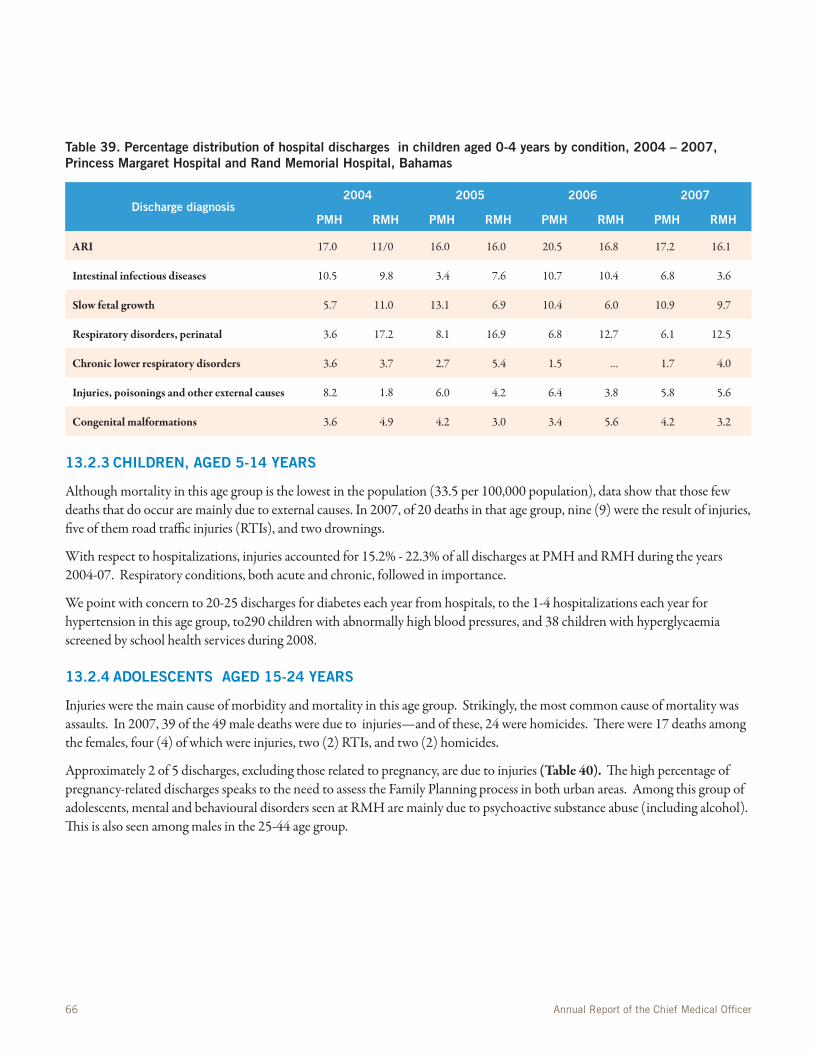
66 Annual Report of the Chief Medical Officer
Table 39. Percentage distribution of hospital discharges in children aged 0-4 years by condition, 2004 – 2007, Princess Margaret Hospital and Rand Memorial Hospital, Bahamas
Discharge diagnosis2004 2005 2006 2007
PMH RMH PMH RMH PMH RMH PMH RMH
ARI 17.0 11/0 16.0 16.0 20.5 16.8 17.2 16.1
Intestinal infectious diseases 10.5 9.8 3.4 7.6 10.7 10.4 6.8 3.6
Slow fetal growth 5.7 11.0 13.1 6.9 10.4 6.0 10.9 9.7
Respiratory disorders, perinatal 3.6 17.2 8.1 16.9 6.8 12.7 6.1 12.5
Chronic lower respiratory disorders 3.6 3.7 2.7 5.4 1.5 … 1.7 4.0
Injuries, poisonings and other external causes 8.2 1.8 6.0 4.2 6.4 3.8 5.8 5.6
Congenital malformations 3.6 4.9 4.2 3.0 3.4 5.6 4.2 3.2
13.2.3 CHiLDREN, AgED 5-14 yEARS
Although mortality in this age group is the lowest in the population (33.5 per 100,000 population), data show that those few deaths that do occur are mainly due to external causes. In 2007, of 20 deaths in that age group, nine (9) were the result of injuries, five of them road traffic injuries (RTIs), and two drownings.
With respect to hospitalizations, injuries accounted for 15.2% - 22.3% of all discharges at PMH and RMH during the years 2004-07. Respiratory conditions, both acute and chronic, followed in importance.
We point with concern to 20-25 discharges for diabetes each year from hospitals, to the 1-4 hospitalizations each year for hypertension in this age group, to290 children with abnormally high blood pressures, and 38 children with hyperglycaemia screened by school health services during 2008.
13.2.4 ADOLESCENTS AgED 15-24 yEARS
Injuries were the main cause of morbidity and mortality in this age group. Strikingly, the most common cause of mortality was assaults. In 2007, 39 of the 49 male deaths were due to injuries—and of these, 24 were homicides. There were 17 deaths among the females, four (4) of which were injuries, two (2) RTIs, and two (2) homicides.
Approximately 2 of 5 discharges, excluding those related to pregnancy, are due to injuries (Table 40). The high percentage of pregnancy-related discharges speaks to the need to assess the Family Planning process in both urban areas. Among this group of adolescents, mental and behavioural disorders seen at RMH are mainly due to psychoactive substance abuse (including alcohol). This is also seen among males in the 25-44 age group.

MInistry of Health, Commonwealth of The Bahamas 67
Table 40. Percentage distribution of discharges in adolescents aged 15-24 years, 2004-2007.
Discharge diagnosis2004 2005 2006 2007
PMH RMH PMH RMH PMH RMH PMH RMH
Pregnancy, childbirth and the puerperium 75.4 43.5 70.7 57.0 62.3 64.8 75.6 67.4
Injuries 9.7 14.4 10.7 9.7 15.3 9.8 9.2 8.8
Mental and behavioural disorders 0.4 4.0 … 7.8 … 3.6 … 5.4
Appendicitis, hernia, intestinal obstruction 1.2 1.8 1.9 1.6 2.2 1.2 <1.0 <1.0
This discharge information highlights the need to disaggregate data in order to evaluate the needs of the community. The lack of HIV/AIDS discharges in this age group reiterates the importance of evaluating the data for these patients in order to identify programmatic benefits such as the effectiveness of identifying cases early and the use of ART with this population.
13.2.5 PERSONS AgED 25-44 yEARS
Injuries and HIV/AIDS accounted for 84 and 45 deaths respectively among the 212 males who died in 2007. Of the 84 fatal injuries, 33 were homicides and 22 were RTIs. Injuries also accounted for a significant proportion of hospital discharges, followed by mental disorders, especially those resulting from psychoactive substance abuse (Table 41).
Table 41. Percentage distribution of discharges in persons aged 25-44 years, 2004 - 2007
Discharge diagnosis2004 2005 2006 2007
PMH RMH PMH RMH PMH RMH PMH RMH
Pregnancy, childbirth and the puerperium 75.4 43.5 70.7 57.0 62.3 64.8 75.6 67.4
Injuries 9.7 14.4 10.7
9.7 15.3 9.8 9.2 8.8
Mental and behavioural disorders 0.6 8.3 … 7.8 … 3.6 … 5.4
13.2.6 PERSONS AgED 45-64 yEARS
Chronic diseases (hypertension, ischaemic heart disease, cerebrovascular disease, diabetes and cancer) and HIV/AIDS are the leading causes of mortality and morbidity in this age group (Table 42). The presence of HIV/AIDS as a cause of death in this age group may be reflective of deferred death due to the effectiveness of antiretroviral therapy (ART) in earlier years resulting in increased survival rates.
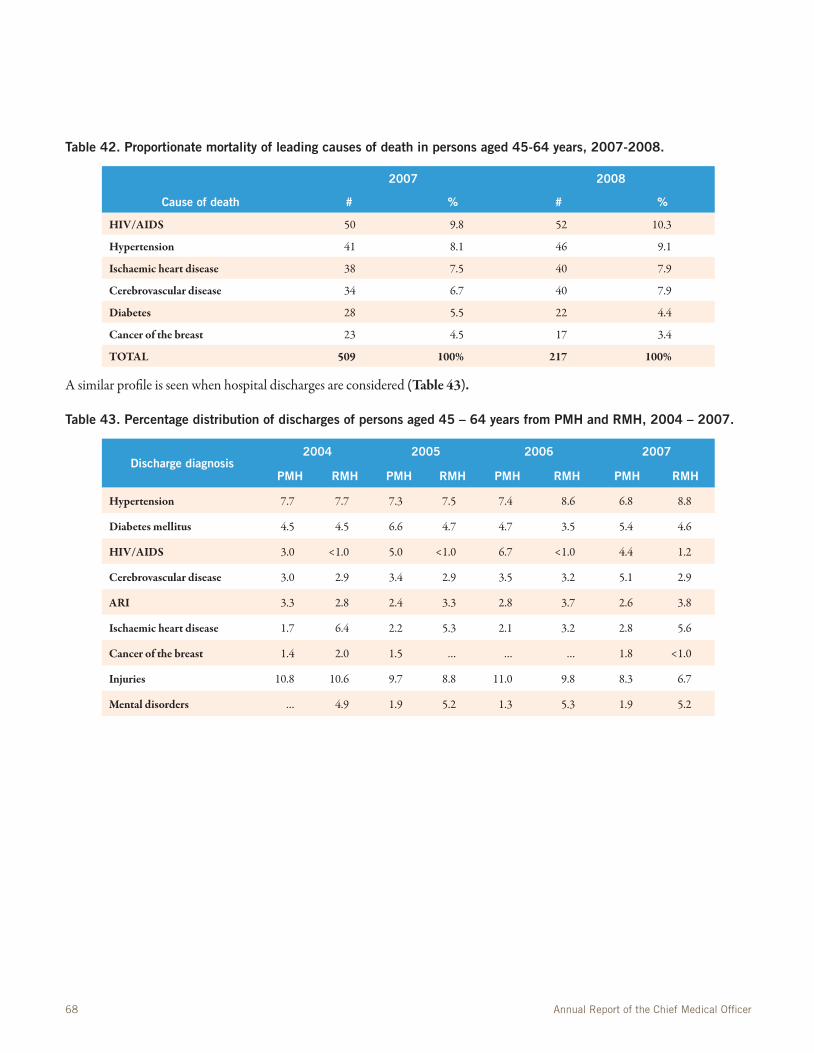
68 Annual Report of the Chief Medical Officer
Table 42. Proportionate mortality of leading causes of death in persons aged 45-64 years, 2007-2008.
2007 2008
Cause of death # % # %
HIV/AIDS 50 9.8 52 10.3
Hypertension 41 8.1 46 9.1
Ischaemic heart disease 38 7.5 40 7.9
Cerebrovascular disease 34 6.7 40 7.9
Diabetes 28 5.5 22 4.4
Cancer of the breast 23 4.5 17 3.4
TOTAL 509 100% 217 100%
A similar profile is seen when hospital discharges are considered (Table 43).
Table 43. Percentage distribution of discharges of persons aged 45 – 64 years from PMH and RMH, 2004 – 2007.
Discharge diagnosis2004 2005 2006 2007
PMH RMH PMH RMH PMH RMH PMH RMH
Hypertension 7.7 7.7 7.3 7.5 7.4 8.6 6.8 8.8
Diabetes mellitus 4.5 4.5 6.6 4.7 4.7 3.5 5.4 4.6
HIV/AIDS 3.0 <1.0 5.0 <1.0 6.7 <1.0 4.4 1.2
Cerebrovascular disease 3.0 2.9 3.4 2.9 3.5 3.2 5.1 2.9
ARI 3.3 2.8 2.4 3.3 2.8 3.7 2.6 3.8
Ischaemic heart disease 1.7 6.4 2.2 5.3 2.1 3.2 2.8 5.6
Cancer of the breast 1.4 2.0 1.5 … … … 1.8 <1.0
Injuries 10.8 10.6 9.7 8.8 11.0 9.8 8.3 6.7
Mental disorders … 4.9 1.9 5.2 1.3 5.3 1.9 5.2

MInistry of Health, Commonwealth of The Bahamas 69
14.1 SuMMARy OF ACHiEvEMENTS
The Bahamas is advancing well towards achieving some of the Millennium Development Goals (MDG) health-related targets. EPI coverage is near 100% and continues to expand, controlling more conditions. All births are attended by skilled personnel. Antenatal care coverage is now over 80%. Maternal mortality, for the most part, varied between 0-2 deaths during the last five years. The MCH programme continues to be a success, despite severe staffing limits and other challenges.
Other effective programmes include the HIV/AIDS programme, which has succeeded in changing AIDS mortality and reducing MTCT to near zero. The national TB Programme has intensified the surveillance and management of TB, so that DOTS coverage remains 100%. The Infectious Disease Surveillance Programme has demonstrated effective surveillance and prompt control measures that have contained malaria and dengue outbreaks. Much of the work of the public health services has been provided effectively, in a strategically focused manner. The Government of The Bahamas has provided invaluable support for persons with chronic diseases, as evidenced by the provision of free medications for HIV/AIDS (antiretroviral therapy) and CNCD’s (antihypertensives, chemotherapy, insulin and other anti-diabetic agents, etc.).
Statistics from school health clinics, with their Grades 1 and 6 entry screenings, have been able to identify and address early health problems including vision and hearing loss, abnormal weights, hypertension and oral health abnormalities. Although the latter has achieved the minimum standards set for oral health status of children, there is room for improvement.
14.2 FuTuRE STRATEgiC FOCi
Despite these achievements, challenges remain. Every one in 12 admissions of children under age five is for an injury. RTIs and other unintentional injuries tend to afflict those in the lower age groups; assaults, homicides, and industrial accidents prevail in our older youth. Data from the Emergency Medical Service requires analysis to determine where response times in New Providence can be improved. No new antigens were added to the paediatric immunization schedule despite recent advances in vaccine-preventable diseases.
In addressing the social determinants of health, issues such as single parent and teenage pregnancies, the impacts of urbanization and overcrowding in New Providence as people move toward commerce centers in search of employment, and other social determinants of health—all play a significant role in the health and longevity of Bahamians. Safety and injury prevention are priority areas to be addressed.
The prevalence of chronic non-communicable diseases, and the appearance of risk factors such as obesity and elevated blood pressure early in life—all speak to the need for the early inculcation of healthy lifestyle habits. Proper nutrition from birth, including exclusive breastfeeding for at least the first 12 weeks, and regular exercise—all must be promoted.
Reproductive health is another area of concern. Teen pregnancies are not insignificant. Neither is the incidence of STIs such as gonorrhea. Both indicate the need for continued promotion of the practices of safe sex or abstinence. The prominence of breast and prostate cancer as causes of mortality argues for aggressive screening for these increasingly common types of cancer.
Finally, the data in this report point to persons at increased risk for the use and misuse of psychoactive substances, including alcohol, as a major factor negatively affecting mental health—mainly among young males. This issue, like the other health issues mentioned above, may be addressed by the promotion of healthy lifestyle habits. Indeed, the Healthy Lifestyle Initiative launched by the Ministry of Health, is a central key to strengthening the health of the people of the Commonwealth of The Bahamas.
Underpinning these recommendations should be a strong information system to guide decision-making and to assess the effectiveness and efficient focus of programmes and interventions as they are executed. The iPHIS holds the potential to do this when completed. We believe its completion is imminent and that MOH staff will be able and enthusiastic to explore its potentials.
14CONCLuSiONS

70 Annual Report of the Chief Medical Officer
14.3 RECOMMENDATiONS AND PROPOSALS/PLANS FOR THE FuTuRE
This report highlights the need for the continued, timely collection and analysis of data, in order to document the health status of the nation and to focus health policy and programmes. Gaps identified in this report underscore the need to conduct more surveys and intensive studies, including those that monitor the attainment of the Millennium Development Goals.
The Ministry of Health must work toward costing the programmes that are currently in place and to insist on doing this in any future programmes. The MOH needs to build its capacity—to act and respond, to assess and refine—especially in the area of project management skills. We have studied the health patterns of Bahamians. We know much of what needs to be done to foster our people’s health and longevity. The ability of MOH to significantly bring down the rates of HIV/AIDS and its mortality has been a major achievement, one not achieved by many larger nations.
We know our people. We have studied their patterns—both those that lead to health and those that lead toward illness and early death. As noted earlier, for a nation as for an individual, health is largely a matter of making and maintaining the right choices. At the Ministry of Health, we believe our choices are fundamentally already defined. We need to keep getting better at managing the challenges we have examined and outlined in this report. We do not need to re-invent the wheel. We need to put axles between those we already have.

MInistry of Health, Commonwealth of The Bahamas 71
Bahamas Department of Statistics. Bahamas Survey of Living Conditions, 2001
Bahamas Department of Statistics. 2008 Labour Force and Households Income Survey
Bahamas Department of Statistics. 2009 Labour Force and Household Income Survey. (in print)..
Bahamas Department of Statistics. The Bahamas in Figures, 2007.
Economic Commission of Latin America and the Caribbean. World Statistics Pocketbook.
Bahamas Country TB Reports, accessed at http://www.who.int/tb/publications/global_report/2009/update/a-1_amr.pdf
Department of Public Health – Oral Health Services Annual Report, 2006
Department of Public Health: EPI Report, 2009.
Draft Food and Nutrition Policy, 2008
Surveillance Report
Prison Health Report, 2004
Prison Health Report, 2005
Prison Health Report, 2006
Prison Health Report, 2007
15REFERENCES

72 Annual Report of the Chief Medical Officer
16.1 TABLES
Table 1. Socio-Economic Indicators
Table 2. Labour Force by age and sex, all Bahamas, 2008
Table 3. Labour Force by highest examination passed, 2008
Table 4. Basic Demographic Indicators, 2002 - 2008
Table 5. Life expectancy at birth, 1980 – 2008
Table 6. Foetal and infant Deaths by age, 1999 – 2008
Table 7. Crude deaths rates (per 100,000 pop.) and ranks for leading causes of death, 2004 – 2008.
Table 8a. Hospital Statistics, 2004 – 2008.
Table 8b. Hospital Statistics, Sandilands Rehabilitation Centre, 2004 – 2008.
Table 9. Community Health Centre Service Statistics, BAHAMAS, 2004-2008
Table 10. Human resources per 10,000 population, 2004 – 2008.
Table 11. Annual Health Budgets 2003/2004-2008/2009
Table 12. Summary of antenatal services, coverage and utilization, 2004 – 2008.
Table 13a. Summary of perinatal information (Maternal indicators) 2005 – 2008
Table 13b. Summary of perinatal information (Neonatal indicators), 2005 - 2008
Table 14. Summary of Post natal and Infant Child Health Services
Table 15. Reasons for attendance (first visits only) at child health clinics, 2004 – 2008.
Table 16. Immunization coverage rates, 2004 - 2008
Table 17. Results of health screening of Grade I students, 2004 - 2008
Table 18. Results of health screening of Grade 6 students, 2004 – 2008
Table 19. Results of health screening of Grade 10 students, 2004 - 2008
Table 20. Reported cases of infectious diseases and syndromes to carec, 2004 - 2008
Table 21. HIV positive rates among pregnant women screened, 2004-2008
Table 22. HIV Mother-to-Child Transmission Rates, 1995-2008
Table 23. HIV Surveillance of selected populations, 2004 – 2007, Bahamas
Table 24. Status of Tuberculosis cases, BAHAMAS, 2004 – 2008
Table 25. Distribution of Tuberculosis cases by co-morbidity with HIV and sex, Bahamas, 2004 – 2008
Table 26. New cases attending Primary Health Clinics for selected non- communicable conditions
Table 27. Grade 1 Caries Prevalence Trends, 2002 - 2006
16TABLES AND FiguRES

MInistry of Health, Commonwealth of The Bahamas 73
Table 28. Grade 6 Caries Prevalence Trends, 2002 -2006
Table 29. Prison Health Screening 2004-2008
Table 30. Annual Meat Statistics, New Providence, 2004-2008
Table 31. Food Handlers Training Sessions, 2004-2008
Table 32. Hospital utilization by service, PMH and RMH, 2008
Table 33. Laboratory tests at Princess Margaret Hospital by type of test, 2004-2008
Table 34. Accident and Emergency Visits by Age and Sex, 2004-2008
Table 35. New Providence emergency Response Data, 2004 – 2008
Table 36. Abaco Emergency Response Data, 2006-2008
Table 37. Hospital Outpatient Visits by Institution and Service, 2004-2008
Table 38. Percentage distribution of discharge diagnoses, 2004-2007, excluding deliveries
Table 39. Percentage distribution of hospital discharges in children aged 0-4 years by condition, 2004 – 2007, Princess Marga-ret Hospital and Rand Memorial Hospital, Bahamas
Table 40. Percentage distribution of discharges in adolescents aged 15-24 years, 2004-2007.
Table 41. Percentage distribution of discharges in persons aged 25-44 years, 2004 – 2007
Table 42. Proportionate mortality of leading causes of death in persons aged 45-64 years, 2007-2008.
Table 43. Percentage distribution of discharges of persons aged 45 – 64 years from PMH and RMH, 2004 – 2007.
16.2 FiguRES
Fig. 1. Distribution of population by age and sex, 2004.
Fig. 2. Population distribution by age and sex, 2008.
Fig. 3. Trends in population growth and associated factors, 1998 – 2008
Fig. 4. Age-specific fertility rates by age-group, 2004-2008
Fig. 5. Mortality rates – crude death rate per 100,000 pop., infant, neonatal and perinatal mortality rates per 1000 live-births, and stillbirth rates per 1000 livebirths, 1998 – 2008
Fig. 6. Leading causes of death, 2004 , 2005
Fig. 7. Leading causes of death, 2006, 2007
Fig. 8. Years of potential life lost (YPLL) 2002-2006
Fig. 9. Hospital in-patient death rates , 1997 – 2007
Fig. 10. Clinic visits in New Providence, Grand Bahama and the Family Islands, 2004-2008
Fig. 11. Home Visits in New Providence, Grand Bahama and the Family Islands, 2004-2008
Fig. 12. Expenditure on health activities, 2006 -2008

74 Annual Report of the Chief Medical Officer
Fig. 13. Percentage of children screened at school health clinic who were overweight
Fig.14. Percentage of children screened at school health clinic who had high blood pressure
Fig. 15. MTCT Rates, 1995-2008
Fig. 16. New Cases of AIDS, by Sex and Year, 1985-2008.
Fig. 17. Cumulative Number of Reported HIV Infections, by Sex, 2008.
Fig. 18. Current Non-AIDS HIV infections, by Sex and Reported Year, 1985-2008
Fig. 19. Cumulative cases by age-group & Sex as at 31.12.2008
Fig. 20. Incidence and prevalence of TB and co-morbid HIV, Bahamas, 1990 – 2008
Fig. 21. Selected conditions as percentages of total discharges (excluding deliveries) from princess Margaret and Rand Memorial hospitals, 2004 – 2008
Fig. 22. Patients on dialysis at princess margarget hospital by underlying condition, 2007
Fig. 23. Summary of cancer sites by gender, Princess Margaret Hospital, 2008
Fig 24. Patients treated in Mental Health Facilities by Diagnosis
Fig. 25. School Dental Services-Clinical Activity Trends 2002-2006
Fig. 26. Preventive Dental Treatments Rendered by clinic-New Providence & Family Islands-2006
Figure 27:. Exuma Anopheles Larval Total Average-2008
Figure 28. 2008 Exuma Human Bait Collection Total Average
Fig. 29. Age-specific death rates, per 100,000 popn. by gender, 2007
Fig. 30. Mortality rates per 1,000 livebirths, of leading causes of infant mortality, 1996 – 2006, Bahamas
Fig. 31. Age-specific mortality rates per 10,000 population of the leading causes of death in children aged 1-4 years, 1996-2006, Bahamas

MInistry of Health, Commonwealth of The Bahamas 75
Ministry of H
ealth 20
04
– February 20
06
Minister of Health
Parliamentary Secretary
Chairman
Best Comm
ission
DirectorBEST
Environmental
Protection Unit
DirectorDepartm
ent ofPublic Health
DirectorDepartm
ent of Environm
ental Health
Administration
Administration
Oral HealthHealth Inspectorate
Comm
unity NursingServices
Waste M
anagement
Programm
esCoordination
Environmental
Monitoring and
Risk Assessment
Clinic andCom
munity Services
Roads and Parks
Directory of NursingOffice of DoN
Regulatory BodiesM
edical CouncilDental Council
Council for Regulationof Health Professions
Hospital and Health CareFacilities
Licensing Board
Technical and AdvisoryUnits
Health EducationHealth Inform
ation UnitAIDS Secretariat
National Drug CouncilNGO Organization Desk
Public Relations andCom
munications
Finances and M
aterialsM
anagement
Human Resource
Managem
ent
Policy, Planning andDevelopm
ent
Clinical PastoralProgram
and HealthCare Chaplaincy
Permanent Secretary
Minister of Health
HQ
Chairman of the
PHA Board
Chief Medical Officer
Office of CMO
Public Hospitals
Under Secretary
ANNExES

76 Annual Report of the Chief Medical Officer
Departm
ent of Environm
ental Health S
ervices under the Ministry of H
ealth May 2
00
7 – S
eptember 2
00
8
Director
ASSISTANT DIRECTORHEALTH INSPECTORATE
PRESS LIAISON
CHI(1)
Administrative Responsibility
HEALTH INSPECTORATE
CHISPECIAL PROJECTS
Family Islands
Nighttime Survellance
DCHIEnv. Court
Building Contro;Special Projects/Env. Quarterly
DCHIPort HealthM
ain StreetM
eat Inspection
DCHILicensing
Complaints
Licensing/Special Projects
Chief Public Analyst
Public Analyst
Deputy Public Analyst
Assistant Analyst
Night Survelliance TeamDerelict Vehicle Site
Derelict Vehicle ProgramSpecial Env. M
aintenance
ASSISTANT DIRECTORW
ASTE DISPOSAL SITEFAM
ILY IS. WASTE OPERATIONS
Disposal Site Manager(s)
Daily Managem
ent Site
CHICollections
Administration Collections
Sr. Tractor Operator
Tractor Operator
Spotter(s)
Sr. SuperintendentsDaily M
anagement
of Operations
ASSISTANT DIRECTOREM
RABASEL CONVENTION
CHIAdm
inistration R&PEstates M
anagement
Garage (CARS)
Chief Works Controller
Daily Managem
ent of R&P
SuperintendentAssist with Daily M
anagement
Sr. Field Support
ASSISTANT DIRECTORPEUR&P
Field Supervisors
Sr. Field SupervisorsSupervision M
onitoring of Routes
Field SupervisorsCheck of Field W
ork
Group Leaders
SHI
H.I 1
H.I 2
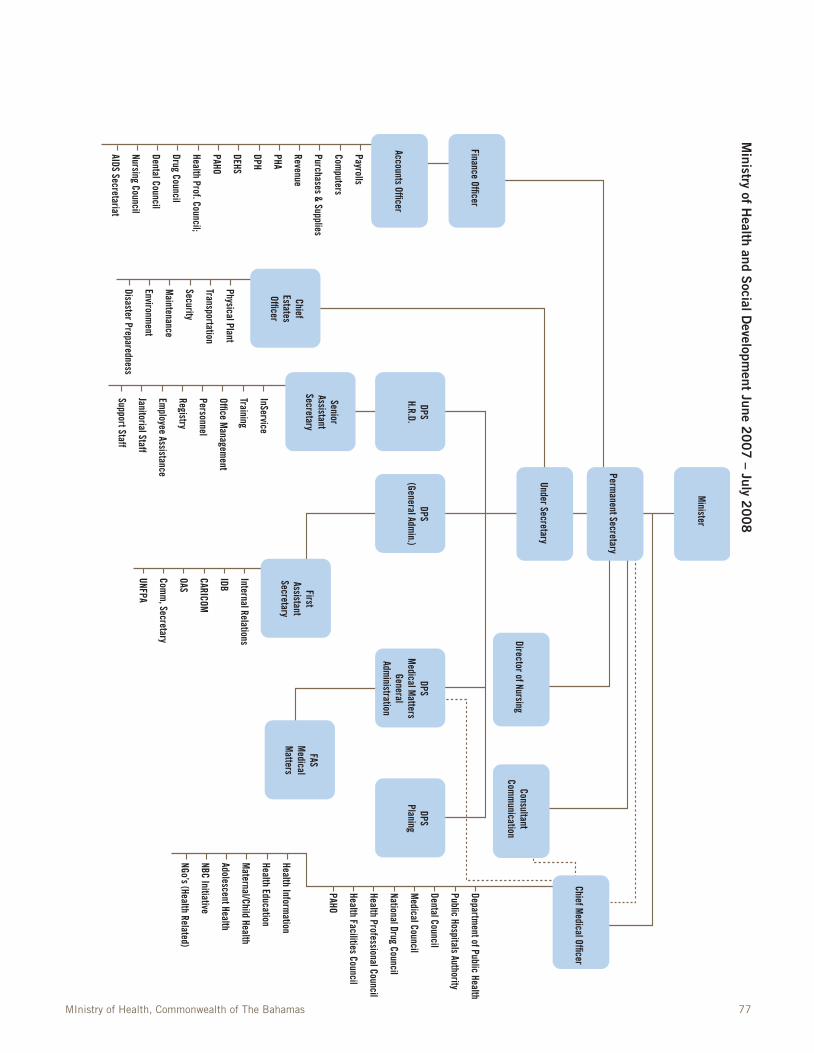
MInistry of Health, Commonwealth of The Bahamas 77
Minister
Permanent Secretary
Finance Officer
Accounts Officer
Under Secretary
Director of NursingConsultant
Comm
unication
DPSPlaning
DPS(General Adm
in.)DPS
H.R.D.
SeniorAssistantSecretary
ChiefEstatesOfficer
FASM
edicalM
atters
FirstAssistantSecretary
DPSM
edical Matters
GeneralAdm
inistration
Chief Medical Officer
Department of Public Health
Public Hospitals Authority
Dental Council
Medical Council
National Drug Council
Health Professional Council
Health Facilities Council
PAHO
Health Information
Health Education
Maternal/Child Health
Adolescent Health
NBC Initiative
NGo’s (Health Related)
Internal Relations
IDB
CARICOM
OAS
Comm
, Secretary
UNFPA
Physical Plant
Transportation
Security
Maintenance
Environment
Disaster Preparedness
Payrolls
Computers
Purchases & Supplies
Revenue
PHA
DPH
DEHS
PAHO
Health Prof. Council;
Drug Council
Dental Council
Nursing Council
AIDS Secretariat
InService
Training
Office Managem
ent
Personnel
Registry
Employee Assistance
Janitorial Staff
Support Staff
Ministry of H
ealth and Social D
evelopment june 2
00
7 – july 2
00
8

78 Annual Report of the Chief Medical Officer
Minister of Health
Managing Director
Internal Auditor
Board of Directors
Chairman
Directorof
Projects
ProjectManagement
BNDA
MMD
CapitalDevelopment
Unit
Plant, Equipment& Furniture
ProcurementOversight
InformationTechnology
Management&
Development
QualityManagement
Oversight
PublicRelations
Planning &Business
Development
InformationMonitoring
Evaluation &Analysis
Recruitment&
Retention
CareerPathways/Succession
Planning
Training &Development
PerformanceManagement
Budgeting&
Reporting
AccountsPayable
Payrolls
AssetsManagement
MedicalServicesOversight
MedicalInternship &
SpecialProgrammes
Oversight
TechnicalOversight
Allied HealthServices
QualityStandards
DevelopmentMonitoring
QualityStandards
DevelopmentMonitoring
NursingServicesOversight
LitigationManagement
Policy &StatutoryProvisions
EmployeeRelations
Compensation& Salary
Administration
Registry
Directorof
SharedServices
Directorof
HumanResources
FinancialController
NursingServicesAdvisor
LegalAdvisor/Board
Secretary
PrincessMargaretHospital
SandilandsRehabilitation
Centre
GrandBahamas
HealthServices
NEMS
OfficeManagement
MedicalAdvisor
Deputy Managing Director
Legend:BNDA Bahamas National Drug AgencyMMD Materials Management DirectorateNEMS National Emergency Medical Services
Functional Organizational Chart—Public Hospitals Authority

MInistry of Health, Commonwealth of The Bahamas 79
Director
EMC
General Administration
Medical Coordinator
Principal Nursing OfficerDirector of Planning
Human Resources
Finance
Transport/Supplies
Estates Managem
ent
Projects
Surveillance
Health Information iPHIS
Monitoring & Evaluation
QA/Research
Dental Services
Allied Health Services
Clinic Teams
Family Island Services
New Providence
Training/Development
Departm
ent of Public H
ealth Proposed O
rganizational Structure – 2
00
5


82 Annual Report of the Chief Medical Officer
Ministry of Health The government of the Bahamas
Meeting and Delancy Nassau, Bahamas
Top Related