


Languages
Pages
Legal


Renewable Energy (Wave Energy) West Coast Vancouver Island
CK Kim, Gregg Verutes, Doug Denu

Making the Case
• There is harvestable energy in the world’s oceans.
INTRO METHODS INPUTS APPLICATION HANDS-ON RESULTS FUTURE
180 W 135
W 90
W 45
W 0
45
E 90
E 135
E 180
E
45 S
0
45 N
0
20
40
60
80
100
120
0
5
10
15
20
25
30
Solar Wind Wave Tide
Power Density (kW/m, kW/m2)
• High power density
• Continuous and predictable power
Wave Power (kW/m)

Some WEC Devices
INTRO METHODS INPUTS APPLICATION HANDS-ON RESULTS FUTURE
Attenuator Point Absorber
Oscillating
Wave Surge Converter
Oscillating Water Column
Overtopping Device Submerged Pressure Differential

WEC Device Maturity
INTRO METHODS INPUTS APPLICATION HANDS-ON RESULTS FUTURE
(EPRI, 2005)
WEC Device Maturity
Rate
Length (m)
Width (m)
Avg. Power (kW)
WEC Type
Pelamis 1 120 4.6 153 Attenuator
OWC - Terminator 2 25 35 259 OWC
Wave Dragon 2 150 260 1369 Overtopping
Wave Swing 2 9.5 9.5 351 Point Abs
AquaBuOY 3 6 6 17 Point Abs
WaveBob 3 15 15 131 Point Abs
Offshore OWC 3 32 32 532 OWC
Wave Dog 3 5.4 5.4 16 Point Abs

About the Model
INTRO METHODS INPUTS APPLICATION HANDS-ON RESULTS FUTURE
orbital
velocity
sin wave
velocity ~ height

About the Model
INTRO METHODS INPUTS APPLICATION HANDS-ON RESULTS FUTURE
sin wave
motion ~ energy

Renewable Energy: Waves
Supply
Potential available
Service
Delivered to people
Value
Economic & social impacts
• Captured Wave Energy
• Renewable electricity to grid + avoided emissions
• Wave Power
INTRO METHODS INPUTS APPLICATION HANDS-ON RESULTS FUTURE

Wave Energy Model (WEM)
• To map and value wave energy resources
• To examine potential trade-offs
• To help decision-makers understand where best to install a WEC facility
INTRO METHODS INPUTS APPLICATION HANDS-ON RESULTS FUTURE

WEM Inputs
INTRO METHODS INPUTS APPLICATION HANDS-ON RESULTS FUTURE
Inputs
Sea state wave height, period
Device operation performance, limitations
Outputs
Energy produced
Value of energy
Economic values Cost of device, electricity, maintenance, accessibility of grid
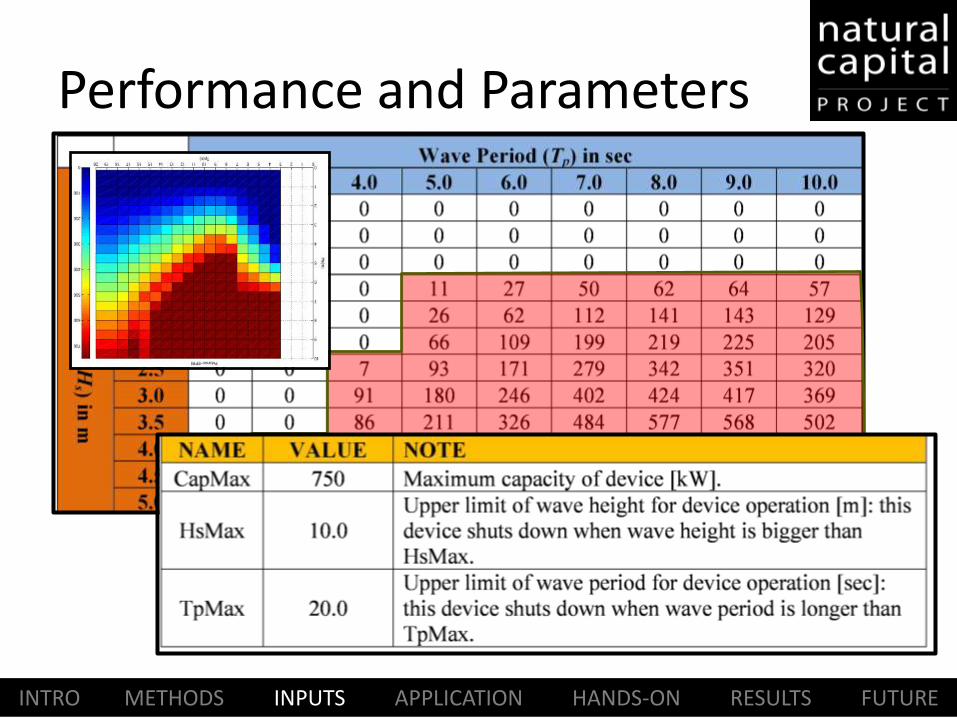
Performance and Parameters
INTRO METHODS INPUTS APPLICATION HANDS-ON RESULTS FUTURE
• xxxx

Machine Performance
INTRO METHODS INPUTS APPLICATION HANDS-ON RESULTS FUTURE
Wave H
eig
ht
(m
)
Wave Period (s)
Wave H
eig
ht
(m
)
Wave Period (s)
Pelamis OWC
0.0
0.5
1.0
1.5
2.0
2.5
3.0
3.5
SF-Shallow SF-Deep CA-HMB Portugal Ireland
An
nu
al
En
erg
y O
utp
ut
(MW
h/y
ea
r/d
evi
ce)
Th
ou
san
ds
Location
Pelamis-EPRI
OWC-Energetech

Wave Watch III (WW3)
INTRO METHODS INPUTS APPLICATION HANDS-ON RESULTS FUTURE
National Weather Service, NOAA
Model ID Grid Size
[min.] Extent/Region Year
GLO30m 30 x 30
(54 x 54km) Global Ocean 2005-2010
WC4m 4x4
(7 x 7km) US west coast and Hawaiian islands
2005-2010
EC4m 4x4
(7 x 7km) US east coast and Puerto Rico
2005-2010

Economic Valuation
INTRO METHODS INPUTS APPLICATION HANDS-ON RESULTS FUTURE
T
t
t
tt iCBNPV1
)1)((
NPV = Net Present Value ($)
T = 25-year period
Bt = Benefits
Ct = C & M Costs
i = Discount rate, 5%

Economic Valuation
INTRO METHODS INPUTS APPLICATION HANDS-ON RESULTS FUTURE
Sea State Conditions
NPV =
Benefits minus Costs Machine
Type
Wave Power (Potential)
• Performance • Limitations
Captured Wave Energy
x Price of Electricity
• Setup • Maintenance
Cable Costs • Distance to
Landing Pts. • Distance to Grid
Connection Pts.

: Power Grid Connection Pts.
: Cable Landing Pts.
: Wave Watch III Grid Pts.
Economic Valuation
INTRO METHODS INPUTS APPLICATION HANDS-ON RESULTS FUTURE
39.5 km
38.0 km
9.1 km

Limitations and Simplifications
1. Captured wave energy indicates the yearly averaged energy absorbed per WEC device.
2. With no commercial-scale wave energy facilities implemented to date, obtaining accurate cost data is a challenge.
3. The distance measure from a WEC facility to an underwater cable landing point is based on Euclidean metric and does not recognize any landmass within two target points.
4. The quality of wave input data determines the accuracy of model results. – Default wave input data are more appropriate for global
and regional scale applications
INTRO METHODS INPUTS APPLICATION HANDS-ON RESULTS FUTURE
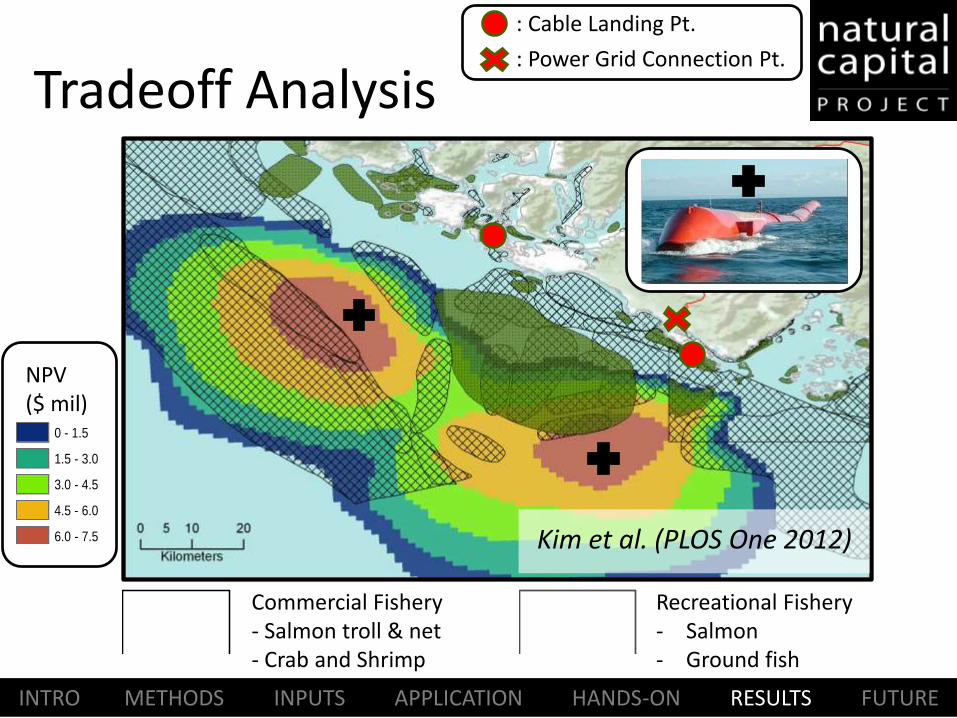
Tradeoff Analysis
INTRO METHODS INPUTS APPLICATION HANDS-ON RESULTS FUTURE
0 - 1.5
1.5 - 3.0
3.0 - 4.5
4.5 - 6.0
6.0 - 7.5
NPV ($ mil)
COM_SAL_TRCommercial Fishery - Salmon troll & net - Crab and Shrimp
REC_FISHRecreational Fishery - Salmon - Ground fish
: Power Grid Connection Pt.
: Cable Landing Pt.
Kim et al. (PLOS One 2012)

Running the Sample Data
INTRO METHODS INPUTS APPLICATION HANDS-ON RESULTS FUTURE
InVEST 3.0
• Launch through ‘Start’ menu
• Independent of ArcGIS
• Faster
• More user-friendly


INTRO METHODS INPUTS APPLICATION HANDS-ON RESULTS FUTURE
Study Site

Validation
• British Columbia Marine Conservation Atlas
INTRO METHODS INPUTS APPLICATION HANDS-ON RESULTS FUTURE

Economic Inputs
INTRO METHODS INPUTS APPLICATION HANDS-ON RESULTS FUTURE

Overlap Analysis
• Areas of positive NPV
INTRO METHODS INPUTS APPLICATION HANDS-ON RESULTS FUTURE
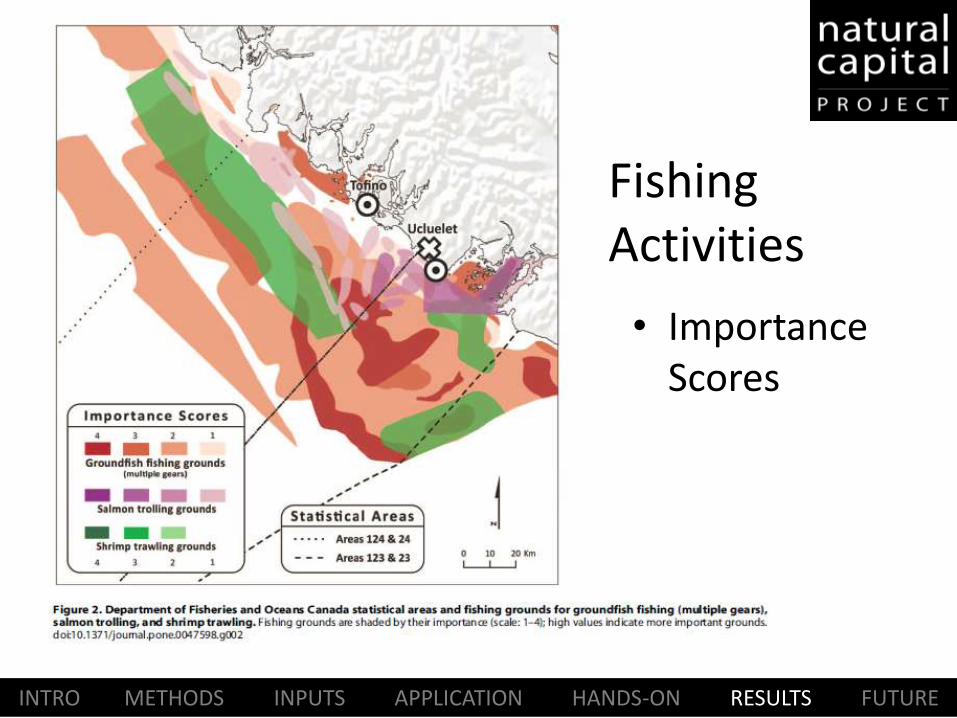
Fishing Activities
• Importance Scores
INTRO METHODS INPUTS APPLICATION HANDS-ON RESULTS FUTURE

Net Value of Commercial Fishing
• Cool Colored Areas = Less Value
INTRO METHODS INPUTS APPLICATION HANDS-ON RESULTS FUTURE
Kim et al. (PLOS One 2012)
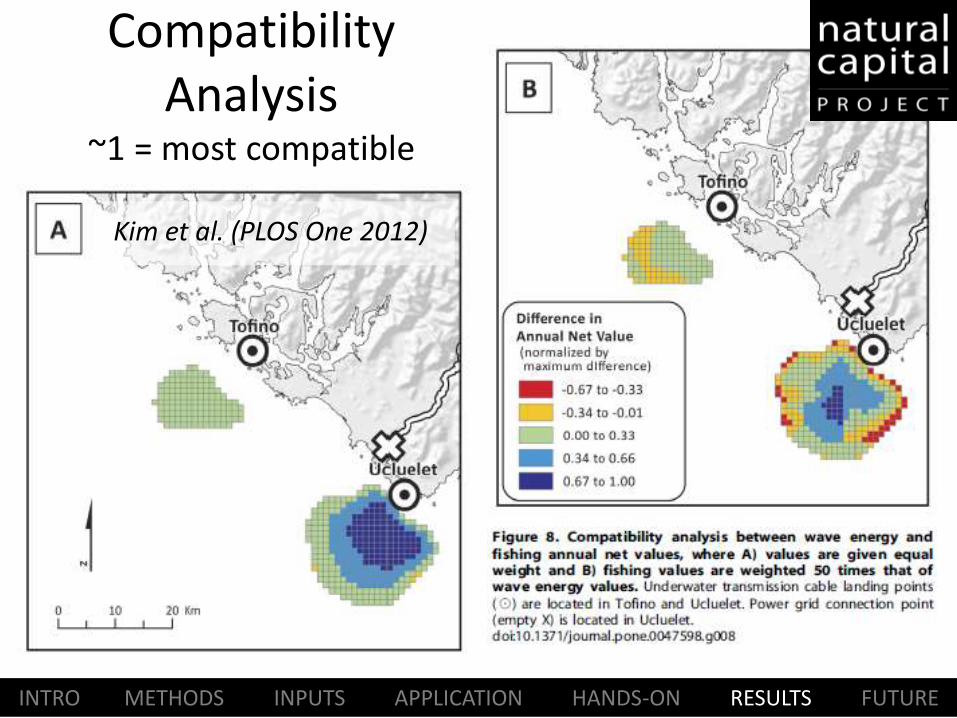
Compatibility Analysis
~1 = most compatible
• xxx
INTRO METHODS INPUTS APPLICATION HANDS-ON RESULTS FUTURE
Kim et al. (PLOS One 2012)
Top Related