


Languages
Pages
Legal

Remote Frequency Conversion Using
SOA and EAM for 60 GHz Bi-
Directional Radio-on-Fiber Systems
Jun-Hyuk Seo
The Graduate School
Yonsei University
Department of Electrical and Electronic Engineering

Remote Frequency Conversion Using
SOA and EAM for 60 GHz Bi-
Directional Radio-on-Fiber Systems
A Dissertation
Submitted to the Department of Electrical and Electronic Engineering
and the Graduate School of Yonsei University in partial fulfillment of
the requirements for the degree of Doctor of Philosophy
Jun-Hyuk Seo
June 2006

This certifies that the dissertation of Jun-Hyuk Seo is
approved.
___________________________
Thesis Supervisor: Woo-Young Choi
___________________________
Sang-Kook Han
___________________________
Ilgu Yun
___________________________
Young Min Jhon
___________________________
Dong-Soo Shin
The Graduate School
Yonsei University
June 2006

i
Tables of Contents Tables of Contents ................................................................................i
List of Figures and Tables................................................................... iii
Abstract..................................................................................................ix
1. Introduction..................................................................................1
1-1. Why 60 GHz? ................................................................................ 1
1-2. Radio-on-Fiber Systems for 60 GHz systems ........................... 5
1-3. Bi-Directional RoF Link............................................................. 11
1-4. Outline ......................................................................................... 14
2. Remote Frequency Up-Conversion Using SOA-PD Configuration .....................................................................................16
2-1. Operation Principle of Frequency Up-Conversion............. 16
2-1-1. Optical LO and IF signal generation........................................... 18
2-1-2. Cross-gain modulation (XGM) of SOA...................................... 22
2-1-3. Frequency up-conversion at a PD ............................................... 26
2-1-4. Frequency up-conversion experiment ......................................... 29
2-2. Simulation of Frequency Up-Conversion Using a Transfer Matrix Method ........................................................................................ 32
2-2-1. SOA Modeling using TMM........................................................ 33
2-2-2. Simulation results of SOA gain characteristics........................... 39
2-2-3. Simulation results of frequency up-conversion........................... 44
2-3. Gigabit Data Transmission using SOA-PD Frequency Up-Converter at 60 GHz band .................................................................... 48
2-3-1. Measurement of SOA XGM frequency response ....................... 49
2-3-2. Data transmission experiments and results ................................. 52
3. Remote Frequency Down-Conversion Using EAM...............61
3-1. Uplink RoF Systems for Bi-Directional Data Transmission ……………………………………………………………………61

ii
3-2. Operation Principle of EAM Frequency Down-Conversion ……………………………………………………………………65
3-2-1. Characteristics of EAM ............................................................ 65
3-2-2. Optoelectronic frequency down-conversion in EAM............... 70
3-3. Conversion Efficiency of EAM Frequency Down-Conversion............................................................................................... 74
3-3-1. Experimental setup and conversion efficiency definition......... 74
3-3-2. Down-conversion efficiency results ......................................... 79
3-4. 60 GHz Uplink RoF Systems using Frequency Down-
Conversion ................................................................................................ 83
3-4-1. Experimental setup and results for 60-GHz data transmission. 83
4. Remote Frequency Up/Down-Conversion using Cascade SOA-EAM Configuration .................................................................91
4-1. Bi-directional RoF systems...................................................... 91
4-2. Operation Principles of Frequency Converters................... 93
4-2-1. Frequency up-conversion for downlink transmission............... 93
4-2-2. Frequency down-conversion for uplink transmission............... 98
4-3. Conversion Efficiency Characteristics of SOA-EAM Frequency Converters.......................................................................... 103
4-3-1. Conversion efficiency definition ............................................ 103
4-3-2. Measurement results of conversion efficiency ....................... 106
4-4. 60 GHz Bi-Directional RoF Systems using SOA-EAM Configuration........................................................................................ 112
4-4-1. Experimental setup and data transmission results .................. 112
5. Summary ...................................................................................124
References ..........................................................................................128
Publication Lists..............................................................................137

iii
List of Figures and Tables
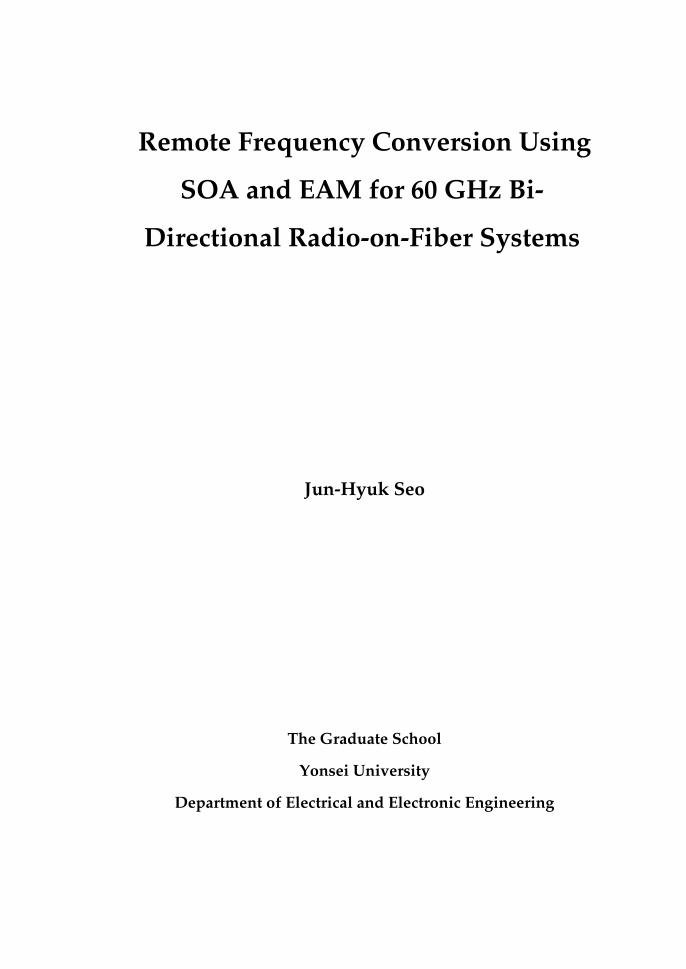
Figure 1-1. Status of license-free 60 GHz-bands in several countries. ... 2 Figure 1-2. Directivity comparison among ISM band carrier signals. ...3 Figure 1-3. Wireless applications using 60 GHz signals. ......................... 4 Figure 1-4. Simple bi-directional RoF system configuration. .................. 5 Figure 1-5. Schematic of dispersion-induced signal fading problems in
intensity modulated millimeter-wave signal transmission. ........... 7 Figure 1-6. Dispersion compensators for optical millimeter-wave signal
transmission without signal penalty.................................................. 8 Figure 1-7. Simple bi-directional RoF link based on remote frequency
conversion technique.......................................................................... 10 Figure 1-8. RoF downlink system configuration based on
optoelectronic frequency up-conversion using HPT. .................... 10 Figure 1-9. Bi-directional millimeter-wave RoF link using EAM. ........ 12 Figure 1-10. Bi-directional RoF systems using remote frequency
conversion based on a cascaded SOA-EAM configuration proposed in this dissertation............................................................. 13
Figure 2-1. Base station of downlink RoF systems based on remote frequency up-conversion and photonic frequency up-converter.17
Figure 2-2. Schematic of photonic frequency up-conversion based on SOA-PD configuration. ...................................................................... 17
Figure 2-3. Optical LO generation using DSB-SC method, and optical IF generation using direct laser diode modulation........................ 21
Figure 2-4. Stimulated processes in a two level system. ........................ 23 Figure 2-5. Process of optical IF signal modulation in optical LO
signals by SOA XGM. Below is a simple operation principle of XGM...................................................................................................... 25
Figure 2-6. Frequency up-conversion by the signal beating process in PD.......................................................................................................... 27

iv
Figure 2-7. Experimental setup to verify optical frequency up-conversion at 25 GHz band. LD : Laser Diode, EDFA : Erbium-Doped Fiber Amplifier, RF-SA : RF-Spectrum Analyzer, PC : Polarization Controller....................................................................... 29
Figure 2-8. RF Spectrum measured before SOA (a), and after SOA (b)................................................................................................................ 31
Figure 2-9. Schematic of SOA model based on time-dependent TMM................................................................................................................ 33
Figure 2-10. (a) Field model in unit SOA, (b) Field propagation and reflection model in different refractive index layers...................... 35
Figure 2-11. Optical gain of SOA as a function of output optical power with different SOA injection currents. ............................................. 42
Figure 2-12. Optical gain of SOA as a function of SOA injection current................................................................................................................ 42
Figure 2-13. Material gain of SOA (a) and optical gain of SOA (b) as a function of input signal wavelength with different SOA injection currents................................................................................................. 43
Figure 2-14. Schematic of frequency up-conversion efficiency............. 44 Figure 2-15. Frequency up-conversion efficiency as a function of SOA
input optical LO powers. ................................................................... 47 Figure 2-16. Frequency up-conversion efficiency and SOA gain as a
function of input optical IF wavelengths. ....................................... 47 Figure 2-17. Measurement setup for SOA XGM frequency response.
OBPF: Optical Band Pass Filter, TLS: Tunable Laser Source. ....... 51 Figure 2-18. Frequency response for SOA XGM for a -12 dBm SOA
input pump signal power. ................................................................. 51 Figure 2-19. Experimental setup for 1.244 Gbit/s 63 GHz RoF downlink
data transmission. LPF: LowPass Filter........................................... 54 Figure 2-20. Optical spectrum of downlink optical LO and data signals
before SOA (a) and after SOA (b). .................................................... 55

v
Figure 2-21. RF spectrum of frequency up-converted 63 GHz data signals (a) and demodulated baseband signals (b). Resolution bandwidth for both spectra is 1 MHz. ............................................. 56
Figure 2-22. Dependence of BERs performance on SOA input optical baseband signal power....................................................................... 58
Figure 2-23. Dependence of BER performance on SOA input LO signal power.................................................................................................... 59
Figure 3-1. Uplink RoF system configurations. (a) direct RF transmission systems, (b) IF/Baseband Feeder systems. ............... 62
Figure 3-2. Uplink millimeter-wave RoF systems based on EAM........ 63 Figure 3-3. Remote frequency down-conversion RoF uplink systems
using EAM. .......................................................................................... 64 Figure 3-4. Operation principle schematic of multiple quantum-well
EAM...................................................................................................... 66 Figure 3-5. Experimental setup to measure optical transmission and
absorption characteristics of EAM. .................................................. 67 Figure 3-6. Optical transmission (a) and photodetection characteristics
(b) of EAM as a function of applied voltage at different input wavelength conditions. ...................................................................... 69
Figure 3-7. Schematic of optoelectronic frequency down-conversion for uplink RoF systems............................................................................. 72
Figure 3-8. RF spectrum of frequency down-converted signals (a) and RF and LO signals after photodetection of optical IF signals....... 73
Figure 3-9. Experimental setup to measure frequency down-conversion efficiency. EOM : Electrooptic Modulator....................................... 76
Figure 3-10. Optical spectrum measured before EAM (a) and after optical filtering of optical LO signals (b). ........................................ 77
Figure 3-11. RF spectrum of uplink IF signals (a) and RF signals (b) after photodetection of optical IF signals. ....................................... 78
Figure 3-12. Frequency down-conversion efficiency as a function of EAM bias condition. ........................................................................... 81

vi
Figure 3-13. Frequency down-conversion efficiency as a function of EAM input optical LO power. .......................................................... 81
Figure 3-14. Frequency down-conversion efficiency as a function of EAM input optical IF power (a) and wavelength (b)..................... 82
Figure 3-15. S11 parameter characteristics at the input port of 60 GHz narrow-band packaged EAM............................................................ 84
Figure 3-16. Experimental setup for 60 GHz frequency down-conversion and uplink data transmission. BPF : Bandpass Filter.85
Figure 3-17. Frequency down-converted 500 MHz IF signal spectrum. Resolution bandwidth is 10 kHz ...................................................... 86
Figure 3-18. (a) 10 Mbps QPSK modulated signal spectrum at 60 GHz, (b) frequency down-converted QPSK modulated signal spectrum at 500 MHz. Resolution bandwidth is 100 kHz. ............................. 89
Figure 3-19. Eye diagram of demodulated 10 Mbps QPSK signals at 500 MHz. .............................................................................................. 90
Figure 4-1. Proposed bi-directional RoF system configuration adopting a photonic mixer at a base station. ................................................... 92
Figure 4-2. Schematic for frequency up-conversion processes and experimental setup used for verification......................................... 94
Figure 4-3. RF spectra for downlink frequency up-conversion: (a) IF signals without SOA, (b) frequency up-converted signals. The resolution bandwidth was 300 kHz for (a) and 100 kHz for (b). A 17 dB gain electrical amplifier was used for (b). ............................ 96
Figure 4-4. Normalized signal amplitude of frequency up-converted signals and calculated results of double-sideband signal transmission at 60 GHz band. The measured up-converted signal power is normalized to the power at back-to-back conditions. ... 97
Figure 4-5. Schematics for frequency down-conversion processes and experimental setup used for verification....................................... 100
Figure 4-6. RF spectra for uplink frequency down-conversion: (a) RF signals measured at the central station, (b) frequency down-converted signals measured at the central station. The resolution

vii
bandwidth was 1 kHz for both. A 17 dB gain electrical amplifier was used for (a), and a 20 dB gain electrical amplifier was used for (b). ................................................................................................. 101
Figure 4-7. Normalized signal amplitude of frequency down-converted signals and calculated results of double-sideband signal transmission at 60 GHz band. The measured down-converted signal power is normalized to the power at back-to-back conditions........................................................................................... 102
Figure 4-8. Schematic of frequency up-conversion efficiency (a) and frequency down-conversion efficiency.......................................... 105
Figure 4-9. Dependence of frequency conversion efficiency (ηup and ηdown) on EAM bias conditions. ....................................................... 108
Figure 4-10. Frequency up-conversion efficiency (ηup) (a), and frequency down-conversion efficiency (ηdown) (b) as a function of optical LO signal power. Optical LO power was measured in front of SOA....................................................................................... 110
Figure 4-11. Frequency conversion efficiencies as a function of SOA input optical IF signal power. ......................................................... 111
Figure 4-12. Frequency conversion efficiencies as a function of SOA input optical IF wavelength. ........................................................... 111
Figure 4-13. Experimental setup for 60 GHz bi-directional RoF systems.............................................................................................................. 114
Figure 4-14. Optical spectra of downlink signals (a) and uplink signals (b). ....................................................................................................... 115
Figure 4-15. RF spectrum of frequency up-converted data signals.... 118 Figure 4-16. Constellation and Eye diagram of demodulated downlink
5 Msymbol/s QPSK (a) and 16QAM data signals......................... 119 Figure 4-17. RF spectrum of the frequency down-converted uplink
signals. ................................................................................................ 120 Figure 4-18. Constellation and Eye diagram of demodulated uplink 5
Msymbol/s QPSK (a) and 16QAM data signals............................ 121

viii
Figure 4-19. Measured EVMs as a function of SOA input optical IF signal power for downlink and uplink.......................................... 123
Figure 4-20. Measured EVMs as a function of optical IF signal wavelength for downlink and uplink. ........................................... 123
Table 2-1. SOA simulation parameters. …………………………………41

ix
Abstract
Photonic frequency converters based on semiconductor optical amplifier (SOA) and electroabsorption modulator (EAM) for cost-effective and practical 60 GHz Radio-on-Fiber (RoF) systems are investigated, and 60 GHz RoF systems are realized through these photonic frequency converters. In RoF systems, these frequency converters are applied as a remote frequency converter to mitigate dispersion-induced signal fading problems. They also help to simplify base station architectures. Each frequency up- and down-conversion technique is proposed and analyzed separately, and then a new photonic mixer combining two schemes is introduced for bi-directional RoF link design.
The frequency up-conversion method for downlink data transmission uses cross-gain modulation of SOA and square-law characteristics of photodetector. In this scheme, both 60 GHz local oscillator (LO) signals and intermediate frequency (IF) signals are optically transmitted from a central station to base stations. The SOA large signal simulation model using transfer matrix method is applied to show the basic operation characteristics of SOA. Based on this simulation model, the frequency up-conversion processes are clarified, and frequency up-conversion efficiency is estimated as functions of SOA input optical LO powers and optical IF wavelengths at 60 GHz band. The gigahertz operation bandwidth of the frequency up-

x
converter is verified experimentally at different input optical powers, and ASK 1.244 Gbit/s downlink data transmission systems are successfully demonstrated at 60 GHz band for the first time. For uplink RoF data transmission, frequency down-conversion method using EAM nonlinearity is proposed. It also uses optical LO and optical IF signals delivered from the central station, and frequency down-converted signals are optically transmitted back to the central station. The internal conversion efficiency definition is suggested for this frequency down-converter to exclude other optical effects in RoF links. The conversion efficiency is measured at 30 GHz band as functions of EAM biases, EAM input optical LO and IF powers, and optical IF wavelengths. The uplink RoF link employing this frequency down-converter is also realized at 60 GHz band, and error-free 5 Msymbol/s QPSK data is transmitted. For bi-directional RoF links, two concepts of frequency conversion are integrated to one cascaded SOA and EAM configuration performing both frequency up- and down-conversion with optically provided LO and IF signals. The frequency conversion efficiency is also defined for the proposed frequency converter, and measured at 60 GHz band as functions of EAM biases, SOA input optical LO and IF powers, and optical IF wavelengths. The dispersion insensitive bi-directional signal transmission is also proved by comparing measured uplink and downlink signal power using a proposed frequency converter with calculated 60 GHz signal power transmitted in the form of optical double sideband. Finally, 60 GHz bi-

xi
directional RoF links are demonstrated successfully. 5 Msymbol/s QPSK and 16QAM data signals are delivered in the form of optical IF signals bi-directionally, and frequency up- and down-conversion occur at the base station. The system performances are evaluated through the measured error vector magnitudes as functions of SOA input optical IF powers and wavelengths. KEYWORDS: photonic mixer, optical/optoelectronic frequency converter, semiconductor optical amplifier, electroabsorption modulator, photodetector, microwave photonics, radio-on-fiber system, fiber-optic/millimeter-wave data transmission, broadband wireless system

1
1. Introduction
1-1. Why 60 GHz? With the help of wireless technology development, we are using cell
phones anywhere in the world, having wireless LAN services in many
hot spots, and watching television programs in public places through
the digital media broadcasting receivers. Moreover, the prevailing
wireless systems are evolving to the so-called triple play systems
providing voice, data, and video services at the same time. To realize
such systems, high bandwidth efficient modulation techniques or broad
bandwidth systems using high frequency carriers are inevitable. Current
wireless LAN and broadcasting systems using several GHz or sub-GHz
carriers are focusing on increasing bandwidth efficiency. However, the
required data rate for future wireless systems should be beyond gigabits
per second, so that carriers containing enough bandwidth for such
gigabit data transmission are necessary. Under such demands,
millimeter-wave-band systems are being actively investigated, and
especially, 60 GHz systems become the most popular millimeter-wave
systems [1-6].
60 GHz carriers initially have enough bandwidth for gigabit data
transmission, but the more important reason for attracting interests is
that many countries are opening 60 GHz band as a license-free band [1-
4]. Fig. 1-1 shows present status of license-free bands at 60 GHz for
several countries [4]. As shown in the figure, several gigahertz
2
bandwidths are opened at 60 GHz band, which means bandwidth
efficiency is not an important part and how to use such wide bandwidth
becomes more important issues. In addition, 60 GHz signals have other
physical characteristics benefiting to wireless systems.
Max: 500mW/100MHz
ERIP: 43dBmUSA
EIRP: 100mWEurope
Max power: 10mW
EIRP: 57dBmJapan
Max power: 500mW/100MHz
EIRP: 43dBmCanada
Max power: 10mW
EIRP: 51.8dBmAustralia
56 57 58 59 60 61 62 63 64 65 66GHz
59.4 62.9
61.5
Figure 1-1. Status of license-free 60 GHz-bands in several countries.
Because the oxygen-absorption loss of 60 GHz signals is 10-15 dB/km
[7], they can be used for short range communications and indoor
wireless systems requiring less interference among users. Moreover,
such high absorption characteristics can be applied to frequency reuse
in wireless systems having lots of cells [1-3]. The high directivity of 60
GHz signals is another useful characteristic to increase wireless link
gain, to decrease signal interferences, and to mitigate inter-symbol-
interferences caused by multi-path fading [5]. Fig. 1-2 shows the

3
schematic comparison of directivity for some ISM (Industrial,
Scientific, and Medical) band frequency signals, and the notably high
directivity of 60 GHz signals can be observed. Short wavelength of 60
GHz signals compared with other present wireless carriers can be also
useful to design small system components [1-6].
33%
4%1%
4.7°60 GHz
12°24 GHz
117°2.4 GHz
99.9% beamwidth
Frequency
Beamwidth for 1-foot antennas
117°°°°12°°°°
4.7°°°°
Figure 1-2. Directivity comparison among ISM band carrier signals.
The most popular application of 60 GHz is wireless personal area
networks, which are currently under standard discussion at the IEEE
802.15.3c working group [4-5]. Very high data rate beyond 2 Gbit/s is
allowed to this system for high-speed internet access, streaming content
download, real-time streaming, and wireless data bus for cable
replacement. For future broadband indoor wireless LAN systems, 60
GHz is considered as a strong candidate, and Europe is leading the
system development mixing 5 GHz band wireless LAN services with
60 GHz systems supplying higher data rate [3, 5]. The European IST
project BroadWay is suggesting this concept [5]. Free space Gigabit

4
Ethernet services (1.244 Gbit/s) using 60 GHz signals are also
investigated, and applications mixed with free space fiber-optic systems
are being developed [2, 5]. In Japan, 60 GHz technologies for wireless
home network systems, especially, the wireless video Home-Link
system including wireless 1394 applications are examined [5]. Besides
these wireless applications, 60 GHz can be used for high resolution
imaging and sensors, and astronomical observation using very large
arrayed radio telescopes [8-9]. In the Atacama plateau, Chile, tens of
arrayed radio astronomical observatories using 60 GHz are being
established.
Broadband Wireless LAN
Home Network
Wireless Personal Area Network
Broadband Wireless Access
Figure 1-3. Wireless applications using 60 GHz signals.

5
1-2. Radio-on-Fiber Systems for 60 GHz systems 60 GHz is a promising candidate for future broadband wireless
communication systems. However, there are some problems to realize
60 GHz systems in the near future. As stated above, the free-space
propagation loss of 60 GHz is very high, so that a lot of base stations
covering small-sized cells are required to implement systems.
Moreover, high speed millimeter-wave devices based on compound
semiconductors are very expensive and high frequency component
designs and packages are also difficult. Therefore, the deployment cost
of 60 GHz systems will be very high and simple and cost-effective base
station design becomes important. As one solution, Radio-on-Fiber
(RoF) technologies are attracting much attention [9-13].
TransceiverData
Optical Fiber
E/O
ƒƒƒƒRF
Base Station
Central Office
ƒƒƒƒRF
λ
ƒƒƒƒRF
ffff
Mobile Terminal
O/E
downlink
uplinkTransceiverData
Optical Fiber
E/O
ƒƒƒƒRF
Base Station
Central Office
ƒƒƒƒRF
λ
ƒƒƒƒRF
ffff
Mobile Terminal
O/E
downlink
uplink
Figure 1-4. Simple bi-directional RoF system configuration.
Fig. 1-4 shows the schematic of simple bi-directional RoF systems.
In RoF systems, radio signals are optically transmitted between central
and base stations, resulting in low loss transmission of radio signals

6
through optical fibers. Therefore, for 60 GHz signals having high
attenuation characteristics in free-space, RoF system technologies can
extend transmission distance. In addition, direct transmission of radio
signals can help reducing complex and expensive devices and
equipment at many base stations, and controlling many base stations at
one central station. In case of downlink data transmission, radio signals
are generated by only photodetection process at the base station, and
data signals are transmitted to mobile users after simple electrical
amplification. Therefore, very simple base station architectures are
expected. High speed operation of optical components is also very
useful for 60 GHz systems. However, the single-mode fiber
transmission of optically intensity-modulated millimeter-wave signals
like 60 GHz can suffer severe signal fading due to fiber chromatic
dispersion [14-15]. In case of optical intensity modulation, double-
sideband signals are produced and each sideband experiences different
phase shift during fiber transmission, so that destructive interference
occurs between two beat signals at the receiver at certain transmission
points, which causes degradation of generated signal power. Fig. 1-5
schematically shows this phenomenon and the calculated signal
responses for 60 GHz and 1 GHz as a function of transmission distance
are also shown below [15]. When modulation frequency is high,
wavelength separation between two sidebands is wide, resulting in
faster phase shift at short transmission distance. Therefore, the signal
degradation of 60 GHz signals occurs at very short transmission point.

7
On the other hand, for 1 GHz signals, the wavelength difference
between the sidebands is very small, so that dispersion effects are far
less severe.
Dispersion
Optical Rx
MMW Source + Data
Modulator
fmmw
Laser Diode
0 2 4 6 8 10
-60
-50
-40
-30
-20
-10
0
1GHz modulation 60GHz modulation
Re
spo
nse
[d
B]
Distance [km]
Optical fiber
fmmw
fmmw
Figure 1-5. Schematic of dispersion-induced signal fading problems in
intensity modulated millimeter-wave signal transmission.
Various techniques for dispersion-insensitive transmission of
millimeter-wave signals have been proposed using dispersion
compensation techniques [16-17] and remote frequency conversion
techniques [18-19]. In optical communication systems for long-haul,
gigabit data transmission, fiber chromatic dispersion was a limitation of
error-free data transmission. Many kinds of dispersion compensators
have been presented, and some techniques can be applied to RoF
systems. Basic concept is that the unwanted phase difference between

8
two sidebands caused by fiber dispersion is controlled by dispersion
compensators not to occur destructive interferences. Fig. 1-6 shows this
principle. However, the problem is that the dispersion compensation
techniques are sensitive to fiber transmission distances and optical
signal wavelengths, and, as a result, RoF systems need many adaptable
dispersion compensators, making system design difficult. In remote
frequency conversion techniques, intermediate frequency (IF) signals
are optically transmitted between central and base stations, and
frequency up-conversion to and down-conversion from millimeter-
wave-bands occur at each base station. Fig. 1-7 shows the simple
remote frequency conversion systems in the bi-directional RoF link.
Since fiber transmission of low frequency signals in the form of IF is
hardly affected by dispersion as explained before, frequency conversion
at the remote base stations can be a simple solution for the dispersion-
induced signal fading problem. However, expensive millimeter-wave-
band oscillators and mixers are needed for remote frequency
conversion, which makes the base stations complex and expensive.
PD
Optical fiber
Optical MMWSource
fmmw
DispersionCompensator
λλλλ λλλλ λλλλ
ffff
fmmw
fmmw
PDPD
Optical fiber
Optical MMWSource
fmmw
DispersionCompensator
λλλλ λλλλ λλλλ
ffff
fmmw
fmmw
Figure 1-6. Dispersion compensators for optical millimeter-wave signal
transmission without signal penalty.

9
To solve this problem, optical/optoelectronic frequency conversion
techniques can be used [20-27], in which data carried in IF signals are
frequency up- and down-converted at the base stations with the help of
dispersion insensitive optical local oscillator (LO) signals generated at
the central station by optical heterodyne techniques or optical single-
sideband modulation techniques. Consequently, there is no need for
expensive electrical oscillators and mixers at the base stations, allowing
simple and cost-effective base station architecture. Fig. 1-8 shows a
downlink RoF system example using remote frequency up-conversion
scheme based on heterojunction phototransistors (HPTs) [21]. The
optical heterodyne LO signals, which is two correlated optical modes
separated by fLO, are generated at the central station, and transmitted to
the base station combined with optical IF signals having fIF signals.
When these two optical signals are injected into the HPT, fLO and fIF
signals are generated by the HPT photodetection, and fIF signals are
frequency up-converted to the fLO band by the optoelectronic mixing
process of HPT. Therefore, no LO sources are required at the base
station, and photodetection and frequency mixing functions can be
obtained with only one device, HPT, leading to very simple base
stations.
This dissertation focuses on optical/optoelectronic remote
frequency conversion techniques for 60 GHz bi-directional RoF links.
For downlink data transmission, remote optical frequency up-
conversion technique is used, for which cross-gain modulation (XGM)

10
of semiconductor optical amplifier (SOA) is applied. For uplink data
transmission, remote optoelectronic frequency down-conversion
technique is used, for which nonlinearity of electroabsorption
modulator (EAM) is applied. The LO signals are provided from the
central station in the form of optical heterodyne signals.
PD
Central Station
Optical fiber
BaseStation
LD
Amplifier
Mixer
Receiver
Localoscillator
Optical IFSource (λIF)
Data/IF λλλλ
fIF
λλλλ
fIF
PDPD
Central Station
Optical fiber
BaseStation
LDLD
Amplifier
Mixer
Receiver
Localoscillator
Optical IFSource (λIF)
Data/IF λλλλ
fIF
λλλλ
fIF
Figure 1-7. Simple bi-directional RoF link based on remote frequency
conversion technique.
Optical fiber
Optical IFSource
λλλλ
fIF
fIF
fffffLO
OpticalHeterodyne
Source fLO
λλλλ
HPT
Base Station
Optical fiber
Optical IFSource
λλλλ
fIF
fIF
fffffLO
OpticalHeterodyne
Source fLO
λλλλ
HPT
Base Station
Figure 1-8. RoF downlink system configuration based on optoelectronic
frequency up-conversion using HPT.
11
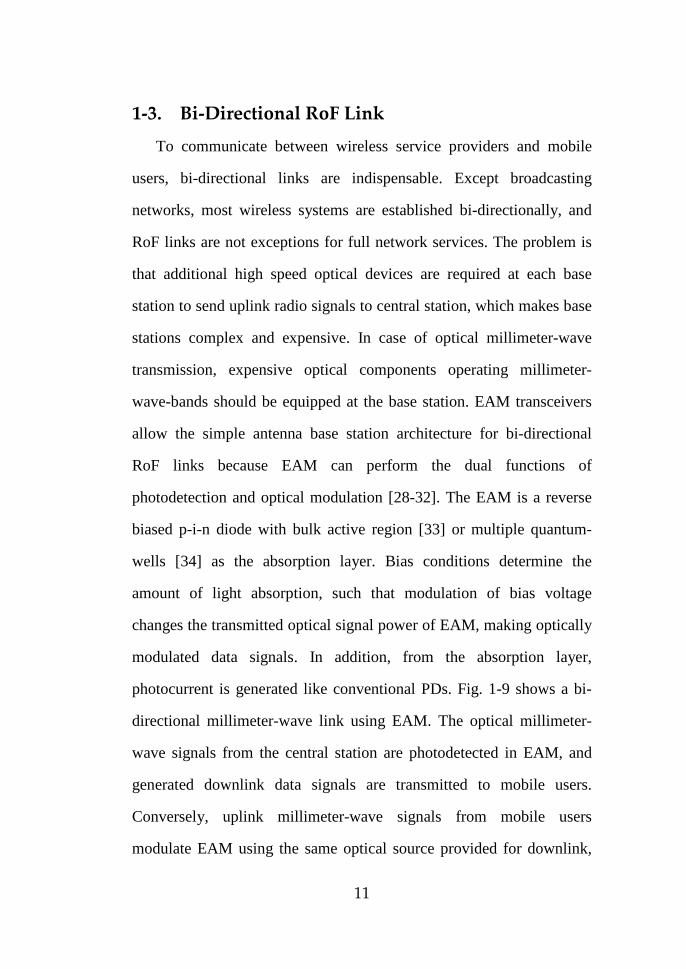
1-3. Bi-Directional RoF Link To communicate between wireless service providers and mobile
users, bi-directional links are indispensable. Except broadcasting
networks, most wireless systems are established bi-directionally, and
RoF links are not exceptions for full network services. The problem is
that additional high speed optical devices are required at each base
station to send uplink radio signals to central station, which makes base
stations complex and expensive. In case of optical millimeter-wave
transmission, expensive optical components operating millimeter-
wave-bands should be equipped at the base station. EAM transceivers
allow the simple antenna base station architecture for bi-directional
RoF links because EAM can perform the dual functions of
photodetection and optical modulation [28-32]. The EAM is a reverse
biased p-i-n diode with bulk active region [33] or multiple quantum-
wells [34] as the absorption layer. Bias conditions determine the
amount of light absorption, such that modulation of bias voltage
changes the transmitted optical signal power of EAM, making optically
modulated data signals. In addition, from the absorption layer,
photocurrent is generated like conventional PDs. Fig. 1-9 shows a bi-
directional millimeter-wave link using EAM. The optical millimeter-
wave signals from the central station are photodetected in EAM, and
generated downlink data signals are transmitted to mobile users.
Conversely, uplink millimeter-wave signals from mobile users
modulate EAM using the same optical source provided for downlink,

12
and optically transmitted uplink signals are photodetected at the central
station. Therefore, a simple bi-directional RoF link can be realized with
only one EAM.
Central Station
Optical fiber
Base Station
Receiver
Optical MMWSource
EAM
fffffmmw
λλλλ
fmmw, 1
λλλλ
ffff
ffff
fmmw, 1
fmmw, 2fmmw, 2Central Station
Optical fiber
Base Station
Receiver
Optical MMWSource
EAM
fffffmmw
λλλλ
fmmw, 1
λλλλ
ffff
ffff
fmmw, 1
fmmw, 2fmmw, 2
Figure 1-9. Bi-directional millimeter-wave RoF link using EAM.
However, as explained in chapter 1-2, direct fiber transmission of
double sideband millimeter-wave signals causes dispersion-induced
signal fading problems, so that by combining optical/optoelectronic
mixing techniques, signal penalty from the fading can be overcome. In
this dissertation, we investigate a 60 GHz photonic frequency converter,
which performs frequency up-conversion and frequency down-
conversion at the remote base station based on a cascaded SOA–EAM
configuration. SOA cross-gain modulation and photodetection in EAM
are used for frequency up-conversion, and EAM nonlinearity is used

13
for frequency down-conversion. Both LO and IF signals for frequency
conversion are optically provided by the central station. Therefore, a
simple base station having only one cascaded SOA-EAM configuration
can be realized. Moreover, since optical LO signals are separated from
optical IF signals, optical LO signals can be shared among several base
stations and wavelength division multiplexing (WDM) techniques can
be applied for accessing different base stations with different IF
wavelengths. Fig. 1-10 shows a bi-directional RoF system architecture
where proposed SOA-EAM frequency converters are to be used.
Optical LO
Optical IFRoF Network
Receiver
SOAEAM
SOAEAM
SOAEAM
λλλλLO
λλλλ1, λλλλ2, …
λλλλ1, λλλλ2, …,λλλλN
λλλλLOLOLOLO,,,, λλλλ1111
λλλλLOLOLOLO,,,, λλλλNNNN
λλλλ1111
λλλλNNNN
λλλλLOLOLOLO,,,, λλλλ2222
λλλλ2222
base station
central station
λλλλLO
,λλλλ1, λλλλ2, …Optical LO
Optical IFRoF Network
Receiver
SOAEAM
SOAEAM
SOAEAM
λλλλLO
λλλλ1, λλλλ2, …
λλλλ1, λλλλ2, …,λλλλN
λλλλLOLOLOLO,,,, λλλλ1111
λλλλLOLOLOLO,,,, λλλλNNNN
λλλλ1111
λλλλNNNN
λλλλLOLOLOLO,,,, λλλλ2222
λλλλ2222
base station
central station
λλλλLO
,λλλλ1, λλλλ2, …
Figure 1-10. Bi-directional RoF systems using remote frequency conversion
based on a cascaded SOA-EAM configuration proposed in this dissertation.

14
1-4. Outline This dissertation will focus on photonic frequency converters based
on SOA and EAM, and their applications to 60 GHz RoF systems.
Each frequency up- and down-conversion scheme will be explained at
first, and then the frequency converter combining two schemes is
proposed. The 60 GHz RoF systems will be also demonstrated for
every frequency conversion technique. Details of dissertation outline
are as follows.
In chapter 2, the optical frequency up-conversion method based on
SOA is introduced at first. Section 2-1 explains the operation principles
of frequency up-conversion, for which basic SOA characteristics are
shown through the simulation model of SOA using a transfer matrix
method, and up-conversion processes are clarified through this SOA
model. The simulation results of the frequency up-converter are shown
in section 2-2. To show the broadband operation properties of the
frequency up-converter, 1.244 Gbit/s downlink RoF data transmission
consequences at 60 GHz band are placed at the end of this chapter.
Next, the optoelectronic frequency down-conversion scheme based
on EAM nonlinearity is described in chapter 3. After explaining the
useful characteristics of EAM for RoF uplink data transmission in
section 3-1, the operation principles of frequency down-conversion are
accounted for in section 3-2. Section 3-3 presents the operation
characteristics of the EAM frequency down-converter based on
measurement results of internal conversion efficiency at 30 GHz band.

15
QPSK uplink RoF data transmission results at 60 GHz band are
followed in section 3-4.
Chapter 4 introduces the frequency up- and down-conversion
technique employing only one cascaded SOA and EAM configuration.
Section 4-1 suggests a bi-directional link architecture using this
frequency converter, and then the operation principles of proposed
frequency up/down-converter are explained in section 4-2. The
conversion efficiency is also defined for this frequency converter in
section 4-3, and then the measurement results of frequency conversion
efficiencies and their characteristics at 60 GHz band are discussed in
detail. The last section shows the bi-directional RoF data transmission
results at 60 GHz band. QPSK and 16QAM data transmission are
demonstrated, and its system performances are analyzed through the
error vector magnitudes.
Finally, chapter 5 summarizes the proposed photonic frequency
conversion techniques, and 60 GHz RoF system demonstration results
using these converters. A brief comment about the practicability of this
frequency converter closes this dissertation.
16
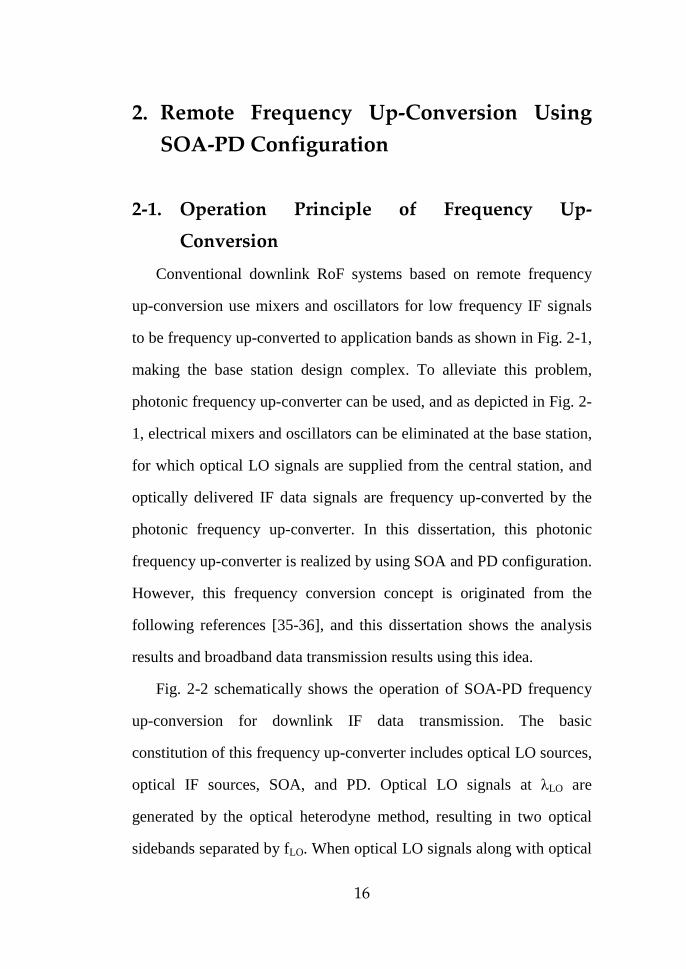
2. Remote Frequency Up-Conversion Using SOA-PD Configuration
2-1. Operation Principle of Frequency Up-Conversion
Conventional downlink RoF systems based on remote frequency
up-conversion use mixers and oscillators for low frequency IF signals
to be frequency up-converted to application bands as shown in Fig. 2-1,
making the base station design complex. To alleviate this problem,
photonic frequency up-converter can be used, and as depicted in Fig. 2-
1, electrical mixers and oscillators can be eliminated at the base station,
for which optical LO signals are supplied from the central station, and
optically delivered IF data signals are frequency up-converted by the
photonic frequency up-converter. In this dissertation, this photonic
frequency up-converter is realized by using SOA and PD configuration.
However, this frequency conversion concept is originated from the
following references [35-36], and this dissertation shows the analysis
results and broadband data transmission results using this idea.
Fig. 2-2 schematically shows the operation of SOA-PD frequency
up-conversion for downlink IF data transmission. The basic
constitution of this frequency up-converter includes optical LO sources,
optical IF sources, SOA, and PD. Optical LO signals at λLO are
generated by the optical heterodyne method, resulting in two optical
sidebands separated by fLO. When optical LO signals along with optical

17
signals at λIF carrying IF signals are injected into SOA, two sidebands
of optical heterodyne LO signals are cross-gain modulated by the IF
data signals at λIF, and frequency up-converted data signals at fLO are
created by the signal beating process in a photodiode. More detailed
explanation will be followed in next sections.
Up-ConversionMixer
Local Oscillator
PhotodetectionPhotonic
FrequencyUp-Converter
Up-ConversionMixer
Local Oscillator
PhotodetectionPhotonic
FrequencyUp-Converter
Figure 2-1. Base station of downlink RoF systems based on remote frequency
up-conversion and photonic frequency up-converter.
PD
ƒƒƒƒLO
λλλλLO
ƒƒƒƒLO
SOA XGMλλλλIF
f
λλλλLO
fIF
Optical IF
Optical LO
Photonic Up-Converter
PD
ƒƒƒƒLO
λλλλLO
ƒƒƒƒLO
SOA XGMλλλλIF
f
λλλλLO
fIF
Optical IF
Optical LO
Photonic Up-Converter
Figure 2-2. Schematic of photonic frequency up-conversion based on SOA-
PD configuration.

18
2-1-1. Optical LO and IF signal generation At first, it is explained how to generate optical LO and IF signals
for this frequency up-conversion as shown in Fig. 2-3. Basically, the
optical LO is generated by the optical heterodyne method [9]. Two
optical modes separated by fRF are given by
))()2cos(( 11 ttwwAE RFo φ++= 2-(1)
))()2cos(( 22 ttwwAE RFo φ+−= 2-(2)
where wo is optical center frequency, and φ1, 2(t) is optical phase.
When these two modes are injected into PD, generated current due to
the square-law beating inside PD are the following:
))()(cos( 212*
21 tttwAIEEI RFDC φφ −++=×∝ 2-(3)
where the signal having frequency sum results is not expressed,
because its frequency is too high to be considered at RF range. As
shown in equation 2-(3), the RF signal having wRF frequency is
generated, and theoretically, any frequency components can be
produced by this optical heterodyne technique. In addition, this beat
frequency signal power is not changed by the chromatic dispersion
effect, which is a very useful characteristic for 60 GHz RoF data
transmission. However, the phase components written as φ1(t) - φ2(t)
are randomly changed, which causes severe phase noise in generated
RF signals [37]. Therefore, phase-correlated two optical modes are
required to eliminate randomly changed phase components, and optical

19
heterodyne signals mean two dominant phase-correlated optical modes
for low-phase noise RF signal generation.
Many researchers have been developed two phase-correlated optical
signal generation techniques [38-41], and one of the easy and popular
methods is a double-sideband with suppressed carrier (DSB-SC)
method using a Mach-Zehnder modulator (MZM) [42-43]. This was
also selected as an optical millimeter-wave generation method at the
RACE project R-2005-MODAL (Microwave Optical Duplex Antenna
Link) [44]. Following is the brief analytical model of DSB-SC method
based on reference [42] and [43]. The output electric field of an MZM
can be described by
⋅=π
πV
tVtEtE m
inout
)(2
cos)()( 2-(4)
where Vm(t) is modulating voltage applied to the modulator and Ein(t) is
the incident optical field. When the frequency of modulating voltage is
wRF, this voltage signal summed with a bias voltage can be written as
)cos()1()( twVVtV RFm ππ αε ++= 2-(5)
The terms ε and α are the bias and modulation levels applied to the
modulator normalized to Vπ. The output field from the modulator for
Vm(t) is given by
[ ]
++= )cos()cos()1(2
cos)( 0twtwtE RFout αεπ 2-(6)

20
where the optical frequency is w0. Equation 2-(6) can be expanded with
Bessel functions, and the resulting spectral components can be written
as
( )
( )
( )
( ) L+±
+
+
±
+
−
±
+
−
+
=
)3cos(12
sin2
)2cos(12
cos2
)cos(12
sin2
)cos(12
cos22
1)(
03
02
01
00
twtwJ
twtwJ
twtwJ
twJtE
RF
RF
RF
out
εππα
εππα
εππα
εππα
2-(7)
where Ji is the ith Bessel function of the first kind. If the modulator is
biased at Vπ (ε=0), then the component at w0 will be suppressed as are
all even terms. Two dominant components separated by 2wRF are
produced, and these are completely phase-correlated, so that very low
phase noise signals can be generated after square-law beating process
of photodetection. Although, other spectral components are also
generated by signal beating, they can be eliminated by electrical
filtering after photodetection. As a result, Fig. 2-3 shows that if an
MZM is modulated by half of target LO frequency (fLO/2) signals, fLO
separated two optical modes can be obtained, and these are the optical
heterodyne LO signals for photonic frequency converters. Although the
DSB-SC technique has stability problems due to the voltage drift in
MZM, the control circuits to adjust MZM bias voltages in voltage
supply units can solve this problem, and commercial products are

21
already released for this purpose. In this dissertation, all the optical
heterodyne signals are generated by the DSB-SC technique.
For optical IF signals, all kinds of optical modulation techniques
can be used, however, the bandwidth of optical components should be
large enough not to distort IF data signals. Fig. 2-3 shows direct laser
modulation of IF data signals for optical IF.
LaserDiode
PC
MZM
Bias (V)
time
MZ
M O
pti
cal
Tra
nsm
itta
nce
fLO/2 fLO
λλλλ
Optical LO Source using DSB-SC
LaserDiode
ƒƒƒƒIFOptical IF Source
λλλλ
fIF
ƒƒƒƒLO/2
LaserDiode
PC
MZM
Bias (V)
time
MZ
M O
pti
cal
Tra
nsm
itta
nce
fLO/2 fLO
λλλλ
Optical LO Source using DSB-SC
LaserDiode
ƒƒƒƒIFOptical IF Source
λλλλ
fIF
ƒƒƒƒLO/2
Figure 2-3. Optical LO generation using DSB-SC method, and optical IF
generation using direct laser diode modulation.

22
2-1-2. Cross-gain modulation (XGM) of SOA
Next, SOA XGM for IF signal modulation to optical LO signals is
explained. In this frequency up-converter, SOA is operating as a remote
signal modulator using XGM. However, SOA in itself is an optical
signal amplifier, and to explain XGM process, the simple principle of
optical amplification is necessary [45-46]. Fig. 2-4 shows the
stimulated processes in a two level system. In an SOA, electrons are
injected from an external current source into the active region of
semiconductors. These make carriers occupy energy states in the
conduction band of the active region material, leaving holes in the
valence band. When a photon having energy larger than energy gap, its
energy stimulates electrons to be moved to conduction band and photon
energy disappears, which is called stimulated absorption. However, a
photon having suitable energy is incident on the semiconductor, it can
cause stimulated recombination of a conduction band carrier with a
valence band hole. The recombining carrier loses its energy in the form
of a photon. This new stimulated photon is perfectly coherent with the
inducing photon, which means identical phase and frequency with the
incident photon. This process is called stimulated emission, and while
these photons are inside semiconductor materials, they can give rise to
more stimulated emission, which is an optical gain process. However,
these two processes occur statistically, so that external management to
increase the probability of stimulated emission is needed to obtain
optical gain. If the injected current is sufficiently high then a population

23
inversion is created when the carrier population in the conduction band
exceeds that in the valence band. In this case the stimulated emission
becomes statistically dominant process, so that optical gain appears in
the semiconductors.
E2
E1
Energy Gap
Hole Electron
StimulatedEmission
StimulatedAbsorption
photoninducing photon
stimulated photon
E2
E1
Energy Gap
Hole Electron
StimulatedEmission
StimulatedAbsorption
photoninducing photon
stimulated photon
Figure 2-4. Stimulated processes in a two level system.
In SOA, optical gain and saturation input optical power are basic
performance parameters. When an optical signal is injected into SOA,
its amplitude is amplified as much as SOA gain, however, if the input
signal power is beyond saturation power condition, the signal gain is
reduced due to limited carriers inside SOA, which is called gain
saturation, and the input power condition occurring gain saturation is
called saturation input optical power. The XGM process uses this gain
saturation phenomenon [47-48]. In principle, when two different
24
optical signals, one of which has higher optical power than saturation
input optical power, are injected into SOA, a higher power optical
signal acquires more optical gain than a lower power optical signal.
Therefore, output signal power of one optical signal can be controlled
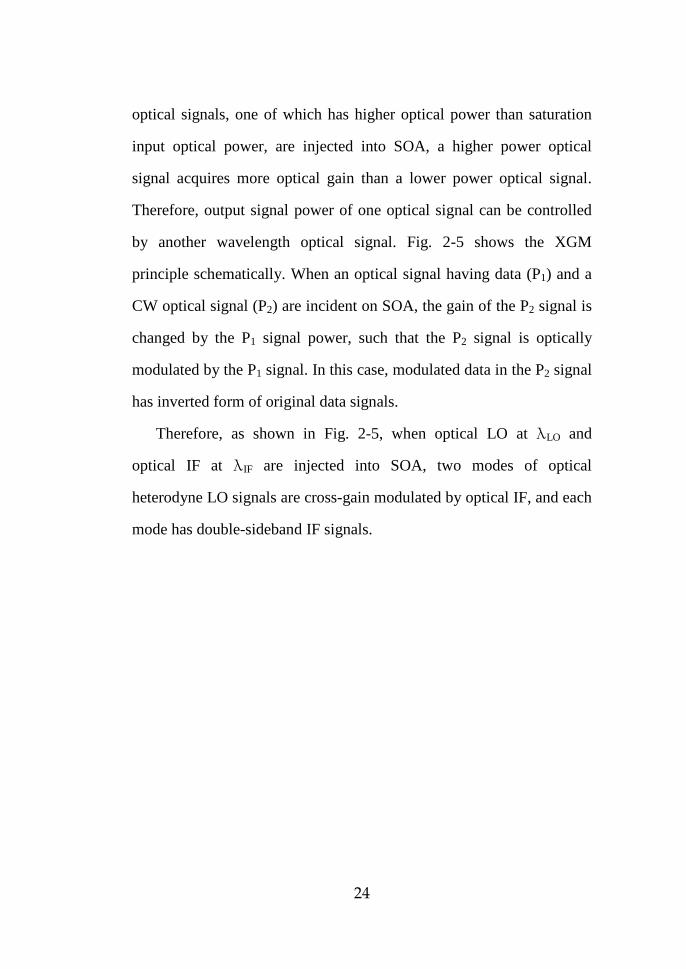
by another wavelength optical signal. Fig. 2-5 shows the XGM
principle schematically. When an optical signal having data (P1) and a
CW optical signal (P2) are incident on SOA, the gain of the P2 signal is
changed by the P1 signal power, such that the P2 signal is optically
modulated by the P1 signal. In this case, modulated data in the P2 signal
has inverted form of original data signals.
Therefore, as shown in Fig. 2-5, when optical LO at λLO and
optical IF at λIF are injected into SOA, two modes of optical
heterodyne LO signals are cross-gain modulated by optical IF, and each
mode has double-sideband IF signals.

25
λλλλLO
ƒƒƒƒLO
SOA XGM
λλλλIF
λλλλLO
Optical LO
Optical IF
P1
P2
t
P1, Input
P2,
Gai
n
t
SOA Gain
t
P2
XGM Principle
fIF
λλλλLO
ƒƒƒƒLO
SOA XGM
λλλλIF
λλλλLO
Optical LO
Optical IF
P1
P2
t
P1, Input
P2,
Gai
n
t
SOA Gain
t
P2
XGM Principle
fIF
Figure 2-5. Process of optical IF signal modulation in optical LO signals by
SOA XGM. Below is a simple operation principle of XGM.
26
2-1-3. Frequency up-conversion at a PD
In chapter 2-1-1, it is explained how to generate optical heterodyne
LO and optical IF signals, and in chapter 2-1-2, it is described what is
XGM and how the optical IF signals modulate optical LO signals by
SOA XGM. Finally, a brief signal beating process in a PD will be
shown, which is a final process to accomplish frequency up-conversion.
A PD is a device to convert optical signals into electrical current
signals, which is modeled with following equation:
*EERPRI opticalPD ×⋅=⋅= 2-(8)
where R is responsivity of PD that explains signal loss due to optical
signal scattering, reflection, and so on, Poptical is incident optical power,
and E is the electrical field of optical signals. Therefore, it means that
produced current is a result of square-law beating with incident electric
fields. RF signal generation using optical heterodyne methods also uses
this characteristic as explained in section 2-1-1. Frequency up-
converted signals can be obtained by this signal beating process in PD
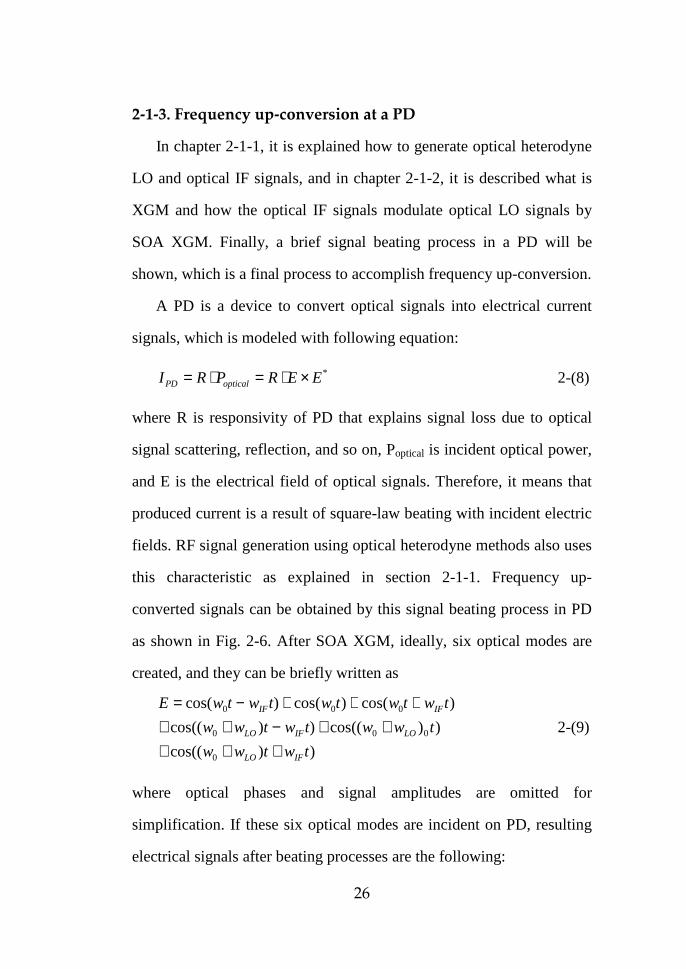
as shown in Fig. 2-6. After SOA XGM, ideally, six optical modes are
created, and they can be briefly written as
))cos((
))cos(())cos((
)cos()cos()cos(
0
000
000
twtww
twwtwtww
twtwtwtwtwE
IFLO
LOIFLO
IFIF
+++++−++
+++−= 2-(9)
where optical phases and signal amplitudes are omitted for
simplification. If these six optical modes are incident on PD, resulting
electrical signals after beating processes are the following:

27
))cos(()cos())cos(( twwtwtwwI IFLOLOIFLO −++−= 2-(10)
where other signal products are eliminated, because they are far from
the LO frequency band. Therefore it shows that low frequency IF
signals are frequency up-converted to LO frequency band. In this
frequency up-conversion process, XGM can cause phase modulation in
SOA. However, this phase modulation does not affect the system
performance, and also the short optical transmission length between
SOA and PD can not change optical phases of LO signals enough to
affect frequency up-conversion. If SOA and PD are monolithically
integrated, the phase variation of optical LO is completely disappeared.
λλλλLO
Optical LO
Optical IF
SOA PD
(1) (2) (3) (4) (5) (6)
ƒƒƒƒLO
f(2)-(4)(3)-(5)
(1)-(5)(2)-(6)
ƒƒƒƒLO
Beating Process in PD
λλλλLO
Optical LO
Optical IF
SOA PD
(1) (2) (3) (4) (5) (6)
ƒƒƒƒLO
f(2)-(4)(3)-(5)
(1)-(5)(2)-(6)
ƒƒƒƒLO
Beating Process in PD
Figure 2-6. Frequency up-conversion by the signal beating process in PD.
This frequency up-converter is at first designed to make base
stations simple and cost-effective, however there are many other
advantages. Because this frequency up-converter uses optical

28
amplifiers, conversion efficiency is very high. In addition, SOA offers
optical gain in wide wavelength range, where XGM can occur, so that
the operation wavelength range is wide. This characteristic is very
useful to adopt wavelength division multiplexing (WDM) technologies
in this remote up-conversion system. Another advantage is that optical
heterodyne LO signals having any frequency separation can be used,
which makes frequency up-converters insensitive to LO frequency.
Therefore, it can operate at any millimeter-wave and sub-millimeter-
wave bands. However, for IF bandwidth, because the speed of SOA
XGM is limited by carrier recombination time, IF signal frequency is
restricted within several GHz, which is nonetheless enough to transmit
broadband data signals [45-48]. The details of these frequency up-
converter characteristics are well explained in reference [35] and [36].
The nonlinearity of SOA-PD frequency up-converter is also
investigated in reference [49], where spurious-free dynamic range of
around 77 dB/Hz2/3 is obtained experimentally. Therefore, in this
dissertation brief characteristics of the SOA-PD frequency up-converter
will be shown in next chapters.

29
2-1-4. Frequency up-conversion experiment In this chapter, this frequency up-conversion is experimentally
verified at 25 GHz band. Fig. 2-7 shows the experimental setup for this
measurement. For 25 GHz optical LO signals, 12.5 GHz RF signals
modulate an MZM biased at minimum transmission conditions for
DSB-SC method. An erbium-doped fiber amplifier (EDFA) was used
to boost optical LO power. The optical LO wavelength was 1535.4 nm,
and the optical power before SOA was -13 dBm. For optical IF signals,
1 GHz signals modulated another MZM biased at voltage conditions
for maximum modulation efficiency. The optical IF wavelength and
power before SOA was 1546.18 nm, and -11 dBm, respectively.
LD
PC
MZM
12.5GHz
LD
PC
MZM
1GHz
EDFA
SOA
PD
1553.4nm
1546.18nmRF-SA
LD
PC
MZM
12.5GHz
LD
PC
MZM
1GHz
EDFA
SOA
PD
1553.4nm
1546.18nmRF-SA
Figure 2-7. Experimental setup to verify optical frequency up-conversion at
25 GHz band. LD : Laser Diode, RF-SA : RF-Spectrum Analyzer, PC :
Polarization Controller
30
When these optical signals were combined and injected into SOA,
two modes of optical LO signals were cross-gain modulated by 1 GHz
IF signals. After photodetection of optical LO signals, 1 GHz IF signals
were frequency up-converted to 25 GHz band. Fig. 2-8(a) shows the RF
spectrum measured before SOA, which means no frequency up-
conversion occurs, and Fig. 2-8(b) shows the RF spectrum measured
after SOA. For these measurement, the same broadband 25 GHz PD
was used. As shown in Fig. 2-8(b), 1 GHz IF signals are successfully
frequency up-converted to upper sideband (26 GHz), and lower
sideband (24 GHz). Moreover, frequency up-converted signals have
larger RF power by about 10 dB compared to 1 GHz IF signal power
measured before SOA. This implies that the up-converted IF signal in
SOA can have conversion gain because the SOA gain directly
contributes to up-conversion process. It should be noted, however, that
the noise level increases due to SOA amplified spontaneous emission
noise. Therefore, for better system performance, SOA noise should be
reduced of filtered out.

31
5 10 15 20 25
-80
-60
-40
-20
0
LOIFR
F-P
ow
er (
dB
m)
Frequency (GHz)
(a)
24 25 26
-80
-60
-40
-20
0
LSB USB
LO
RF
-Po
wer
(d
Bm
)
Frequency (GHz)
(b)
Figure 2-8. RF Spectrum measured before SOA (a), and after SOA (b).

32
2-2. Simulation of Frequency Up-Conversion Using a Transfer Matrix Method
In chapter 2-1, the operation principles of SOA-PD frequency up-
converter are introduced, and its operation is verified with simple
frequency up-conversion experiment. In this chapter, the basic
operation characteristics will be explained through frequency up-
conversion simulation. This frequency up-converter uses SOA XGM
and square-law beating in PD, however, the important process is SOA
XGM. Therefore, to make a simulation model of SOA-PD frequency
up-converter, SOA XGM modeling places at the most important part.
In order to have high optical gain of SOA, the length of SOA is
generally designed long, so that the gain dynamics inside SOA
becomes very complex [45-46]. When optical field propagates inside
SOA, carrier distribution change occurs at different location of SOA,
resulting in optical gain variation inside SOA. To model this
phenomenon, time-dependent transfer matrix method (TMM) can be
used [46, 50-52]. The SOA is divided into many small SOA units
having no longitudinal carrier change, and the amplitude and phase
variation of optical fields at each SOA unit are calculated until the
input optical fields arrive at final SOA unit. The amplitude and phase
variation are determined by a signal propagation equation and a rate
equation at each SOA section. Based on this method, the basic SOA
characteristics will be shown at first, and then the frequency up-
conversion process will be simulated and analyzed at 60 GHz band.

33
• • • • • •Input SignalInput SignalInput SignalInput SignalEEEEinininin
at at at at λλλλinininin
Output SignalOutput SignalOutput SignalOutput Signal
• • • • • •
LLLL
RRRR RRRR
AAAA1, I1, I1, I1, I----1111(t)(t)(t)(t) AAAA1, I1, I1, I1, I
(t)(t)(t)(t) AAAA1, I+11, I+11, I+11, I+1(t)(t)(t)(t)
BBBB1, I1, I1, I1, I----1111(t)(t)(t)(t) BBBB1, I1, I1, I1, I
(t)(t)(t)(t) BBBB1, I+11, I+11, I+11, I+1(t)(t)(t)(t)
NNNNiiii----1111, , , , ααααIIII----1111
nnnniiii----1, 1, 1, 1, ggggm,Im,Im,Im,I----1111
NNNNiiii, , , , ααααiiii
nnnni, i, i, i, ggggm,im,im,im,i
NNNNi+1i+1i+1i+1, , , , ααααI+1I+1I+1I+1
nnnni+1, i+1, i+1, i+1, ggggm,I+1m,I+1m,I+1m,I+1
Figure 2-9. Schematic of SOA model based on time-dependent TMM.
2-2-1. SOA Modeling using TMM
Fig. 2-9 shows the schematic of SOA simulation model presented in
reference [50]. The SOA has length L and reflectivity R at each end
side, and is divided into N small SOAs. Input optical field, Ein at λin is
incident on one facet of SOA, and its field variation at each SOA
section is calculated using a signal propagation equation and a rate
equation. Because the longitudinal variation of carriers causes the
change of refractive index, reflected field appears n SOA, and its
effects should be considered. Therefore, the optical field is divided into
propagating one (Ai) and reflecting one (Bi) at each SOA section. For
this calculation, number of carrier N, refractive index n, gain g, chirp
parameter α should be determined in every small SOA unit. They are
the basic parameters of the SOA model. For simplicity of explanation,
the calculation process at one small SOA unit is shown at first [46]. Fig.
2-10(a) shows the field model of unit SOA, where field propagation
constant is γ, and Fig. 2-10(b) shows the field propagation and

34
reflection model according to refractive index variation (n1 and n2) at
unit SOA facet. Fig. 2-10(a) is modeled as following matrix form:
=
−0,
0,
,
.
0
0
B
A
L
L
LB
LA
E
E
e
eE
Eγ
γ
2-(11)
where output fields at Z=L can be obtained by multiplying the
propagation matrix by input field matrix at Z=0. The matrix model of
Fig 2-10(b) is the following:
+−
−+
=
1
1
2
2
,
,
2
12
2
12
2
12
2
12
,
,
22
22
nB
nA
nB
nA
E
E
n
nn
n
nnn
nn
n
nn
E
E 2-(12)
The propagation index and reflective index of the optical field is
determined by the refractive index change, and the resulting field
variation is calculated. As a result, when optical field propagates from
i th SOA unit to (i+1)th SOA unit as shown in Fig. 2-9, resulting matrix
equation can be written as
∆+
=
∆+
+
+
)(
)(
)()(
)()(
)(
)(
2221
1211
1
1
ttB
tA
tata
tata
tB
ttA
i
i
i
i 2-(13)
where matrix elements aij(t) are the multiplication results of 2-(11) and
2-(12). The problem is that the initial condition of reflecting field
components (Bi) is determined by the input optical field from opposite
side of propagation field (Ai). Therefore the equation 2-(13) should be
modified into the following matrix:

35
−
−=
∆+∆+
+
+
)(
)(
)(
1
)(
)()(
)(
)(
)()()(
)(
)(
1,
,
2222
21
22
12
22
211211
,
1,
tB
tA
tata
tata
ta
ta
tatata
ttB
ttA
iw
iw
iw
iw 2-(14)
Z=0Z=0Z=0Z=0 Z=LZ=LZ=LZ=L
Homogeneous WaveguideHomogeneous WaveguideHomogeneous WaveguideHomogeneous Waveguide
Propagation Constant Propagation Constant Propagation Constant Propagation Constant γγγγnnnn1111 nnnn
2222
EEEEAAAA
EEEEAAAA
EEEEBBBB
EEEEBBBB
EEEEAAAA
EEEEAAAA
EEEEBBBB
EEEEBBBB
Z=0Z=0Z=0Z=0 Z=LZ=LZ=LZ=L
Homogeneous WaveguideHomogeneous WaveguideHomogeneous WaveguideHomogeneous Waveguide
Propagation Constant Propagation Constant Propagation Constant Propagation Constant γγγγnnnn1111 nnnn
2222
EEEEAAAA
EEEEAAAA
EEEEBBBB
EEEEBBBB
EEEEAAAA
EEEEAAAA
EEEEBBBB
EEEEBBBB
(a) (b)
Figure 2-10. (a) Field model in unit SOA, (b) Field propagation and reflection
model in different refractive index layers.
To obtain matrix elements in 2-(14), propagation constant γ should be
calculated at first from the following signal propagation equation:
),(),(2
1),(
2
),(1),(tztzgAtzAg
i
t
tzA
vz
tzAm
g
µα ++Γ−=∂
∂+∂
∂ 2-(15)
A(z, t) is the normalized signal envelope such that |A(z, t)|2 represents
the optical power, and α is chirp parameter which accounts for carrier-
induced index changes. vg is group velocity, Γ is confinement factor of
SOA, gm is material gain, and g is net gain [53-54]. The amplified
spontaneous emission noise is represented by two statistically
independent Gaussian distributed random processes for µ(z, t) that
satisfy the following correlation:
)()()(),(),( ''*''crossgSP EAvzzttRtztz ×−−Γ=⋅ δδβµµ 2-(16)

36
where β is a spontaneous emission coupling factor, RSP is a
spontaneous emission rate assuming bimolecular recombination, δ(x) is
defined as δ function, E is photon energy, and Across is cross-sectional
area of the active layer. This noise is treated as an additive noise, and
the carrier distribution change determines noise amount. However, for
simplicity only average noise is added in this dissertation. Equation 2-
(17) shows the derived γ expression from equation 2-(15).
c
nwig
ig m +Γ−= αγ
221
2-(17)
The parameter values in 2-(17) are mainly determined by the carrier
density in each SOA unit, which is calculated by the carrier rate
equation in SOA written as
iimgiiinri SgvCNBNNA
qV
I
t
N,
32 )( Γ−++−=∂
∂ 2-(18)
where N represents carrier density, S is photon density, the index i
corresponds to different sections of SOA, I is injection current, V is
active volume, q is electronic charge, and Anr, B, C are related to
recombination constants. The average photon density is represented as
following equation:
crossg
iiiii Ahfv
BBAAS
2
2
1
22
1
2
++ +++= 2-(19)
where h is plank constant, f is optical frequency, A i is propagation
wave amplitude, and Bi is reflected wave amplitude.

37
In order to model the asymmetric gain profile in wavelength
domain, the gain spectrum is assumed to be cubic and the material gain
is approximated by [55]
i
ppiim S
aaNNaNg
ελλλλ
λ+
−+−−−=
1
)()()(),(
33
2100 2-(20)
where a0, a1, and a3 represent gain constant, ε is gain compression
factor, and λp is gain peak wavelength, which is given as
)( 020 NNap −−= λλ 2-(21)
where λ0 represents wavelength at transparency, a2 is gain constant,
and N0 is carrier density at transparency. The net gain is given by [56]
as
scatcamii gg ααα −Γ−−−Γ= )1()( 2-(22)
where αa, αc and αc are active layer loss, cladding layer loss, and
scattering loss, respectively. The α parameter can be obtained by
differentiating equation 2-(20) and refractive index with carrier density,
resulting in the following equation:
dNdg
dNdnN wii λ
πλα 4),(
−= 2-(23)
All the parameters depending on carrier density are calculated at every
SOA section, and the parameter γ is determined by the obtained
parameters.

38
Finally, the refractive index changes should be calculated to
complete matrix elements. The refractive index at each SOA unit has
dependence on carrier density, which can be written as
w
cgnn mgi 2
Γ−= α 2-(24)
where ng is group refractive index, w is angular frequency of optical
signals.
To simulate SOA with these equations, the simulation time step
should be considered carefully not to make the same time-varying
optical signals to be calculated twice at the same SOA section. This
time step is calculated based on the length of unit SOA and the group
velocity of input optical signals.

39
2-2-2. Simulation results of SOA gain characteristics
In this chapter, the SOA gain characteristics are simulated by SOA
model explained in section 2-2-1. In fact, the simulation model
described in section 2-2-1 is suitable for large signal analysis, and other
simple SOA models can be used for static characteristics, however, this
model is also good enough to show SOA gain characteristics. The
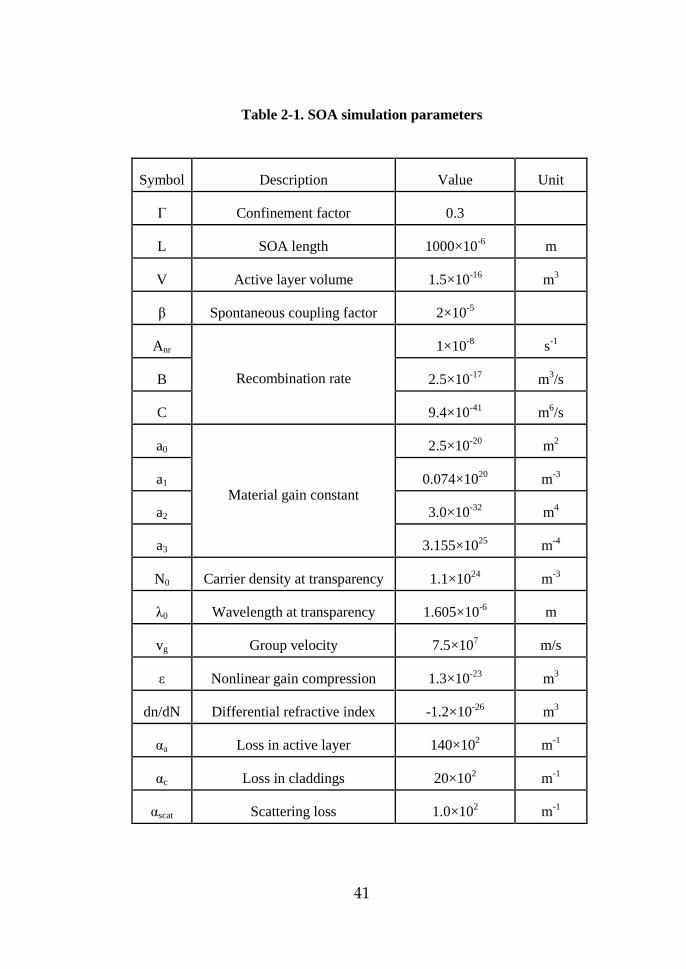
simulation parameters of SOA are selected from reference [50], and
shown in table 2-1. The input optical signal is assumed to be a CW, and
the wavelength is 1530 nm.
Firstly, SOA gain was simulated as a function of output optical
powers with different SOA injection currents from 50 mA to 200 mA.
Because the optical amplification occurs due to stimulated emission,
limited carriers inside SOA cause SOA gain saturation. As shown in
Fig. 2-11, gain starts to saturate rapidly after saturation point. SOA
output power at the 3 dB gain saturation condition is an important
parameter of SOA to represent its output limit not having signal
distortion. As SOA injection current increases, SOA gain increases due
to the increase of carriers inside SOA [45-46]. However, it should be
noted that SOA gain does not increase linearly with SOA injection
current because of carrier saturation to lasing condition.
Next, the dependence of SOA gain on bias current in SOA was
simulated. For this, SOA input optical power was assumed to be -40
dBm, at which condition input optical power does not affect gain
saturation. Fig. 2-12 shows the SOA gain as a function of SOA current.
40
As explained above, the SOA gain does not increase linearly with high
SOA injection current, and saturates to about 32 dB. When the injection
current approaches to the threshold current condition, where SOA can
operate as a laser, the carrier density in SOA converges to a certain
level. Therefore SOA gain saturates to certain level [45].
Finally, SOA gain characteristics according to input optical signal
wavelengths were simulated. The input optical power was also selected
to -40 dBm not to affect optical gain. The SOA bias current was varied
from 50 mA to 200 mA. Fig. 2-13(a) shows the calculated material gain,
which is expressed in equation 2-(20). The material gain increases with
SOA injection current, which also shifts peak value to shorter
wavelength [50]. The peak gain wavelength condition has a
dependence on carrier density, so that injection current shifts gain peak.
As injection current increases, the carrier density in SOA increases,
which makes gain peak shifted to shorter wavelength conditions. The
SOA gain spectrum in wavelength domain is similar to the shape of
material gain as shown in Fig. 2-13(b), because material gain
parameters are the dominant factor of SOA gain. Therefore, SOA gain
shows similar characteristics of material gain, and the SOA gain peak is
shifted to shorter wavelengths with the increase of SOA bias current
[45-46].
41
Table 2-1. SOA simulation parameters
Symbol Description Value Unit
Γ Confinement factor 0.3
L SOA length 1000×10-6 m
V Active layer volume 1.5×10⁻¹⁶ m3
β Spontaneous coupling factor 2×10⁻⁵
Anr 1×10⁻⁸ s-1
B 2.5×10⁻¹⁷ m3/s
C
Recombination rate
9.4×10-41 m6/s
a0 2.5×10⁻²⁰ m2
a1 0.074×10²⁰ m-3
a2 3.0×10⁻³² m4
a3
Material gain constant
3.155×1025 m-4
N0 Carrier density at transparency 1.1×1024 m-3
λ0 Wavelength at transparency 1.605×10⁻⁶ m
vg Group velocity 7.5×10⁷ m/s
ε Nonlinear gain compression 1.3×10⁻²³ m3
dn/dN Differential refractive index -1.2×10⁻²⁶ m3
αa Loss in active layer 140×102 m-1
αc Loss in claddings 20×102 m-1
αscat Scattering loss 1.0×10² m-1

42
-30 -25 -20 -15 -10 -5 0 5 10 15 206
9
12
15
18
21
24
27
30
Current 50 mA 100 mA 150 mA 200 mA
Opt
ical
Gai
n (d
B)
Output Opitcal Power (dBm)
Figure 2-11. Optical gain of SOA as a function of output optical power with
different SOA injection currents.
0 50 100 150 200 250 300 350
5
10
15
20
25
30
35
Optical Gain
Opt
ical
Gai
n (d
B)
Injection Current (mA)
Figure 2-12. Optical gain of SOA as a function of SOA injection current.

43
1.40 1.44 1.48 1.52 1.56 1.60-2.0x10⁵
-1.6x10⁵
-1.2x10⁵
-8.0x10⁴
-4.0x10⁴
0.0
4.0x10⁴
8.0x10⁴
1.2x10⁵
50mA 100mA 150mA 200mA
Mat
eria
l Gai
n (m
-1)
Wavelength (nm)
(a)
1.40 1.45 1.50 1.55 1.60-50
-40
-30
-20
-10
0
10
20
30
40
50
50mA 100mA 150mA 200mAO
ptic
al G
ain
(dB
)
Wavelength (nm)
(b)
Figure 2-13. Material gain of SOA (a) and optical gain of SOA (b) as a
function of input signal wavelength with different SOA injection currents.

44
2-2-3. Simulation results of frequency up-conversion
In this chapter, frequency up-conversion simulation is performed
based on the TMM. Because the TMM is suitable for dynamic large
signal modeling of SOA, it can well explain the frequency up-
conversion process, which uses SOA gain dynamics inside SOA. The
characteristics of the SOA-PD frequency up-converter will be
presented with frequency up-conversion efficiency calculation. Fig. 2-
14 shows the schematic of frequency up-conversion efficiency, which
is the electrical power ratio of frequency up-converted USB signals to
IF signals calculated before SOA. Equation 2-(25) represents the
efficiency definition:
=SOAbeforepowersignalIF
SOAafterpowersignalUSBEfficiency log10 2-(25)
1GHz
IF before SOA
LSB after SOAconversion efficiency
59GHz 61GHz1GHz
IF before SOA
LSB after SOAconversion efficiency
59GHz 61GHz
Figure 2-14. Schematic of frequency up-conversion efficiency.
For simulation conditions, the wavelength of optical heterodyne LO
signals was assumed to be 1550 nm, and the mode separation was 60
45
GHz. For optical IF, 1535 nm wavelength, and 1 GHz IF was selected.
These input optical signals can be given as
tjwtjtjLOLO
LOLOLO eeepztE −ΩΩ− +== )(2/)0,( 2/2/ 2-(26)
tjwIFIFIF
IFetmpztE −⋅Ω+== )sin1()0,( 2-(27)
where PLO and PIF are the average optical power of optical LO and
optical IF, respectively, wLO, IF represents optical angular frequency, m
is modulation index. In addition, ΩLO, IF means angular frequency of
modulating LO and IF signals. For this simulation, ΩLO was 2π*30
GHz, and ΩIF was 2π*1 GHz.
These two signals were input signals to SOA, and IF modulated
optical LO signals were obtained after the TMM simulation. After
square-law beating calculation of PD, resulting signals were converted
to frequency domain by fast Fourier transform. For photodetection
simulation, it was assumed that PD has responsivity 1, and the output
impedance was 50 Ω. No speed limit of PD was also assumed for this
simulation. From this process, the power of IF signals before SOA and
frequency up-converted signals can be obtained, and the conversion
efficiency is calculated through equation 2-(25).
At first, the dependence of conversion efficiency on input optical
LO signal power was calculated at different SOA bias currents of 100
mA and 150 mA. As shown in Fig. 2-15, the conversion efficiency
increases with input optical LO power. Because frequency up-

46
conversion occurs due to signal beating between optical LO modes and
cross-gain modulated IF signals, the increase of optical LO power can
increase beating power, resulting in the increase of conversion
efficiency. However, conversion efficiency is saturated at high LO
power conditions [36]. As explained in section 2-2-2, high input optical
power saturates SOA gain, so that optical gain saturation caused by
high LO power decreases conversion efficiency. In this condition,
XGM efficiency is also reduced, which can decrease conversion
efficiency, too.
Because, XGM efficiency has dependence on input optical signal
wavelengths, frequency conversion efficiency varies with different
input optical IF wavelengths. To analyze this, conversion efficiency
change at different optical IF wavelength conditions is calculated. SOA
bias current was fixed at 200 mA, and the wavelength and the power of
optical LO were 1550 nm and -5 dBm, respectively. The power of
optical IF was -17 dBm. Fig. 2-16 shows calculated results. The
conversion efficiency is higher at around SOA gain peak wavelength
condition. Because optical gain affects conversion efficiency, high
conversion efficiency can be obtained around optical gain peak.
However, when the SOA is saturated by high power optical input, the
gain peak is shifted to longer wavelength due to carrier depletion in
SOA [36]. Therefore, the wavelength condition of maximum frequency
up-conversion efficiency is a little longer than peak gain wavelength.
All these simulation results show the same characteristics presented in

47
reference [35] and [36], where the conversion efficiency was measured
experimentally.
-20 -15 -10 -5 0 5
-30
-25
-20
-15
-10
-5
0
5
10
SOA current 100 mA 150 mA
Eff
icie
ncy
(dB
)
LO power (dBm)
Figure 2-15. Frequency up-conversion efficiency as a function of SOA input
optical LO powers.
-40 -20 0 20 40-4
-2
0
2
4
6
8
Eff
icie
ncy
(dB
)
∆λ∆λ∆λ∆λ (= λλλλ IF - λλλλ LO) (nm)
20
24
28
32
36
40S
OA
Gai
n (d
B)
Figure 2-16. Frequency up-conversion efficiency and SOA gain as a function
of input optical IF wavelengths.

48
2-3. Gigabit Data Transmission using SOA-PD Frequency Up-Converter at 60 GHz band
60 GHz wireless systems are attracting research interests for future
broadband multimedia services, wireless interconnection of backbone
networks, and wireless LAN and personal area network services [1-6].
The reason is that high directivity and high oxygen absorption loss of
60 GHz signals are useful for these system applications. In addition, the
license-free, wide bandwidth covering several GHz in 60 GHz band is
very attractive. Therefore, bandwidth efficiency technologies in 60
GHz are not as important as several GHz-band wireless systems. In
case of WPAN being discussed in IEEE 802.15.3c working group,
more than 2 Gbit/s data transmission is considered. However, the
implementation cost of 60 GHz systems is still very high, and RoF
technology can alleviate this problem as explained before. There are
many techniques to realize low cost RoF systems, and recently,
transmission of gigabit data using RoF systems have been reported [57-
58]. Optical remote up-conversion method using SOA-PD
configuration is also very attractive for its simplicity, high conversion
efficiency, LO frequency insensitivity, and so on, and its operation has
enough bandwidth for gigabit data transmission [35-36].
In this chapter, measurement results of the SOA cross-gain
modulation bandwidth are presented to validate the wide-bandwidth
mixing operation and 1.244 Gbit/s ASK data transmission at 63 GHz is
demonstrated experimentally. For frequency up-conversion experiment,

49
63 GHz optical heterodyne LO signals and 1.244 Gbit/s optical
baseband signals are used. The dependence of bit-error rates (BERs) on
optical baseband signal power in a wide wavelength range is
investigated. The influence of optical LO power is also analyzed.
2-3-1. Measurement of SOA XGM frequency response
In this frequency up-conversion scheme, the SOA cross-gain
modulation (XGM) bandwidth is an important parameter. Since LO
frequency is usually beyond the SOA XGM bandwidth, optical LO
signals themselves do not cause any significant XGM. However, when
data and/or IF signals are within the XGM bandwidth, they can cross-
gain modulate each of optical heterodyne LO modes, resulting in
frequency up-conversion after beating in a PD. Consequently, the XGM
bandwidth limits data and/or IF frequencies that can be frequency up-
converted. Previously, it was reported that the theoretical bandwidth of
SOA-PD frequency up-conversion method can be several GHz [59-60],
which is verified with the frequency response measurement of SOA
XGM.
Fig. 2-17 shows the experimental setup to measure SOA XGM
frequency response. For a pump signal, a 1548.5 nm DFB laser and an
MZM having 3 dB bandwidth of 8 GHz were used, and for a probe
signal, a 1545 nm CW light source was used. An optical bandpass filter
was placed before a PD having 15 GHz bandwidth to block the pump
source. The SOA was biased at 200 mA, at which condition the optical

50
gain and saturation output power at 1550 nm was 29 dB and 9 dBm,
respectively. Before XGM frequency response measurement, the
frequency response of the pump signal was measured for calibration.
The frequency responses were measured with a 13.5 GHz network
analyzer. The SOA input power of the probe signal was fixed at -30
dBm, and the power of pump signals was varied from -30 dBm to -12
dBm. Fig. 2-18 shows the normalized frequency response for -12 dBm
pump signal and the fitted results with the double-pole system response
as reported in [36]. Discrepancies between measured and fitted data at
high frequencies are believed due to the incomplete SOA model. 3 dB
bandwidth was extracted from the fitted results. For -30 dBm pump
signals, 3 dB bandwidth is 4.2 GHz, and for -20 dBm and -12 dBm
signals, 3 dB bandwidth is 4.5 GHz and 5.8 GHz, respectively, which
are sufficient for gigabit data transmission using our frequency up-
conversion scheme. The reason for 3 dB bandwidth increase with the
pump signal power is that XGM speed is limited by the effective carrier
recombination rate, γeff, in SOA as shown below [36, 60]:
probepumpSeffdBf
τττγ 111
3 ++=∝ 2-(28)
where τs is spontaneous carrier lifetime in SOA, τpump,probe is stimulated
recombination lifetime for optical pump or probe signals. Since τpump is
inversely proportional to the SOA input pump signal power, the
increase in pump signal power increases γeff, resulting in XGM
bandwidth increase.

51
LD MZM
TLS
SOA
NetworkAnalyzer
pump1548.5nm
probe1545nm
Att.
PD
OBPF(1545nm)
LD MZM
TLS
SOA
NetworkAnalyzer
pump1548.5nm
probe1545nm
Att.
PD
OBPF(1545nm)
Figure 2-17. Measurement setup for SOA XGM frequency response. OBPF:
Optical Band Pass Filter, TLS: Tunable Laser Source.
0.1 1 10
-6
-5
-4
-3
-2
-1
0
1
Res
pons
e (d
B)
Frequency (GHz)
Fitting Results
Figure 2-18. Frequency response for SOA XGM for a -12 dBm SOA input
pump signal power.

52
2-3-2. Data transmission experiments and results
Fig. 2-19 shows the experimental setup for 60 GHz band RoF
systems using SOA-PD frequency up-converter. The 63 GHz optical
heterodyne LO signals at 1553.3 nm were generated using a DSB-SC
method, for which a 40 GHz MZM was biased at the minimum
transmission condition, and modulated by a 31.5 GHz RF signals. An
EDFA was used to increase heterodyne optical LO power along with an
optical bandpass filter having about 0.4 nm passband for amplifier
noise reduction. For data signals, another wavelength optical signal was
externally modulated by 2 V peak-to-peak, 1.244 Gbit/s non-return-to-
zero pseudo-random bit sequences having pattern length of 215-1. These
two optical signals were combined, and then transmitted to the base
station via 10 km optical fiber. Fig. 2-20(a) shows the spectrum of
optical heterodyne LO signals at 1553.3 nm and baseband data signals
at 1550 nm before SOA. The peak at 1553.3 nm marked with ‘o’ is due
to incomplete carrier suppression with DSB-SC generation and peaks
marked with ‘x’ are harmonics of 31.5 GHz modulation.
At the base station, two optical signals were injected into SOA, and
optical heterodyne signals were cross-gain modulated by optical
baseband signals. The SOA was biased at 150 mA, which gave 25 dB
optical gain and 8 dBm output saturation power. Fig. 2-20(b) shows the
optical spectrum after SOA, and these signals were photodetected by a
60 GHz broadband PD. In Fig. 2-20(b), spurious peaks marked with
asterisks around 1550 nm are the result of optical heterodyne signals

53
cross-gain modulating the optical baseband signal. However, their
effects are negligible to the link performance, because 31.5 GHz
signals resulting from the photodetection of spurious peaks are far off
from 63 GHz data signals, and their harmonics are very low as shown
in the figure 2-20(b). Fig. 2-21(a) shows the frequency up-converted
RF spectrum of 1.244 Gbit/s data at 63 GHz. In this measurement, the
optical LO power before SOA was -13 dBm, and the optical baseband
signal power and wavelength was -13 dBm and 1550 nm, respectively.
As shown in the figure, baseband data signals are successfully up-
converted to 63 GHz. The peaks marked with asterisks having 1.244
GHz separation appear because baseband data are ASK modulated. The
center peak at 63 GHz due to optical LO signals can saturate amplifiers
and limit output data signal power at the base station. Other modulation
techniques using antipodal signals and LO rejection filtering at 60 GHz
band can avoid this problem.
To demodulate 63 GHz ASK data signals, a commercially-available
direct conversion demodulator based on a Schottky diode was used. In
this demodulator, input 63 GHz data signals are recovered at baseband
due to square-law detection characteristics of the Schottky diode. The
data signal was attenuated by 25 dB since the demodulator that we used
has a maximum power limit of -30 dBm. Fig. 2-21(b) shows the RF
spectrum of 1.244 Gbit/s baseband data. After baseband amplification
and additional low pass filtering of data signals, demodulated data

54
signals were analyzed by a sampling oscilloscope for eye diagram
measurement, and an error detector for BER measurement.
DFB MZM
TLS MZM
31.5GHz
SOA PD
10km
λλλλLO
63GHz
Central Office
Base Station
ASKReceiver
LPFdirect detection
with schottky diode
λλλλdata
Data Demodulation
SamplingOscilloscope
35dB
RFattenuator
(25dB)
Pulse PatternGenerator
ErrorDetector
OBPF(λλλλLO)
EDFA
Figure 2-19. Experimental setup for 1.244 Gbit/s 63 GHz RoF downlink data
transmission. LPF: LowPass Filter.

55
1550 1552 1554
-60
-40
-20
Op
tica
l Po
wer
(d
Bm
)
Wavelength (nm)
optical baseband optical LO63GHz
x x
xx
o
1550 1552 1554
-60
-40
-20
Op
tica
l Po
wer
(d
Bm
)
Wavelength (nm)
optical baseband optical LO63GHz
x x
xx
o
(a)
1550 1552 1554
-40
-30
-20
-10
0
Op
tica
l Po
wer
(d
Bm
)
Wavelength (nm)
*
*
*
*
1550 1552 1554
-40
-30
-20
-10
0
Op
tica
l Po
wer
(d
Bm
)
Wavelength (nm)
*
*
*
*
(b)
Figure 2-20. Optical spectrum of downlink optical LO and data signals before
SOA (a) and after SOA (b).

56
61 62 63 64 65-60
-50
-40
-30
-20
-10
0
10
RF
Po
wer
(d
Bm
)
Frequency (GHz)
***
61 62 63 64 65-60
-50
-40
-30
-20
-10
0
10
RF
Po
wer
(d
Bm
)
Frequency (GHz)
***
(a)
0.0 0.5 1.0 1.5 2.0 2.5 3.0
-80
-60
-40
-20
0
RF
Po
wer
(d
Bm
)
Frequency (GHz)
(b)
Figure 2-21. RF spectrum of frequency up-converted 63 GHz data signals (a)
and demodulated baseband signals (b). Resolution bandwidth for both spectra
is 1 MHz.

57
Fig. 2-22 shows the measured BER as a function of the optical
baseband signal power before SOA at several different wavelengths
varying from 1540 nm to 1570 nm. The optical baseband signal power
before SOA influences frequency conversion efficiency affecting
signal-to-noise ratios (SNRs), but the optical power after SOA does not
change very much due to SOA gain saturation. For this measurement,
optical LO signal power before SOA was fixed at -13 dBm. As can be
seen in the figure, the BER decreases as optical baseband signal power
increases. The increased optical data signal power before SOA can
improve XGM efficiency in SOA, which results in SNR improvement.
In the wavelength range from 1550 nm to 1570 nm, the power penalty
for 10-9 BER is less than 1 dB. The eye diagram for error free
conditions at 1550 nm data signals is also shown in Fig. 2-22. However,
the power penalty for the 1540 nm wavelength signal is about 2.5 dB.
The unsaturated gain spectrum of the SOA used in this study has a peak
at around 1550 nm. But the SOA gain peak shifts to longer wavelength
due to the carrier depletion when the SOA gain is saturated, which is
well explained in chapter 2-2. Therefore, frequency up-conversion
efficiency is higher for wavelengths longer than 1550 nm. For shorter
wavelength signals, large power penalties occur due to low frequency
up-conversion efficiency. Nevertheless, error-free data transmission is
accomplished for a wide range of data wavelengths proving that WDM
data transmission is possible with this scheme.

58
The dependence of BER on optical LO power was also measured.
The optical data signal power was fixed at -13 dBm, and the data
wavelength was 1550 nm. Fig. 2-23 shows the results of optical LO
power dependence. As the optical LO power increases, the BER is
decreased. The reason for this improvement is that the high optical LO
power results in high frequency up-conversion efficiency as explained
in chapter 2-2.
-24 -22 -20 -18 -16 -14 -121E-11
1E-10
1E-9
1E-8
1E-7
1E-6
1E-5
1E-4
1E-3
IF Wavelenth 1540nm 1550nm 1560nm 1570nm
BER
Optical Baseband Power (dBm)
-24 -22 -20 -18 -16 -14 -121E-11
1E-10
1E-9
1E-8
1E-7
1E-6
1E-5
1E-4
1E-3
IF Wavelenth 1540nm 1550nm 1560nm 1570nm
BER
Optical Baseband Power (dBm)
Figure 2-22. Dependence of BERs performance on SOA input optical
baseband signal power.
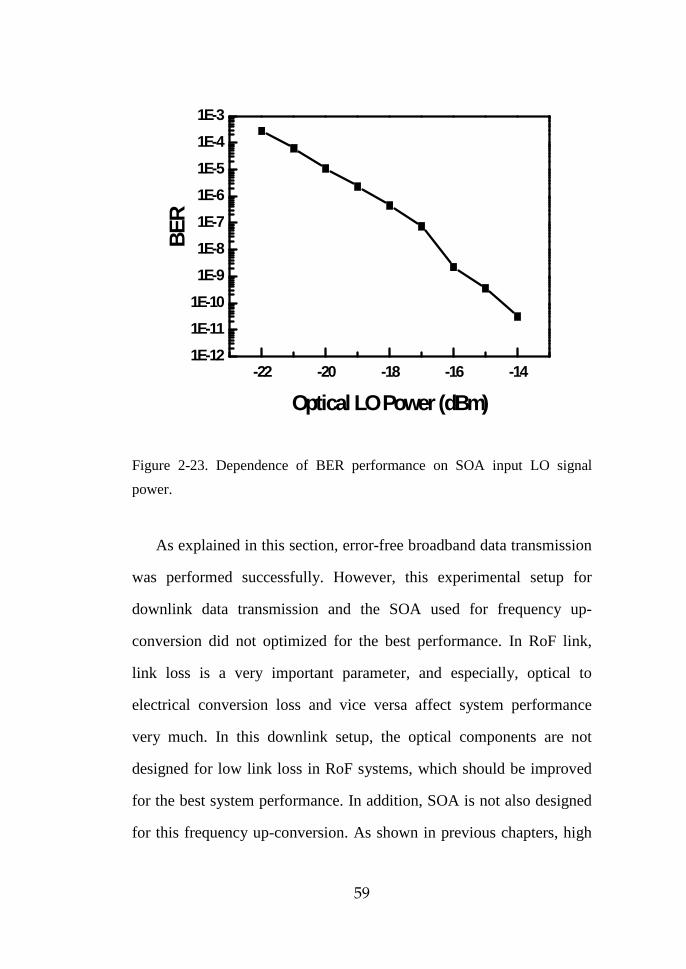
59
-22 -20 -18 -16 -141E-12
1E-11
1E-10
1E-9
1E-8
1E-7
1E-6
1E-5
1E-4
1E-3
BER
Optical LO Power (dBm)
Figure 2-23. Dependence of BER performance on SOA input LO signal
power.
As explained in this section, error-free broadband data transmission
was performed successfully. However, this experimental setup for
downlink data transmission and the SOA used for frequency up-
conversion did not optimized for the best performance. In RoF link,
link loss is a very important parameter, and especially, optical to
electrical conversion loss and vice versa affect system performance
very much. In this downlink setup, the optical components are not
designed for low link loss in RoF systems, which should be improved
for the best system performance. In addition, SOA is not also designed
for this frequency up-conversion. As shown in previous chapters, high

60
SOA gain and XGM efficiency can increase frequency conversion
efficiency, which surely results in system performance enhancement.
Furthermore, the low noise SOA design can help increasing SNR after
frequency up-conversion. The used RF components and the 60 GHz
ASK receiver are not also designed for this experiment. Due to the
input power limit of the ASK receiver, the input data signal power is
reduced unnecessarily. In addition, other RF components for data
demodulation have a room for better system performance in 60 GHz.
Therefore, the system performance can be surely improved after these
optimizations.
61
3. Remote Frequency Down-Conversion Using EAM
3-1. Uplink RoF Systems for Bi-Directional Data Transmission
The conventional wireless networks consist of downlinks and
uplinks to deliver data signals to and from mobile users. 60 GHz
wireless systems also need bi-directional links to make full access
between service providers and users, and the base station design for full
links is another challenging problem. For simple base stations, RoF
technologies can be used, however, it is also very difficult. Fig. 3-1
shows two RoF schemes for uplink data transmission. The direct
transmission of RF signals as shown in Fig. 3-1(a) looks very simple.
The received RF signals are converted to optical domain without any
electrical processing. However, high speed optical components are
needed at each base station, which is a burden contrary to downlink
RoF systems having high speed components at the central station.
Another system configuration is that high frequency data signals are
frequency down-converted to IF/baseband, and then transmitted to the
central station after electrical-to-optical conversion with low speed
optical components. The problem is that high frequency electrical
devices for frequency down-conversion and high speed signal
processors should also be equipped at each base station.

62
PD
E/OOptical fiber
RF Transmission
RF Transmission
RF Demod
PD
E/OOptical fiber
RF Transmission
RF Transmission
RF Demod
(a)
PD
E/OOptical fiber
RF/IF
IF/BasebandFeeder
IF/BasebandFeeder
IF Demod
PD
E/OOptical fiber
RF/IF
IF/BasebandFeeder
IF/BasebandFeeder
IF Demod
(b)
Figure 3-1. Uplink RoF system configurations. (a) direct RF transmission
systems, (b) IF/Baseband Feeder systems.
EAM transceivers can allow the simple antenna base station
architecture for bi-directional RoF links because EAM can perform the
dual-functions of photodetection and optical modulation [28-32]. EAM
is a reverse biased p-i-n diode with bulk active region [33] or multiple
quantum-wells [34] as the absorption layer. Bias conditions determine
the amount of light absorption, and optical modulation is possible by
the modulation of bias voltages. In addition, photocurrent is generated
at the absorption layer like conventional PDs. Fig. 3-2 shows uplink
RoF systems using EAM. Uplink millimeter-wave signals modulate
optical signals transmitted from the central station using EAM, which
eliminates optical sources for uplink data transmission. As shown in
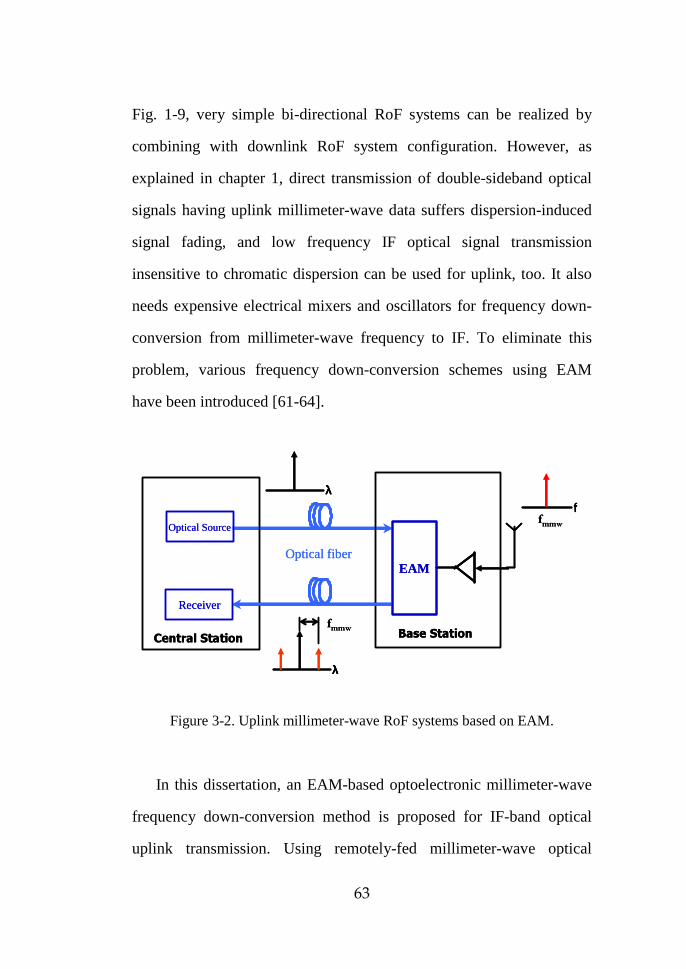
63
Fig. 1-9, very simple bi-directional RoF systems can be realized by
combining with downlink RoF system configuration. However, as
explained in chapter 1, direct transmission of double-sideband optical
signals having uplink millimeter-wave data suffers dispersion-induced
signal fading, and low frequency IF optical signal transmission
insensitive to chromatic dispersion can be used for uplink, too. It also
needs expensive electrical mixers and oscillators for frequency down-
conversion from millimeter-wave frequency to IF. To eliminate this
problem, various frequency down-conversion schemes using EAM
have been introduced [61-64].
Central Station
Optical fiber
Base Station
Receiver
Optical Source
EAM
λλλλ
λλλλ
fffffmmw
fmmw
Central Station
Optical fiber
Base Station
Receiver
Optical Source
EAM
λλλλ
λλλλ
fffffmmw
fmmw
Figure 3-2. Uplink millimeter-wave RoF systems based on EAM.
In this dissertation, an EAM-based optoelectronic millimeter-wave
frequency down-conversion method is proposed for IF-band optical
uplink transmission. Using remotely-fed millimeter-wave optical

64
heterodyne LO signals, the uplink millimeter-wave signals are
optoelectronically frequency down-converted to the IF-band optical
signals by EAM, and then transmitted to central station. Therefore, for
uplink data transmission, only EAM is needed in base stations. Fig. 3-3
shows the schematic of proposed frequency down-conversion uplink
systems using EAM, which is compared with conventional remote
frequency down-conversion RoF systems. The basic idea was proposed
in paper [61] and [62], but this dissertation will expand this idea to 60
GHz uplink system applications, and analyze its characteristics in detail.
In addition, a bi-directional RoF link using this idea will be presented
in chapter 4.
Down-conversionMixer
Local oscillator
PD
Optical IFSource (λIF)
Central Station
Optical fiber
BaseStation
Uplink systems with IF Feeder
DataProcessing
• Optical LO + Optoelectronic Mixing + No optical source in BS
PD
EAM Mixingand modulation
Optical fiber
BaseStation
DataProcessing
Optical LO ( λλλλLO)Optical IF(λIF)
Proposed RoF uplink systems
• Complex base station• 60 GHz electrical LO and Mixer
Figure 3-3. Remote frequency down-conversion RoF uplink systems using
EAM.

65
3-2. Operation Principle of EAM Frequency Down-Conversion
3-2-1. Characteristics of EAM
EAM is the abbreviation of electroabsorption modulator, where
‘electroabsorption’ means that the amount of light absorption is
changed by the electric field applied to semiconductors, and
‘modulator’ means that such characteristics are used for optical
modulation. Although the insertion loss is a weakness of EAM, its
other advantages such as low driving voltage, low or negative chirp,
high speed operation, integration with DFB laser are very attractive to
optical communications. Two types of EAM are well used, one of
which is bulk type using a Franz-Keldysh effect [33], and another is
multiple quantum-well type using a Quantum Confined Stark Effect
(QCSE) [34]. Both are simply designed as a reverse biased p-i-n diode,
and both effects are predominant at near the bandgap of
semiconductors. In this dissertation, the used EAM had multiple
quantum-well structures, so that the simple operation principle based
on QCSE is discussed [34, 65]. Fig. 3-4 shows the change of single
quantum-well layer explaining EAM operation. As the reverse bias
applied to the p-i-n diode increases, the whole band edge absorption
shifts to lower energies resulting from the distortion of single quantum-
well potential. In Fig. 3-4, the energy Ee1-h1 decreases as the applied
field increases. Therefore, the increase of reverse bias can make the

66
semiconductor absorb optical signals having lower energy compared
with bandgap energy (Eg), and the transmitting optical power from the
semiconductor is determined by the applied electrical field controlled
by reverse bias conditions.
Quantum-Well
Eg
Ee1
Eh1
Ee1-h1 Eg
Ee1
Eh1
Ee1-h1
Electric Field
Quantum-Well
Eg
Ee1
Eh1
Ee1-h1 Eg
Ee1
Eh1
Ee1-h1
Quantum-Well
Eg
Ee1
Eh1
Ee1-h1 Eg
Ee1
Eh1
Ee1-h1
Electric Field
Figure 3-4. Operation principle schematic of multiple quantum-well EAM.
Such characteristics are used for optical modulation, and EAM
transfer function can be expressed as the following [30]:
( )LVPVP inout )(exp)( αΓ−= 3-(1)
where Pin, out is the input and output optical power of EAM, Γ is
confinement factor, α is absorption coefficient depending on applied
bias voltage, and L is the length of EAM. The interesting thing is that

67
the reverse shape of EAM transfer function is the same as the
absorption one of EAM, i.e. some of optical signals not transmitting
EAM are absorbed in EAM [66].
ElectroabsorptionModulator
Pin
TLSPowerMeter
Pout
SemiconductorParameterAnalyzer
50Ωterm.
ElectroabsorptionModulator
Pin
TLSPowerMeter
Pout
SemiconductorParameterAnalyzer
50Ωterm.
Figure 3-5. Experimental setup to measure optical transmission and
absorption characteristics of EAM.
Fig. 3-5 shows the measurement setup of optical transmission and
absorption characteristics of EAM. A tunable light source was used to
change wavelength of input optical signals. Input optical power was
fixed at 0 dBm, and output power was measured by an optical power
meter. A semiconductor parameter analyzer was used to apply reverse
biases to EAM, and to measure photocurrent generated from input
optical signal absorption. The used EAM was designed and fabricated
for 1550 nm optical signal modulation by Electronics and
Telecommunications Institute (ETRI) of Korea, and details about EAM
are well explained in [67-68].

68
Fig. 3-6(a) shows optical transmission curve of EAM at different
wavelength conditions. Optical transmission means the optical power
ratio of output signals to input signals. As the applied reverse bias
increases, the transmitting signal power decreases due to
electroabsorption phenomenon. For short wavelength optical signals,
large signal absorption in EAM occurs. Since shorter wavelength
optical signals have higher energy than longer wavelength optical
signals, it is easily absorbed in EAM. For analog signal modulation, the
EAM is usually biased at maximum slope efficiency point, where the
highest link gain can be obtained. The photocurrent measurement
shows the absorption characteristics of EAM. As shown in Fig. 3-6(b),
large signal absorption occurs at high reverse bias conditions due to the
same electroabsorption effects, and also short wavelength signals
generate large photocurrent. These represent that high reverse bias and
short wavelength signals are necessary for efficient signal detection
using EAM. As explained above, EAM can perform both optical
modulation and photodetection, which is useful for EAM to be adopted
in base stations of bi-directional links. The problem is that the bias and
wavelength conditions for optimum detection and modulation are
different, so that system designs considering this trade-off are
necessary.
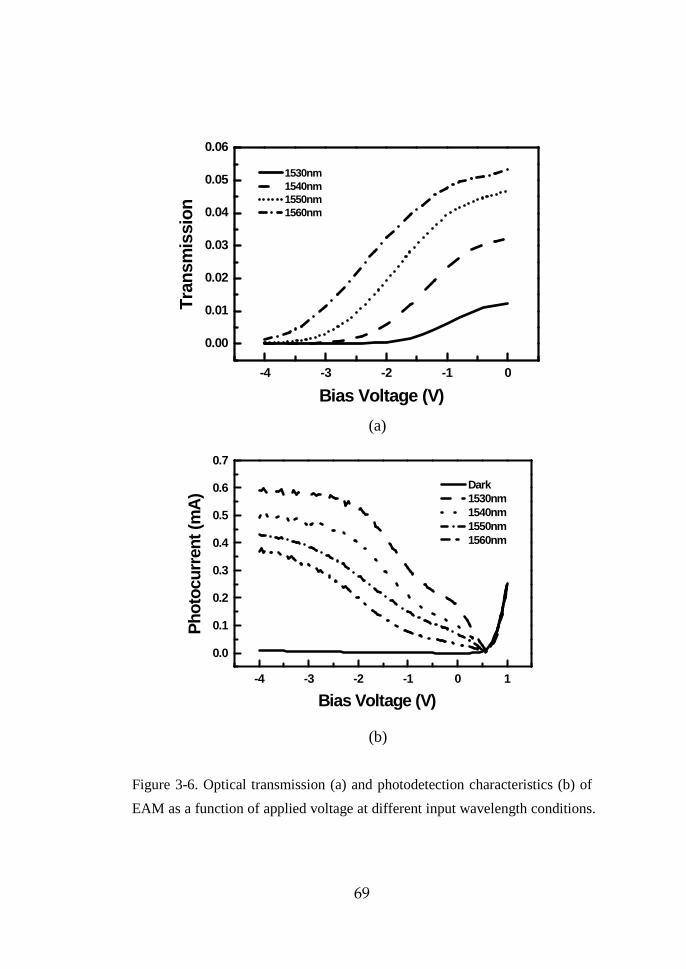
69
-4 -3 -2 -1 0
0.00
0.01
0.02
0.03
0.04
0.05
0.06
1530nm 1540nm 1550nm 1560nm
Tran
smis
sion
Bias Voltage (V)
(a)
-4 -3 -2 -1 0 1
0.0
0.1
0.2
0.3
0.4
0.5
0.6
0.7
Dark 1530nm 1540nm 1550nm 1560nm
Pho
tocu
rren
t (m
A)
Bias Voltage (V)
(b)
Figure 3-6. Optical transmission (a) and photodetection characteristics (b) of
EAM as a function of applied voltage at different input wavelength conditions.
70
3-2-2. Optoelectronic frequency down-conversion in EAM
The proposed frequency down-conversion technique uses three
functions of EAM, photodetection, optoelectronic mixing, and optical
modulation [61, 62, 69]. Fig. 3-7 schematically shows the operation
principle of the optoelectronic frequency down-conversion scheme for
uplink data transmission. To obtain LO signals, the optical heterodyne
technique is used, and the generated heterodyne signals can be given by
]))2
(2cos[])2
(2(cos[ 000 tf
ftf
fEE LOLOLO −++= ππ 3-(2)
where ELO represents electrical field of optical LO signals, E0 is
electrical field amplitude, f0 is center frequency of optical LO, fLO is
LO frequency. The optical phase terms are neglected for simplicity.
This optical LO at λLO are transmitted from the central station, and fLO
signals are generated at the base station by EAM photo-detection. This
process can be written as
)2cos(0* tfRIEREI LOLO π=⋅= 3-(3)
where R is responsivity of EAM photodetection, and I0 is generated
signal amplitude coming from optical signals. At the same time, the
EAM is modulated by fRF uplink signals given by
)2cos(0 tfVV RFRF π= 3-(4)
where VRF represents uplink RF voltage signals, and V0 is the
amplitude of modulating signals. The responsivity, R of EAM is
dependent on applied voltage, which is well shown in Fig. 3-6(b).

71
Therefore, nonlinear mixing terms are generated by uplink RF signal
modulation, which can be given by [61]
))(2cos(00 tffVIdV
dRI LORF
VVmix
b
±==
π 3-(5)
where dR/dV is first-order derivative of responsivity evaluated at DC
bias voltage, Vb. As given in equation 3-(5), frequency down-converted
IF signals (fIF=fRF-fLO) are produced. This nonlinear optoelectronic
mixing process is well explained in [61-62]. Next, to deliver these
uplink signals to central station, the λIF uplink optical carrier is
modulated by frequency down-converted IF signals as given by
( )[ ]LIPP mixinout αΓ−= exp 3-(6)
, and is transmitted to the central station with negligible dispersion-
induced signal fading problems. The equation 3-(6) is also shown in
chapter 3-2-1. After filtering of optical LO signals, optical IF signals
are photodetected at the central station, and frequency down-converted
IF signals are generated. Because uplink RF signals also modulate
optical LO signals, they should be filtered out not to generate unwanted
IF signals coming from optical LO [62]. Effectively, a single EAM
device is acting as a four-terminal device which simultaneously
performs photo-detection, frequency down-conversion, and uplink
optical IF signal modulation.
Fig. 3-8 shows the experimental verification results using 25 GHz
optical heterodyne LO signals and 25.2 GHz uplink RF signals. When
25 GHz optical heterodyne signals are photodetected in EAM along

72
with electrical modulation of 25.2 GHz, 200 MHz IF signals are
generated and modulate another optical source provided from the
central station. After photodetection of optical IF, 200 MHz IF signals
are generated at the central station as shown in Fig. 3-8(a). In this
photodetection, EAM modulating 25.2 GHz uplink signals and
photodetected 25 GHz LO signals can be also obtained as shown in Fig.
3-8(b), which indirectly shows the frequency down-conversion
processes. Although 25.2 GHz RF signals are generated at the central
station, this RF signal power is dependent on chromatic dispersion of
optical fibers.
Optical LOSource
Optical IFSource
O/E
fLO
λλλλLOLOLOLO
λλλλIFIFIFIF
fLO
fIF
f
f
fRF
f
fIF
f
Central Station
fiber
λλλλIFIFIFIF
fIF = fRF-fLO
optical IF
EAMphoto-detection,
mixing, and
modulation
uplink RFλλλλLOLOLOLO
, , , , λλλλIFIFIFIF
λλλλIFIFIFIF
Base Station
Optical LOSource
Optical IFSource
O/E
fLO
λλλλLOLOLOLO
λλλλIFIFIFIF
fLO
fIF
f
f
fRF
f
fIF
f
Central Station
fiber
λλλλIFIFIFIF
fIF = fRF-fLO
optical IF
EAMphoto-detection,
mixing, and
modulation
uplink RFλλλλLOLOLOLO
, , , , λλλλIFIFIFIF
λλλλIFIFIFIF
Base Station
Figure 3-7. Schematic of optoelectronic frequency down-conversion for
uplink RoF systems.

73
160 180 200 220 240-90
-80
-70
-60
-50
-40
-30
RF
Pow
er (d
Bm
)
Frequency (MHz)
(a)
24.6 24.8 25.0 25.2 25.4
-80
-70
-60
-50
-40
-30
-20
RF
Pow
er (d
Bm
)
Frequency (GHz)
(b)
Figure 3-8. RF spectrum of frequency down-converted signals (a) and RF and
LO signals after photodetection of optical IF signals.
74
3-3. Conversion Efficiency of EAM Frequency Down-Conversion
For frequency converters, the conversion efficiency is an essential
parameter to design RF systems of base stations [70]. Therefore, in this
chapter, the frequency down-conversion efficiencies of proposed EAM
frequency down-converter are investigated at 30 GHz band. To
measure it, internal conversion efficiency is defined to exclude link loss
effects that do not influence down-conversion process [10]. In down-
conversion systems, signal loss caused by electrical to optical
conversion and optical to electrical conversion, and fiber and
waveguide transmission loss affect frequency converted signal power,
which is not related to the real frequency conversion processes.
Therefore, internal conversion efficiency should be defined for this
frequency down-converter. Using this definition, down-conversion
efficiency is investigated as functions of EAM biases, optical local
oscillator (LO) signal powers, and optical IF signal powers and
wavelengths, all of which are important system parameters in RoF links.
3-3-1. Experimental setup and conversion efficiency definition
Fig. 3-9 schematically shows the experimental setup to measure
frequency down-conversion efficiency. For 29.6 GHz optical LO
signals, 8 dBm, 29.6 GHz RF signals modulated a 40 GHz Mach-
Zehnder modulator biased at the quadrature point. In real systems,
optical heterodyne LO signals should be used to avoid dispersion
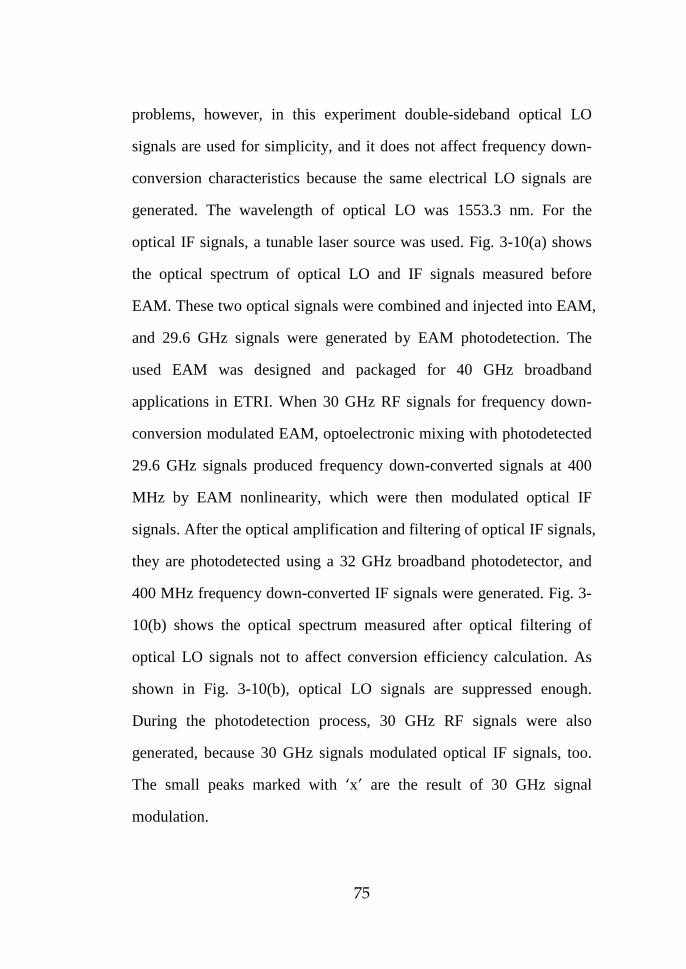
75
problems, however, in this experiment double-sideband optical LO
signals are used for simplicity, and it does not affect frequency down-
conversion characteristics because the same electrical LO signals are
generated. The wavelength of optical LO was 1553.3 nm. For the
optical IF signals, a tunable laser source was used. Fig. 3-10(a) shows
the optical spectrum of optical LO and IF signals measured before
EAM. These two optical signals were combined and injected into EAM,
and 29.6 GHz signals were generated by EAM photodetection. The
used EAM was designed and packaged for 40 GHz broadband
applications in ETRI. When 30 GHz RF signals for frequency down-
conversion modulated EAM, optoelectronic mixing with photodetected
29.6 GHz signals produced frequency down-converted signals at 400
MHz by EAM nonlinearity, which were then modulated optical IF
signals. After the optical amplification and filtering of optical IF signals,
they are photodetected using a 32 GHz broadband photodetector, and
400 MHz frequency down-converted IF signals were generated. Fig. 3-
10(b) shows the optical spectrum measured after optical filtering of
optical LO signals not to affect conversion efficiency calculation. As
shown in Fig. 3-10(b), optical LO signals are suppressed enough.
During the photodetection process, 30 GHz RF signals were also
generated, because 30 GHz signals modulated optical IF signals, too.
The small peaks marked with ‘x’ are the result of 30 GHz signal
modulation.

76
Fig. 3-11(a) and (b) show the RF spectra of frequency down-
converted signals at 400 MHz and photodetected 30 GHz signals,
respectively. Input optical LO power was 3 dBm and optical IF power
was 0 dBm. The wavelength of optical IF was 1550 nm. With these
results, the frequency down-conversion efficiency can be defined as the
photodetected signal power ratio of frequency down-converted signals
at 400 MHz (A in Fig. 3-11(a)) to 30 GHz RF signals (B in Fig. 3-
11(b)), by which link loss effects on frequency down-converted signals
are removed and internal conversion efficiency can be calculated.
DFB EOM
TLS
fLO=29.6 GHz
optical LO (λλλλLO)
optical IF (λλλλIF)
λλλλLOLOLOLO
fLO
λλλλIFIFIFIF
EAM
fRFf
λλλλIFf IF = fRF-fLO
OBPF(λλλλIF) EDFAPD
ff IF
30 GHz
400 MHz
fRF
30 GHz
fRF
Figure 3-9. Experimental setup to measure frequency down-conversion
efficiency. EOM : Electrooptic Modulator.

77
1548 1549 1550 1551 1552 1553 1554 1555
-40
-35
-30
-25
-20
-15
-10
-5
0
5
Op
tica
l Po
wer
(d
Bm
)
Wavelength (nm)
(a)
1548 1549 1550 1551 1552 1553 1554 1555-100
-80
-60
-40
-20
0
Op
tica
l Po
wer
(d
Bm
)
Wavelength (nm)
x x
1548 1549 1550 1551 1552 1553 1554 1555-100
-80
-60
-40
-20
0
Op
tica
l Po
wer
(d
Bm
)
Wavelength (nm)
x x
(b)
Figure 3-10. Optical spectrum measured before EAM (a) and after optical
filtering of optical LO signals (b).

78
399.6 399.8 400.0 400.2 400.4
-100
-90
-80
-70
-60
-50
-40
RBW = 1kHz
RF
Po
wer
(d
Bm
)
Frequency (MHz)
A
399.6 399.8 400.0 400.2 400.4
-100
-90
-80
-70
-60
-50
-40
RBW = 1kHz
RF
Po
wer
(d
Bm
)
Frequency (MHz)
A
(a)
29.9996 29.9998 30.0000 30.0002 30.0004-100
-90
-80
-70
-60
-50
-40
RBW = 1kHz
RF
Po
wer
(d
Bm
)
Frequency (GHz)
B
29.9996 29.9998 30.0000 30.0002 30.0004-100
-90
-80
-70
-60
-50
-40
RBW = 1kHz
RF
Po
wer
(d
Bm
)
Frequency (GHz)
B
(b)
Figure 3-11. RF spectrum of uplink IF signals (a) and RF signals (b) after
photodetection of optical IF signals.
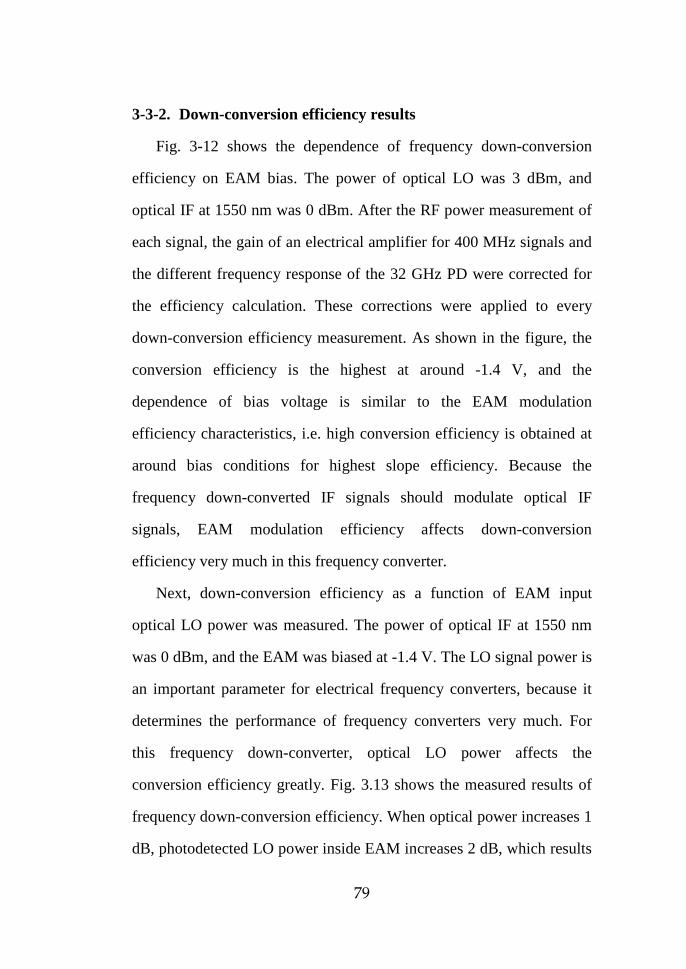
79
3-3-2. Down-conversion efficiency results
Fig. 3-12 shows the dependence of frequency down-conversion
efficiency on EAM bias. The power of optical LO was 3 dBm, and
optical IF at 1550 nm was 0 dBm. After the RF power measurement of
each signal, the gain of an electrical amplifier for 400 MHz signals and
the different frequency response of the 32 GHz PD were corrected for
the efficiency calculation. These corrections were applied to every
down-conversion efficiency measurement. As shown in the figure, the
conversion efficiency is the highest at around -1.4 V, and the
dependence of bias voltage is similar to the EAM modulation
efficiency characteristics, i.e. high conversion efficiency is obtained at
around bias conditions for highest slope efficiency. Because the
frequency down-converted IF signals should modulate optical IF
signals, EAM modulation efficiency affects down-conversion
efficiency very much in this frequency converter.
Next, down-conversion efficiency as a function of EAM input
optical LO power was measured. The power of optical IF at 1550 nm
was 0 dBm, and the EAM was biased at -1.4 V. The LO signal power is
an important parameter for electrical frequency converters, because it
determines the performance of frequency converters very much. For
this frequency down-converter, optical LO power affects the
conversion efficiency greatly. Fig. 3.13 shows the measured results of
frequency down-conversion efficiency. When optical power increases 1
dB, photodetected LO power inside EAM increases 2 dB, which results

80
in the about 2 dB increase of frequency down-converted signal power.
However, the change of optical LO power hardly affects 30 GHz
signals. Therefore, the slope of frequency down-conversion efficiency
according to optical LO power is about two. The conversion efficiency
saturation is also observed when optical LO power is larger than -2
dBm, which is due to the saturation of EAM photodetection.
The dependence of frequency down-conversion efficiency on EAM
input optical IF signals was also evaluated. Fig. 3.14(a) shows the
effects of optical IF power on down-conversion efficiency. For this
measurement, the optical LO power was 3 dBm, and optical IF
wavelength was 1550 nm. EAM was biased at -1.4 V. The frequency
down-conversion efficiency was decreased about 5 dB with the
increase of optical IF power from -15 dBm to 0 dBm. In fact, the down-
conversion efficiency should remain constant because the optical IF
power equally affects both frequency down-converted signals and
photodetected 30 GHz signals. However, when the optical IF power
increased 1 dB, the frequency down-converted signals increased at the
rate of about 1.7 dB contrary to the 2 dB increase of 30 GHz RF signals,
which makes about 5 dB efficiency change. This is believed due to
EAM saturation caused by high optical LO power of 3 dBm.
Fig. 3.14(b) shows the measurement results of down-conversion
efficiency as a function of optical IF wavelength. The optical LO and
IF power was 3 dBm and 0 dBm, respectively. EAM was biased at -1.4
V. The wavelength of optical IF was changed from 1535 nm to 1565
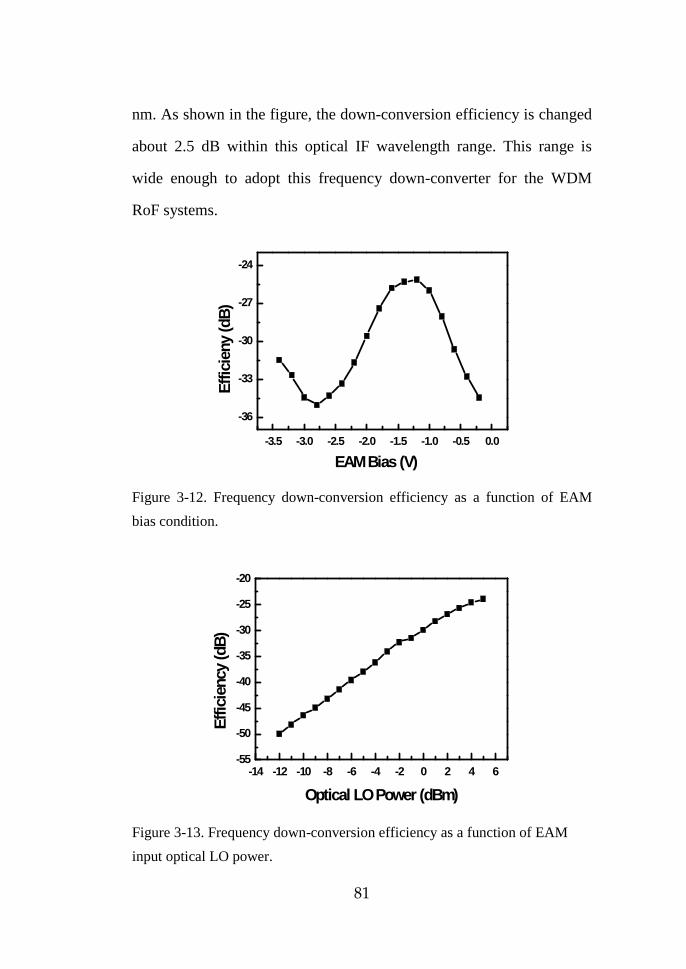
81
nm. As shown in the figure, the down-conversion efficiency is changed
about 2.5 dB within this optical IF wavelength range. This range is
wide enough to adopt this frequency down-converter for the WDM
RoF systems.
-3.5 -3.0 -2.5 -2.0 -1.5 -1.0 -0.5 0.0
-36
-33
-30
-27
-24
Ef
ficie
ny (d
B)
EAM Bias (V)
Figure 3-12. Frequency down-conversion efficiency as a function of EAM
bias condition.
-14 -12 -10 -8 -6 -4 -2 0 2 4 6-55
-50
-45
-40
-35
-30
-25
-20
Effic
ienc
y (d
B)
Optical LO Power (dBm)
Figure 3-13. Frequency down-conversion efficiency as a function of EAM
input optical LO power.

82
-16 -14 -12 -10 -8 -6 -4 -2 0 2-28
-26
-24
-22
-20
-18
Effic
ienc
y (d
B)
Optical IF Power (dBm)
(a)
1535 1540 1545 1550 1555 1560 1565-27
-26
-25
-24
-23
Effic
ienc
y (d
B)
Optical IF Wavelength (nm)
(b)
Figure 3-14. Frequency down-conversion efficiency as a function of EAM
input optical IF power (a) and wavelength (b).
83
3-4. 60 GHz Uplink RoF Systems using Frequency
Down-Conversion
In previous chapters, the operation principle of EAM optoelectronic
frequency down-conversion and the conversion efficiency
characteristics are investigated. Finally, 60 GHz band uplink RoF
systems are experimentally demonstrated based on remote frequency
down-conversion using EAM. For this, 59.5 GHz optical LO was
delivered from the central station, and 60 GHz QPSK data signals
modulated EAM. After frequency down-conversion processes, 500
MHz IF data signals were produced at the central station and system
performance was analyzed.
3-4-1. Experimental setup and results for 60-GHz data
transmission
The EAM used in this experiment has a multiple-quantum well
structure and is packaged for 60 GHz narrow-band application. Details
of EAM characteristics can be found in [67-68]. Although a different
kind of EAM device from the one in previous chapters was used for
this experiment, the optical transmission and photodetection
characteristics as a function of bias voltages are similar to the results
shown in Fig. 3-6(a) and (b). Fig. 3-15 shows measured S11 parameter
characteristics at the input RF port. As can be seen in the figure, S11
parameter values near 60 GHz are small enough to transmit about 2
GHz bandwidth data signals.
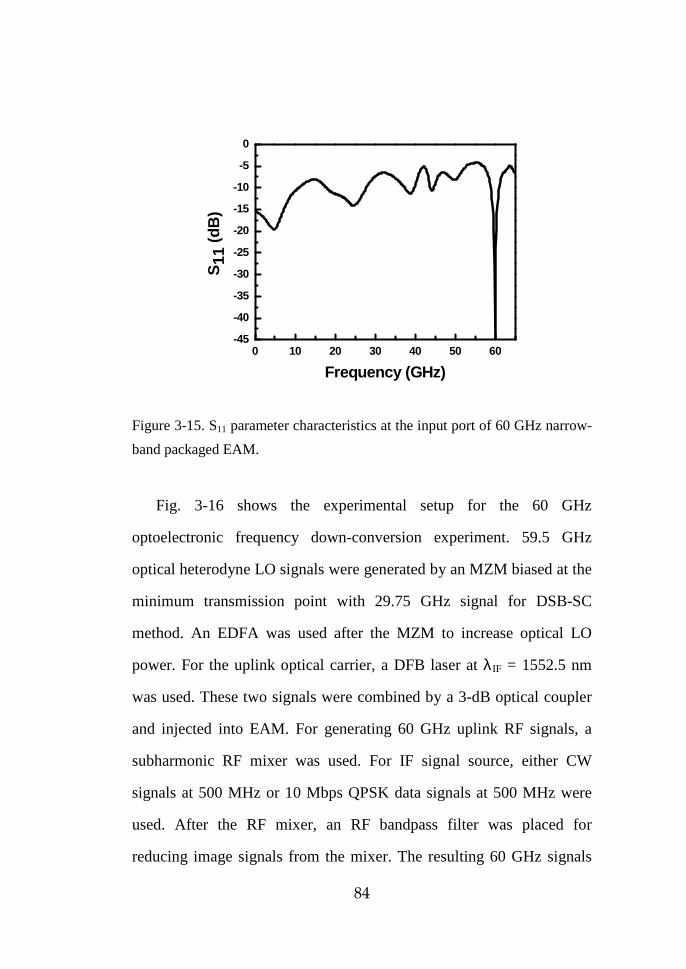
84
0 10 20 30 40 50 60-45
-40
-35
-30
-25
-20
-15
-10
-5
0
S11
(dB
)
Frequency (GHz)
Figure 3-15. S11 parameter characteristics at the input port of 60 GHz narrow-
band packaged EAM.
Fig. 3-16 shows the experimental setup for the 60 GHz
optoelectronic frequency down-conversion experiment. 59.5 GHz
optical heterodyne LO signals were generated by an MZM biased at the
minimum transmission point with 29.75 GHz signal for DSB-SC
method. An EDFA was used after the MZM to increase optical LO
power. For the uplink optical carrier, a DFB laser at λIF = 1552.5 nm
was used. These two signals were combined by a 3-dB optical coupler
and injected into EAM. For generating 60 GHz uplink RF signals, a
subharmonic RF mixer was used. For IF signal source, either CW
signals at 500 MHz or 10 Mbps QPSK data signals at 500 MHz were
used. After the RF mixer, an RF bandpass filter was placed for
reducing image signals from the mixer. The resulting 60 GHz signals

85
were applied to EAM after passing an amplifier and a bias-T. At the
central station, a 20 dB gain EDFA was used to compensate the
insertion loss of EAM, and an optical attenuator was placed not to
exceed the PD saturation optical power. An optical bandpass filter was
also used to suppress unwanted optical heterodyne LO signals. In the
present investigation, all the measurements were done in back-to-back
conditions.
MOBILE TERMINAL
TLS
CENTRAL STATION
29.75GHz
DFB
Optical LO @ λLO
Optical IF @ λIF
MZMEAM
BASE STATION
10Mbps QPSK@500MHz
LO
60GHz
VectorSignal
Analyzer
EDFAOBPF@ λIF
PD
EDFA
BPFMOBILE TERMINAL
TLS
CENTRAL STATION
29.75GHz
DFB
Optical LO @ λLO
Optical IF @ λIF
MZMEAM
BASE STATION
10Mbps QPSK@500MHz
LO
60GHz
VectorSignal
Analyzer
EDFAOBPF@ λIF
PD
EDFA
BPF
Figure 3-16. Experimental setup for 60 GHz frequency down-conversion and
uplink data transmission. BPF : Bandpass Filter.
Fig. 3-17 shows an example of the RF spectrum for frequency
down-converted 500 MHz IF signals at the central station. For this

86
measurement, 5 dBm optical LO signals at 1550 nm and 0 dBm optical
IF carriers at 1552.5 nm were applied to the EAM biased at -1.8 V. The
input RF power of the uplink signal was 5 dBm.
496 498 500 502 504
-90
-80
-70
-60
-50
-40
RF
Po
wer
(d
Bm
)
Frequency (MHz)
Figure 3-17. Frequency down-converted 500 MHz IF signal spectrum.
Resolution bandwidth is 10 kHz
Next, 60 GHz band uplink data transmission was demonstrated. For
the IF data transmission, 10 Mbps QPSK data at 500 MHz were
generated from a QPSK signal generator and frequency up-converted to
60 GHz by a subharmonic mixer. Fig. 3-18(a) shows the QPSK data
spectrum at the 60 GHz band before applied to EAM. This signal was
frequency down-converted by EAM and transmitted to the central
station on 1552.5 nm optical IF carrier. Optical heterodyne LO signals
at 1560 nm were used and the EAM was biased at -2 V. Fig. 3-18(b)

87
shows the spectrum of 500 MHz QPSK data transmitted to the central
station. The received QPSK data were analyzed with a vector signal
analyzer (VSA). The incoming digital data signals have their original
vector positions in complex domain, and the VSA can provide the
discrepancy information between the original vector positions and the
demodulated signal vector positions in the form of error vector
magnitude (EVM). The EVM is used as a figure-of-merit of most
wireless system performance, and it can be converted to SNR easily.
The measured EVM in this experiment was about 14.7 %, which
corresponds to the SNR of 16.6 dB evaluated from the following
relation [71]:
−=100
log20 10
EVMSNR 3-(7)
When the wireless channel is assumed to be additive white Gaussian
noise (AWGN), the BER for MPSK digital modulation can be
analytically extracted from the following equation [74]:
)sin2(log
2
2 MSNRQ
MBER
π×= 3-(8)
The calculated BER from the SNR in this equation was low enough to
transmit error-free QPSK data in this uplink system. The eye diagram
of demodulated signals is shown in Fig. 3-19. It should be noted that
much higher data rate transmission as well as other data modulation
methods should be possible with this scheme, but in this feasibility
experiment, only 10 Mbps QPSK data transmission was possible due to

88
limited equipment available. Moreover, the system performance can be
enhanced after the optimization of RoF link and EAM design. As
explained in chapter 2, the RoF link loss and the most 60 GHz RF
components are not designed for this purpose. This system optimization
can improve data transmission quality. At least, high SNR uplink data
signals at 60 GHz should have been generated for better performance in
this system experiment. As explained before, the SNR of frequency
down-converted signals is not degraded very much compared with
original 60 GHz signals. EAM is not also designed as a frequency
down-converter. In this scheme, the nonlinearity of EAM is the origin
of frequency down-conversion, so that nonlinear EAM design is
necessary. In addition, the better modulation and photodetection
efficiency of EAM can also increase the power of detected frequency
down-converted signals at the central station. I believe that such system
and device optimization surely enhance RoF uplink system
performance.

89
59.996 59.998 60.000 60.002 60.004-80
-70
-60
-50
-40
-30
RF
Po
wer
(dB
m)
Frequency (GHz)
(a)
496 498 500 502 504-110
-100
-90
-80
-70
RF
Pow
er (d
Bm
)
Frequency (MHz)
(b)
Figure 3-18. (a) 10 Mbps QPSK modulated signal spectrum at 60 GHz, (b)
frequency down-converted QPSK modulated signal spectrum at 500 MHz.
Resolution bandwidth is 100 kHz.

90
Figure 3-19. Eye diagram of demodulated 10 Mbps QPSK signals at 500 MHz.

91
4. Remote Frequency Up/Down-Conversion using Cascade SOA-EAM Configuration
4-1. Bi-directional RoF systems In chapter 2 and 3, downlink RoF systems using remote frequency
up-conversion based on SOA-PD configuration, and uplink RoF
systems using remote frequency down-conversion based on EAM are
investigated, respectively. Each system provides compact base station
architectures, and uses low frequency optical IF signal transmission to
avoid dispersion-induced signal fading problems for 60 GHz RoF
systems. However, the final goal is to realize bi-directional 60 GHz
RoF systems, and the basic system configuration to be proposed in this
chapter is shown in Fig. 4-1. At the central station, optical heterodyne
LO signals and optical IF signals having downlink IF data are
generated and transmitted to the base station. In the base station, only a
photonic mixer is installed, and frequency up-converted data signals are
produced by detecting these two optical signals. For uplink, uplink RF
data signals are inputted to the photonic mixer and frequency down-
converted IF signals are generated with the help of detected optical LO
signals. This uplink IF signals modulates optical IF signals used for
downlink, which go back to the central station. After photodetection of
optical IF, uplink IF data signals are created. Therefore, full link
operation is achieved with only a single photonic frequency converter
at the base station. For this, the photonic mixer is realized by

92
combining photonic frequency up- and down-conversion schemes,
especially by the cascaded SOA EAM configuration [72]. Because
EAM can be used for photodetection, the function of PD at SOA-PD
frequency up-conversion can be replaced by EAM. In addition, EAM in
itself can be used for the optoelectronic frequency down-converter. As
a result, SOA-EAM configuration gives very compact base station
architecture for bi-directional RoF systems.
In chapter 4, the simple operation principles of frequency up- and
down-conversion using SOA-EAM configuration will be introduced,
and then measured mixing characteristics will be shown. Finally, bi-
directional RoF links will be demonstrated at 60 GHz band.
Optical fiber
Optical IFSource
λλλλIFIFIFIF
fIF, downfIF, down
fffffLOOptical
HeterodyneSource
fLO
λλλλLOLOLOLO
PhotonicMixer
Base Station
fIF, down
fffffRF, up
λλλλIFIFIFIF
fIF, up
OBPF@ λIF
PDfffffIF, up
Optical fiber
Optical IFSource
λλλλIFIFIFIF
fIF, downfIF, down
fffffLOOptical
HeterodyneSource
fLO
λλλλLOLOLOLO
PhotonicMixer
Base Station
fIF, down
fffffRF, up
λλλλIFIFIFIF
fIF, up
OBPF@ λIF
PDfffffIF, up
Figure 4-1. Proposed bi-directional RoF system configuration adopting a
photonic mixer at a base station.

93
4-2. Operation Principles of Frequency Converters Fig. 4.2 and 4.5 schematically show operation principles of
frequency up- and down-conversion using the SOA-EAM configuration,
respectively.
4-2-1. Frequency up-conversion for downlink transmission
For frequency up-conversion, optical LO at λLO having two optical
modes separated by fLO, and optical IF at λIF having two sidebands
separated from the carrier by fIF, down are transmitted from the central
station and injected into SOA in the base station. Inside SOA, two
modes of optical LO are cross-gain modulated by optical IF signals.
After photodetection of optical LO signals in EAM, frequency up-
converted signals at fLO±f IF, down are obtained as square-law beating
products. This frequency up-conversion process is similar to that in
SOA-PD configuration explained in chapter 2. In order to verify
frequency up-conversion at 60 GHz band, the experimental setup
shown in Fig. 4-2 was used. 60 GHz optical heterodyne LO signals
were generated by modulation of an MZM biased at the minimum
transmission point with 30 GHz RF signals for DSB-SC method. The
wavelength of optical LO was 1553.3 nm and its power measured
before SOA was -15 dBm. Optical IF signals were generated by
modulation of another MZM biased at the quadrature point with 100
MHz, 10 dBm RF signals. The wavelength of optical IF can be any
wavelength within SOA gain bandwidth. For the experiment, optical IF
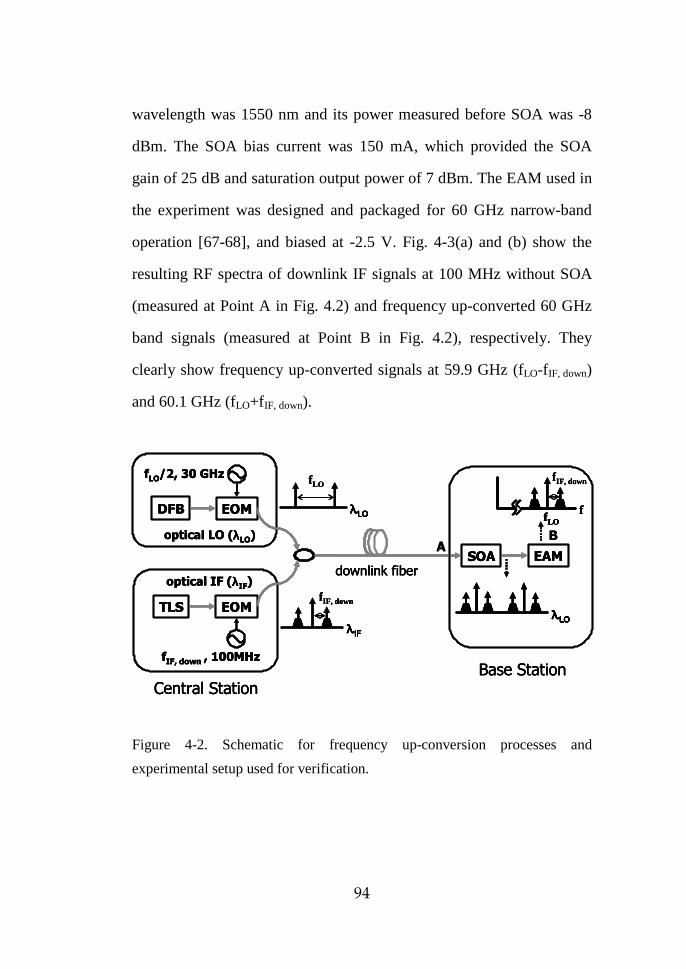
94
wavelength was 1550 nm and its power measured before SOA was -8
dBm. The SOA bias current was 150 mA, which provided the SOA
gain of 25 dB and saturation output power of 7 dBm. The EAM used in
the experiment was designed and packaged for 60 GHz narrow-band
operation [67-68], and biased at -2.5 V. Fig. 4-3(a) and (b) show the
resulting RF spectra of downlink IF signals at 100 MHz without SOA
(measured at Point A in Fig. 4.2) and frequency up-converted 60 GHz
band signals (measured at Point B in Fig. 4.2), respectively. They
clearly show frequency up-converted signals at 59.9 GHz (fLO-f IF, down)
and 60.1 GHz (fLO+fIF, down).
DFB EOM
TLS EOM
fLO/2, 30 GHz
fIF, down , 100MHz
optical LO (λλλλLO)
optical IF (λλλλIF)
λλλλLOLOLOLO
fLO
λλλλIFIFIFIF
Central Station
SOA EAM
λλλλLOLOLOLO
fLOf
f IF, down
downlink fiber
Base Station
f IF, down
AB
DFB EOM
TLS EOM
fLO/2, 30 GHz
fIF, down , 100MHz
optical LO (λλλλLO)
optical IF (λλλλIF)
λλλλLOLOLOLO
fLO
λλλλIFIFIFIF
Central Station
SOA EAM
λλλλLOLOLOLO
fLOf
f IF, down
downlink fiber
Base Station
f IF, down
DFB EOM
TLS EOM
fLO/2, 30 GHz
fIF, down , 100MHz
optical LO (λλλλLO)
optical IF (λλλλIF)
λλλλLOLOLOLO
fLO
λλλλIFIFIFIF
Central Station
SOA EAM
λλλλLOLOLOLO
λλλλLOLOLOLO
fLOf
fLOf
fLOf
f IF, down
downlink fiber
Base Station
f IF, down
AB
Figure 4-2. Schematic for frequency up-conversion processes and
experimental setup used for verification.

95
The dispersion effects on remote frequency up-conversion scheme
are also examined. The frequency up-converted 59.5 GHz signals are
measured at different transmission distances up to 10 km, and the
results are normalized to the power measured at back-to-back
conditions. As shown in Fig. 4-4, signal degradation does not occur
compared with double-sideband transmission of 60 GHz signals, which
was calculated with analytical expression in [15]. For this calculation, it
was assumed that the wavelength of 60 GHz signals is 1550 nm, and
fiber loss is 0.2 dB/km. Many null points due to the signal fading
appear in analytical results shown in Fig. 4-4. As a result, it is verified
that remote frequency up-conversion method does not degrade system
performance for long fiber transmission.
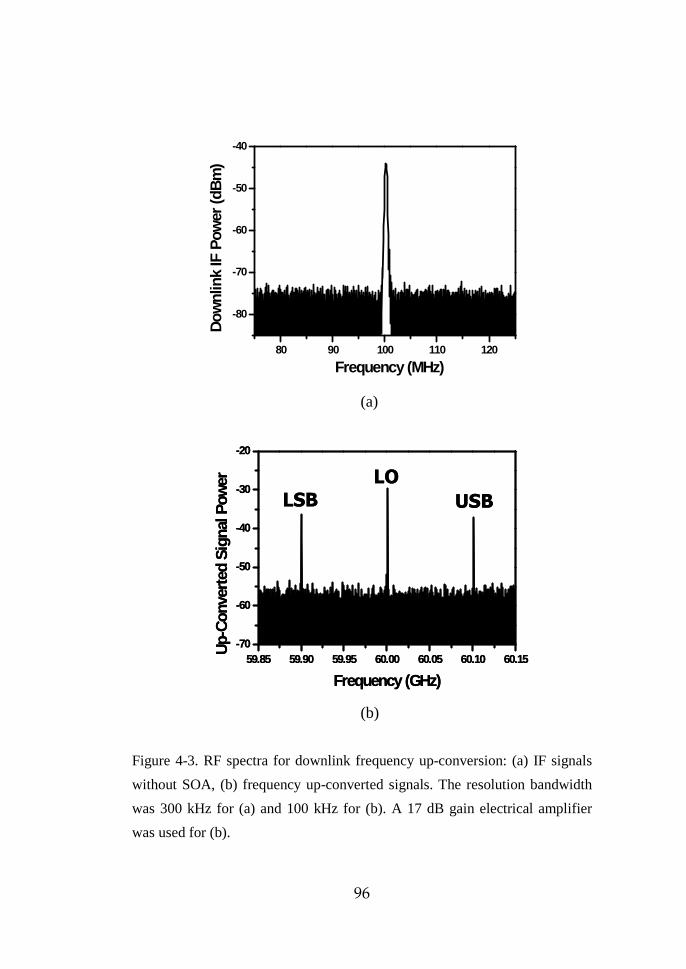
96
80 90 100 110 120
-80
-70
-60
-50
-40
Dow
nlin
k IF
Pow
er (d
Bm
)
Frequency (MHz)
(a)
59.85 59.90 59.95 60.00 60.05 60.10 60.15-70
-60
-50
-40
-30
-20
Up-
Con
vert
ed S
igna
l Pow
er
Frequency (GHz)
LSB USBLO
59.85 59.90 59.95 60.00 60.05 60.10 60.15-70
-60
-50
-40
-30
-20
Up-
Con
vert
ed S
igna
l Pow
er
Frequency (GHz)
LSB USBLO
(b)
Figure 4-3. RF spectra for downlink frequency up-conversion: (a) IF signals
without SOA, (b) frequency up-converted signals. The resolution bandwidth
was 300 kHz for (a) and 100 kHz for (b). A 17 dB gain electrical amplifier
was used for (b).

97
0 2 4 6 8 10
-60
-50
-40
-30
-20
-10
0
remote up-conversion double-sideband transmission
Nor
mal
ized
Am
plitu
de (d
B)
Distance (km)
Figure 4-4. Normalized signal amplitude of frequency up-converted signals
and calculated results of double-sideband signal transmission at 60 GHz band.
The measured up-converted signal power is normalized to the power at back-
to-back conditions.

98
4-2-2. Frequency down-conversion for uplink transmission
For frequency down-conversion, optical LO and optical IF are
injected into the SOA-EAM configuration. During the photodetection
process in EAM, signals having fLO component are generated inside
EAM. These signals are frequency mixed with RF signals (fRF, up)
externally applied to EAM due to EAM nonlinearity, causing frequency
down-conversion to fIF, up = fLO-fRF, up. The resulting fIF, up signals then
modulate optical IF signals at λIF in the same EAM, which are then sent
back to the central station. This frequency down-conversion method
was explained in chapter 3. However, with addition of SOA as in our
scheme, both frequency up-conversion and down-conversion are
possible and optical amplification by SOA results in better uplink
performance. Moreover, EAM and SOA can be monolithically
integrated [73], making the frequency converter more compact.
Although the same optical IF are used for both downlink and uplink,
this is not a problem since fIF, down and fIF, up are not the same and can be
easily separated electronically. In this frequency converter, EAM is
acting as a multi-functional device which simultaneously performs
photo-detection, frequency down-conversion, and uplink optical IF
signal modulation. Consequently, the antenna base station can be
greatly simplified.
The setup shown in Fig. 4-5 was used for frequency down-
conversion experiment. Optical LO was generated with the same
method used for frequency up-conversion, and optical IF was supplied

99
from a tunable light source. In this experiment, optical IF did not
include fIF, down so that only frequency down-conversion characteristics
for uplink can be investigated. 10 dBm 59.85 GHz signals were used as
uplink RF signals, which were applied to EAM biased at -2.5 V. Inside
EAM, 59.85 GHz signals were mixed with 60 GHz signals produced by
photodetection of optical LO and produced fIF, up= 150 MHz signals,
which then modulated optical IF. The uplink optical IF signals were
transmitted to the central station, and photodetected after optical
amplification. An optical bandpass filter having λIF passband was
inserted before PD in order to block optical LO signals at λLO delivered
to the central station. This filtering is necessary because optical LO
signals modulated by uplink RF signals can produce interfering
frequency down-converted signals at the central station [62]. Fig. 4-6(a)
and (b) respectively show the RF spectra of uplink RF signals at 59.85
GHz and frequency down-converted IF signals at 150 MHz measured
simultaneously at the central station (measured at Point C in Fig. 4.5).
Uplink RF signals is delivered to the central station at λIF because EAM
is modulated with both uplink RF signals and frequency down-
converted IF signals.
Next, the dispersion effects on remote frequency down-conversion
method are investigated using the same methods applied to remote
frequency up-conversion case. The frequency down-converted 150
MHz signals are measured according to different transmission distance,
and the results are normalized to the signal power at back-to-back

100
conditions. Fig. 4-7 shows that dispersion-induced signal fading
problems do not occur to the detected signals through the remote
frequency down-conversion. The measurement results are also
compared with the calculated signal power transmitted by double-
sideband 60 GHz signals. The same assumption was used for this
calculation, and several signal fading phenomena appear within 10 km
transmission as shown in Fig. 4-7. From these results, it is proved that
the remote frequency down-conversion technique can also provide
dispersion insensitive uplink data transmission.
DFB EOM
TLS
fLO/2, 30 GHz
optical LO (λλλλLO)
optical IF (λλλλIF)
λλλλLOLOLOLO
fLO
λλλλIFIFIFIF
Central Station
SOA EAMdownlink fiber
Base Station
fRF, upf
λλλλIF
fIF, up = fLO-fRF, up
OBPF(λλλλIF) EDFAPD uplink fiber
ffLO-fRF, up
59.85 GHz
150 MHz
fRF, up
59.85 GHz
C
DFB EOM
TLS
fLO/2, 30 GHz
optical LO (λλλλLO)
optical IF (λλλλIF)
λλλλLOLOLOLO
fLO
λλλλIFIFIFIF
Central Station
SOA EAMdownlink fiber
Base Station
fRF, upf
λλλλIF
fIF, up = fLO-fRF, up
OBPF(λλλλIF) EDFAPD uplink fiber
ffLO-fRF, up
59.85 GHz
150 MHz
fRF, up
59.85 GHz
DFB EOM
TLS
fLO/2, 30 GHz
optical LO (λλλλLO)
optical IF (λλλλIF)
λλλλLOLOLOLO
fLO
λλλλIFIFIFIF
Central Station
SOA EAMdownlink fiber
Base Station
fRF, upf
λλλλIF
fIF, up = fLO-fRF, up
OBPF(λλλλIF) EDFAPD uplink fiber
ffLO-fRF, up
59.85 GHz
150 MHz
fRF, up
59.85 GHz
C
Figure 4-5. Schematics for frequency down-conversion processes and
experimental setup used for verification.

101
59.846 59.848 59.850 59.852 59.854
-60
-50
-40
-30
-20
Upl
ink
Sig
nal P
ower
(dB
m)
Frequency (GHz)
(a)
146 148 150 152 154
-100
-90
-80
-70
-60
IF S
igna
l Pow
er (d
Bm
)
Frequency (MHz)
(b)
Figure 4-6. RF spectra for uplink frequency down-conversion: (a) RF signals
measured at the central station, (b) frequency down-converted signals
measured at the central station. The resolution bandwidth was 1 kHz for both.
A 17 dB gain electrical amplifier was used for (a), and a 20 dB gain electrical
amplifier was used for (b).

102
0 2 4 6 8 10
-60
-50
-40
-30
-20
-10
0
remote down-conversion double-sideband transmission
Nor
mal
ized
Am
plitu
de (d
B)
Distance (km)
Figure 4-7. Normalized signal amplitude of frequency down-converted signals
and calculated results of double-sideband signal transmission at 60 GHz band.
The measured down-converted signal power is normalized to the power at
back-to-back conditions.

103
4-3. Conversion Efficiency Characteristics of SOA-EAM Frequency Converters
4-3-1. Conversion efficiency definition
For electrical frequency converters, important specifications are
frequency conversion efficiency, isolation between RF and LO ports,
and intermodulation distortions caused by nonlinearity of frequency
converters [70]. Among them, frequency conversion efficiency is
essential for RF design of base stations. The conventional definition of
conversion efficiency is the RF power ratio between input signals and
frequency converted output signals. However, it is very difficult to
directly apply this definition to this frequency converter because it is
difficult to measure exact signal powers related to frequency up- and
down-conversion due to many optical components used in the scheme.
Therefore, a method to estimate frequency up- and down-conversion
efficiencies is devised.
At first, up-conversion efficiency (ηup) is defined as the ratio of
EAM photodetected frequency up-converted signal power to EAM
photodetected IF signal power. For example, the ratio of lower
sideband power in Fig. 4-3(b) to peak power in Fig. 4-3(a) is ηup. The
frequency down-conversion efficiency (ηdown) is defined as the ratio of
frequency down-converted signal power to uplink RF signal power
measured at the central station simultaneously. For example, the ratio
of peak power in Fig. 4-6(b) to peak power in Fig. 4-6(a) is ηdown. As

104
explained in chapter 4-2, the frequency down-conversion process is a
complex one involving photodetection, mixing and modulation. By
comparing fIF, up and fRF, up delivered at λIF to the central station, the
influence of EAM modulation efficiency can be eliminated, and
internal mixing efficiency of EAM can be estimated. Fig. 4-8 shows the
schematic of frequency conversion efficiencies for both up- and down-
conversion.

105
SOAλλλλLO
λλλλIF
fLO
fIF
fIFf
EAM
fLO
A
EAMλλλλLO
f
fLOB
fLO
fIF
fLO+fIFfLO-fIF
Up-Conversion Efficiency = AB
SOAλλλλLO
λλλλIF
fLO
fIF
fIFf
EAM
fLO
A
EAMλλλλLO
f
fLOB
fLO
fIF
fLO+fIFfLO-fIF
Up-Conversion Efficiency = AB
(a)
SOAλλλλLO
λλλλIF
fLO
EAMfLO-fRF
ffRF
λλλλIF
PDffRF
C D
fLO-fRF
fRF
OBPF(λλλλIF)
Down-Conversion Efficiency = CD
SOAλλλλLO
λλλλIF
fLO
EAMfLO-fRF
ffRF
λλλλIF
PDffRF
C D
fLO-fRF
fRF
OBPF(λλλλIF)
SOAλλλλLO
λλλλIF
fLO
EAMfLO-fRF
ffRF
λλλλIF
PDffRF
C D
fLO-fRF
fRF
OBPF(λλλλIF)
Down-Conversion Efficiency = CD
(b)
Figure 4-8. Schematic of frequency up-conversion efficiency (a) and
frequency down-conversion efficiency.

106
4-3-2. Measurement results of conversion efficiency
The same experimental setup shown in Fig. 4-2 and Fig. 4-5 was
used for conversion efficiency measurement. The 16 dB difference in
EAM photodetection response between 100 MHz and 60 GHz was
corrected for ηup calculation. The 5 dB difference in photodiode
response between 150 MHz and 60 GHz was also corrected for ηdown
calculation. In addition, different electrical gains were corrected for
both ηup and ηdown. The measurement was performed in back-to-back
condition.
At first, the dependence of frequency conversion efficiencies on
EAM bias condition was measured. The power of optical IF signals at
1550 nm and optical LO signals at 1553.3 nm before SOA were -8
dBm and -15 dBm, respectively. As shown in the Fig. 4-9, ηup increases
with increasing EAM reverse bias voltages, because photocurrent in
EAM increases at high reverse voltages. The dependence of
photocurrent in EAM on bias conditions is the contrary of modulation
characteristics, so that photocurrent in EAM within this bias range
increases with reverse bias voltages. However, ηdown decreases with
increasing EAM reverse bias voltages, because EAM nonlinearity is
more pronounced at low reverse voltages.
LO power influences the efficiency of frequency converters very
much, so that the dependence of frequency conversion efficiencies on
SOA input optical LO power is investigated. For this measurement, the
optical IF power at 1550 nm was set at -8 dBm, and EAM was biased at

107
-2.5 V. The wavelength of optical LO signals was 1553.3 nm. The
results were obtained at two different SOA current levels in order to see
the influence of SOA gain on conversion efficiencies. As can be seen in
Fig. 4-10(a) and (b), both ηup and ηdown increase with optical LO power.
For ηup, the increase is due to square-law beating power increase with
optical LO signals in EAM. ηdown increases because the photogenerated
LO signal power in EAM increases with optical LO power. In both
cases, the slight saturation of conversion efficiencies appears at high
optical LO power conditions due to the SOA gain saturation. When the
SOA bias increases from 100 mA to 150 mA, both frequency
conversion efficiencies improve about 10 dB, which corresponds to
about 5 dB increase in SOA optical gain.
Finally, conversion efficiencies were measured as functions of
optical IF signal power and wavelength. Fig. 4-11 shows the
conversion efficiency dependence on optical IF signal power. The
optical LO signal power at 1553.3 nm was -15 dBm, and the
wavelength of IF signals was 1550 nm. For frequency up-conversion,
the conversion efficiency decreases with increase of optical IF power.
This is due to SOA gain saturation, which causes decrease of both
cross-gain modulation efficiency and gain that optical LO signals
experience. As shown in Fig. 4-11, the conversion efficiency
dependence is very similar to SOA gain saturation characteristics. For
frequency down-conversion, the increase of optical IF power leads to
the increase of photodetected power of both frequency down-converted
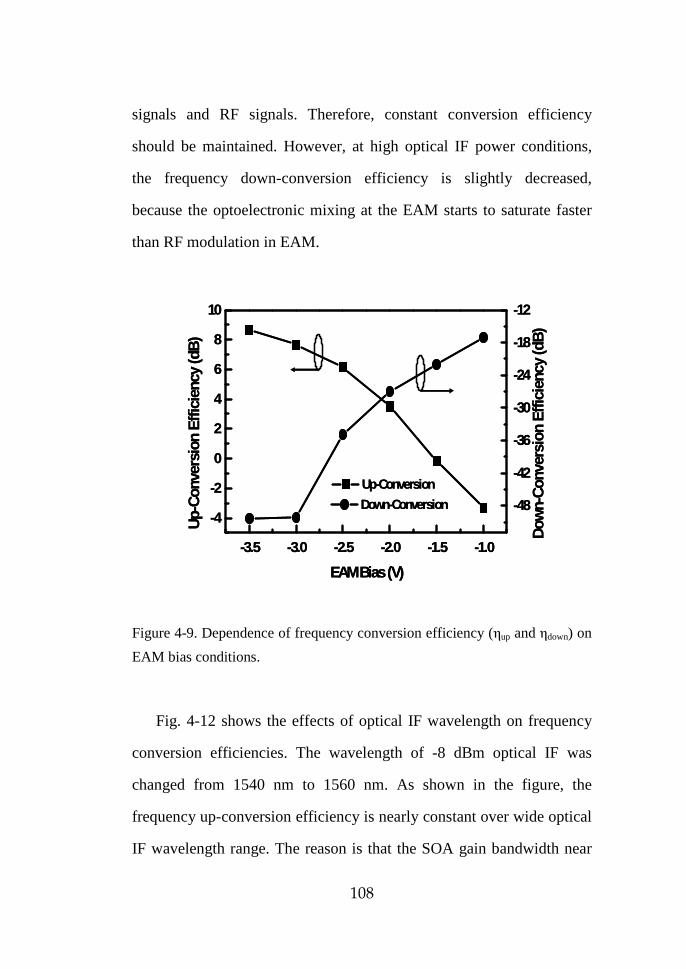
108
signals and RF signals. Therefore, constant conversion efficiency
should be maintained. However, at high optical IF power conditions,
the frequency down-conversion efficiency is slightly decreased,
because the optoelectronic mixing at the EAM starts to saturate faster
than RF modulation in EAM.
-3.5 -3.0 -2.5 -2.0 -1.5 -1.0
-4
-2
0
2
4
6
8
10
Up-Conversion
Up-
Con
vers
ion
Effic
ienc
y (d
B)
EAM Bias (V)
-48
-42
-36
-30
-24
-18
-12
Down-Conversion
Dow
n-C
onve
rsio
n Ef
ficie
ncy
(dB
)-3.5 -3.0 -2.5 -2.0 -1.5 -1.0
-4
-2
0
2
4
6
8
10
Up-Conversion
Up-
Con
vers
ion
Effic
ienc
y (d
B)
EAM Bias (V)
-48
-42
-36
-30
-24
-18
-12
Down-Conversion
Dow
n-C
onve
rsio
n Ef
ficie
ncy
(dB
)
Figure 4-9. Dependence of frequency conversion efficiency (ηup and ηdown) on
EAM bias conditions.
Fig. 4-12 shows the effects of optical IF wavelength on frequency
conversion efficiencies. The wavelength of -8 dBm optical IF was
changed from 1540 nm to 1560 nm. As shown in the figure, the
frequency up-conversion efficiency is nearly constant over wide optical
IF wavelength range. The reason is that the SOA gain bandwidth near

109
1550 nm is wide and cross-gain modulation efficiency is saturated with
this high optical IF power. On the other hand, the frequency down-
conversion efficiency varies about 4 dB. This is because the modulation
efficiency and frequency mixing in EAM are changed at different
wavelength conditions. These frequency conversion efficiency results
show that this SOA-EAM frequency converter has wide operation
wavelength range.

110
-26 -24 -22 -20 -18 -16 -14
-20
-16
-12
-8
-4
0
4
SOA Current 100mA 150mA
Up-c
onve
rsio
n Ef
ficie
ncy
(dB)
Input Optical LO Power (dBm)
(a)
-26 -24 -22 -20 -18 -16 -14-65
-60
-55
-50
-45
-40
-35
-30
SOA Current 100 mA 150 mA
Dow
n-co
nver
sion
Effi
cien
cy (d
B)
Input Optical LO Power (dBm)
(b)
Figure 4-10. Frequency up-conversion efficiency (ηup) (a), and frequency
down-conversion efficiency (ηdown) (b) as a function of optical LO signal
power. Optical LO power was measured in front of SOA.
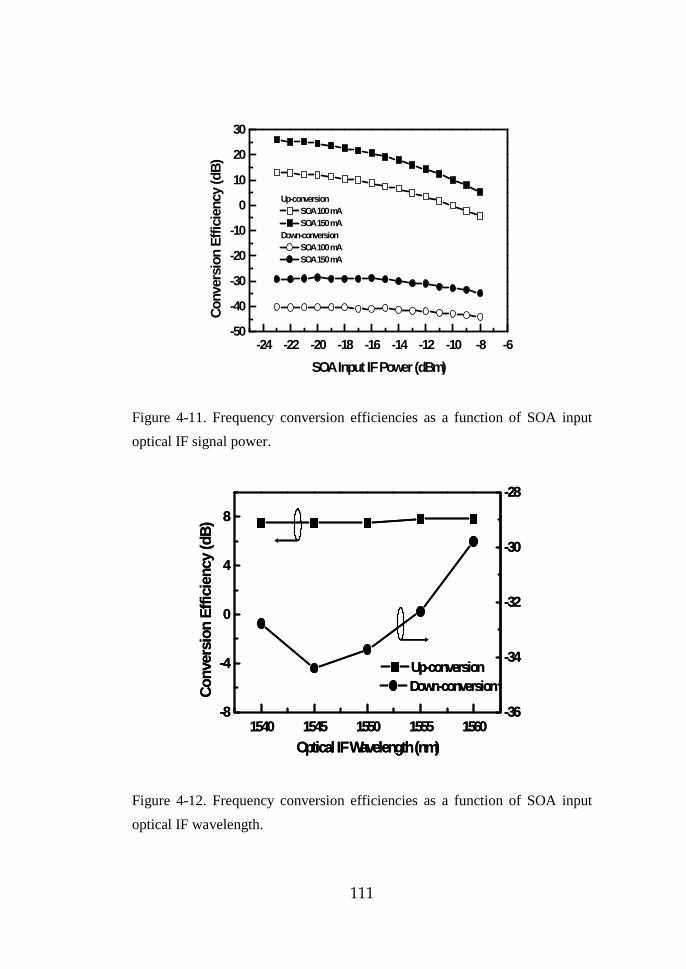
111
-24 -22 -20 -18 -16 -14 -12 -10 -8 -6-50
-40
-30
-20
-10
0
10
20
30
Up-conversion SOA 100 mA SOA 150 mA
Down-conversion SOA 100 mA SOA 150 mA
Con
vers
ion
Effic
ienc
y (d
B)
SOA Input IF Power (dBm)
Figure 4-11. Frequency conversion efficiencies as a function of SOA input
optical IF signal power.
1540 1545 1550 1555 1560-8
-4
0
4
8
Up-conversion
Con
vers
ion
Eff
icie
ncy
(dB
)
Optical IF Wavelength (nm)
-36
-34
-32
-30
-28
Down-conversion
1540 1545 1550 1555 1560-8
-4
0
4
8
Up-conversion
Con
vers
ion
Eff
icie
ncy
(dB
)
Optical IF Wavelength (nm)
-36
-34
-32
-30
-28
Down-conversion
Figure 4-12. Frequency conversion efficiencies as a function of SOA input
optical IF wavelength.

112
4-4. 60 GHz Bi-Directional RoF Systems using SOA-EAM Configuration
In previous chapters, the operation principles and conversion
efficiency characteristics of the SOA-EAM frequency converter are
investigated. Now, 60 GHz bi-directional data transmission using this
frequency converter is demonstrated. 60 GHz optical LO are
transmitted from central station, and 5 Msymbol/s data signals using
QPSK, and 16QAM digital modulation are bi-directionally transmitted.
By measuring EVMs, error-free data transmission in both directions is
verified, and the dependence of system performance on powers and
wavelengths of optical IF signals is investigated.
4-4-1. Experimental setup and data transmission results
Fig. 4-13 shows the experimental setup for 60 GHz band RoF
systems using the SOA-EAM frequency converter. 60 GHz optical
heterodyne LO signals at 1553.3 nm were generated by modulation of
an MZM biased at the minimum transmission point with 30 GHz
signals for DSB-SC method. For downlink, optical IF signals at 1550-
nm were produced by modulation of another MZM with 5 Msymbol/s
QPSK or 16QAM data at 100 MHz IF. Both optical signals were
combined and injected into the cascaded SOA-EAM, producing
frequency up-converted signals in 60 GHz band. These two sidebands
of frequency up-converted signals were frequency down-converted to
100 MHz by a subharmonic mixer with a 30 GHz electrical LO signal.

113
The EVMs of recovered IF signals were analyzed by a VSA. The SOA
was biased at 150 mA, and the EAM was biased at -2.5 V. For the
uplink data transmission, the same 5 Msymbol/s QPSK or 16QAM data
signals at 59.85 GHz were generated by up-converting 150-MHz IF
data to 59.85 GHz. The RF bandpass filter was used to suppress both
LO carrier and image signals. When the EAM was modulated by uplink
RF signals, frequency down-converted signals at 150 MHz were
produced by the SOA-EAM frequency converter, which then
modulated optical IF signals returning to the central station. In the
central station, optical IF signals were photodetected after optical
amplification and filtering, and the resulting QPSK or 16QAM data at
150 MHz were analyzed for transmission quality by VSA. All the
experiments were done in back-to-back condition with separate uplink
and downlink data transmission. It should be noted that 60 GHz band
should provide much higher bandwidth than the data bandwidth used in
this demonstration. The bandwidth in this experiment was limited by
data generation and analysis instruments available, not by the SOA-
EAM frequency converter. The proposed frequency converter should
have as wide conversion bandwidth as its optical modulation and
photodetection bandwidth. The EAM used in the experiment has 2 GHz
modulation bandwidth at 60 GHz, and SOA cross-gain modulation
bandwidth should be in GHz range as explained in chapter 2.
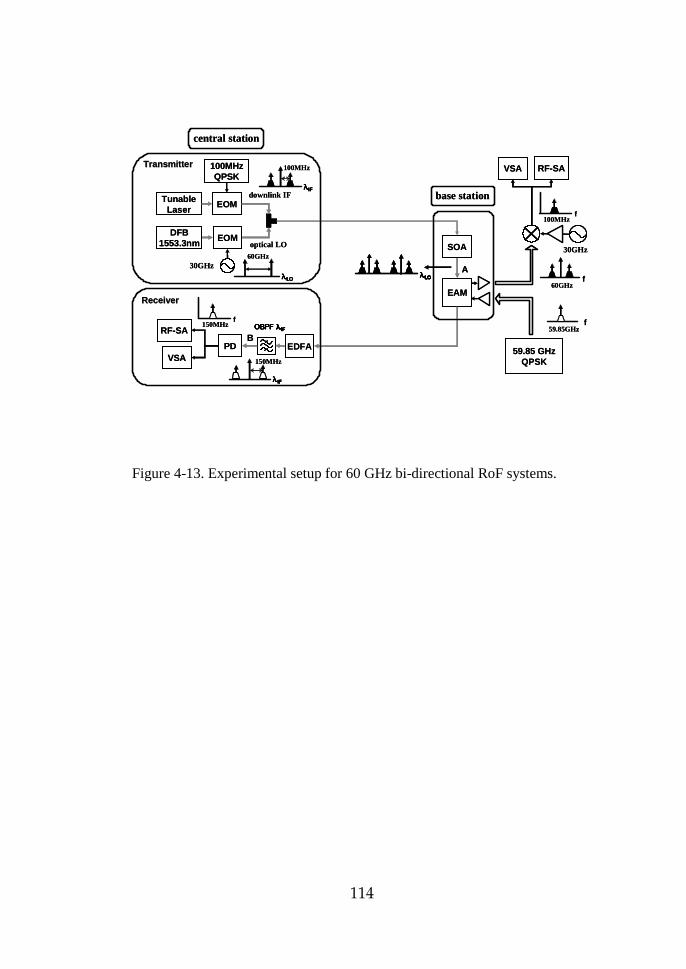
114
TunableLaser
EOM
DFB1553.3nm
100MHzQPSK
EOM
downlink IFλλλλIFIFIFIF
optical LO
λλλλLOLOLOLO
60GHzSOA
EAM
λλλλLOLOLOLO
30GHz
30GHz
VSA
60GHzf
59.85 GHzQPSK
59.85GHzf
EDFA
OBPF OBPF OBPF OBPF λλλλIFIFIFIF
PDVSA
λλλλIFIFIFIF
RF-SA
RF-SA150MHz
f
100MHzf
central station
base station
TransmitterTransmitter
ReceiverReceiver
100MHz
150MHz
A
B
TunableLaser
EOM
DFB1553.3nm
100MHzQPSK
EOM
downlink IFλλλλIFIFIFIF
optical LO
λλλλLOLOLOLO
60GHzSOA
EAM
λλλλLOLOLOLOλλλλLOLOLOLO
30GHz
30GHz
VSA
60GHzf
59.85 GHzQPSK
59.85GHzf
EDFA
OBPF OBPF OBPF OBPF λλλλIFIFIFIF
PDVSA
λλλλIFIFIFIF
RF-SA
RF-SA150MHz
f
100MHzf
central station
base station
TransmitterTransmitter
ReceiverReceiver
100MHz
150MHz
A
B
Figure 4-13. Experimental setup for 60 GHz bi-directional RoF systems.

115
λλλλIF
1548 1550 1552 1554
-35
-30
-25
-20
-15
-10
-5
0
5
DownlinkO
ptic
al P
ow
er (
dB
m)
Wavelength (nm)
λλλλLO
60GHzλλλλIF
1548 1550 1552 1554
-35
-30
-25
-20
-15
-10
-5
0
5
DownlinkO
ptic
al P
ow
er (
dB
m)
Wavelength (nm)
λλλλLO
60GHz
1548 1550 1552 1554
-35
-30
-25
-20
-15
-10
-5
0
5
DownlinkO
ptic
al P
ow
er (
dB
m)
Wavelength (nm)
λλλλLO
60GHz
(a)
1546 1548 1550 1552 1554
-50
-40
-30
-20
-10
0
10
Uplink
Op
tica
l Po
wer
(d
Bm
)
Wavelength (nm)
λλλλIF
λλλλLO
1546 1548 1550 1552 1554
-50
-40
-30
-20
-10
0
10
Uplink
Op
tica
l Po
wer
(d
Bm
)
Wavelength (nm)
λλλλIF
λλλλLO
(b)
Figure 4-14. Optical spectra of downlink signals (a) and uplink signals (b).

116
Fig. 4-14(a) and (b) show the optical spectra of downlink and
uplink signals, respectively. The downlink optical spectrum shown in
Fig. 4-14(a) was obtained from the optical signals coming out of SOA
(measured at Point A in Fig. 4-13), and 1550 nm optical IF (λIF), and
1553.3 nm optical LO (λLO) signals can be seen. The additional peaks
observed around λLO are due to modulation harmonics of the MZM
caused by DSB-SC [42-43]. The small peaks around λIF are due to
XGM between optical LO and IF signals. The uplink optical spectrum
was measured after the optical bandpass filter (λpass = 1550 nm) at the
central station (measured at Point B in Fig. 4-13). As shown in Fig. 4-
14(b), the optical LO signals are suppressed about 30 dB compared
with optical IF signals. The side peaks around λIF are the results of fRF
modulation of EAM.
The RF spectra and EVMs of frequency converted data signals
were measured. Fig. 4-15 shows the RF spectrum of frequency up-
converted downlink signals, and Fig. 4-16(a) and (b) show the clear
constellation and eye diagram of demodulated downlink QPSK and
16QAM data, respectively. For this measurement, -16.3 dBm optical
LO and -10 dBm optical IF signals were injected into SOA, and the
resulting EVM for QPSK was about 3.3 %, which corresponds to 29.6
dB SNR. The EVM for 16QAM was about 3.6 %, which corresponds to
29 dB SNR. When the wireless channel is also assumed to be AWGN
same in chapter 3, the resulting performances of both directions are
theoretically enough for error-free data transmission. The analytical

117
expressions for this calculation are well explained in [74]. Fig. 4-17
shows the 150 MHz RF spectrum of frequency down-converted uplink
signals measured at the central station, and Fig. 4-18(a) and (b) show
the clear constellation and eye diagram of demodulated uplink QPSK
and 16QAM data, respectively. With -15 dBm optical LO and -8 dBm
optical IF signals injected into SOA, the EVM for QPSK was about
7.4 %, which corresponds to 22.6 dB SNR. The EVM for 16QAM was
about 8.6 %, which corresponds to 21.2 dB SNR. These results are also
good enough for wireless systems. The reason for larger EVMs for
uplink than downlink is that the frequency down-conversion efficiency
is lower than up-conversion efficiency as explained in chapter 4-3. In
addition, two optical amplifiers, which are SOA and EDFA, affect
uplink optical IF signals, such that amplifier noise degrades system
performance. Nevertheless such larger EVMs for uplink, the results are
still good enough for real systems, and the system have rooms for better
performance. Especially, less link loss and higher conversion efficiency
design of SOA-EAM frequency converter surely lead to better system
performance.
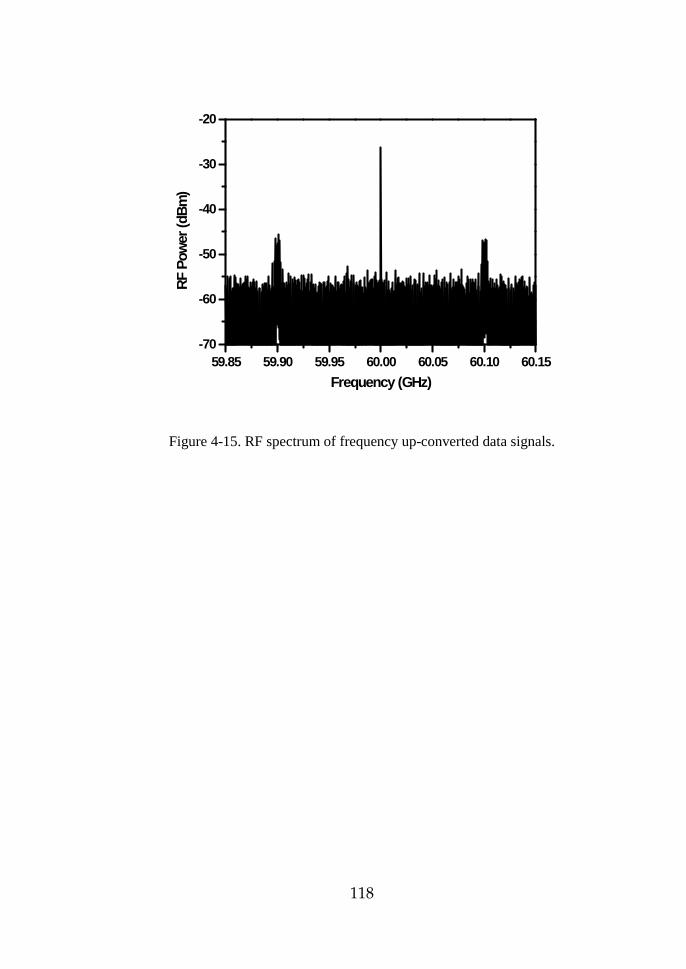
118
59.85 59.90 59.95 60.00 60.05 60.10 60.15-70
-60
-50
-40
-30
-20
RF
Pow
er (d
Bm
)
Frequency (GHz)
Figure 4-15. RF spectrum of frequency up-converted data signals.

119
(a)
(b)
Figure 4-16. Constellation and Eye diagram of demodulated downlink 5
Msymbol/s QPSK (a) and 16QAM data signals.

120
130 140 150 160 170-90
-80
-70
-60
-50
-40
RF
Pow
er (d
Bm
)
Frequency (MHz)
Figure 4-17. RF spectrum of the frequency down-converted uplink signals.
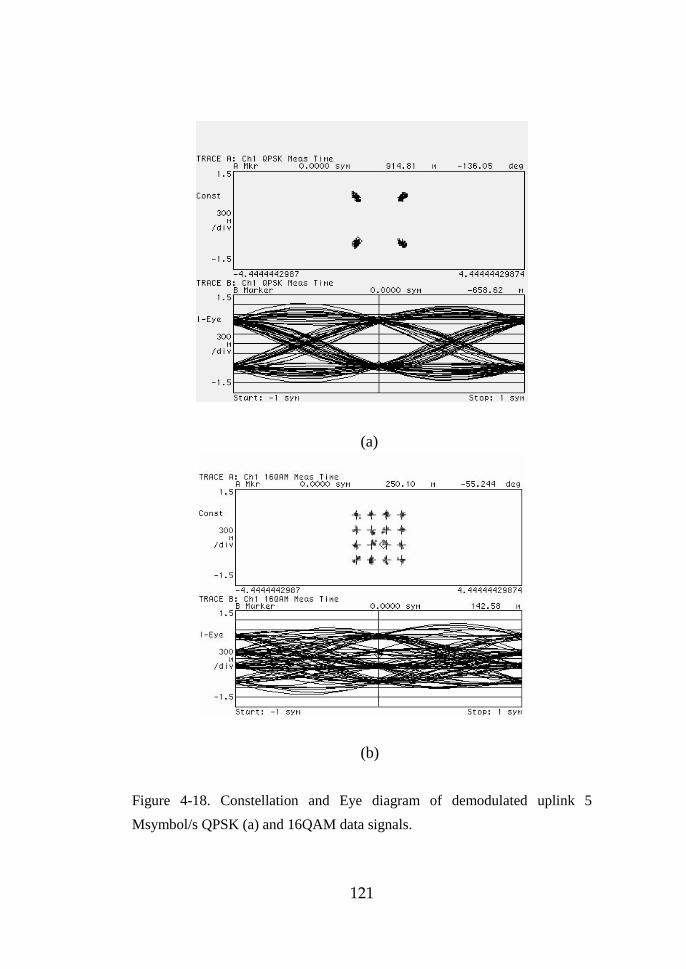
121
(a)
(b)
Figure 4-18. Constellation and Eye diagram of demodulated uplink 5
Msymbol/s QPSK (a) and 16QAM data signals.

122
EVMs for QPSK data as a function of optical IF powers before
SOA were measured for both downlink and uplink. Fig. 4-19 shows the
measurement results. The optical LO power was fixed at -16.3 dBm for
downlink and -15 dBm for uplink. As shown in the figure, downlink
EVM changes from 6 % to 3 % as optical IF power increases. This is
simply because lower optical IF power reduces XGM efficiency and
the frequency up-converted signal power. However, when optical IF
power is high, both XGM efficiency and SOA gain of optical LO
signals are saturated and, consequently, the EVM is also saturated at
around 3 %. The EVM of the uplink data transmission also decreases
from 13 % to 8 % as optical IF power increases. In uplink, the increase
in optical IF power leads to increase in the detected uplink signal power,
causing increase in SNR. Consequently, the EVM decreases until it is
saturated due to SOA gain saturation. Although large EVMs were
measured at low optical IF power conditions, their values are still good
enough for QPSK data transmission.
The dependence of EVM for QPSK data on optical IF wavelengths
was also investigated in order to identify the usable IF wavelength
range. The optical LO power was -16.3 dBm for downlink and -15
dBm for uplink, and optical IF power was -10 dBm for downlink and -8
dBm for uplink. As shown in Fig. 4-20, EVMs for both downlink and
uplink do not change very much with optical IF wavelength. This
verifies that optical IF signals having different wavelengths can be used
for accessing different base stations.

123
-22 -20 -18 -16 -14 -12 -102
4
6
8
10
12
14
downlink uplink
EVM
(%)
Optical IF Power before SOA (dBm)
Figure 4-19. Measured EVMs as a function of SOA input optical IF signal
power for downlink and uplink.
1540 1545 1550 1555 1560
3
4
5
6
7
8
Downlink Uplink
EVM
(%)
Optical IF Wavelength (nm)
Figure 4-20. Measured EVMs as a function of optical IF signal wavelength
for downlink and uplink.
124
5. Summary Millimeter-wave wireless systems have been actively investigated
for future broadband wireless systems. Especially, 60 GHz band,
available as an unlicensed band, is attracting much attention due to
wide bandwidth, frequency reusability, and high directivity. However,
the high free-space propagation loss of 60 GHz signals demands many
base stations covering small-sized cells. Consequently, simple and cost-
effective base station design becomes very important for realizing 60
GHz wireless systems. For this, RoF systems are a very attractive
solution due to low loss fiber transmission of radio signals, and
centralization of expensive 60 GHz devices and equipment. Many 60
GHz RoF architectures have been proposed, and the remote frequency
conversion scheme is a good candidate to realize 60 GHz RoF systems.
In this dissertation, 60 GHz RoF systems were demonstrated based
on remote frequency conversion techniques. For downlink data
transmission, the frequency up-conversion scheme using SOA XGM
was proposed. The optical heterodyne 60 GHz signals and optical IF
data signals are generated at the central station, and then transmitted to
the base station, where two modes of optical heterodyne signals are
cross-gain modulated by IF data signals, and then frequency up-
converted signals at 60 GHz band are generated after photodetection of
optical heterodyne signals. For uplink data transmission, the frequency
down-conversion scheme using EAM was proposed. When 60 GHz
band uplink RF signals modulate EAM along with the photodetection

125
of 60 GHz optical heterodyne signals in EAM, frequency down-
converted IF signals are produced by EAM nonlinearity. At the same
time, these signals modulate uplink optical signals delivered from the
central station, and then are transmitted back to the central station.
Therefore, uplink IF signals can be obtained after photodetection of
optical IF signals. Because EAM can act as both optical modulator and
photodetector, both frequency up- and down-conversion techniques can
be combined to SOA-EAM configuration with which two functions
simultaneously occur at the base station, resulting in the very simple
base station for bi-directional RoF links.
In chapter 2, the frequency up-conversion method using SOA was
investigated at first. The operation principles were explained, and then
simple operation characteristics were analyzed based on the SOA
simulation model using a TMM. The calculated results showed that
high conversion efficiencies are possible at wide optical wavelength
ranges. To demonstrate broadband operation of the proposed frequency
up-converter, SOA XGM bandwidth was measured and also error-free
1.244 Gbps broadband data was transmitted. Less than 0.5 dB power
penalty appears within 20 nm optical IF wavelength ranges.
Next, the frequency down-conversion method using EAM was
investigated in chapter 3. After explaining simple operation principles,
the conversion efficiency characteristics were examined based on
measurement results as functions of EAM bias conditions, optical LO
powers, and optical IF powers and wavelengths. For high conversion

126
efficiency, the EAM should be biased at around maximum modulation
efficiency conditions, and high optical LO power was necessary.
Within 30 nm wavelength ranges, very small efficiency fluctuation
appears, which is good for WDM applications. Error-free 5 Msymbol/s
QPSK uplink data transmission at 60 GHz band was also demonstrated.
Finally, the SOA-EAM configuration for both frequency up- and
down-conversion was shown in chapter 4. The combined functions
were explained, and then the conversion efficiencies as functions of
EAM bias conditions, optical LO powers, and optical IF powers and
wavelengths were measured and analyzed. The basic performances
were similar to the individual up- and down-converter, however, it
should be considered that both frequency up- and down-conversion
efficiencies could not simultaneously be high at the same EAM bias
condition. For up-conversion efficiency, high reverse bias of EAM
gave high conversion efficiency. Conversely, the down-conversion
efficiency was high at low reverse bias conditions. The dispersion
insensitive signal transmission was proved by comparing measured
results based on remote frequency conversion techniques with
theoretical 60 GHz transmission results based on double-sideband
signal modulation. Bi-directional data transmission at 60 GHz band
was also demonstrated. For both downlink and uplink, high quality
QPSK and 16QAM data transmission were succeeded. In addition, the
demodulated data performances for both directions were not varied
very much in wide operation wavelength ranges.

127
The RoF systems are very useful for 60 GHz wireless systems, and
especially the remote optical/optoelectronic frequency conversion
techniques can provide dispersion insensitive signal transmission as
well as simple system architectures. In this dissertation, it was
presented that frequency converters based on SOA and EAM are very
useful for simplifying base stations and achieving flexible bi-
directional RoF systems. Although further investigation is necessary, I
believe that the proposed methods should be an important part in RoF
system development.
128
References
[1] J. Mikkonen, C. Corrado, C. Evci, and M. Prögler, “Emerging wireless
broadband networks,” IEEE Commun. Mag., pp. 112-117, Feb. 1998.
[2] H. Izadpanah, “A millimeter-wave broadband wireless access technology
demonstrator for the next-generation internet network reach extension,”
IEEE Commun. Mag., pp. 140-145, Sep. 2001.
[3] P. Smulders, “Exploiting the 60 GHz band for local wireless multimedia
access: prospects and future directions,” IEEE Commun. Mag., pp. 140-
147, Jan. 2002.
[4] 이우용, “60GHz 밀리미터파 WPAN 기술 및 표준화,” “Ubiquitous
사회에 대비한 소출력 무선기기의 전파이용 정책 및 기술
workshop, pp. 111-126, 2005.
[5] S. E. Gunnarsson, C. Kärnfelt, H. Zirath, R. Kozhuharov, D.
Kuylenstierna, A. Alping, and C. Fager, “Highly integrated 60 GHz
transmitter and receiver MMICs in a GaAs pHEMT technology,” IEEE J.
Solid-State Circuits, vol. 40, no. 11, pp. 2174-2186, Nov, 2005.
[6] Y. Shoji, K. Hamaguchi, and H. Ogawa, “Millimeter-wave remote self-
heterodyne system for extremely stable and low-cost broad-band signal
transmission,” IEEE Trans. Microw Theory Tech., vol. 50, no. 6, pp.
1458-1468, Jun. 2002.
[7] M. Marcus, and B. Pattan, “Millimeter wave propagation: spectrum
management implications,” IEEE Microwave Mag., pp. 54-62, Jun. 2005.
[8] J. M. Payne, and W. P. Shillue, “Photonic techniques for local oscillator
generation and distribution in millimeter-wave radio astronomy,”
International Topical Meeting on Microwave Photonics, pp.9-12, Nov.
2002.
[9] A. J. Seeds, “Microwave photonics,” IEEE Trans. Microw Theory Tech.,
vol. 50, no. 3, pp. 877-887, Mar. 2002.

129
[10] H. Ogawa, D. Polifko, and S. Banda, “Millimeter-wave fiber optics
systems for personal radio communication,” IEEE Trans. Microw Theory
Tech., vol. 40, no. 12, pp. 2285-2293, Dec. 1992.
[11] L. Noël, D. Wake, D. G. Moodie, D. D. Marcenac, L. D. Westbrook,
and D. Nesset, “Novel technique for high-capacity 60 GHz fiber-radio
transmission systems”, IEEE Trans. Microw Theory Tech., vol 45, no. 8,
pp. 1416-1423, Aug. 1997.
[12] G. H. Smith, D. Novak, and C. Lim, “A millimeter-wave full-duplex
fiber-radio star-tree architecture incorporating WDM and SCM,” IEEE
Photon. Technol. Lett., vol 10, no. 10, pp. 1650-1652, Nov. 1998.
[13] H. Harada, K. Sato, and M. Fujise, “A Radio-on-Fiber based
millimeter-wave road-vehicle communication system by a code division
multiplexing radio transmission scheme,” IEEE Trans. Intell. Transp.
Syst., vol. 2, no. 4, DEC. 2001, pp. 165-179.
[14] R. Hofstetter, H. Schmuck, and R. Heidemann, “Dispersion effects in
optical millimeter-wave systems using self-heterodyne method for
transport and generation,” IEEE Trans. Microw Theory Tech., vol. 43, no.
9, pp. 2263-2269, Sep. 1995.
[15] U. Gliese, S. Nørskov, and T. N. Nielsen, “Chromatic dispersion in
fiber-optic microwave and millimeter-wave links,” IEEE Trans. Microw
Theory Tech., vol. 44, no. 10, pp. 1716-1724, Oct. 1996.
[16] H. Sotobayashi, and K. Kitayama, “Cancellation of the signal fading
for 60 GHz subcarrier multiplexed optical DSB signal transmission in
nondispersion shifted fiber using midway optical phase conjugation,” J.
Lightwave Technol., vol. 17, no. 12, pp. 2488-2497, Dec. 1999.
[17] F. Ramos, J. Marti, and V. Polo, “Compensation of chromatic
dispersion effects in microwave/milimeter-wave optical systems using
four-wave-mixing induced in dispersion-shifted fibers,” IEEE Photon.
Technol. Lett., vol. 11, no. 9, pp. 1171-1173, Sep. 1999.
[18] H. Ogawa, and Y. Kamiya, “Fiber-optical microwave transmission
using harmonic laser mixing, optoelectronic mixing and optically pumped
130
mixing,” IEEE Trans. Microw Theory Tech., vol. 39, no. 12, pp. 2045-
2051, Dec. 1991.
[19] E. Suematsu, and N. Imai, “A fiber-optic/millimeter-wave radio
transmission link using HBT as direct photodetector and an optoelectronic
upconverter,” IEEE Trans. Microw Theory Tech., vol. 44, no. 1, pp. 133-
143, Jan. 1996.
[20] C.-S. Choi, H.-S. Kang, W.-Y. Choi, D.-H. Kim, and K.-S. Seo,
“Phototransistors based on InP HEMT and their applications to
millimeter-wave radio-on-fiber systems,” IEEE Trans. Microw Theory
Tech., vol. 53, no. 1, pp. 256-263, Jan. 2005.
[21] C.-S. Choi, J.-H. Seo, W.-Y. Choi, H. Kamitsuna, M. Ida, and K.
Kurishima, “60GHz bidirectional radio-on-fiber links based on InP-
InGaAs HPT optoelectronic mixers,” IEEE Photon. Technol. Lett., vol.
17, no. 12, pp. 2721-2723, Dec. 2005.
[22] G. H. Smith, D. Novak, and Z. Ahmed, “Overcoming chromatic-
dispersion effects in fiber-wireless systems incorporating external
modulators,” IEEE Trans. Microw Theory Tech., vol. 45, no. 8, pp. 1410-
1415, Aug. 1997.
[23] M. Tsuchiya, and T. Hoshida, “Nonlinear photodetection scheme and
its system applications to fiber-optic millimeter-wave wireless down-
links,” IEEE Trans. Microw Theory Tech., vol. 47, no. 7, pp. 1342-1350,
Jul. 1999.
[24] M. Ogusu, K. Inagaki, Y. Mizuguchi, and T. Ohira, “Carrier
generation and data transmission on millimeter-wave bands using two-
mode locked fabry-perot slave lasers,” IEEE Trans. Microw Theory Tech.,
vol. 51, no. 2, pp. 382-391, Feb. 2003.
[25] L. Chao, C. Wenyue, and J. F. Shiang, “Photonic mixers and image-
rejection mixers for optical SCM systems,” IEEE Trans. Microw Theory
Tech., vol. 45, no. 8, pp. 1478-1480, Aug. 1997.
[26] J. Park, M. S. Shakouri, and K. Y. Lau, “Millimetre-wave electro-
optical upconverter for wireless digital communications,” Electron. Lett.,
vol. 31, no. 13, pp. 1085-1086, Jun. 1995.

131
[27] Q. Z. Liu, R. Davies, and R. I. MacDonald, “Experimental
investigation of fiber optic microwave link with monolithic integrated
optoelectronic mixing receiver,” IEEE Trans. Microw Theory Tech., vol.
43, no. 9, pp. 2357-2360, Sep. 1995.
[28] N. J. Frigo, P. P. Iannone, P. D. Magill, T. E. Darcie, M. M. Downs,
B. N. Desai, U. Koren, T. L. Koch, C. Dragone, H. M. Presby, and G. E.
Bodeep, “A wavelength-division multiplexed passive optical network with
cost-shared components,” IEEE Photon. Technol. Lett., vol. 6, no. 11, pp.
1365-1367, Nov. 1994.
[29] R. B. Welstand, S. A. Pappert, C. K. Sun, J. T. Zhu, Y. Z. Liu, and P.
K. L. Yu, “Dual-function electroabsorption waveguide modulator/detector
for optoelectronic transceiver applications,” IEEE Photon. Technol. Lett.,
vol. 8, no. 11, pp. 1540-1542, Nov. 1996.
[30] W. S. C. Chang, “RF photonic technology in optical fiber links,”
Cambridge Univ. Press, 2002.
[31] L. D. Westbrook, L. Noël, and D. G. Moodie, “Full-duplex, 25km
analogue fibre transmission at 120Mbit/s with simultaneous modulation
and detection in an electroabsorption modulator,” Electron. Lett., vol. 33,
no. 8, pp. 694-695, Apr. 1997.
[32] A. Stöhr, K. Kitayama, and D. Jäger, “Full-duplex fiber-optic RF
subcarrier transmission using a dual-function modulator/photodetector,”
IEEE Trans. Microw Theory Tech., vol. 47, no. 7, pp. 1338-1341, Jul.
1995.
[33] C. Rolland, K. L. Prosyk, C. M. Maritan, and N. Puertz, “High speed
and low loss, bulk electroabsorption waveguide modulators at 1.3 µm,”
IEEE Photon. Technol. Lett., vol. 3, no. 10, pp. 894-896, Oct. 1991.
[34] D. A. B. Miller, T. C. Damen, A. C. Gossard, W. Wiegmann, T. H.
Wood, and C. A. Burus, “Band-edge electroabsorption in quantum wel
structures: the quantum-confined Stark effect,” Phys. Rev. Lett., vol. 53,
no. 22, pp. 2173-2175, Nov. 1984.
[35] Y.-K. Seo, C.-S. Choi, and W.-Y. Choi, “All optical signal up-
conversion for Radio-on-Fiber applications using cross-gain modulation in

132
semiconductor optical amplifiers,” IEEE Photon. Tech. Lett., vol. 14, no.
10, pp. 1480-1450, Oct. 2002.
[36] Y.-K. Seo, J.-H. Seo, and W.-Y. Choi, “Photonic frequency up-
conversion efficiencies in semiconductor optical amplifiers,” IEEE
Photon. Tech. Lett., vol. 15, no. 5, pp. 751-753, May 2003.
[37] L. E. Richter, H. I. Mandelberg, M. S. Kruger, and P. A. McGrath,
“Linewidth determination from self-heterodyne measurements with
subcoherence delay times,” IEEE J. Quantum Electron., vol. 22, no. 11,
pp. 2070-2074, Nov. 1986.
[38] L. Goldberg, H. F. Taylor, J. F. Weller, and D. M. Bloom,
“Microwave signal generation with injection-locked laser diodes,”
Electron. Lett., vol. 19, no. 13, pp. 491-493, 1983.
[39] S. Fukushima, C. F. C. Silva, Y. Muramoto, and A. J. Seeds, “10 to
110 GHz tunable opto-electronic frequency synthesis using optical
frequency comb generator and uni-traveling-carrier photodiode,” Electron.
Lett., vol. 37, no. 12, pp. 780-781, Jun. 2001.
[40] L. N. Langley, M. D. Elkin, C. Edge, M. J. Wale, U. Gliese, X.
Huang, and A. J. Seeds, “Packaged semiconductor laser optical phase-
locked loop (OPLL) for photonic generation, processing and transmission
of microwave signals,” IEEE Trans. Microwave and Techniques, vol. 47,
no. 7, pp. 1257-1264, 1999.
[41] A. C. Bordonalli, B. Cai, A. J. Seeds, and P. J. Williams,
“Generation of microwave signals by active mode locking in a gain
bandwidth restricted laser structure,” IEEE Photon. Tech. Lett., vol. 8, no.
1, pp. 151-153, Jan. 1996.
[42] J. O’Reilly and P. Lane, “Remote delivery of video services using
mm-waves and optics,” J. Lightwave Technol., vol. 12, no. 2, pp. 369-375,
Feb. 1994.
[43] R. A. Griffin, P. M. Lane, and J. J. O’Reilly, “Dispersion-tolerant
subcarrier data modulation of optical millimeter-wave signals,” Electron.
Lett., vol. 32, no. 24, pp. 2258-2260, Nov. 1996.

133
[44] J. J. O’Reilly, P. M. Lane, M. H. Capstick, H. M. Salgado, R.
Heidemann, R. Hofstetter, and H. Schmuck, “RACE R2005: microwave
optical duplex antenna link,” J. IEE Proc., vol. 140, no. 6, pp. 385-391,
Jun. 1993.
[45] M. J. Connelly, “Semiconductor optical amplifiers,” Kluwer
Academic Publishers, 2002.
[46] H. Ghafouri-Shiraz, “Fundamentals of laser diode amplifiers,” John
Wiley & Sons, 1996.
[47] T. Durhuus, B. Mikkelsen, C. Joergensen, and K. E. Stubkjaer, “All-
optical wavelength conversion by semiconductor optical amplifiers,” J.
Lightwave Technol., vol. 14, no. 6, pp. 942-964, Jun. 1996.
[48] M. Asghari, I. H. White, and R. V. Penty, “Wavelength conversion
using semiconductor optical amplifiers,” J. Lightwave Technol., vol. 15,
no. 7, pp. 1181-1190, Jul. 1997.
[49] J.-H. Seo, Y.-K. Seo, and W.-Y. Choi, “Spurious-free dynamic range
characteristics of the photonic up-converter based on a semiconductor
optical amplifier,” IEEE Photon. Technol. Lett., vol. 15, no. 11, pp. 1591-
1593, Nov. 2003.
[50] H. Lee, H. Yoon, Y. Kim, and J. Jeong, “Theoretical study of
frequency chirping and extinction ratio of wavelength-converted optical
signals by XGM and XPM using SOA’s,” IEEE J. Quantum Electron.,
vol. 35, no. 8, pp. 1213-1219, Aug. 1999.
[51] T. Durhuus, B. Mikkelsen, and K. E. Stubkjaer, “Detailed dynamic
model for semiconductor optical amplifiers and their crosstalk and
intermodulation distortion,” J. Lightwave Technol., vol. 10, no. 8, pp.
1056-1065, Aug. 1992.
[52] P. J. Annetts, M. Asghari, and I. H. White, “The effect of carrier
transport on the dynamic performance of gain-saturation wavelength
conversion in MQW semiconductor optical amplifier,” IEEE J. Select.
Topics Quantum Electron., vol. 3, no. 4, pp. 320-329, Apr. 1997.

134
[53] G. P. Agrawal and N. A. Olsson, “Self-phase modulation and
spectral broadening of optical pulses in semiconductor laser amplifiers,”
IEEE J. Quantum Electron., vol. 25, no. 11, pp. 2297-2306, Nov. 1989.
[54] L. M. Zhang, S. F. Yu, M. C. Nowell, D. D. Marcenac, J. E. Carroll,
and R. G. S. Plumb, “Dynamic analysis of radiation and side-mode
suppression in a second-order DFB laser using time-domain large-signal
traveling wave model,” IEEE J. Quantum Electron., vol. 30, no. 6, pp.
1389-1395, Jun. 1994.
[55] A. E. Willner and W. Shieh, “Optimal spectral and power parameters
for all optical wavelength shifting: single stage, fanout, and cascadability,”
J. Lightwave Technol., vol. 13, no. 5, pp. 771-781, May 1995.
[56] G. P. Agrawal and N. K. Dutta, “Semiconductor lasers,” Van
Nostrand Reinhold, 1993.
[57] J. Yao, G. Maury, Y. L. Guennec, and B. Cabon, “All-optical
subcarrier frequency conversion using an electrooptic phase modulator,”
IEEE Photon. Tech. Lett., vol. 17, no. 11, pp. 2427-2429, Nov. 2005.
[58] Z. Jia, J. Yu, and G.-K. Chang, “All-optical 16×2.5 Gb/s WDM
signal simultaneous up-conversion based on XPM in an MOLM in ROF
systems,” IEEE Photon. Tech. Lett., vol. 17, no. 12, pp. 2724-2726, Dec.
2005.
[59] P. N. Freeman, N. K. Dutta, and J. Lopata, “Semiconductor optical
amplifier for wavelength conversion in subcarrier multiplexed systems,”
IEEE Photon. Tech. Lett., vol. 9, no. 1, pp. 46-48, Jan. 1997.
[60] D. Marcenac, and A. Mecozzi, “Switches and frequency converters
based on cross-gain modulation in semiconductor optical amplifiers,”
IEEE Photon. Tech. Lett., vol. 9, no. 6, pp. 749-751, Jun. 1997.
[61] D. S. Shin, G. L. Li, C. K. Sun, S. A. Pappert, K. K. Loi, W. S. C.
Chang, and P. K. L. Yu, “Optoelectronic RF Signal Mixing Using an
Electroabsorption Waveguide as an Integrated Photodetector/Mixer,”
IEEE Photon. Technol., Lett., vol. 12. no. 2, pp. 193-195, 2000.
[62] K. Kitayama, A. Stöhr, T. Kuri, R. Heinzelmann, D. Jäger, and Y.
Takahashi, “An approach to single optical component antenna base

135
stations for broad-band millimeter-wave fiber-radio access systems,”
Trans. Microw Theory Tech., vol. 48, no. 12, pp. 2588-2595, Dec. 2000.
[63] K. Kitayama, and R. A. Griffin, “Optical Downconversion from
Millimeter-Wave to IF-Band Over 50-km-Long Optical Fiber Link Using
an Electroabsorption Modulator,” IEEE Photon. Technol. Lett., vol. 11,
no. 2, pp. 287-289, Feb. 1999.
[64] T. Kuri, K. Kitayama, and Y. Ogawa, “Fiber-Optic Millimeter-Wave
Uplink System Incorporating Remotely Fed 60-GHz-Band Optical Pilot
Tone”, IEEE Trans. Microwave Theory Tech., vol. 47, no. 7, pp. 1332-
1337, 1999.
[65] D. A. B. Miller, D. S. Chemla, T. C. Damen, A. C. Gossard, W.
Wiegmann, T. H. Wood, and C. A. Burrus, “Electrical field dependence of
optical absorption near the band gap of quantum-well structures,” Phys.
Rev. Lett. B, vol. 32, no. 2, pp. 1043-1060, Jul. 1985.
[66] M. K. Chin, “A simple method using photocurrent and power
transmission for measuring the absorption coefficient in electroabsorption
modulators,” IEEE Photon. Technol. Lett., vol. 4, no. 8, pp. 866-869, Aug.
1992.
[67] J. Lim, Y.-S. Kang, K.-S. Choi, J.-H. Lee, S.-B. Kim, and J. Kim,
“Analysis and characterization of traveling-wave electrode in
electroabsorption modulator for radio-on-fiber application”, J. Lightwave
Technol., vol. 21, no. 12, pp. 3004-3010, Dec. 2003.
[68] J. Kim, Y.-S. Kang, Y.-D. Chung, and K.-S. Choi, “Developemnt
and RF characteristics of analog 60-GHz electroabsorption modulator
module for RF/optical conversion,” IEEE Trans. Microwave Theory
Tech., vol. 54, no. 2, pp. 780-787, 2006.
[69] J.-H. Seo, C.-S. Choi, W.-Y. Choi, Y.-S. Kang, Y.-D. Chung, and J.
Kim, “Remote optoelectronic frequency down-conversion using 60 GHz
optical heterodyne signals and electroabsorption modulator”, accepted for
publication in IEEE Photon. Technol. Lett. vol. 17, no. 5, May 2005.
[70] D. M. Pozar, “Microwave and RF design of wireless systems,” John
Wiley and Sons, Inc. 2001.

136
[71] Agilent Technologies, “Testing and troubleshooting digital RF
communications receiver design,” Application Note 1314.
[72] J.-H. Seo, C.-S. Choi, Y.-S. Kang, Y.-D. Chung, J. Kim, and W.-Y.
Choi, “SOA-EAM frequency up/down-converters for 60-GHz bi-
directional radio-on-fiber systems,” IEEE Trans. Microwave Theory
Tech., vol. 54, no. 2, pp. 959-966, 2006.
[73] K. Asaka, Y. Suzaki, Y. Kawaguchi, S. Kondo, Y. Noguchi, H.
Okamoto, R. Iga, and S. Oku, “Lossless electroabsorption modulator
monolithically integrated with a semiconductor optical amplifier and a
passive waveguide,” IEEE Photon. Technol. Lett., vol. 15, no. 5, May
2003.
[74] J. G. Proakis, “Digital Communications,” McGraw-Hill, fourth
edition, 2001.

137
Publication Lists
International Journals [1] Jun-Hyuk Seo, Young-Kwang Seo, Woo-Young Choi, “1.244Gbps data distribution in 60GHz remote optical frequency up-conversion systems,” accepted for publication in IEEE Photonics Technology Letters. [2] Jun-Hyuk Seo, Chang-Soon Choi, Woo-Young Choi, Young-Shik Kang, Yong-Duk Jung, and Jeha Kim, “SOA-EAM frequency up/down-converters for 60-GHz bi-directional Radio-on-Fiber systems,” IEEE Transactions on Microwave Theory and Techniques, vol. 4, no. 2, pp. 959-966, Feb. 2006. [3] Chang-Soon Choi, Jun-Hyuk Seo, Woo-Young, Choi, Hideki Kamitsuna, Minoru Ida, and Kenji Kurishima, “60GHz bidirectional Radio-on-Fiber links based on InP-InGaAs HPT optoelectronic mixers,” IEEE Photonics Technology Letters, vol. 17, no. 12, pp. 2721-2723, Dec. 2005. [4] Jun-Hyuk Seo, Chang-Soon Choi, Woo-Young Choi, Young-Shik Kang, Yong-Duk Jung, and Jeha Kim, “Remote Optoelectronic Frequency Down-Conversion using 60 GHz Optical Heterodyne Signals and an Electroabsorption Modulator,” IEEE Photonics Technology Letters, vol. 17, no. 5, pp. 1073-1075, May 2005. [5] Jun-Hyuk Seo, Young-Kwnag Seo, and Woo-Young Choi, “Spurious Free Dynamic Range Characteristics of the Photonic Up-Converter Based on a Semiconductor Optical Amplifier,” IEEE Photonics Technology Letters, vol. 15, no. 11, Nov. 2003. [6] Young-Kwang Seo, Jun-Hyuk Seo, and Woo-Young Choi, “60-GHz Radio-On-Fiber Distribution of 2 x 622 Mb/s WDM Channels Using Remote Photonic-Frequency Upconversion,” Microwave and Optical Technology Letter, vol. 39, no. 3, pp. 201-203, Nov. 2003. [7] Young-Kwang Seo, Jun-Hyuk Seo, and Woo-Young Choi, “Photonic Frequency-Upconversion Efficiencies in Semiconductor

138
Optical Amplifiers,” IEEE Photonics Technology Letters, vol. 15, no. 5, pp. 751-753, May 2003. [8] Jun-Hyuk Seo, Young-Kwang Seo, and Woo-Young Choi, “Nonlinear Distortion Suppression in Directly Modulated Distributed Feedback Lasers by Sidemode Optical Injection Locking,” Japanese Journal of Applied Physics, vol.41, no.2A, pp. L136-L138, Feb. 2002. International Conferences [1] Jun-Hyuk Seo, and Woo-Young Choi, “Gigabit transmission in 60-GHz-band using optical frequency up-conversion by semiconductor optical amplifier and photodiode configuration,” accepted for publication in IEEE International Microwave Symposium, 2006. [2] Jae-Young Kim, Jun-Hyuk Seo, Woo-Young Choi, Hideki Kamitsuna, Minoru Ida, and Kenji Kurishima, “60GHz Radio-on-Fiber systems using optically injection-locked self oscillating optoelectronic mixers based on InP/InGaAs HPTs,” Conference on Optical Fiber Communications, OWG6, 2006. [3] Jun-Hyuk Seo, Chang-Soon Choi, Woo-Young Choi, Young-Shik Kang, Yong-Duk Jung, and Jeha Kim, “Conversion efficiency of EAM optoelectronic frequency down-converters,” General Assembly of International Union of Radio Science, pp. 23-29, 2005. [4] Jun-Hyuk Seo, Chang-Soon Choi, Woo-Young Choi, Young-Shik Kang, Yong-Duk Jung, and Jeha Kim, “Conversion efficiency characteristics of cascaded SOA-EAM frequency up/down-converters,” IEEE International Topical Meeting on Microwave Photonics, pp. 107-110, 2005. [5] Chang-Soon Choi, Jun-Hyuk Seo, Woo-Young, Choi, Hideki Kamitsuna, Minoru Ida, and Kenji Kurishima, “Radio-on-fiber downlink transmission systems based on optically controlled InP/InGaAs HPT oscillators,” IEEE International Topical Meeting on Microwave Photonics, pp. 333-336, 2005.

139
[6] Jun-Hyuk Seo, Chang-Soon Choi, Woo-Young Choi, Young-Shik Kang, Yong-Duk Jung, and Jeha Kim, “Bi-directional 60 GHz Radio-on-Fiber Systems using Cascaded SOA-EAM Frequency Up/Down-converters,” IEEE International Microwave Symposium, pp. 3-6, 2005. [7] Chang-Soon Choi, Jun-Hyuk Seo, Woo-Young Choi, Hideki Kamitsuna, Minoru Ida, and Kenji Kurishima, “Radio-on-fiber downlink transmission systems based on optically controlled InP/InGaAs HPT oscillators,” IEEE International Microwave Symposium, pp. 11-14, 2005. [8] Jun-Hyuk Seo, Chang-Soon Choi, Woo-Young, Choi, Young-Shik Kang, Yong-Duck Chung, and Jeha Kim, “Cascaded SOA-EAM configuration for millimeter-wave frequency up/down-conversion,” The 8th Korea-Japan Joint Workshop on Microwave and Millimeter-wave Photonics, pp. 35-38, 2005. [9] Chang-Soon, Choi, Jun-Hyuk Seo, Dae-Hyun Kim, Kwang-Seok Seo, and Woo-Young Choi, “Radio-on-fiber downlink systems based on InP HEMT oscillators,” 8th International Topical Workshop on Contemporary Photonic Technologies, pp. 72-73, 2005. [10] Jun-Hyuk Seo, Chang-Soon Choi, Woo-Young Choi, Young-Shik Kang, Yong-Duk Jung, and Jeha Kim, “Frequency Conversion with Cascaded SOA-EAM for Bi-directional Radio-on-Fiber Systems,” IEEE International Topical Meeting on Microwave Photonics, pp. 56-59, 2004 [11] Jun-Hyuk Seo, Young-Kwang Seo, and Woo-Young. Choi, “Nonlinear Characteristics of an SOA Photonic Frequency Up-Converter,” IEEE International Topical Meeting on Microwave Photonics, pp.109-112, 2003. [12] Young-Kwang Seo, Jun-Hyuk Seo, Chang-Soon Choi and Woo-Young Choi, “WDM/Radio-on-Fiber Distribution Using Remote Photonic Frequency-Upconversion,” 6th Int. Symposium on Contemporary Photonics Technology, pp. 115-116, 2003. [13] Young-Kwang Seo, Jun-Hyuk Seo, Chang-Soon Choi, and Woo-Young Choi, “Remote Photonic Frequency-Upconversion using a
140
Semiconductor Optical Amplifier for WDM /Broadband Radio-on-Fiber Links,” The 4th Korea-Japan Joint Workshop on Microwave-Photonics, pp. 201-205, 2003. [14] Young-Kwang Seo, Jun-Hyuk Seo, and Woo-Young Choi, “All-Optical Frequency Up-conversion Using a Semiconductor Optical Amplifier,” IEEE International Topical Meeting on Microwave Photonics, pp.117-120, 2002. [15] Woo-Young Choi, Ki-Hyuk Lee, Hyun-Yong Choi, and Jun-Hyuk Seo, “Analysis and Suppression of Dynamic Nonlinear Distortions in Semiconductor Laser Diodes (Invited Paper),” 5th International Symposium on Contemporary Photonics Technology, pp. 151-154, 2002. [16] Young-Kwang Seo, Jun-Hyuk Seo, and Woo-Young Choi, “Enhancement of Locking Bandwidth in DFB Lasers by Side-Mode Injection-Locking,” OECC/IOOC 2001 Conference Incorporating ACOFT, pp. 547-548, 2001. [17] Jun-Hyuk Seo, Young-Kwang Seo, and Woo-Young Choi, “Nonlinear Distortion Suppression in Directly Modulated DFB Lasers by Sidemode Optical Injection,” IEEE International Microwave Symposium, pp. 555-558, 2001. [18] Jun-Hyuk Seo, Young-Kwang Seo and Woo-Young Choi, “Nonlinear Distortion Suppression in Directly Modulated DFB-LDs by Sidemode Optical Injection,” The 2nd Korea-Japan Joint Workshop on Microwave-Photonics, pp. 59-62, 2001.
Domestic Journals [1] 서준혁서준혁서준혁서준혁, 최우영, “Microwave Photonics 연구실,” 광학과 기술, vol. 7, no. 4, pp.53-62, Oct. 2003. [2] 서준혁서준혁서준혁서준혁, 최우영, “헤테로다인 기법을 이용한 광 밀리미터파 신호 생성,” 광학과 기술, pp. 5-11, Jan. 2001.
141
Domestic Conferences [1] 김재영, 서준혁서준혁서준혁서준혁, 최우영, Hideki Kamitsuna, Minoru Ida, and Kenji Kurishima, “InP HPT 기반 OIL-SOM 의 광전 주파수 상향변환 특성,” Photonics Conference, pp. 15-16, 2005. [2] 서준혁서준혁서준혁서준혁, 최창순, 강영식, 정용덕, 김제하, 최우영, “Bi-directional millimeter-wave radio-on-fiber systems using SOA-EAM frequency converters,” 광전자 및 광통신 학술회의, vol. 12, no. 1, pp. 35-36, 2005. [3] 서준혁서준혁서준혁서준혁, 최창순, 최우영, 강영식, 정용덕, 김제하, “60GHz Uplink Radio-on-Fiber Systems using Frequency Down-Conversion of Electroabsorption Modulator,” Photonics Conference, T2B4, 2004. [4] 안정환, 서영광, 서준혁서준혁서준혁서준혁, 최우영, “SOA 광학적 주파수 상향 변환기를 사용한 155Mbps 급 Radio-on-Fiber 시스템의 Bit Error Rate 특성,” 광전자 및 광통신 학술회의, pp.261-262, 2004. [5] 서준혁서준혁서준혁서준혁, 최창순, 최우영, 강영식, 정용덕, 김제하, “전계흡수 변조기를 이용한 광학적 주파수 상/하향 변환기,” 광전자 및 광통신 학술회의, pp.237-238, 2004. [6] 서준혁서준혁서준혁서준혁, 최우영, “Radio over fiber technology,” 한국통신학회 하계종합학술발표회, 2004. [7] 박성권, 서준혁서준혁서준혁서준혁, 서영광, 최우영, “SCM 신호의 SOA-XGM 파장변환에서의 상호변조왜곡 분석,” Photonics Conference, pp.743-745, 2003. [8] 서준혁서준혁서준혁서준혁, 서영광, 최우영, “반도체 광 증폭기를 이용한 광학적 주파수 상향 변환기의 비선형 특성,” 광전자 및 광통신 학술회의, pp. 453-454, 2003. [9] 최창순, 강효순, 서영광, 서준혁서준혁서준혁서준혁, 최우영, 장경철, 김대현, 서광석, “60GHz Broadband Up-conversion using Metamorphic HEMT as a Harmonic Optoelectronic Mixer,” Photonics Conference, pp. 83-84, 2002.

142
[10] 서준혁서준혁서준혁서준혁, 서영광, 최우영, “SOA 의 XGM 을 이용한 광학적 주파수 상향 변환 방법의 변환 효율 분석,” Photonics Conference, pp. 227-228, 2002. [11] 서영광, 서서서서준혁준혁준혁준혁, 최창순, 최우영, “Remote Photonic Frequency-Upconversion 을 이용한 WDM/Radio-on-Fiber Distribution,” Photonics Conference, pp. 569-560, 2002. [12] 서준혁서준혁서준혁서준혁, 서영광, 최창순, 최우영, “반도체 광 증폭기의 상호 이득 변조를 이용한 전광 주파수 상향 변환,” 광전자 및 광통신 학술회의, pp. 269-270, 2002. [13] 최우영, 이기혁, 서준혁서준혁서준혁서준혁, “반도체 레이저의 비선형성 분석 (Analysis and Suppression of Dynamic Nonlinear Distortions in Semiconctor Laser Diodes) (Invited Paper),” 한국광학회 제 13 회 정기총회 및 동계학술발표회, pp. 8-9, 2002. [14] 서준혁서준혁서준혁서준혁, 최우영, “Optically Injection Locked 된 DFB 레이저에서 왜곡 성분 감소의 광 주입 파장 의존성,” Photonics Conference, pp. 385-386, 2001. [15] 서준혁서준혁서준혁서준혁, 서영광, 최우영, “Sidemode Optical Injection 을 이용한 직접 변조된 DFB 레이저의 Second Harmonic Distortion 의 억제,” Photonics Conference, pp. 443-444, 2000. Patents [1] 최우영, 최창순, 서준혁서준혁서준혁서준혁, 김재영, “광 검출 트랜지스터를 구비한 ROF 시스템/Radio on fiber system with photo detection transistor,” 특허 출원번호 10-2006-0025937호, 출원일: 2006.03.22. [2] 서준혁서준혁서준혁서준혁, 최창순, 최우영, “양방향 광섬유기반 무선전송 시스템용 주파수 변환방법 및 장치/Frequecny converting method and apparatus for bi-directional radio-on-fiber systems,” 특허 출원번호 10-2004-0092391호, 출원일 2004.11.12.

143
Awards [1] 우수우수우수우수 논문상논문상논문상논문상: 서준혁서준혁서준혁서준혁, 최창순, 강영식, 정용덕, 김제하, 최우영, “SOA-EAM 주파수 변환기를 이용한 양방향 밀리미터파 Radio-on-Fiber 시스템,” 제 12 회 광전자 및 광통신 학술회의, 2005, 대구 EXCO. [2] First Place, Open Forum Presentations: Jun-Hyuk Seo "Frequency Conversion with Cascaded SOA-EAM for Bi-directional Radio-on-Fiber Systems" IEEE International Topical Meeting on Microwave Photonics 2004, Ogunquit, Maine, USA. [3] 우수우수우수우수 논문상논문상논문상논문상: 서준혁서준혁서준혁서준혁, 최우영, "Optically Injection Locked 된 DFB 레이저에서 왜곡 성분 감소의 광 주입 파장 의존성," Photonics Conference 2001, 설악한화리조트.
Top Related