


Languages
Pages
Legal


Page 1 of 19
Remarks of Randy Horton, Ph.D., P.E. Planning Manager
Transmission Planning – Stability and Special Studies Southern Company Services, Inc.
Birmingham, AL
Chairman Bay, Commissioners, FERC staff, and fellow panelists.
My name is Randy Horton, and I am the Manager of the Transmission Planning – Stability and
Special Studies group at Southern Company Services in Birmingham, AL. I earned the PhD
degree in electrical engineering from the University of Alabama, the Master of Electrical
Engineering (M.E.E.) degree from Auburn University and the Bachelor of Science in Electrical
Engineering (B.S.E.E.) degree from the University of Alabama at Birmingham, all with
specialization in electric power systems. I have over 17 years of experience in modeling and
simulation of protection systems, transients and power quality phenomenon. Additionally, I am
a Senior Member of the Institute of Electrical and Electronics Engineers (IEEE) and have held
leadership positions in various working groups including: Secretary of IEEE Std. 519 Working
Group, Secretary of IEEE Flicker Task Force and Chair of the IEEE Working Group on Field
Measured Overvoltages and Their Analysis. Thank you for the opportunity to share my thoughts
with you today regarding the proposed TPL-007-1 standard.
1.0 Introduction Over the past several years, NERC and the electric utility industry have made significant
progress in understanding and addressing the reliability risk that geomagnetic disturbance
(GMD) events pose to the bulk-power system. The proposed TPL-007-1 is an important addition
to the body of Reliability Standards for the North American electric grid. This standard is based
on the most advanced information available, and is supported by rigorous scientific and technical
analysis. The standard is key in that it focuses on protection against wide-spread Bulk Electric
System concerns, such as voltage collapse, Cascading, or uncontrolled islanding, thereby adding
to the overall resiliency of the grid. For these reasons, the Southern Companies encourage the
Commission to approve the proposed TPL-007-1 standard as submitted. Approving the standard
now provides applicable entities with the regulatory certainty needed to move forward with these
Page 2 of 19
important assessments while encouraging applicable entities, manufacturers and vendors to
develop risk mitigation solutions. The Southern Companies also support the Commission’s
objectives for continued research and development efforts regarding GMD impacts to reliability.
My testimony here today will focus on harmonics and vibrational effects during benchmark
GMD events. There are three main points that I would like to make, and they are:
• more work is needed to develop commercially available computer modeling tools that
can be used to assess the harmonic impacts of benchmark GMD events;
• vibration and audible noise do not appear to be damaging to transformers, and do not
need to be considered in the assessment process. Additionally, models and commercially
available computer model tools do not currently exist;
• analysis of protection systems is an important aspect of assessing the impact of
benchmark GMD events on the bulk-power system; however, without the proper tools
and expertise such analysis can be unwieldy, and can yield erroneous results (either
overly optimistic or overly pessimistic).
The following technical discussion will be used to support these important considerations.
2.0 Harmonics and Vibrational Effects During Benchmark GMD Events
2.1 State of Knowledge and Modeling Capability Regarding Harmonics and Vibrational Effects
Analysis capability for assessing the impacts of harmonics created by non-linear loads and other
system components on the bulk-power system is mature. Both frequency-domain and time-
domain techniques and computer tools exist to perform harmonics analysis, and such tools have
existed for decades. However, the assessment of harmonics created by an extreme GMD event
presents some significant challenges that must be resolved by the industry before such studies
can be done on a large scale such as required for benchmark GMD assessments. The following
remarks describe the current modeling capability of the industry and some of the challenges
associated with assessing the harmonic impacts of extreme GMD events.
Page 3 of 19
2.1.1 Frequency-Domain Analysis
Harmonics analysis of the bulk-power system is commonly performed using frequency-domain
techniques. This modeling technique is less complex than time-domain simulation, and assumes
that the system is operating in the steady-state. The harmonic current injection of harmonic
producing element (e.g. transformer experiencing half-cycle saturation) is modeled using an
ideal current source.
There are numerous computer tools available to perform harmonics analysis in the frequency-
domain including many of the time-domain tools that will be listed in the following section.
Specific frequency domain tools include (but are not limited to): Siemens SINCAL, ETAP,
OpenDSS, DIgSILENT, SuperHarm and others.
Although frequency-domain analysis is the most common harmonics analysis technique, there
are some important difficulties and modeling gaps when the method is used to the assess the
harmonic impact of a benchmark GMD event. Such issues include (but are not limited to):
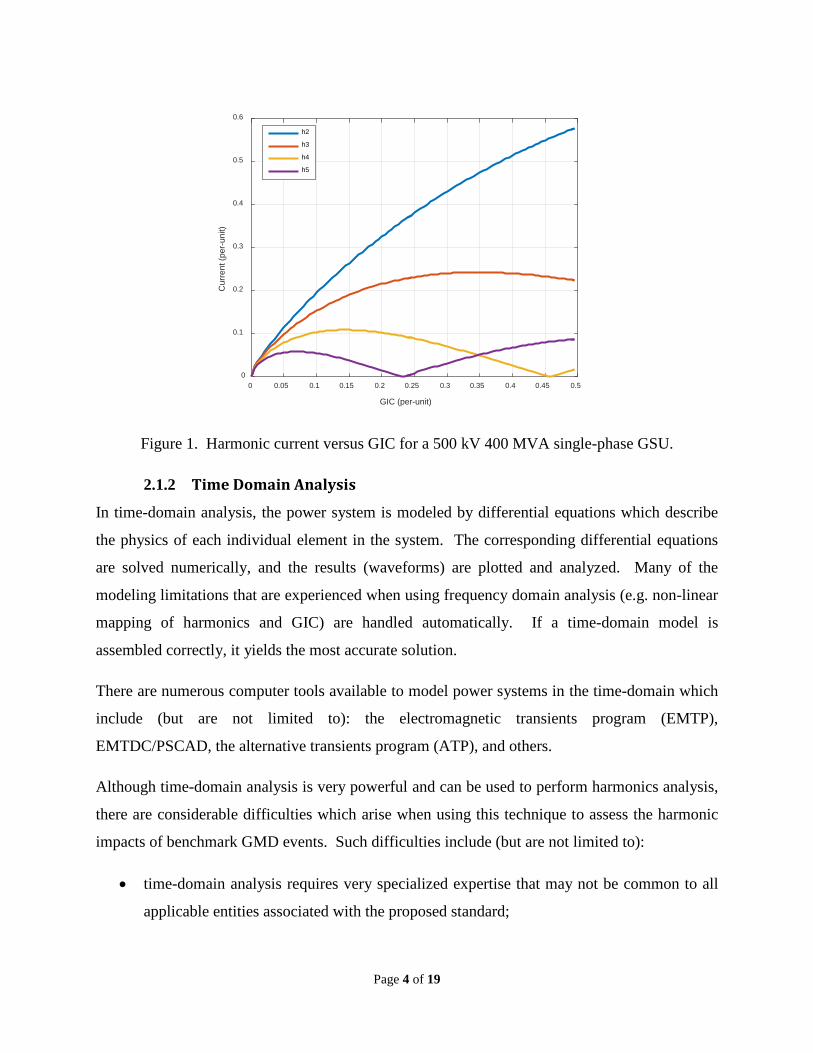
• the effective GIC flow in all transformers in the network must be known beforehand , and
a non-linear mapping between GIC and the harmonics that are created due to half –cycle
saturation is required (see single-phase 500 kV GSU example in Figure 1). This
capability is not currently offered in any commercially available computer tools.
• the magnitude and phase angle of the injected harmonic currents is affected by local
voltage distortion; thus, the harmonic current injection of the transformer cannot, in a
strict sense, be modeled as an ideal current source, and; thus, an iterative technique must
be employed. This capability is not currently offered in any commercially available
computer tools.
• because transformers subjected to GIC inject zero sequence harmonics, standard positive
sequence power flow data cannot be used alone as a basis for assembling the system
model.
• harmonic resonance created by shunt capacitor banks, and the damping effects of load
must be considered. When large geographic areas are studied such as required for
benchmark GMD events, considering such effects can be extremely difficult and requires
a considerable amount of expertise and engineering judgement.
Page 4 of 19
Figure 1. Harmonic current versus GIC for a 500 kV 400 MVA single-phase GSU.
2.1.2 Time Domain Analysis
In time-domain analysis, the power system is modeled by differential equations which describe
the physics of each individual element in the system. The corresponding differential equations
are solved numerically, and the results (waveforms) are plotted and analyzed. Many of the
modeling limitations that are experienced when using frequency domain analysis (e.g. non-linear
mapping of harmonics and GIC) are handled automatically. If a time-domain model is
assembled correctly, it yields the most accurate solution.
There are numerous computer tools available to model power systems in the time-domain which
include (but are not limited to): the electromagnetic transients program (EMTP),
EMTDC/PSCAD, the alternative transients program (ATP), and others.
Although time-domain analysis is very powerful and can be used to perform harmonics analysis,
there are considerable difficulties which arise when using this technique to assess the harmonic
impacts of benchmark GMD events. Such difficulties include (but are not limited to):
• time-domain analysis requires very specialized expertise that may not be common to all
applicable entities associated with the proposed standard;
0 0.05 0.1 0.15 0.2 0.25 0.3 0.35 0.4 0.45 0.5
GIC (per-unit)
0
0.1
0.2
0.3
0.4
0.5
0.6
Cur
rent
(per
-uni
t)
h2
h3
h4
h5
Page 5 of 19
• time-domain models are very detailed and labor intensive to construct. Creating models
large enough to simulate the effects of a benchmark GMD event would be unwieldy;
• there are modeling gaps with regards to transformers subjected to geomagnetically
induced current (GIC). Time-domain models of single-phase transformers are mature,
and in general, the necessary parameter data (e.g. short circuit impedance, saturation
characteristic, air-core reactance, etc.) are available or can be estimated from nameplate
data. However, both models and the necessary parameter data for three-phase
transformers are limited. There are some models available, but some of the input data is
either not available or difficult to estimate (for example the zero sequence magnetizing
reactance of three-phase, three-legged core transformers).
2.1.3 Important Considerations in Modeling Harmonic Impacts of Benchmark
GMD Events
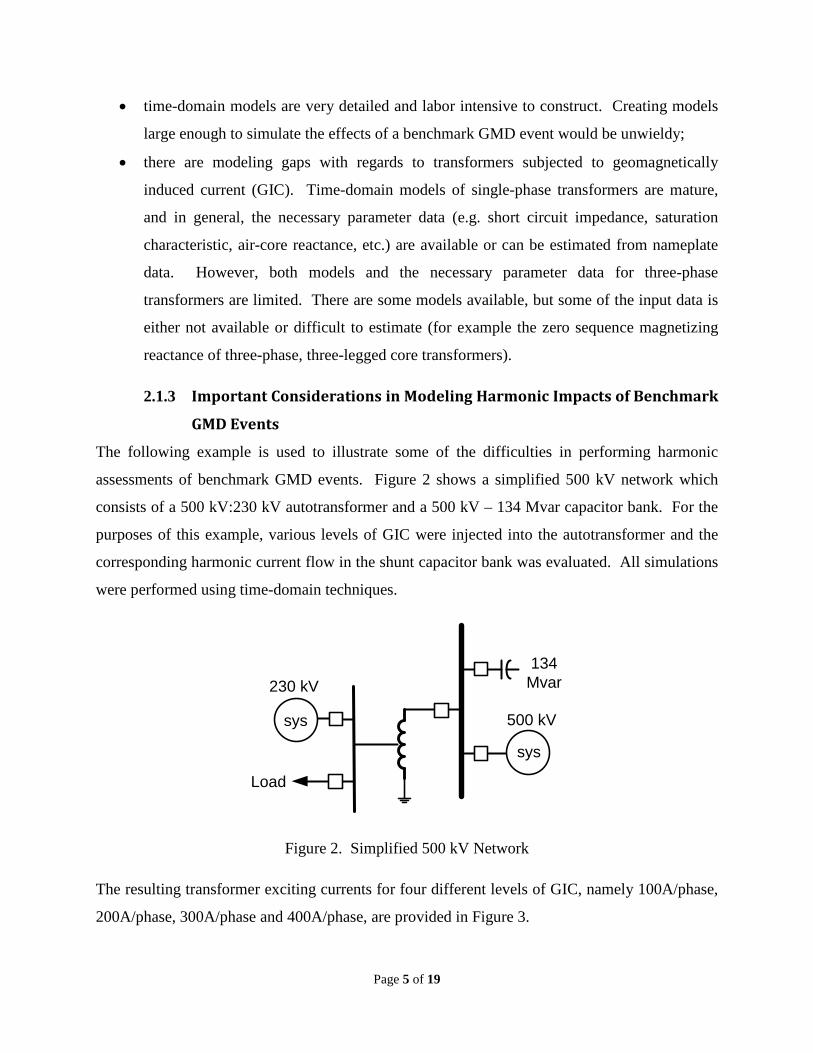
The following example is used to illustrate some of the difficulties in performing harmonic
assessments of benchmark GMD events. Figure 2 shows a simplified 500 kV network which
consists of a 500 kV:230 kV autotransformer and a 500 kV – 134 Mvar capacitor bank. For the
purposes of this example, various levels of GIC were injected into the autotransformer and the
corresponding harmonic current flow in the shunt capacitor bank was evaluated. All simulations
were performed using time-domain techniques.
Figure 2. Simplified 500 kV Network
The resulting transformer exciting currents for four different levels of GIC, namely 100A/phase,
200A/phase, 300A/phase and 400A/phase, are provided in Figure 3.
500 kV
sys
sys
Load
230 kV134 Mvar
Page 6 of 19
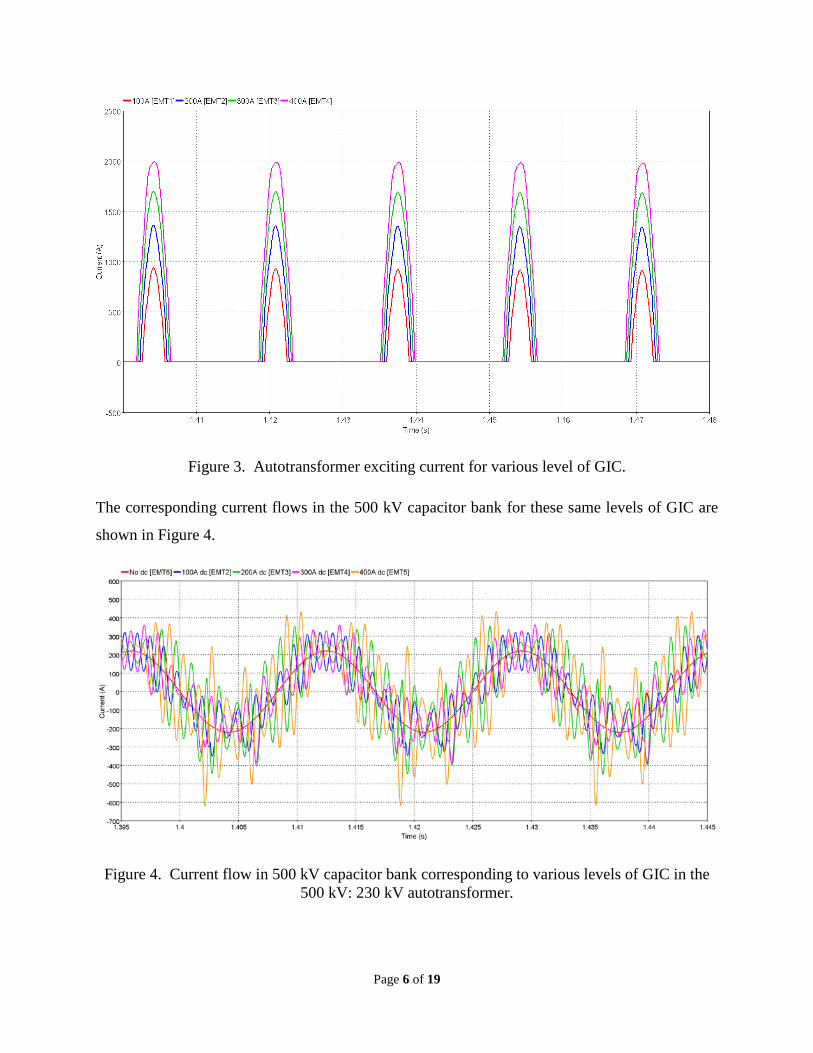
Figure 3. Autotransformer exciting current for various level of GIC.
The corresponding current flows in the 500 kV capacitor bank for these same levels of GIC are
shown in Figure 4.
Figure 4. Current flow in 500 kV capacitor bank corresponding to various levels of GIC in the 500 kV: 230 kV autotransformer.

Page 7 of 19
Fourier methods were employed to obtain the harmonic content of the capacitor bank currents.
The results of this analysis are provided in Figure 5.
Figure 5. FFT of capacitor bank current for various levels of GIC in autotransformer
The addition of the capacitor bank creates a harmonic resonance between the 12th and 13th
harmonics. The effects of the resonance are clearly seen in Figure 5. Because of the resonance,
significant higher order harmonics are absorbed by the capacitor bank. Another important
observation is that the harmonic current absorption of the capacitor bank appears to be non-
linear, meaning that higher levels of harmonics are not always experienced with higher levels of
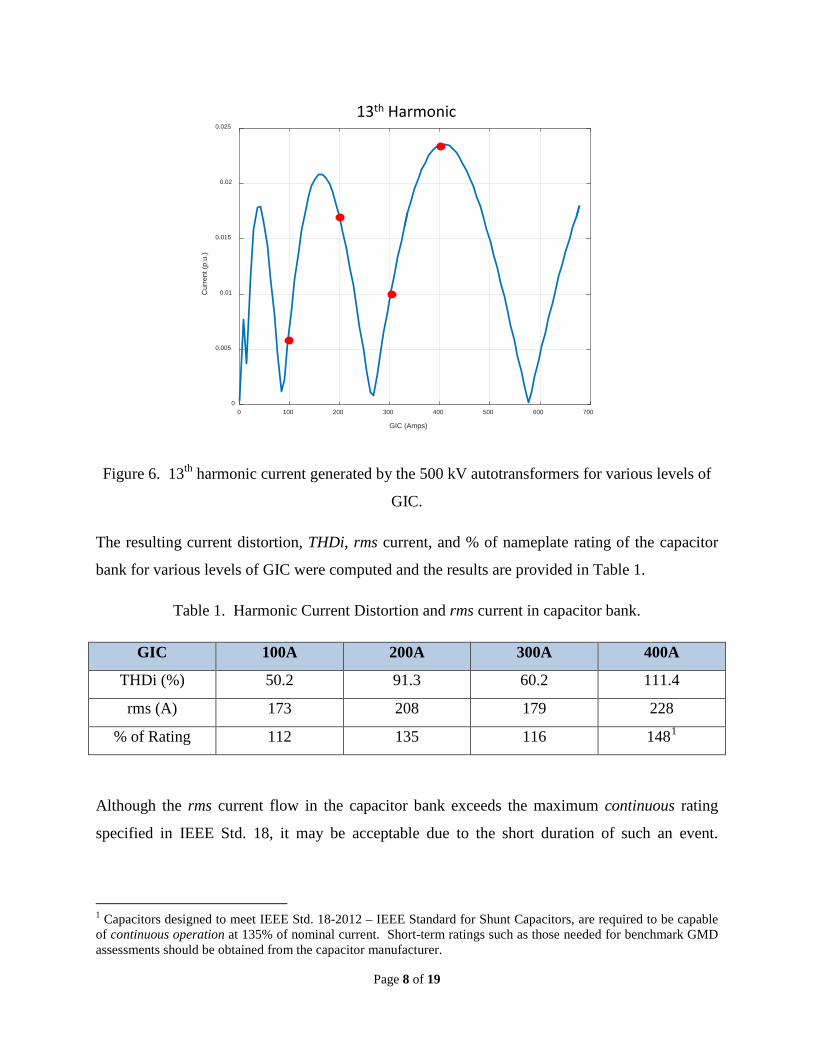
GIC. Figure 6 shows the relative non-linear relationship of the 13th harmonic component of the
exciting current with GIC flow in the autotransformer. As seen in Figure 6, the transformer will
“inject” larger quantities of 13th harmonic with 200A/phase of GIC than it will with 300A/phase
of GIC. This effect is clearly seen in FFT results presented in Figure 5.
1 2 3 4 5 6 7 8 9 10 11 12 13 14 15
harmonic order
0
20
40
60
80
100
120
140
160
Cur
rent
(Arm
s)
100A
200A
300A
400A
Page 8 of 19
Figure 6. 13th harmonic current generated by the 500 kV autotransformers for various levels of
GIC.
The resulting current distortion, THDi, rms current, and % of nameplate rating of the capacitor
bank for various levels of GIC were computed and the results are provided in Table 1.
Table 1. Harmonic Current Distortion and rms current in capacitor bank.
GIC 100A 200A 300A 400A
THDi (%) 50.2 91.3 60.2 111.4
rms (A) 173 208 179 228
% of Rating 112 135 116 1481
Although the rms current flow in the capacitor bank exceeds the maximum continuous rating
specified in IEEE Std. 18, it may be acceptable due to the short duration of such an event.
1 Capacitors designed to meet IEEE Std. 18-2012 – IEEE Standard for Shunt Capacitors, are required to be capable of continuous operation at 135% of nominal current. Short-term ratings such as those needed for benchmark GMD assessments should be obtained from the capacitor manufacturer.
0 100 200 300 400 500 600 700
GIC (Amps)
0
0.005
0.01
0.015
0.02
0.025
Cur
rent
(p.u
.)
13th Harmonic
Page 9 of 19
Specific ratings information for short-term capability should be obtained from the capacitor
manufacturer.
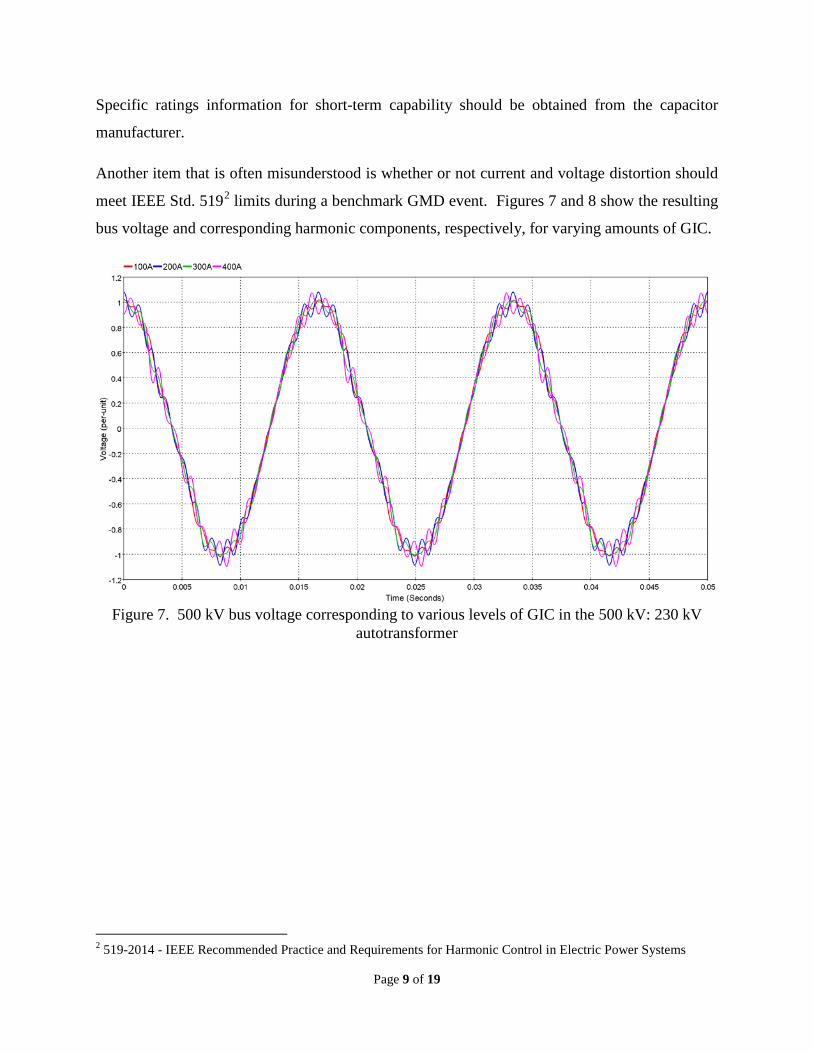
Another item that is often misunderstood is whether or not current and voltage distortion should
meet IEEE Std. 5192 limits during a benchmark GMD event. Figures 7 and 8 show the resulting
bus voltage and corresponding harmonic components, respectively, for varying amounts of GIC.
Figure 7. 500 kV bus voltage corresponding to various levels of GIC in the 500 kV: 230 kV
autotransformer
2 519-2014 - IEEE Recommended Practice and Requirements for Harmonic Control in Electric Power Systems
Page 10 of 19
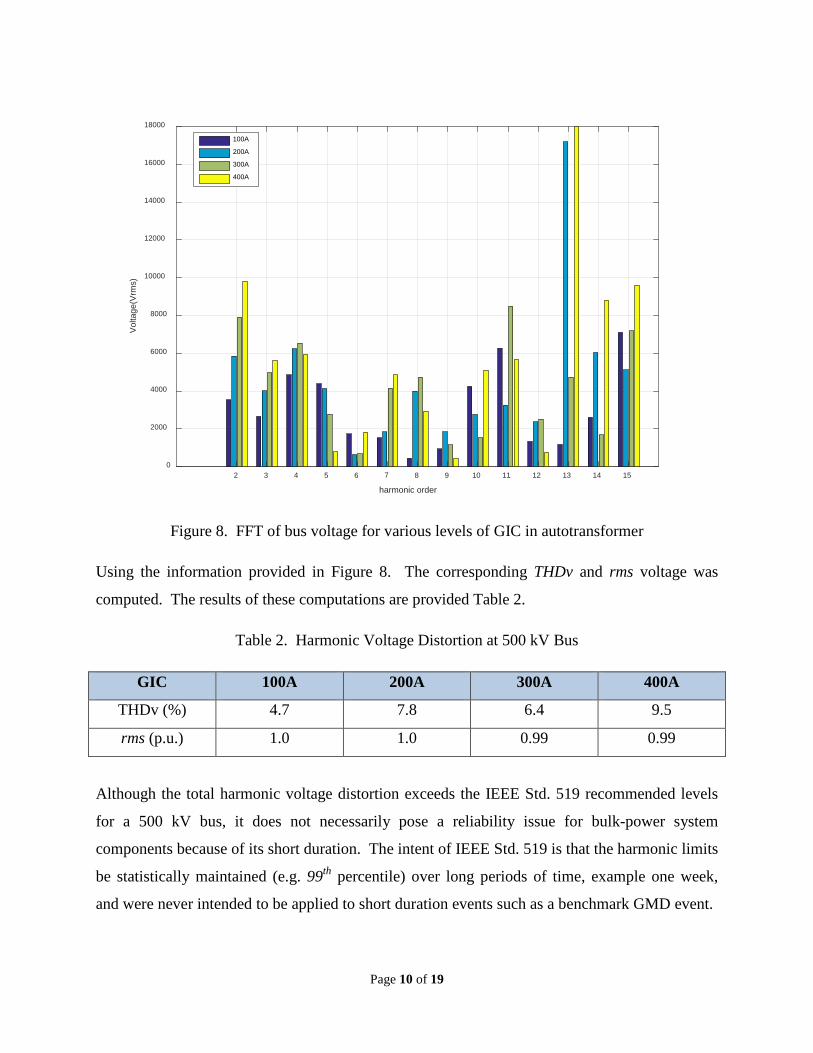
Figure 8. FFT of bus voltage for various levels of GIC in autotransformer
Using the information provided in Figure 8. The corresponding THDv and rms voltage was
computed. The results of these computations are provided Table 2.
Table 2. Harmonic Voltage Distortion at 500 kV Bus
GIC 100A 200A 300A 400A
THDv (%) 4.7 7.8 6.4 9.5
rms (p.u.) 1.0 1.0 0.99 0.99
Although the total harmonic voltage distortion exceeds the IEEE Std. 519 recommended levels
for a 500 kV bus, it does not necessarily pose a reliability issue for bulk-power system
components because of its short duration. The intent of IEEE Std. 519 is that the harmonic limits
be statistically maintained (e.g. 99th percentile) over long periods of time, example one week,
and were never intended to be applied to short duration events such as a benchmark GMD event.
2 3 4 5 6 7 8 9 10 11 12 13 14 15
harmonic order
0
2000
4000
6000
8000
10000
12000
14000
16000
18000V
olta
ge(V
rms)
100A
200A
300A
400A
Page 11 of 19
The previous example illustrates the importance of considering harmonic resonance and how the
non-linear nature of the harmonic current generated by half-cycle saturation can affect the results
in ways that seem counterintuitive. Additionally, performance criteria that are intended to be
utilized for continuous operation are not suitable for benchmark GMD events; thus, the industry
needs additional guidance regarding the short-term harmonic capability of the bulk-power
system and its components. Although analysis can be performed on small-scale systems, more
work is needed to develop approaches and computer modeling tools for accurately assessing the
harmonic effects of benchmark GMD events.
2.1.4 Vibrational Effects
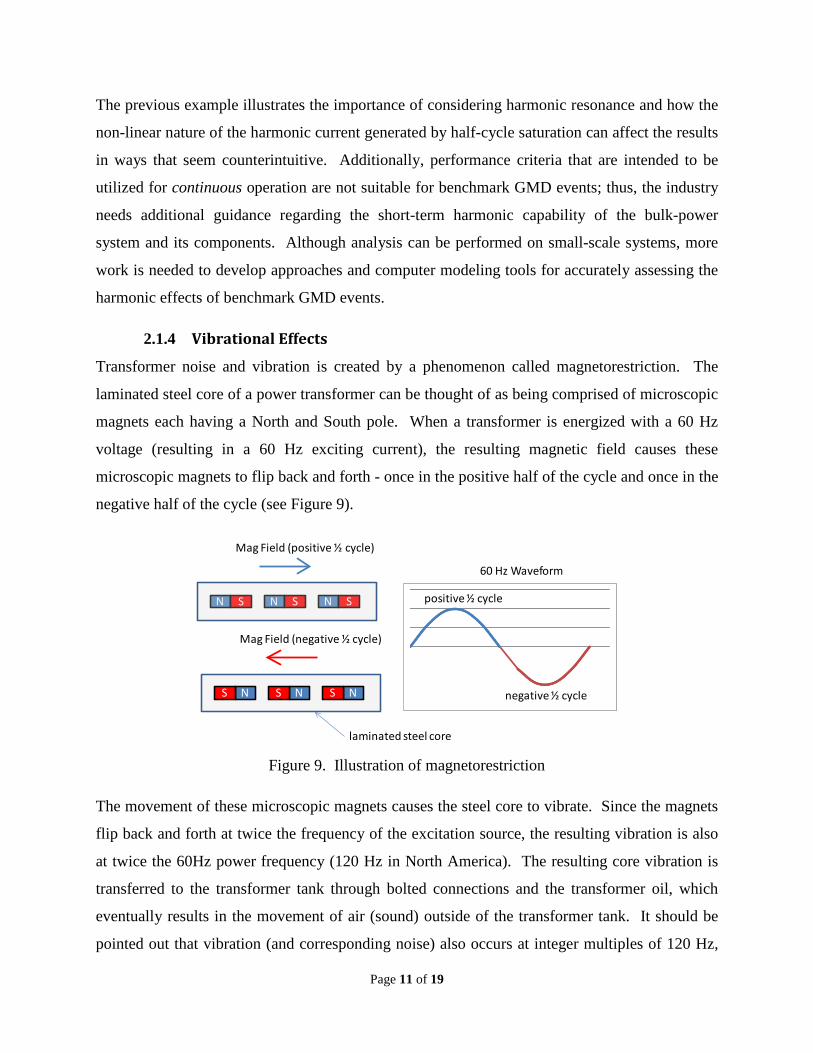
Transformer noise and vibration is created by a phenomenon called magnetorestriction. The
laminated steel core of a power transformer can be thought of as being comprised of microscopic
magnets each having a North and South pole. When a transformer is energized with a 60 Hz
voltage (resulting in a 60 Hz exciting current), the resulting magnetic field causes these
microscopic magnets to flip back and forth - once in the positive half of the cycle and once in the
negative half of the cycle (see Figure 9).
Figure 9. Illustration of magnetorestriction
The movement of these microscopic magnets causes the steel core to vibrate. Since the magnets
flip back and forth at twice the frequency of the excitation source, the resulting vibration is also
at twice the 60Hz power frequency (120 Hz in North America). The resulting core vibration is
transferred to the transformer tank through bolted connections and the transformer oil, which
eventually results in the movement of air (sound) outside of the transformer tank. It should be
pointed out that vibration (and corresponding noise) also occurs at integer multiples of 120 Hz,
N S N S N S
Mag Field (positive ½ cycle)
NS
Mag Field (negative ½ cycle)
NS NS
60 Hz Waveform
positive ½ cycle
negative ½ cycle
laminated steel core
Page 12 of 19
i.e. 240 Hz, 360 Hz and so on. Harmonic currents created by half-cycle saturation cause
magnetorestriction in the core just like 60 Hz current described above, and again the resulting
sound is at twice the frequency of the excitation. For example, 3rd harmonic current (180 Hz)
resulting from half cycle saturation will create vibration and noise at 360 Hz, 720 Hz, 1080 Hz
and so on. Other harmonic currents are also present during half-cycle saturation, and create
vibration and noise. The resulting noise is in the frequency range that the human ear is most
sensitive (500 – 5000 Hz), and is often described as “growling”.
From my own personal experience testing a large autotransformer at the Siemens plant in
Austria, these transformers do produce a tremendous amount of noise when they are operating in
a half-cycle saturated mode caused by the injection of dc current. However, the technical
community at large is not aware of any transformer failures or reliability issues that have been
directly attributable to GIC induced vibration. From an assessment standpoint, there are no
known commercially available models or computer tools for evaluating the effects of vibration
caused by half-cycle saturation of power transformers. Because there are no known documented
cases of vibrational damage caused by GMD events, and there are no commercially available
computer tools or performance criteria available to perform an assessment, the effects of GIC
induced vibration should not be included in the assessment process described in the proposed
TPL-007-1 standard.
2.2 Impacts of Harmonics on Bulk-Power System Components
The flow of harmonic currents in the power system can affect bulk-power system components
such as protective relays, reactive power devices and generators. The following sections provide
a brief discussion of potential effects.
2.2.1 Protection Equipment
The potential impact of harmonic currents on system protection devices is influenced by three
principal factors: 1) relay type (e.g. microprocessor, electromechanical, solid-state), 2) the
element being protected (e.g. transformer, transmission line, capacitor bank, etc.) and the type of
protection scheme employed, and 3) the frequency response of the instrument transformers that
the relays are connected to.
Page 13 of 19
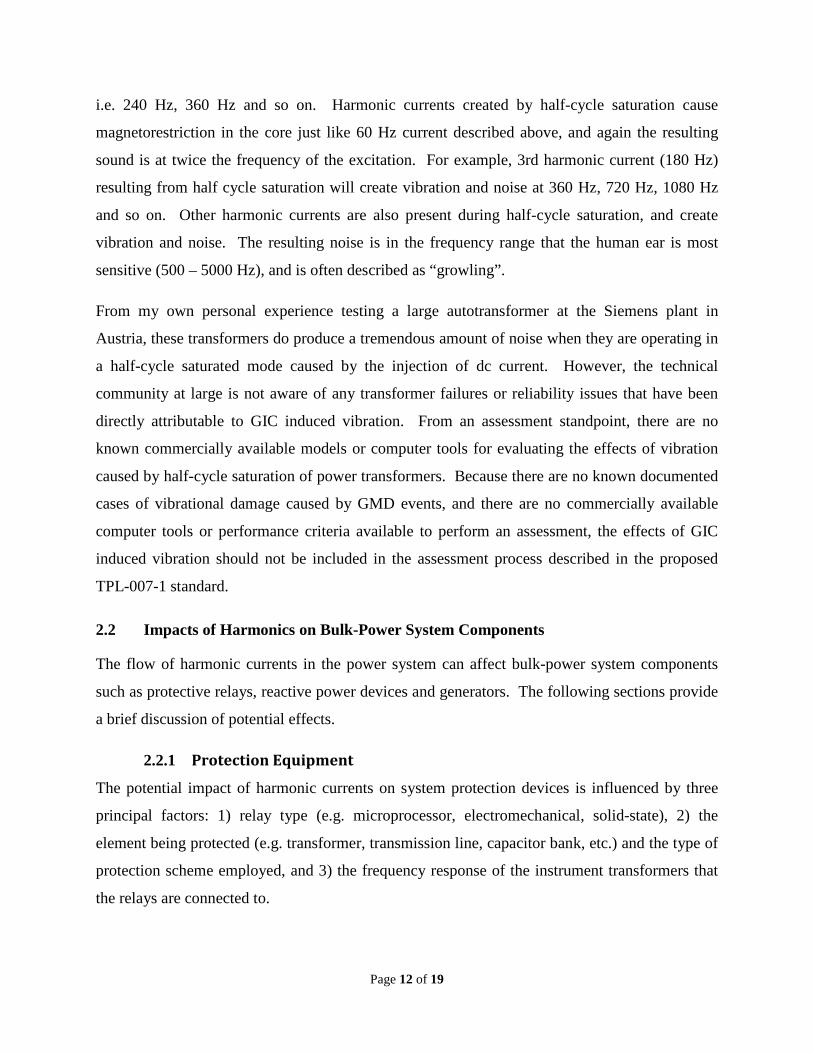
Microprocessor-based (or numerical) relays generally employ an analog low-pass filter and
digital filtering to remove all dc and harmonic components contained in the voltage or current
measurements. A typical signal flow diagram of a microprocessor-based relay is shown in
Figure 10.
Figure 10. Generic Signal Flow Diagram of a Microprocessor-based Relay
Modern microprocessor based relays, which utilize digital signal processing techniques to
remove dc and harmonic content, are theoretically immune to harmonic distortion.
Electromechanical relays are still employed in numerous locations in the bulk-power system.
Electromechanical relays do not employ harmonic filtering, and the response of the relay is
typically based on the true rms quantity which includes harmonics. Thus, electromechanical
relays are vulnerable to misoperation due to harmonics.
Relay elements based on solid-state technology generally operate on peak value detection. At
each cycle, they utilize analog electronics to measure the waveform magnitude, and use the
largest absolute value presented by the waveform to determine trip decisions. Some solid state
relays employ low-pass filtering to remove higher order harmonics, but some do not. When
harmonics are present in a waveform, the peak value may be increased (refer to Figures 4 and 7)
which can result in misoperation.
The type of element being protected and the type of protection scheme employed have a
significant influence of the performance of the protection system during a benchmark GMD
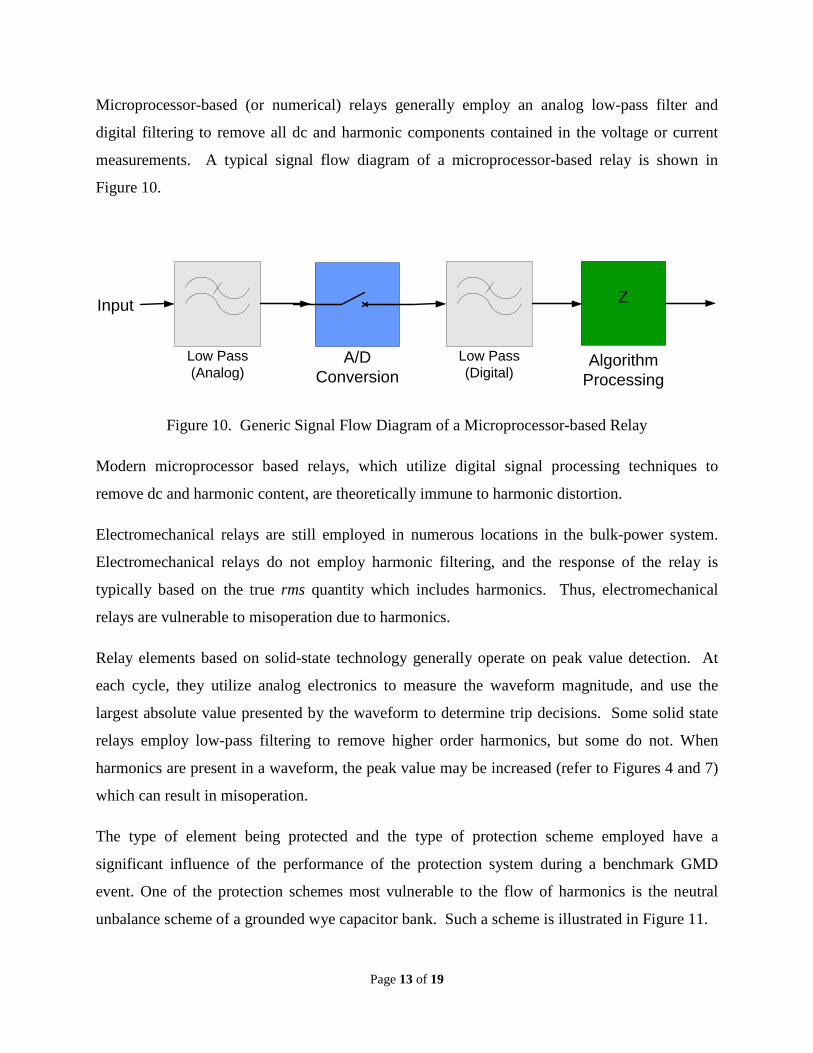
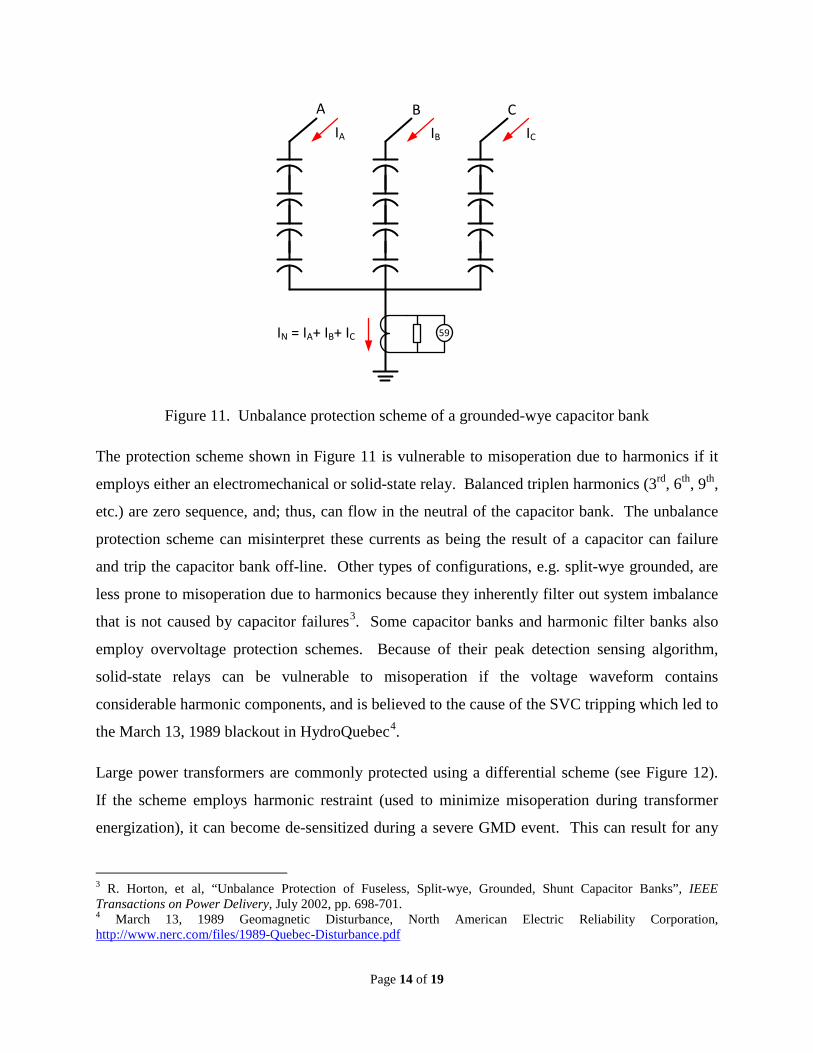
event. One of the protection schemes most vulnerable to the flow of harmonics is the neutral
unbalance scheme of a grounded wye capacitor bank. Such a scheme is illustrated in Figure 11.
Low Pass(Analog)
A/D Conversion
Low Pass(Digital)
Input
AlgorithmProcessing
Z
Page 14 of 19
Figure 11. Unbalance protection scheme of a grounded-wye capacitor bank
The protection scheme shown in Figure 11 is vulnerable to misoperation due to harmonics if it
employs either an electromechanical or solid-state relay. Balanced triplen harmonics (3rd, 6th, 9th,
etc.) are zero sequence, and; thus, can flow in the neutral of the capacitor bank. The unbalance
protection scheme can misinterpret these currents as being the result of a capacitor can failure
and trip the capacitor bank off-line. Other types of configurations, e.g. split-wye grounded, are
less prone to misoperation due to harmonics because they inherently filter out system imbalance
that is not caused by capacitor failures3. Some capacitor banks and harmonic filter banks also
employ overvoltage protection schemes. Because of their peak detection sensing algorithm,
solid-state relays can be vulnerable to misoperation if the voltage waveform contains
considerable harmonic components, and is believed to the cause of the SVC tripping which led to
the March 13, 1989 blackout in HydroQuebec4.
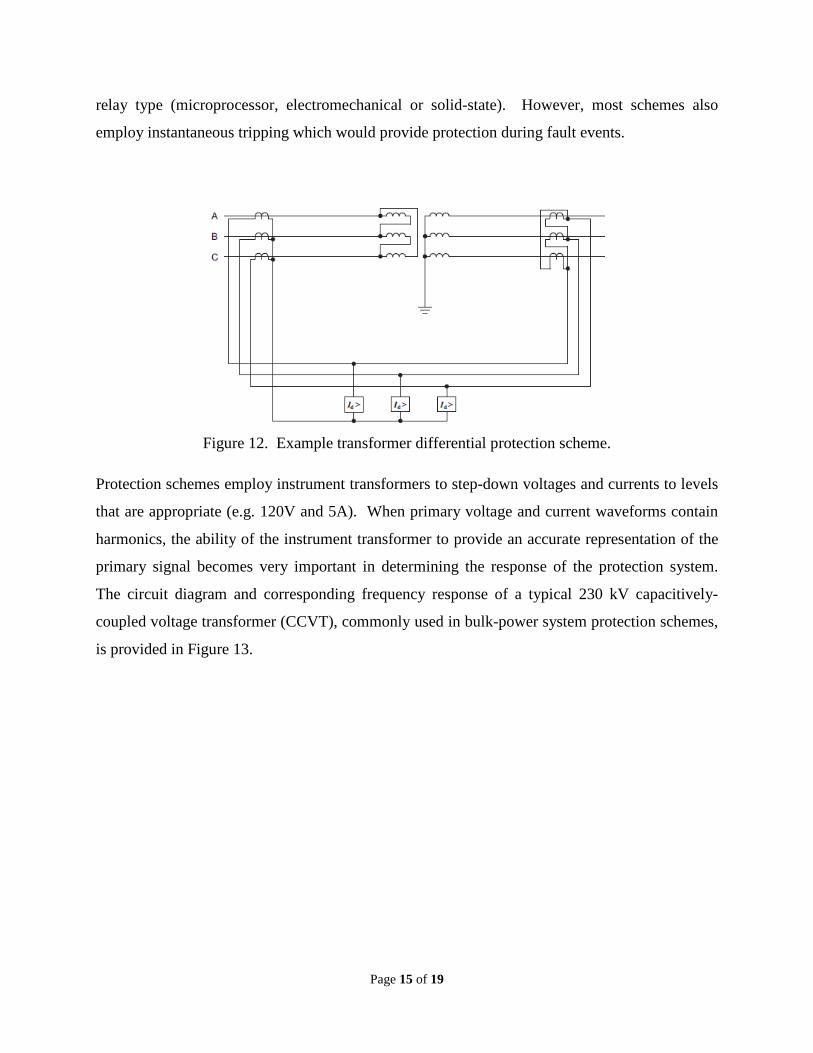
Large power transformers are commonly protected using a differential scheme (see Figure 12).
If the scheme employs harmonic restraint (used to minimize misoperation during transformer
energization), it can become de-sensitized during a severe GMD event. This can result for any
3 R. Horton, et al, “Unbalance Protection of Fuseless, Split-wye, Grounded, Shunt Capacitor Banks”, IEEE Transactions on Power Delivery, July 2002, pp. 698-701. 4 March 13, 1989 Geomagnetic Disturbance, North American Electric Reliability Corporation, http://www.nerc.com/files/1989-Quebec-Disturbance.pdf
59
A B C
IN = IA+ IB+ IC
IA IB IC
Page 15 of 19
relay type (microprocessor, electromechanical or solid-state). However, most schemes also
employ instantaneous tripping which would provide protection during fault events.
Figure 12. Example transformer differential protection scheme.
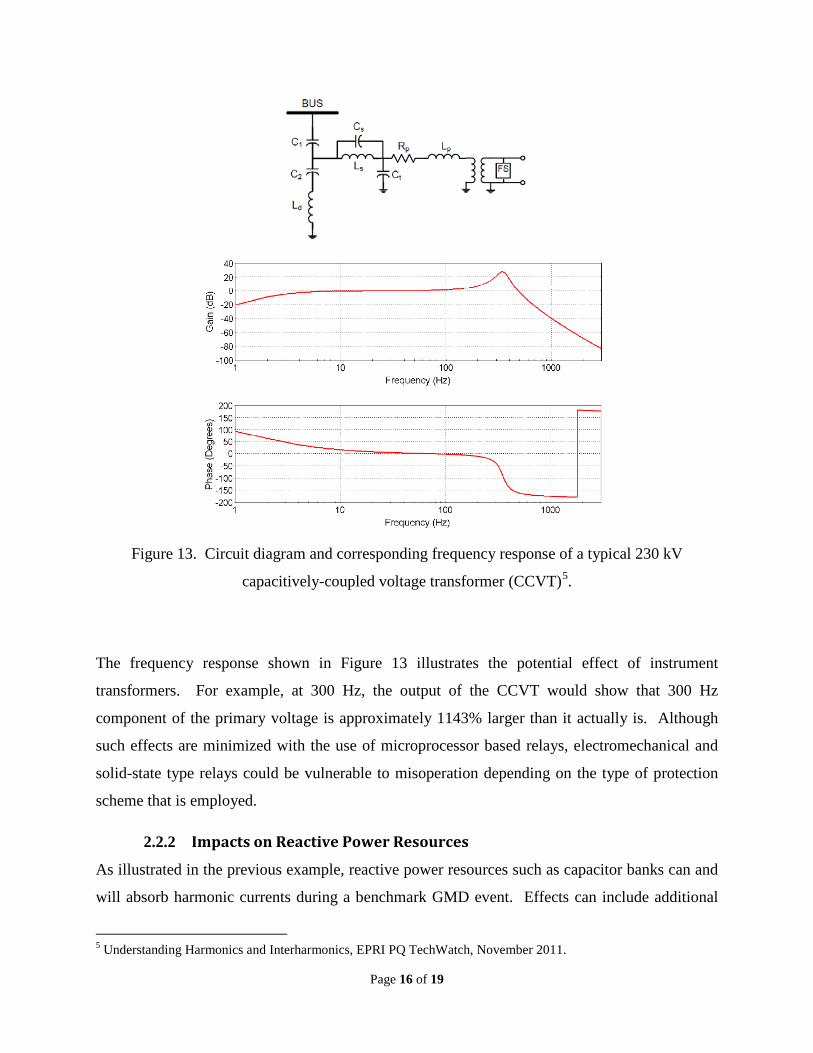
Protection schemes employ instrument transformers to step-down voltages and currents to levels
that are appropriate (e.g. 120V and 5A). When primary voltage and current waveforms contain
harmonics, the ability of the instrument transformer to provide an accurate representation of the
primary signal becomes very important in determining the response of the protection system.
The circuit diagram and corresponding frequency response of a typical 230 kV capacitively-
coupled voltage transformer (CCVT), commonly used in bulk-power system protection schemes,
is provided in Figure 13.
Page 16 of 19
Figure 13. Circuit diagram and corresponding frequency response of a typical 230 kV
capacitively-coupled voltage transformer (CCVT)5.
The frequency response shown in Figure 13 illustrates the potential effect of instrument
transformers. For example, at 300 Hz, the output of the CCVT would show that 300 Hz
component of the primary voltage is approximately 1143% larger than it actually is. Although
such effects are minimized with the use of microprocessor based relays, electromechanical and
solid-state type relays could be vulnerable to misoperation depending on the type of protection
scheme that is employed.
2.2.2 Impacts on Reactive Power Resources
As illustrated in the previous example, reactive power resources such as capacitor banks can and
will absorb harmonic currents during a benchmark GMD event. Effects can include additional
5 Understanding Harmonics and Interharmonics, EPRI PQ TechWatch, November 2011.

Page 17 of 19
heating and misoperation of protection systems which can take these resources off-line when
they are needed most. Harmonic filters, SVCs, and STATCOMs, are also vulnerable to poor
performance during a benchmark GMD event. Thus, an assessment of these devices is
necessary; however, additional criteria and improved tools are necessary to provide a realistic
view of their operation during a severe GMD event.
2.2.3 Impacts on Generators
Although synchronous generators do not, in theory, generate harmonic currents, their windings
do provide a path for them to flow. Harmonic current flow in the stator of a synchronous
generator induces harmonic currents in the rotor which increases rotor heating. Fundamental
frequency, negative sequence current also induces harmonic current in the rotor (120 Hz). To
minimize their effect, IEEE Std. C50.136 provides limits for negative sequence current flow in
synchronous generators. Negative sequence relays are generally employed to insure that the
generators do not operate above the limit that could cause damage. Because most negative
sequence relays operate off of fundamental frequency (60 Hz) quantities, they are unable to
detect the equivalent negative sequence heating caused by the flow of harmonics in the stator
winding of a generator. IEEE Std. C50.13 has been updated to include harmonic current in the
calculation of negative sequence current limits. Detailed harmonics studies are required to
provide an accurate assessment of harmonics that the generator would be exposed to during a
benchmark GMD event. Additionally, a protective relay that includes harmonics in the
calculation of an “equivalent” negative sequence current may need to be considered in some
cases.
2.3 Power System Impacts Related to Reactive Power Demand
The flow of geomagnetically induced current (GIC) in the windings of power transformers
creates an offset in the magnetic flux in the transformer core. This causes the transformer core to
become saturated for one half of the power cycle; thus, the phenomenon is referred to as half-
cycle saturation. The resulting exciting current can be obtained by mapping the resulting flux to
the non-linear saturation characteristic of the transformer. Such a mapping is illustrated in
6 C50.13-2005 - IEEE Standard for Cylindrical-Rotor 50 Hz and 60 Hz Synchronous Generators Rated 10 MVA and Above
Page 18 of 19
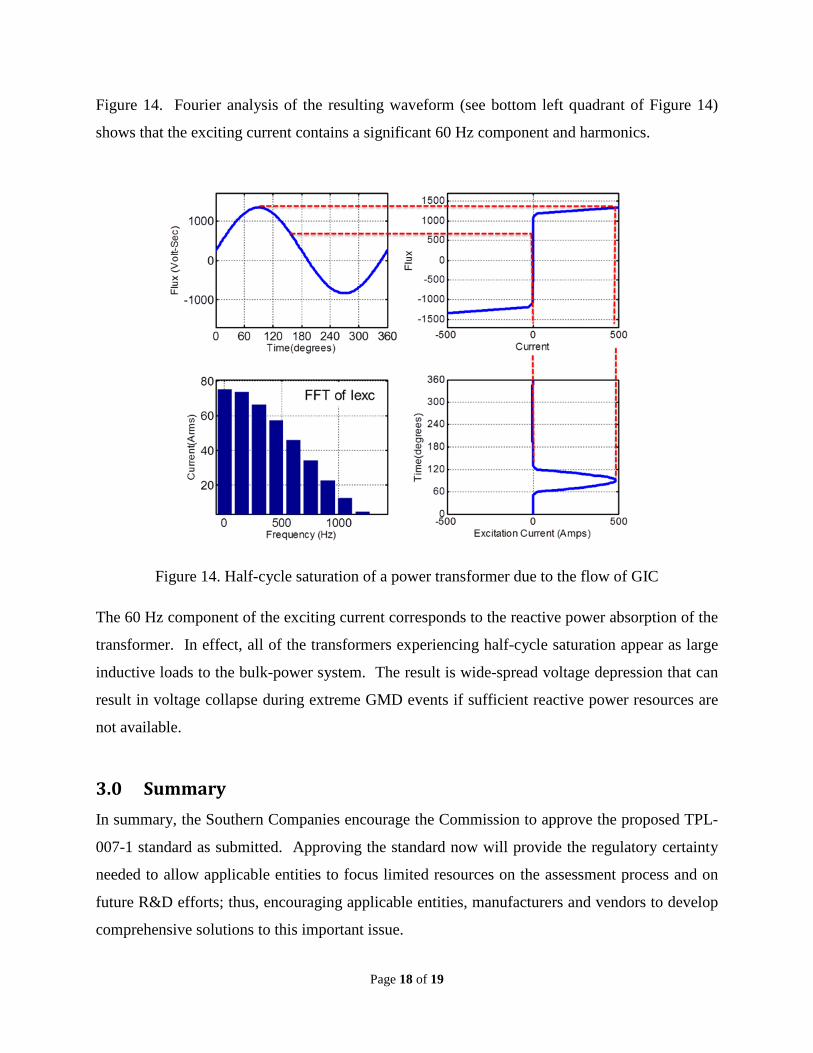
Figure 14. Fourier analysis of the resulting waveform (see bottom left quadrant of Figure 14)
shows that the exciting current contains a significant 60 Hz component and harmonics.
Figure 14. Half-cycle saturation of a power transformer due to the flow of GIC
The 60 Hz component of the exciting current corresponds to the reactive power absorption of the
transformer. In effect, all of the transformers experiencing half-cycle saturation appear as large
inductive loads to the bulk-power system. The result is wide-spread voltage depression that can
result in voltage collapse during extreme GMD events if sufficient reactive power resources are
not available.
3.0 Summary In summary, the Southern Companies encourage the Commission to approve the proposed TPL-
007-1 standard as submitted. Approving the standard now will provide the regulatory certainty
needed to allow applicable entities to focus limited resources on the assessment process and on
future R&D efforts; thus, encouraging applicable entities, manufacturers and vendors to develop
comprehensive solutions to this important issue.
Page 19 of 19
The key take-aways regarding vulnerability assessments performed under the proposed standard
are as follows. First, more work is needed to develop commercially available computer
modeling tools and performance criteria that can be used to assess the harmonic impacts of
benchmark GMD events. Second, transformer vibration and audible noise that result from half-
cycle saturation do not appear to be damaging to power transformers, and; thus, do not need to
be considered in the proposed standard. Finally, the analysis of protection systems is an
important aspect of assessing the impact of benchmark GMD events on the bulk-power system;
however, without the proper computer modeling tools and expertise necessary to determine the
harmonic levels that such devices may be exposed to during a benchmark GMD event, results
can vary widely. Interpreting such results and determining whether or not they identify a
potential reliability risk requires considerable expertise and engineering judgment.
Thank you for the opportunity to provide these comments in this important docket.
Top Related