


Languages
Pages
Legal


1
Release Time IMMEDIATE
Date 18 August 2020
Number 09/20
BHP RESULTS FOR THE YEAR ENDED 30 JUNE 2020
Note: All guidance is subject to further potential impacts from COVID-19 during the 2021 financial year.
Keeping our people and communities safe
We had no fatalities at our operated sites during the year and improved Total Recordable Injury Frequency.
Our commitments to safety and social value have enabled us to operate reliably and safely during the COVID-19 pandemic. We had the support of our workforce, Traditional Owners, communities, governments, customers and suppliers.
Maximise cash flow: Robust earnings and free cash flow generation despite COVID-19
Attributable profit of US$8.0 billion and Underlying attributable profit(i) of US$9.1 billion broadly in line with the prior year.
Profit from operations of US$14.4 billion and Underlying EBITDA(i) of US$22.1 billion at a margin(i) of 53%, with unit costs reduced by 9% at our major assets due to foreign exchange, better productivity and improved operating stability.
Net operating cash flow of US$15.7 billion, above US$15 billion for the fourth consecutive year, and free cash flow(i) of US$8.1 billion.
Capital discipline: Major projects tracking well, early stage options added and balance sheet remains strong
Capital and exploration expenditure(i) within guidance at US$7.6 billion. We now expect capital and exploration expenditure to be approximately US$7 billion for the 2021 financial year, reflecting the proactive deferral for value of a number of our petroleum projects, and approximately US$8.5 billion for the 2022 financial year.
Our six major projects under development are progressing well, with first production from Atlantis Phase 3 achieved in July 2020 and the Spence Growth Option and South Flank expected to deliver first production within the next 12 months. Jansen is now expected to be presented to the Board for a Final Investment Decision in the middle of the 2021 calendar year following delays to completion of the shafts. These delays are a result of initial challenges with placement of the shaft lining, since rectified, and due to impacts from our COVID-19 response plan.
We continue to advance our exploration programs in petroleum, copper and nickel, with results of the third phase of the drilling program completed at our Oak Dam copper discovery in South Australia currently under analysis. We have also added to our early stage optionality in nickel with the acquisition of the Honeymoon Well tenements in Western Australia.
Net debt at US$12.0 billion, compared to US$9.4 billion at 30 June 2019, which is at the low end of our target range of US$12 to US$17 billion. The application of IFRS 16 Leases has increased net debt(i)(1) by US$1.6 billion since 30 June 2019.
Value and returns: Consistently high cash returns, US$6.1 billion of total announced returns to shareholders
To further enhance our portfolio for value, risk and returns, we intend to concentrate our coal portfolio on higher-quality coking coals, and are looking at options to exit BMC, New South Wales Energy Coal (NSWEC) and Cerrejón.
The Board has determined to pay a final dividend of 55 US cents per share or US$2.8 billion, which includes an additional amount of 17 US cents per share (equivalent to US$0.9 billion) above the 50% minimum payout policy. Total dividends announced of US$1.20 per share, equivalent to a 67% payout ratio.
Underlying return on capital employed(i) remained strong at 17%.
Year ended 30 June 2020
US$M 2019
US$M Change
%
Total operations
Attributable profit 7,956 8,306 (4%)
Basic earnings per share (cents) 157.3 160.3 (2%)
Dividend per share (cents) 120.0 133.0 (10%)
Net operating cash flow 15,706 17,871 (12%)
Capital and exploration expenditure 7,640 7,566 1%
Net debt(1) 12,044 9,446 28%
Underlying attributable profit 9,060 9,124 (1%)
Underlying basic earnings per share (cents)(i) 179.2 176.1 2%
Continuing operations
Profit from operations 14,421 16,113 (11%)
Underlying EBITDA 22,071 23,158 (5%)
Underlying attributable profit(i) 9,060 9,466 (4%)
Net operating cash flow 15,706 17,397 (10%)
(1) The definition of net debt has changed to include the fair value of derivatives used to hedge foreign exchange and interest rate risk related to cash and borrowings. Prior period comparatives have been restated to reflect the change in net debt calculation. Net debt was restated from US$9.2 billion to US$9.4 billion as at 30 June 2019.
IFRS 16 became effective from 1 July 2019. As at 30 June 2020, the impact from the application of IFRS 16 Leases on net debt was US$1.6 billion. Further detail is included in the Alternative Performance Measures section.
2
Results for the year ended 30 June 2020
BHP Chief Executive Officer, Mike Henry:
“BHP delivered a strong set of results for the 2020 financial year that reflect the strength, resilience and quality of our
people and our portfolio. In a year marked by the challenges of the global COVID-19 pandemic, social unrest in Chile
and commodity price volatility, we were safer, more reliable and lower cost.
BHP’s operations generated robust free cash flow and our balance sheet remained strong, with net debt finishing the
year at the low end of our target range. We have announced a final dividend of 55 US cents per share, bringing
shareholder returns to US$6.1 billion for the full year.
Our workforce operated with purpose, focus, speed and decisiveness, and I am proud of their achievements. We are
grateful for the ongoing support of our communities, Traditional Owners, governments and business partners. In line
with our commitment to social value, we have in turn sought to support them through this difficult period by creating
1,500 jobs, making early payments to small, regional and indigenous suppliers and contributing more than US$75 million
to community, health and social programs.
We expect most major economies will contract heavily in 2020, China being the exception. Recovery will vary
considerably by country. Our diversified portfolio and high-quality assets position us to continue to generate returns in
the face of near-term uncertainty, even as we secure and create the options in future-facing commodities that will allow
us to sustainably grow value in the long-term.
Our development projects and exploration programs are progressing well and in line with our strategy. We have secured,
and will continue to grow, options in copper and nickel, where increasing demand and our capability give us competitive
opportunities. We are moving to concentrate our coal portfolio on high quality coking coals, with greatest potential upside
for quality premiums as steel makers seek to improve blast furnace utilisation and reduce emissions intensity. In oil and
gas, we will continue to invest in opportunities that are resilient under a range of price scenarios, and which are aligned
to our strengths. We will seek to divest oil and gas assets that are mature or which are likely to realise greater value
under different ownership. This approach to actively managing our portfolio for value, risk and returns over multiple time
horizons will yield superior returns for our investors and greater value for our partners and communities. Our ability to
do so will be underpinned by our distinctive culture and organisational capability, our strong balance sheet and
disciplined approach to capital allocation.
I have created two new roles on BHP’s Executive Leadership Team, appointing Laura Tyler as Chief Technical Officer
and Johan van Jaarsveld as Chief Development Officer. These appointments will accelerate our agenda to become
safer, lower cost and more productive, and to develop a portfolio that is fit for the future with opportunities for long-term
growth. Ragnar Udd and Caroline Cox will also join the team as President Minerals Americas and Chief External Affairs
Officer, respectively, replacing Danny Malchuk and Geoff Healy. Our company is safer and stronger because of Danny
and Geoff’s outstanding leadership and I thank them for their enormous contribution to BHP.
Our products are essential for the world and the future. I am confident our portfolio and approach will continue to support
attractive value and returns for decades to come.”
Leading delivery of social value
Safety and sustainability
Our priority is the safety, health and wellbeing of our workforce and the communities in which we operate and we have
demonstrated this throughout the COVID-19 pandemic.
Our operated assets have continued to operate safely, with additional protocols in place to protect our workforce and
communities from the spread of COVID-19, in line with guidelines from local and national government bodies and expert
health advice in the geographies where we operate.
BHP Results for the year ended 30 June 2020
3
Our support for local communities has been a critical area of focus in BHP’s response. We have provided significant
support to communities in Australia. We announced the A$50 million Vital Resources Fund in March 2020. It is being
used to support regional communities in our areas of operation and includes funding for essential community and health
services in the Pilbara, Bowen Basin, Hunter Valley and South Australia. We have implemented protective measures
for the local communities and we have ceased all face-to-face contact with Traditional Owners to protect vulnerable
members of their communities. We also hired an additional 1,500 people into temporary roles to support our workforce
operating across Australia.
In Chile, we established a US$8 million program to support the public health response to COVID-19 at the national and
regional level, with a focus on increasing testing capacity and tracing, the provision of medical equipment, and the
support the communities where we operate and vulnerable populations through hygiene supplies and water, and public
spaces sanitation. An additional US$3 million fund was established for specific local community programs. In North
America, a US$2 million fund was established to support local and regional health and wellness programs in communities
in close proximity to our operations.
We shortened payment terms globally for our small, local and Indigenous suppliers, to further assist them and local
communities to manage through the financial pressures of COVID-19.
In parallel with leading through the challenges faced during the year, we are continuing to take action on helping to
address the urgent challenge of climate change. In October 2019, we announced four new renewable power contracts
for Escondida and Spence that will replace existing electricity supply contracts. The contracts will deliver lower energy
prices and will displace approximately 3 Mt CO2-e per year from BHP’s Chilean operations from the 2022 financial year.
We aim to supply Escondida and Spence’s energy requirements fully from 100 per cent renewable energy sources from
the mid-2020s. We are also minimising our use of fresh water. Escondida has eliminated water drawdown from aquifers
for operational supply 10 years ahead of its 2030 target. This was made possible by the completion of the Escondida
Water Supply Expansion project in December 2019, which further increased total desalinated water capacity. We have
also realised better water consumption efficiency through a program of continuous improvement.
Work is progressing on the implementation of the climate change initiatives announced in July 2019. We are setting a
2030 science-based target for Scope 1 and 2 emissions, to set the trajectory towards our 2050 goal of net-zero
operational emissions, as well as setting Scope 3 emissions goals. We are implementing the US$400 million Climate
Investment Program, to develop low carbon technologies and invest in nature-based solutions to support reduction in
emissions from our operations as well as those generated from the use of our resources. Furthermore, we are updating
our climate portfolio analysis, and clarifying and strengthening the link between performance against emissions targets
and BHP’s executive pay plans. We will announce these in our Climate Change Report to be published on 10 September
2020.
The BHP Tailings Taskforce, that we established last year, continues to oversee improvement and assurance for our
operated tailings storage facilities, including a focus on short term risk reduction, strengthening emergency response,
enhancing preventative controls, improving governance processes and leading ongoing participation with the
International Council of Mining and Metals and others across the industry on the implementation of the new Global
Industry Standard for Tailings Management. The new international standard provides a framework for safer tailings
management and an ambition to achieve the goal of zero harm to people and the environment, and we are taking a
proactive approach to ensure we meet all of the requirements that have been set out in the standard. We fully support
the transparency and independence of the review process, which has brought together multiple stakeholders across a
range of disciplines to achieve a global industry standard.
In 2018 we established BHP Operations Services to provide a highly skilled workforce of permanent employees able to
work across BHP’s Australian operations. We have since created nearly 3,000 permanent jobs, over and above
approximately 1,500 other new roles in Australia, with Operations Services now deployed at 20 locations across Western
Australia Iron Ore (WAIO), Queensland Coal and NSWEC. Deployments are achieving better safety, productivity and
efficiency outcomes.
In May 2020, Operations Services launched the BHP FutureFit Academy, a new national training program, developed
to provide a customised training pathway utilising nationally recognised curricula, for trade apprenticeships and
maintenance traineeships. The first two FutureFit Academy campuses opened in Mackay in Queensland and Perth in
Western Australia, with graduates to be deployed to an Operations Services team from the 2021 calendar year.
News release
4
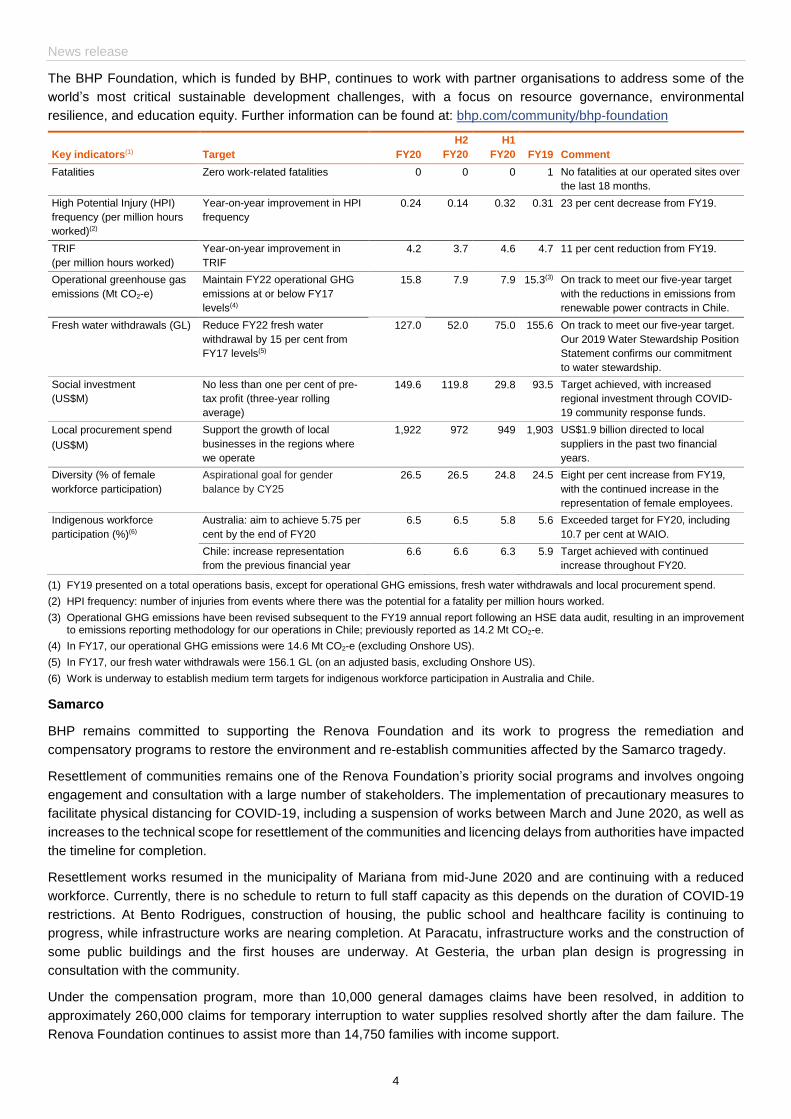
The BHP Foundation, which is funded by BHP, continues to work with partner organisations to address some of the
world’s most critical sustainable development challenges, with a focus on resource governance, environmental
resilience, and education equity. Further information can be found at: bhp.com/community/bhp-foundation
Key indicators(1) Target FY20
H2
FY20
H1
FY20 FY19 Comment
Fatalities Zero work-related fatalities 0 0 0 1 No fatalities at our operated sites over
the last 18 months.
High Potential Injury (HPI)
frequency (per million hours
worked)(2)
Year-on-year improvement in HPI
frequency
0.24 0.14 0.32 0.31 23 per cent decrease from FY19.
TRIF
(per million hours worked)
Year-on-year improvement in
TRIF
4.2 3.7 4.6 4.7 11 per cent reduction from FY19.
Operational greenhouse gas
emissions (Mt CO2-e)
Maintain FY22 operational GHG
emissions at or below FY17
levels(4)
15.8 7.9 7.9 15.3(3) On track to meet our five-year target
with the reductions in emissions from
renewable power contracts in Chile.
Fresh water withdrawals (GL) Reduce FY22 fresh water
withdrawal by 15 per cent from
FY17 levels(5)
127.0 52.0 75.0 155.6 On track to meet our five-year target.
Our 2019 Water Stewardship Position
Statement confirms our commitment
to water stewardship.
Social investment
(US$M)
No less than one per cent of pre-
tax profit (three-year rolling
average)
149.6 119.8 29.8 93.5 Target achieved, with increased
regional investment through COVID-
19 community response funds.
Local procurement spend
(US$M)
Support the growth of local
businesses in the regions where
we operate
1,922 972 949 1,903 US$1.9 billion directed to local
suppliers in the past two financial
years.
Diversity (% of female
workforce participation)
Aspirational goal for gender
balance by CY25
26.5 26.5 24.8 24.5 Eight per cent increase from FY19,
with the continued increase in the
representation of female employees.
Indigenous workforce
participation (%)(6)
Australia: aim to achieve 5.75 per
cent by the end of FY20
6.5 6.5 5.8 5.6 Exceeded target for FY20, including
10.7 per cent at WAIO.
Chile: increase representation
from the previous financial year
6.6 6.6 6.3 5.9 Target achieved with continued
increase throughout FY20.
(1) FY19 presented on a total operations basis, except for operational GHG emissions, fresh water withdrawals and local procurement spend.
(2) HPI frequency: number of injuries from events where there was the potential for a fatality per million hours worked.
(3) Operational GHG emissions have been revised subsequent to the FY19 annual report following an HSE data audit, resulting in an improvement to emissions reporting methodology for our operations in Chile; previously reported as 14.2 Mt CO2-e.
(4) In FY17, our operational GHG emissions were 14.6 Mt CO2-e (excluding Onshore US).
(5) In FY17, our fresh water withdrawals were 156.1 GL (on an adjusted basis, excluding Onshore US).
(6) Work is underway to establish medium term targets for indigenous workforce participation in Australia and Chile.
Samarco
BHP remains committed to supporting the Renova Foundation and its work to progress the remediation and
compensatory programs to restore the environment and re-establish communities affected by the Samarco tragedy.
Resettlement of communities remains one of the Renova Foundation’s priority social programs and involves ongoing
engagement and consultation with a large number of stakeholders. The implementation of precautionary measures to
facilitate physical distancing for COVID-19, including a suspension of works between March and June 2020, as well as
increases to the technical scope for resettlement of the communities and licencing delays from authorities have impacted
the timeline for completion.
Resettlement works resumed in the municipality of Mariana from mid-June 2020 and are continuing with a reduced
workforce. Currently, there is no schedule to return to full staff capacity as this depends on the duration of COVID-19
restrictions. At Bento Rodrigues, construction of housing, the public school and healthcare facility is continuing to
progress, while infrastructure works are nearing completion. At Paracatu, infrastructure works and the construction of
some public buildings and the first houses are underway. At Gesteria, the urban plan design is progressing in
consultation with the community.
Under the compensation program, more than 10,000 general damages claims have been resolved, in addition to
approximately 260,000 claims for temporary interruption to water supplies resolved shortly after the dam failure. The
Renova Foundation continues to assist more than 14,750 families with income support.
BHP Results for the year ended 30 June 2020
5
Works to stabilise the impacted land areas were successfully concluded by the Renova Foundation in the 2019 calendar
year, with the riverbanks and floodplains vegetated, river margins stabilised and, in general, water and sediment qualities
returned to historic conditions. Long-term remediation work is continuing with landowners and regulators to re-establish
agricultural production.
In October 2019, Samarco obtained the Corrective Operating Licence required to progress towards operational restart
of one concentrator. Works related to the construction of a filtration plant have also been slowed as a result of a reduced
workforce, as part of the COVID-19 response. Restart can occur when the filtration system is complete and Samarco
has met all necessary safety requirements, and will be subject to final approval by Samarco’s shareholders.
BHP has reviewed its cost estimates for the Samarco dam failure, including the impact of recent judicial decisions in
Brazil regarding financial assistance and compensation of impacted persons. Combined with the benefit of proceeds
from insurance settlements, favourable exchange rate movements and net finance costs and other charges, BHP
recorded a total income statement charge of US$176 million (after tax) in relation to the Samarco dam failure for the
2020 financial year. This charge is recognised as an exceptional item. Additional commentary, including the breakdown
of the income statement charge is included on page 45.
Financial performance
Note: All guidance is subject to further potential impacts from COVID-19 during the 2021 financial year
Earnings and margins
Attributable profit of US$8.0 billion includes an exceptional loss of US$1.1 billion (2019: US$8.3 billion, which
includes a US$818 million exceptional loss). The 2020 financial year exceptional loss is related to the impairment of
Cerro Colorado, a provision for cancellation of power contracts as part of a shift towards 100 per cent renewable
energy at Escondida and Spence, COVID-19 related costs and the current year impact of the Samarco dam failure.
Underlying attributable profit of US$9.1 billion (2019: US$9.1 billion).
Profit from operations of US$14.4 billion (2019: US$16.1 billion) decreased as a result of lower prices, lower volumes
(including copper grade and petroleum field declines), increased deferred stripping depletion at Escondida and an
increase in the closure and rehabilitation provision for closed mines. This was partially offset by the favourable
impacts of exchange rate movements, better productivity, including record production at WAIO, Caval Ridge and
Poitrel; record coal mined at Broadmeadow and record average concentrator throughput at Escondida, lower unit
costs at our major assets and improved operating stability.
The total impact from COVID-19 on our operations was US$348 million (pre-tax), including an exceptional charge of
US$183 million, in the 2020 financial year. This represents the following impacts: lower volumes at our operated
assets of US$112 million; temporary shutdowns at our non-operated equity accounted investments (Antamina and
Cerrejón) of US$53 million; and additional costs incurred at our operated assets such as temporary relocation costs,
screening and hygiene of US$183 million (exceptional item).
Underlying EBITDA of US$22.1 billion (2019: US$23.2 billion), with lower prices, lower volumes (including copper
grade and petroleum field declines), inflation, an increase in the closure and rehabilitation provision for closed mines
and other net movements, partially offset by record volumes at a number of our assets, improved operating stability,
and favourable impacts from exchange rate movements and the application of IFRS 16 Leases.
Underlying EBITDA margin of 53 per cent (2019: 53 per cent).
Underlying return on capital employed at 17 per cent (2019: 18 per cent excluding Onshore US).
Costs
Strong cost performance underpinned by consumption efficiencies at Escondida, improved operating stability across
our portfolio and further reductions in overheads, partially offset by increased planned maintenance activities at a
number of our assets.
News release
6
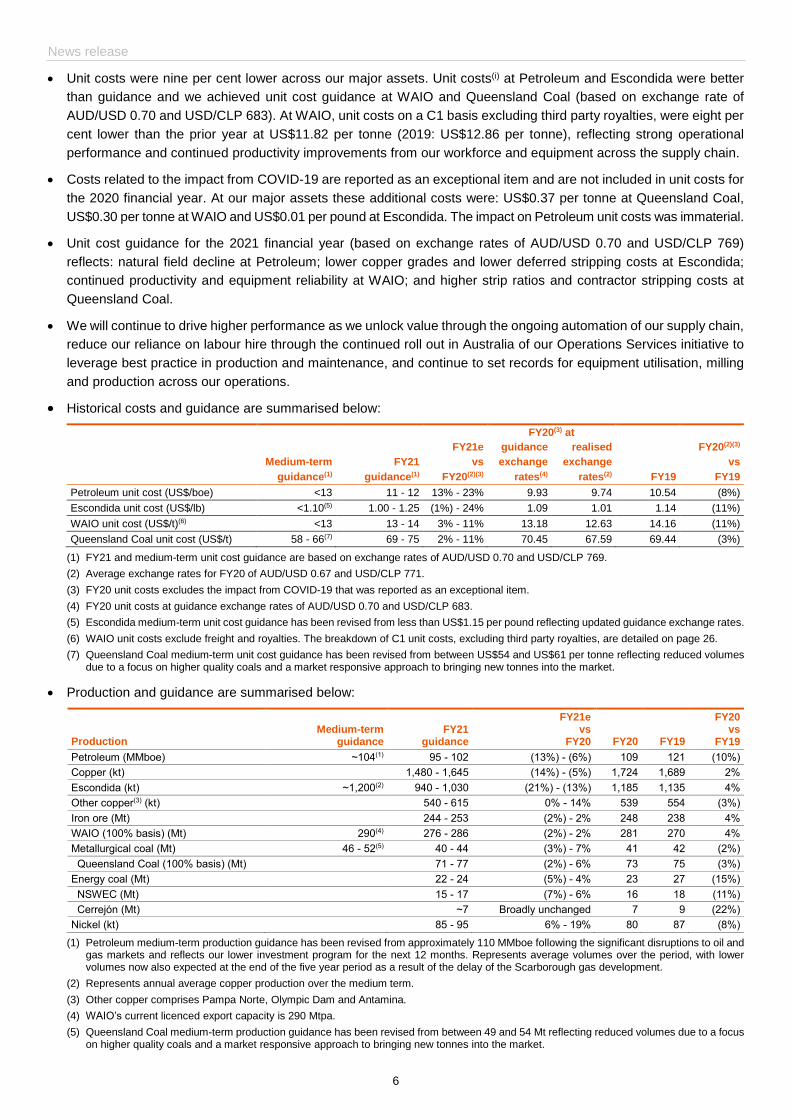
Unit costs were nine per cent lower across our major assets. Unit costs(i) at Petroleum and Escondida were better
than guidance and we achieved unit cost guidance at WAIO and Queensland Coal (based on exchange rate of
AUD/USD 0.70 and USD/CLP 683). At WAIO, unit costs on a C1 basis excluding third party royalties, were eight per
cent lower than the prior year at US$11.82 per tonne (2019: US$12.86 per tonne), reflecting strong operational
performance and continued productivity improvements from our workforce and equipment across the supply chain.
Costs related to the impact from COVID-19 are reported as an exceptional item and are not included in unit costs for
the 2020 financial year. At our major assets these additional costs were: US$0.37 per tonne at Queensland Coal,
US$0.30 per tonne at WAIO and US$0.01 per pound at Escondida. The impact on Petroleum unit costs was immaterial.
Unit cost guidance for the 2021 financial year (based on exchange rates of AUD/USD 0.70 and USD/CLP 769)
reflects: natural field decline at Petroleum; lower copper grades and lower deferred stripping costs at Escondida;
continued productivity and equipment reliability at WAIO; and higher strip ratios and contractor stripping costs at
Queensland Coal.
We will continue to drive higher performance as we unlock value through the ongoing automation of our supply chain,
reduce our reliance on labour hire through the continued roll out in Australia of our Operations Services initiative to
leverage best practice in production and maintenance, and continue to set records for equipment utilisation, milling
and production across our operations.
Historical costs and guidance are summarised below:
FY20(3) at
FY21e guidance realised FY20(2)(3)
Medium-term FY21 vs exchange exchange vs
guidance(1) guidance(1) FY20(2)(3) rates(4) rates(2) FY19 FY19
Petroleum unit cost (US$/boe) <13 11 - 12 13% - 23% 9.93 9.74 10.54 (8%)
Escondida unit cost (US$/lb) <1.10(5) 1.00 - 1.25 (1%) - 24% 1.09 1.01 1.14 (11%)
WAIO unit cost (US$/t)(6) <13 13 - 14 3% - 11% 13.18 12.63 14.16 (11%)
Queensland Coal unit cost (US$/t) 58 - 66(7) 69 - 75 2% - 11% 70.45 67.59 69.44 (3%)
(1) FY21 and medium-term unit cost guidance are based on exchange rates of AUD/USD 0.70 and USD/CLP 769.
(2) Average exchange rates for FY20 of AUD/USD 0.67 and USD/CLP 771.
(3) FY20 unit costs excludes the impact from COVID-19 that was reported as an exceptional item.
(4) FY20 unit costs at guidance exchange rates of AUD/USD 0.70 and USD/CLP 683.
(5) Escondida medium-term unit cost guidance has been revised from less than US$1.15 per pound reflecting updated guidance exchange rates.
(6) WAIO unit costs exclude freight and royalties. The breakdown of C1 unit costs, excluding third party royalties, are detailed on page 26.
(7) Queensland Coal medium-term unit cost guidance has been revised from between US$54 and US$61 per tonne reflecting reduced volumes due to a focus on higher quality coals and a market responsive approach to bringing new tonnes into the market.
Production and guidance are summarised below:
Production
Medium-term
guidance FY21
guidance
FY21e vs
FY20 FY20 FY19
FY20 vs
FY19
Petroleum (MMboe) ~104(1) 95 - 102 (13%) - (6%) 109 121 (10%)
Copper (kt) 1,480 - 1,645 (14%) - (5%) 1,724 1,689 2%
Escondida (kt) ~1,200(2) 940 - 1,030 (21%) - (13%) 1,185 1,135 4%
Other copper(3) (kt) 540 - 615 0% - 14% 539 554 (3%)
Iron ore (Mt) 244 - 253 (2%) - 2% 248 238 4%
WAIO (100% basis) (Mt) 290(4) 276 - 286 (2%) - 2% 281 270 4%
Metallurgical coal (Mt) 46 - 52(5) 40 - 44 (3%) - 7% 41 42 (2%)
Queensland Coal (100% basis) (Mt) 71 - 77 (2%) - 6% 73 75 (3%)
Energy coal (Mt) 22 - 24 (5%) - 4% 23 27 (15%)
NSWEC (Mt) 15 - 17 (7%) - 6% 16 18 (11%)
Cerrejón (Mt) ~7 Broadly unchanged 7 9 (22%)
Nickel (kt) 85 - 95 6% - 19% 80 87 (8%)
(1) Petroleum medium-term production guidance has been revised from approximately 110 MMboe following the significant disruptions to oil and gas markets and reflects our lower investment program for the next 12 months. Represents average volumes over the period, with lower volumes now also expected at the end of the five year period as a result of the delay of the Scarborough gas development.
(2) Represents annual average copper production over the medium term.
(3) Other copper comprises Pampa Norte, Olympic Dam and Antamina.
(4) WAIO’s current licenced export capacity is 290 Mtpa.
(5) Queensland Coal medium-term production guidance has been revised from between 49 and 54 Mt reflecting reduced volumes due to a focus on higher quality coals and a market responsive approach to bringing new tonnes into the market.
BHP Results for the year ended 30 June 2020
7
Group copper equivalent production(ii) was broadly in line with the prior year, as records set at WAIO, Caval Ridge,
Poitrel, Broadmeadow and Escondida, offset the impacts of COVID-19 across our assets, wet weather (particularly
at Queensland Coal) and natural field decline in petroleum.
Group copper equivalent production for the 2021 financial year is expected to be slightly lower than the 2020 financial
year, due to impacts from a reduction in operational workforces in copper in response to COVID-19 and petroleum
natural field decline.
Cash flow and balance sheet
Net operating cash flows (continuing operations) of US$15.7 billion (2019: US$17.4 billion), above US$15 billion for
the fourth consecutive year, reflects weaker commodity prices in coal and petroleum, partially offset by stronger iron
ore prices and strong underlying operating and cost performance across the portfolio.
Free cash flow (continuing operations) of US$8.1 billion, after capital and exploration expenditure of US$7.6 billion.
Our balance sheet remains strong, with net debt at US$12.0 billion at 30 June 2020 (31 December 2019:
US$12.7 billion; 30 June 2019: US$9.4 billion) and at the bottom of our target range. The increase of US$2.6 billion
in net debt reflects record ordinary dividends paid to shareholders during the year of US$6.9 billion and a
US$1.6 billion impact from the application of IFRS 16 Leases, partially offset by solid free cash flow generation.
We have reviewed our definition of net debt and have excluded vessel lease contracts that are priced with reference
to a freight index as of 1 January 2020 and have restated 31 December 2019 for comparative purposes. These
liabilities do not align with how the Group assesses net debt for decision making in relation to the Capital Allocation
Framework. These contracts are required to be re-measured at each reporting date at the prevailing freight index.
The freight index has historically been volatile which also creates significant short-term fluctuations in these liabilities.
We remain committed to a strong balance sheet through the commodity price cycle, and expect net debt to remain
towards the lower end of the target range of US$12 to US$17 billion in the near term.
Gearing ratio(i) of 18.7 per cent (31 December 2019: 19.5 per cent; 30 June 2019: 15.4 per cent and 17.8 per cent
including 1 July 2019 IFRS 16 impacts).
Dividends
The dividend policy provides for a minimum 50 per cent payout of Underlying attributable profit at every reporting
period. The minimum dividend payment for the June 2020 half year period is 38 US cents per share, or US$1.9 billion.
The Board has determined to pay an additional amount of 17 US cents per share or US$0.9 billion, taking the final
dividend to 55 US cents per share. This is equivalent to a 72 per cent payout ratio (2019: 73 per cent).
In total, dividends of US$6.1 billion (US$1.20 per share) have been determined for the 2020 financial year, including
an additional amount of US$1.5 billion above the minimum payout policy.
Capital and exploration
Capital and exploration expenditure of US$7.6 billion in the 2020 financial year was within guidance. This included
maintenance expenditure(iii) of US$1.9 billion and exploration expenditure of US$740 million.
Capital and exploration expenditure of approximately US$7 billion is now expected for the 2021 financial year and is
approximately US$1 billion lower than previous guidance predominantly due to the deferral of a number of our
petroleum projects in order to maximise value. In accordance with our Capital Allocation Framework, we expect
capital and exploration expenditure to be approximately US$8.5 billion for the 2022 financial year, partly driven by
the deferral of expenditure from the 2021 financial year. Guidance is subject to exchange rate movements.
This guidance includes a US$0.7 billion exploration program in the 2021 financial year, with approximately
US$450 million for petroleum exploration and appraisal expenditure.
News release
8
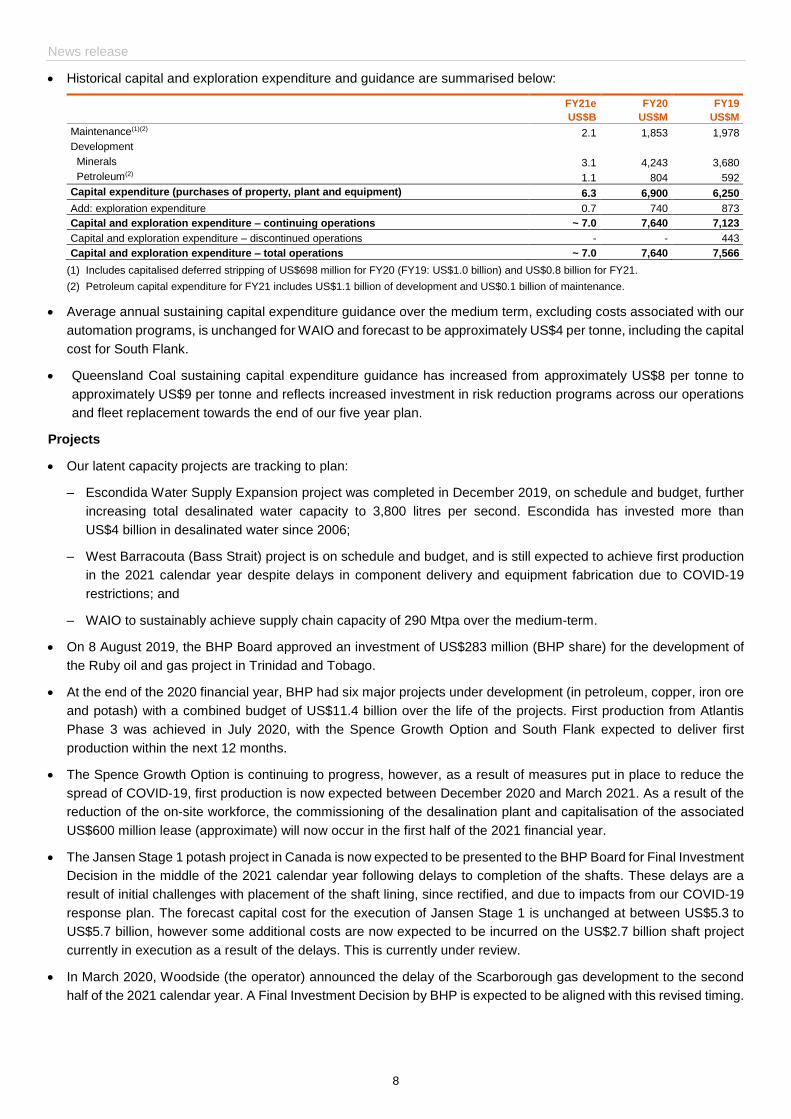
Historical capital and exploration expenditure and guidance are summarised below:
FY21e FY20 FY19
US$B US$M US$M
Maintenance(1)(2) 2.1 1,853 1,978
Development
Minerals 3.1 4,243 3,680
Petroleum(2) 1.1 804 592
Capital expenditure (purchases of property, plant and equipment) 6.3 6,900 6,250
Add: exploration expenditure 0.7 740 873
Capital and exploration expenditure – continuing operations ~ 7.0 7,640 7,123
Capital and exploration expenditure – discontinued operations - - 443
Capital and exploration expenditure – total operations ~ 7.0 7,640 7,566
(1) Includes capitalised deferred stripping of US$698 million for FY20 (FY19: US$1.0 billion) and US$0.8 billion for FY21.
(2) Petroleum capital expenditure for FY21 includes US$1.1 billion of development and US$0.1 billion of maintenance.
Average annual sustaining capital expenditure guidance over the medium term, excluding costs associated with our
automation programs, is unchanged for WAIO and forecast to be approximately US$4 per tonne, including the capital
cost for South Flank.
Queensland Coal sustaining capital expenditure guidance has increased from approximately US$8 per tonne to
approximately US$9 per tonne and reflects increased investment in risk reduction programs across our operations
and fleet replacement towards the end of our five year plan.
Projects
Our latent capacity projects are tracking to plan:
– Escondida Water Supply Expansion project was completed in December 2019, on schedule and budget, further
increasing total desalinated water capacity to 3,800 litres per second. Escondida has invested more than
US$4 billion in desalinated water since 2006;
– West Barracouta (Bass Strait) project is on schedule and budget, and is still expected to achieve first production
in the 2021 calendar year despite delays in component delivery and equipment fabrication due to COVID-19
restrictions; and
– WAIO to sustainably achieve supply chain capacity of 290 Mtpa over the medium-term.
On 8 August 2019, the BHP Board approved an investment of US$283 million (BHP share) for the development of
the Ruby oil and gas project in Trinidad and Tobago.
At the end of the 2020 financial year, BHP had six major projects under development (in petroleum, copper, iron ore
and potash) with a combined budget of US$11.4 billion over the life of the projects. First production from Atlantis
Phase 3 was achieved in July 2020, with the Spence Growth Option and South Flank expected to deliver first
production within the next 12 months.
The Spence Growth Option is continuing to progress, however, as a result of measures put in place to reduce the
spread of COVID-19, first production is now expected between December 2020 and March 2021. As a result of the
reduction of the on-site workforce, the commissioning of the desalination plant and capitalisation of the associated
US$600 million lease (approximate) will now occur in the first half of the 2021 financial year.
The Jansen Stage 1 potash project in Canada is now expected to be presented to the BHP Board for Final Investment
Decision in the middle of the 2021 calendar year following delays to completion of the shafts. These delays are a
result of initial challenges with placement of the shaft lining, since rectified, and due to impacts from our COVID-19
response plan. The forecast capital cost for the execution of Jansen Stage 1 is unchanged at between US$5.3 to
US$5.7 billion, however some additional costs are now expected to be incurred on the US$2.7 billion shaft project
currently in execution as a result of the delays. This is currently under review.
In March 2020, Woodside (the operator) announced the delay of the Scarborough gas development to the second
half of the 2021 calendar year. A Final Investment Decision by BHP is expected to be aligned with this revised timing.
BHP Results for the year ended 30 June 2020
9
Autonomous trucks are being implemented at three additional mine sites across coal and iron ore. We will continue
to assess the value case for potential expansion of this technology to our other Australian iron ore and coal mine sites.
– At the Daunia coal mine in Central Queensland, we announced the introduction of 34 autonomous trucks in July
2020. The first trucks will begin operating in February 2021 and the rollout is expected to be completed early in
the 2022 calendar year.
– At the Newman East (Eastern Ridge) iron ore mine in Western Australia, the first of 20 autonomous trucks began
operating in July 2020, with the rollout expected to be completed by the end of the 2020 calendar year.
– At the Goonyella Riverside mine in Queensland, the first coal site to implement autonomous haul trucks, the
deployment of 86 autonomous trucks is expected to be completed early in the 2022 calendar year.
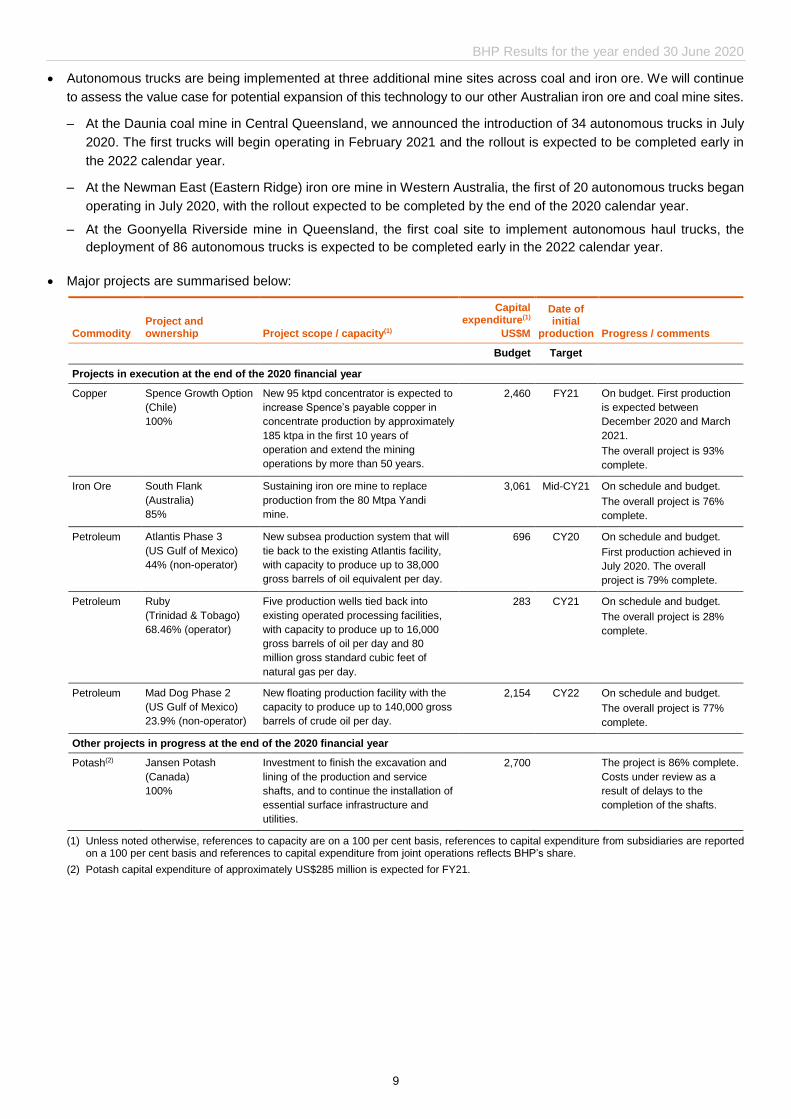
Major projects are summarised below:
Commodity Project and ownership Project scope / capacity(1)
Capital expenditure(1)
US$M
Date of initial
production Progress / comments
Budget Target
Projects in execution at the end of the 2020 financial year
Copper Spence Growth Option
(Chile)
100%
New 95 ktpd concentrator is expected to
increase Spence’s payable copper in
concentrate production by approximately
185 ktpa in the first 10 years of
operation and extend the mining
operations by more than 50 years.
2,460 FY21 On budget. First production
is expected between
December 2020 and March
2021.
The overall project is 93%
complete.
Iron Ore South Flank
(Australia)
85%
Sustaining iron ore mine to replace
production from the 80 Mtpa Yandi
mine.
3,061 Mid-CY21 On schedule and budget.
The overall project is 76%
complete.
Petroleum Atlantis Phase 3
(US Gulf of Mexico)
44% (non-operator)
New subsea production system that will
tie back to the existing Atlantis facility,
with capacity to produce up to 38,000
gross barrels of oil equivalent per day.
696 CY20 On schedule and budget.
First production achieved in
July 2020. The overall
project is 79% complete.
Petroleum Ruby
(Trinidad & Tobago)
68.46% (operator)
Five production wells tied back into
existing operated processing facilities,
with capacity to produce up to 16,000
gross barrels of oil per day and 80
million gross standard cubic feet of
natural gas per day.
283 CY21 On schedule and budget.
The overall project is 28%
complete.
Petroleum Mad Dog Phase 2
(US Gulf of Mexico)
23.9% (non-operator)
New floating production facility with the
capacity to produce up to 140,000 gross
barrels of crude oil per day.
2,154 CY22 On schedule and budget.
The overall project is 77%
complete.
Other projects in progress at the end of the 2020 financial year
Potash(2) Jansen Potash
(Canada)
100%
Investment to finish the excavation and
lining of the production and service
shafts, and to continue the installation of
essential surface infrastructure and
utilities.
2,700 The project is 86% complete.
Costs under review as a
result of delays to the
completion of the shafts.
(1) Unless noted otherwise, references to capacity are on a 100 per cent basis, references to capital expenditure from subsidiaries are reported on a 100 per cent basis and references to capital expenditure from joint operations reflects BHP’s share.
(2) Potash capital expenditure of approximately US$285 million is expected for FY21.
News release
10
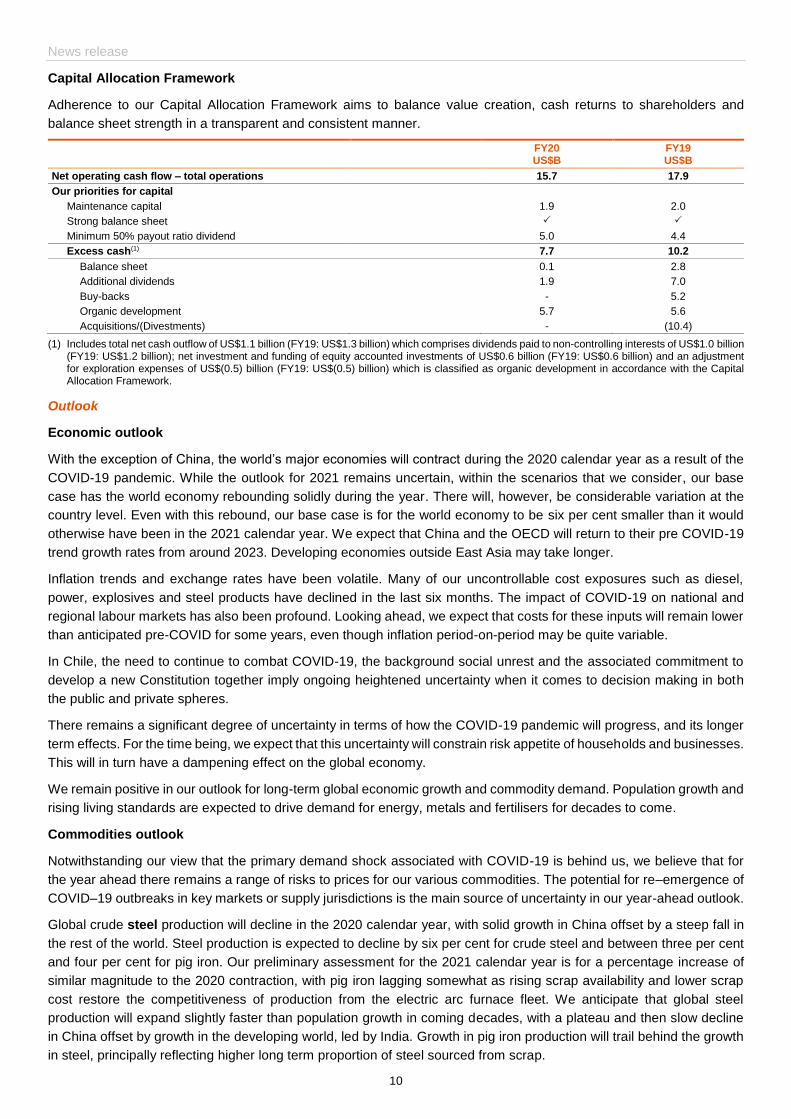
Capital Allocation Framework
Adherence to our Capital Allocation Framework aims to balance value creation, cash returns to shareholders and
balance sheet strength in a transparent and consistent manner.
FY20 US$B
FY19 US$B
Net operating cash flow – total operations 15.7 17.9
Our priorities for capital
Maintenance capital 1.9 2.0
Strong balance sheet
Minimum 50% payout ratio dividend 5.0 4.4
Excess cash(1) 7.7 10.2
Balance sheet 0.1 2.8
Additional dividends 1.9 7.0
Buy-backs - 5.2
Organic development 5.7 5.6
Acquisitions/(Divestments) - (10.4)
(1) Includes total net cash outflow of US$1.1 billion (FY19: US$1.3 billion) which comprises dividends paid to non-controlling interests of US$1.0 billion (FY19: US$1.2 billion); net investment and funding of equity accounted investments of US$0.6 billion (FY19: US$0.6 billion) and an adjustment for exploration expenses of US$(0.5) billion (FY19: US$(0.5) billion) which is classified as organic development in accordance with the Capital Allocation Framework.
Outlook
Economic outlook
With the exception of China, the world’s major economies will contract during the 2020 calendar year as a result of the
COVID-19 pandemic. While the outlook for 2021 remains uncertain, within the scenarios that we consider, our base
case has the world economy rebounding solidly during the year. There will, however, be considerable variation at the
country level. Even with this rebound, our base case is for the world economy to be six per cent smaller than it would
otherwise have been in the 2021 calendar year. We expect that China and the OECD will return to their pre COVID-19
trend growth rates from around 2023. Developing economies outside East Asia may take longer.
Inflation trends and exchange rates have been volatile. Many of our uncontrollable cost exposures such as diesel,
power, explosives and steel products have declined in the last six months. The impact of COVID-19 on national and
regional labour markets has also been profound. Looking ahead, we expect that costs for these inputs will remain lower
than anticipated pre-COVID for some years, even though inflation period-on-period may be quite variable.
In Chile, the need to continue to combat COVID-19, the background social unrest and the associated commitment to
develop a new Constitution together imply ongoing heightened uncertainty when it comes to decision making in both
the public and private spheres.
There remains a significant degree of uncertainty in terms of how the COVID-19 pandemic will progress, and its longer
term effects. For the time being, we expect that this uncertainty will constrain risk appetite of households and businesses.
This will in turn have a dampening effect on the global economy.
We remain positive in our outlook for long-term global economic growth and commodity demand. Population growth and
rising living standards are expected to drive demand for energy, metals and fertilisers for decades to come.
Commodities outlook
Notwithstanding our view that the primary demand shock associated with COVID-19 is behind us, we believe that for
the year ahead there remains a range of risks to prices for our various commodities. The potential for re–emergence of
COVID–19 outbreaks in key markets or supply jurisdictions is the main source of uncertainty in our year-ahead outlook.
Global crude steel production will decline in the 2020 calendar year, with solid growth in China offset by a steep fall in
the rest of the world. Steel production is expected to decline by six per cent for crude steel and between three per cent
and four per cent for pig iron. Our preliminary assessment for the 2021 calendar year is for a percentage increase of
similar magnitude to the 2020 contraction, with pig iron lagging somewhat as rising scrap availability and lower scrap
cost restore the competitiveness of production from the electric arc furnace fleet. We anticipate that global steel
production will expand slightly faster than population growth in coming decades, with a plateau and then slow decline
in China offset by growth in the developing world, led by India. Growth in pig iron production will trail behind the growth
in steel, principally reflecting higher long term proportion of steel sourced from scrap.

BHP Results for the year ended 30 June 2020
11
Iron ore prices have been elevated since the Brumadinho tailings dam tragedy in Brazil first disrupted the market in
early 2019 but can be expected to ease as Brazilian supply recovers. In the second half of the 2020s, China’s demand
for iron ore is expected to be lower than today as crude steel production plateaus and the scrap-to-steel ratio rises. At
the same time, the likelihood of new supply of iron ore from West Africa has increased. This implies that it will be even
more important to create competitive advantage and to grow value through driving exceptional operational performance.
In the long-term, prices are expected to be determined by high cost production, on a value-in-use adjusted basis, from
Australia or Brazil. Quality differentiation will remain a factor in determining iron ore prices.
Metallurgical coal prices have weakened markedly. A steep, COVID-19 induced decline in ex-China demand, which
normally comprises around four-fifths of the seaborne trade, has been the major factor in driving the lower prices.
Metallurgical coal faces a difficult and uncertain period as major importing regions manage their re–openings over the
first half of the financial year. COVID-19 permitting, a sustained improvement in prices is possible in the second half of
the 2021 financial year. We believe that a wholesale shift away from blast furnace steel making, which depends on
metallurgical coal, is still decades in the future. This is due to the existing capital stock of blast furnace steel making
capacity (70 per cent of global capacity today, average fleet age of around 10 - 12 years in China and around 18 years
in India), and the high cost of large scale switching to alternative iron and steel making technologies, which in many
cases are still in the early stage of their technological development. Over time, premium quality coking coals are
expected to be particularly advantaged given the drive by steel makers to improve blast furnace productivity, partly to
reduce emissions intensity. Demand for seaborne Hard Coking Coals (HCC) is expected to grow alongside the growth
of the steel industry in HCC importing countries such as India, and increasing market share in China for large, integrated
mills situated in the major demand centres on the coast. There is a developing mismatch between the expected evolution
of customer demand and the cost-competitive growth options available to the supply side of the industry, which are
skewed towards lower quality coals. As a result, we view the medium to long-term fundamentals for higher quality
metallurgical coals as attractive.
Energy coal prices are particularly challenged, with prices recently falling below the levels reached during the 2015/16
downturn. Around two-thirds of seaborne supply is estimated to be earning negative margins at such price levels. An
uplift in power demand across developed Asia as re-starts progress might help to stabilise the market. China’s policy in
respect of energy coal imports remains a key uncertainty. Longer-term, we expect total primary energy derived from
coal (power and non-power) to expand at a compound rate slower than that of global population growth. Coal power is
expected to progressively lose competitiveness to unsubsidised renewables on a new build basis in the developed world
and in China. However, coal power is expected to retain competitiveness in India (where the coal fleet is only around
10 years old on average) and other populous, low income emerging markets, for a much longer time. Large, low cost
mines supplying energy coal to seaborne markets will continue to be able to generate decent margins.
Copper prices fell sharply in the early stages of the COVID-19 pandemic but have since rebounded, first on improving
sentiment towards pro-growth assets, and more recently on news of COVID-19 related supply-side challenges. In the
medium term we believe that the effect of the pandemic will be to delay the timing of the anticipated structural deficit for
copper by one or two years to the mid to late 2020s. Longer term, end-use demand is expected to be solid, while broad
exposure to the electrification mega-trend offers attractive upside. Our view is that the price setting marginal tonne a
decade from now will come from either a lower grade brownfield expansion in a lower risk jurisdiction, or a higher grade
greenfield project in a higher risk jurisdiction. Prices will rise on the back of grade decline, resource depletion, increased
input costs, water constraints and a scarcity of high quality future development opportunities after a poor decade for
industry-wide exploration.
Nickel prices have been driven by the swings in macro-economic sentiment that have also influenced other base metals.
Longer term, we believe that nickel will be a substantial beneficiary of the global electrification mega-trend and that
nickel sulphides will be particularly attractive given the relatively lower cost of production of battery-suitable class-1
nickel than for laterites, which will set the long-run nickel price. This view is supported by our assessment of the likely
rate of growth in electric vehicles and of the likely battery chemistry that will underpin this.
Crude oil prices experienced unprecedented volatility in the second half of the 2020 financial year. We believe that the
most significant risks to the physical market have now passed. Prices may well build upon their recent recovery, if
mobility continues to improve globally. The pace of gains though could be modest given potential headwinds from supply
returning, whether that is re-started primary production or releases from storage. However, if we look beyond this, our
bottom-up analysis of demand, allied to systematic field decline rates, points to a structural demand-supply gap through
News release
12
at least the mid-2030s. Considerable investment in conventional oil is going to be required to fill that gap. The medium
to long term supply deficit has been amplified by the global retreat from capital spending across the industry in response
to the COVID-19 pandemic. Specifically on demand, road transport is subject to clear disruption risk, while non-transport
demand looks resilient, especially in the developing world. Behavioural changes post COVID-19 are another factor we
consider. The net impact of these trends is likely to be a steady erosion of total demand beyond the plateau we expect
in the medium-term. Deepwater assets are the most likely major supply segment to balance the market in the longer
term. The price expectation required to trigger investment in deepwater projects will be significantly higher than the
prices we face today. We believe oil will be an attractive commodity, even under a plausible low case, for a considerable
time to come.
The Japan-Korea Marker price for LNG performed poorly in the second half of the 2020 financial year. Demand is
expected to be firmer in the new financial year, but storage levels are very high. Longer term, the commodity offers a
combination of systematic base decline and an attractive demand trajectory. However, gas resource is abundant and
liquefaction infrastructure comes with large upfront costs and extended pay backs. North American exports are expected
to provide the marginal supply across multiple longer term scenarios for the LNG industry, with new supply likely to be
required to balance the market in the middle of this decade, or slightly later. Within global gas, LNG is expected to gain
share. Against this backdrop, LNG assets advantaged by their proximity to existing infrastructure or customers, or both,
will be attractive.
Potash stands to benefit from the intersection of a number of global megatrends: rising population, changing diets and
the need for the sustainable intensification of agriculture. We anticipate trend demand growth of 1.5 to 2.0 Mt per year
(between two and three per cent per annum) through the 2020s. This would progressively absorb the excess capacity
currently present in the industry, with the window for new supply expected to be open by the late 2020s or early 2030s.
Further information on BHP’s economic and commodity outlook can be found at: bhp.com/prospects
Portfolio
Our strategy is to have the best assets in the best commodities, run with the best capabilities. Our existing portfolio is
built upon an industry leading set of large, low cost, expandable resource bases. We have exposure to large, growing
commodities, which enable low cost assets to generate attractive and consistent returns.
However, the world is rapidly changing with decarbonisation of energy sources, population growth and the drive for
higher living standards in the developing world key drivers in the future. Our diversified portfolio is resilient under different
long-term scenarios but we are constantly considering ways to further strengthen it for the near, medium and long term.
We must continue to generate excellent and growing returns for shareholders in this changing world. We have
successfully undertaken a series of steps to simplify and strengthen our portfolio over the recent past. To ensure that
we mitigate the risks that this changing world presents and take advantage of the many opportunities to grow value, it
will require us to continue to be active portfolio managers.
Even against the backdrop of the decarbonisation of the global economy, metallurgical coal will remain an essential
input into the steel-making process for a long time yet(iv). However, as steel makers seek to reduce their carbon intensity
of production, we anticipate that markets will evolve to place an even higher relative value on higher quality HCC that
increase blast furnace productivity and reduce emissions intensity of steel production.
BHP has the world’s leading portfolio of metallurgical coal assets. The majority of our mines produce HCC coals and
are owned via our 50 per cent share of the BHP Mitsubishi Alliance (BMA) joint venture. We also own 80 per cent of the
BHP Mitsui Coal (BMC) joint venture which is comprised of low cost mines but which produce lower quality coals. Our
energy coal exposure comprises a very small portion of our overall asset portfolio (approximately three per cent of our
net asset base). We own two assets, a 100 per cent share of the New South Wales Energy Coal asset and a 33.3 per
cent stake in the independently operated Cerrejón mine in Colombia.
We will pursue options to divest our interests in BMC, NSWEC and Cerrejón. These are large-scale and long life assets.
They produce good cash flow through-the-cycle and have the potential for value growth, including through productivity
driven volume growth, further cost reductions and embedded expansion options. Given our focus on HCC, these assets
would better compete for capital outside of BHP. We will look to maximise the value of these assets, including via a
demerger of an independent, listed company and trade sale opportunities.
BHP Results for the year ended 30 June 2020
13
We will, across the whole portfolio of our metallurgical coal mines, continue to grow value through a focus on lowering
costs and productivity related volume growth from our existing mines, where the market opportunity warrants it. We do
not intend to invest significant growth capital in new capacity in this business.
As set out in the outlook section above, we believe oil will be an attractive commodity for a considerable time period to
come. We believe gas, where advantaged by infrastructure and proximity to market, also has attractive fundamentals
for high quality assets. Gas has the more resilient demand profile while oil has the steeper cost curve, driven by complex
and diverse geology. Ongoing field decline (at least three per cent per annum) in existing producing oil and gas assets
is an important underpin to each market.
Our producing petroleum assets in Australia, the Gulf of Mexico and in Trinidad and Tobago enjoy low cash break-evens
and deliver high EBITDA margins. Beyond our producing assets we continue to progress development of sanctioned
and unsanctioned high return growth projects, with competitive break even prices. While our strict capital discipline
ensures all investments are resilient to low points in the commodity cycle, we also recognise the potential for price
upside over the medium term given the global slowdown in development activity, and we are well positioned to
participate in that upside.
We continue to optimise our petroleum portfolio through the exit of later life assets, including an intended exit from Bass
Strait, and farm-downs of the longer dated options. In addition, we will explore potential targeted counter-cyclical
acquisitions in producing or near producing high quality assets, with each opportunity tested against our strict Capital
Allocation Framework. Our exploration and appraisal work program will test prospective acreage in basins we
understand well in the Gulf of Mexico and Trinidad and Tobago South, as well as progress the appraisal and
development studies of the Trinidad and Tobago Northern gas discovery.
Creating and securing more options in future-facing commodities remains a priority. Copper, nickel and potash demand
is expected to expand faster than for many other commodities, given their exposure to mega-trends of decarbonisation,
electrification, diet, land use and population. We intend to increase our options in these through a focus on technical
innovation, to help unlock further options within our existing resources, as well as through exploration and early-stage
entry.
We have made good progress. In copper, we have added to our options through partnering with junior companies in
Canada, Mexico and Ecuador. The third phase of drilling at the Oak Dam copper discovery was completed in June
2020, taking the total area drilled to over 21 thousand metres, and we are currently analysing the results. In nickel, we
have expanded our footprint, with the acquisition of the Honeymoon Well nickel tenements. In potash, we have
progressed the Jansen project, further de-risking the option, as we focus on getting it ready to present to the Board for
a Final Investment Decision in the middle of the 2021 calendar year.
Through the combination of continuing to drive exceptional operational performance, creating and securing more options
in future facing commodities and applying our disciplined approach to capital allocation, we will continue to reliably grow
value and returns for decades to come.

News release
14
Income statement
Underlying attributable profit and Underlying EBITDA are presented below.
Underlying attributable profit
Year ended 30 June
2020
US$M
2019
US$M
Profit after taxation from Continuing and Discontinued operations attributable to BHP shareholders 7,956 8,306
Total exceptional items attributable to BHP shareholders(1) 1,104 818
Underlying attributable profit 9,060 9,124
Weighted basic average number of shares (million) 5,057 5,180
Underlying basic earnings per ordinary share 179.2 176.1
(1) Refer to page 17 and to note 2 Exceptional items and note 8 Significant events – Samarco dam failure of the Financial Information for further information.
Underlying EBITDA
Year ended 30 June
2020
US$M
2019
US$M
Profit from operations 14,421 16,113
Exceptional items included in profit from operations(1) 1,453 952
Underlying EBIT 15,874 17,065
Depreciation and amortisation expense 6,112 5,829
Net impairments 494 264
Exceptional item included in Depreciation, amortisation and impairments(2) (409) −
Underlying EBITDA 22,071 23,158
(1) Exceptional items loss of US$1,453 million excludes net finance costs of US$93 million related to the Samarco dam failure. Refer to page 17 and to note 2 Exceptional items and note 8 Significant events – Samarco dam failure of the Financial Information for further information.
(2) Relates to an impairment charge in relation to Cerro Colorado. Refer to page 17 and to note 2 Exceptional items.
BHP Results for the year ended 30 June 2020
15
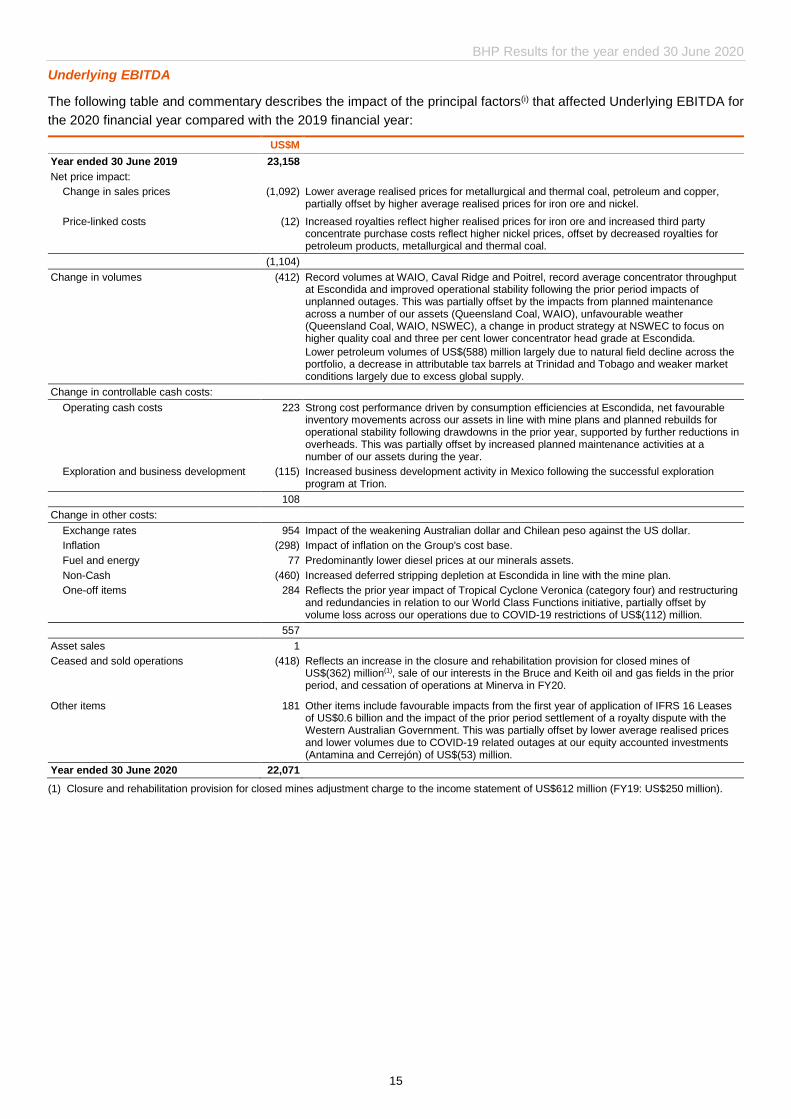
Underlying EBITDA
The following table and commentary describes the impact of the principal factors(i) that affected Underlying EBITDA for
the 2020 financial year compared with the 2019 financial year:
US$M
Year ended 30 June 2019 23,158
Net price impact:
Change in sales prices (1,092) Lower average realised prices for metallurgical and thermal coal, petroleum and copper, partially offset by higher average realised prices for iron ore and nickel.
Price-linked costs (12) Increased royalties reflect higher realised prices for iron ore and increased third party concentrate purchase costs reflect higher nickel prices, offset by decreased royalties for petroleum products, metallurgical and thermal coal.
(1,104)
Change in volumes (412) Record volumes at WAIO, Caval Ridge and Poitrel, record average concentrator throughput at Escondida and improved operational stability following the prior period impacts of unplanned outages. This was partially offset by the impacts from planned maintenance across a number of our assets (Queensland Coal, WAIO), unfavourable weather (Queensland Coal, WAIO, NSWEC), a change in product strategy at NSWEC to focus on higher quality coal and three per cent lower concentrator head grade at Escondida.
Lower petroleum volumes of US$(588) million largely due to natural field decline across the portfolio, a decrease in attributable tax barrels at Trinidad and Tobago and weaker market conditions largely due to excess global supply.
Change in controllable cash costs:
Operating cash costs 223 Strong cost performance driven by consumption efficiencies at Escondida, net favourable inventory movements across our assets in line with mine plans and planned rebuilds for operational stability following drawdowns in the prior year, supported by further reductions in overheads. This was partially offset by increased planned maintenance activities at a number of our assets during the year.
Exploration and business development (115) Increased business development activity in Mexico following the successful exploration program at Trion.
108
Change in other costs:
Exchange rates 954 Impact of the weakening Australian dollar and Chilean peso against the US dollar.
Inflation (298) Impact of inflation on the Group's cost base.
Fuel and energy 77 Predominantly lower diesel prices at our minerals assets.
Non-Cash (460) Increased deferred stripping depletion at Escondida in line with the mine plan.
One-off items 284 Reflects the prior year impact of Tropical Cyclone Veronica (category four) and restructuring and redundancies in relation to our World Class Functions initiative, partially offset by volume loss across our operations due to COVID-19 restrictions of US$(112) million.
557
Asset sales 1
Ceased and sold operations (418) Reflects an increase in the closure and rehabilitation provision for closed mines of US$(362) million(1), sale of our interests in the Bruce and Keith oil and gas fields in the prior period, and cessation of operations at Minerva in FY20.
Other items 181 Other items include favourable impacts from the first year of application of IFRS 16 Leases of US$0.6 billion and the impact of the prior period settlement of a royalty dispute with the Western Australian Government. This was partially offset by lower average realised prices and lower volumes due to COVID-19 related outages at our equity accounted investments (Antamina and Cerrejón) of US$(53) million.
Year ended 30 June 2020 22,071
(1) Closure and rehabilitation provision for closed mines adjustment charge to the income statement of US$612 million (FY19: US$250 million).
News release
16
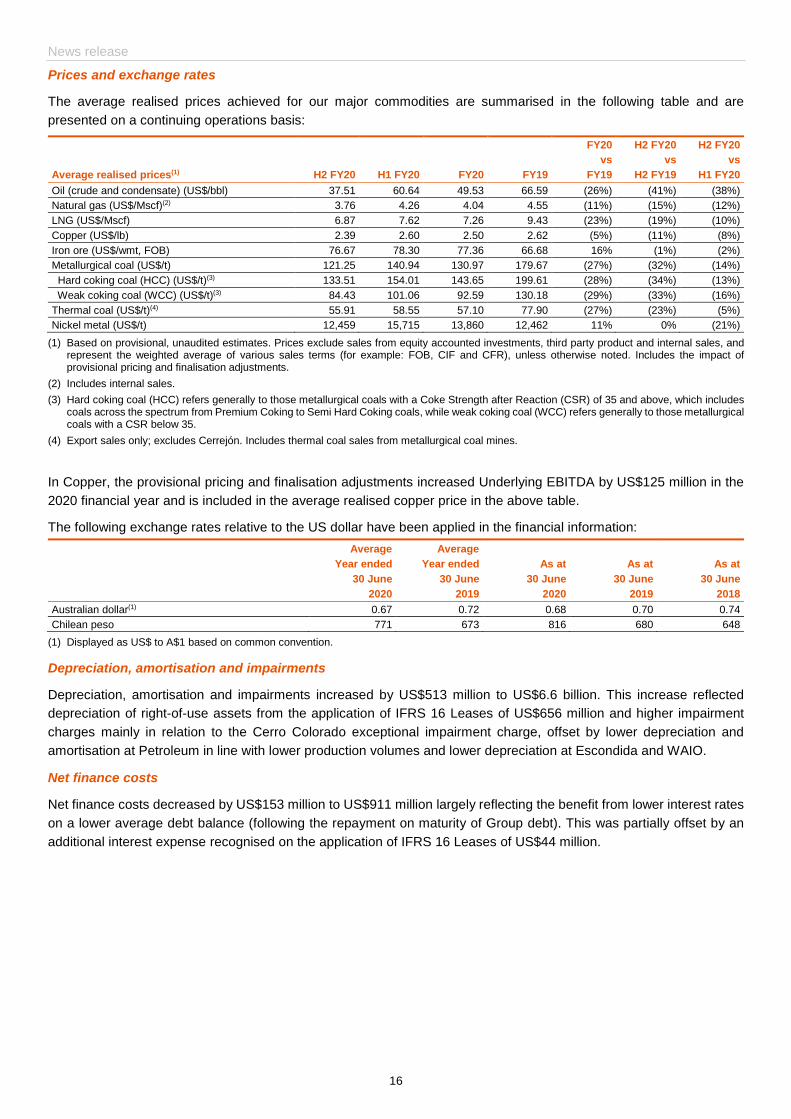
Prices and exchange rates
The average realised prices achieved for our major commodities are summarised in the following table and are
presented on a continuing operations basis:
FY20 H2 FY20 H2 FY20
vs vs vs
Average realised prices(1) H2 FY20 H1 FY20 FY20 FY19 FY19 H2 FY19 H1 FY20
Oil (crude and condensate) (US$/bbl) 37.51 60.64 49.53 66.59 (26%) (41%) (38%)
Natural gas (US$/Mscf)(2) 3.76 4.26 4.04 4.55 (11%) (15%) (12%)
LNG (US$/Mscf) 6.87 7.62 7.26 9.43 (23%) (19%) (10%)
Copper (US$/lb) 2.39 2.60 2.50 2.62 (5%) (11%) (8%)
Iron ore (US$/wmt, FOB) 76.67 78.30 77.36 66.68 16% (1%) (2%)
Metallurgical coal (US$/t) 121.25 140.94 130.97 179.67 (27%) (32%) (14%)
Hard coking coal (HCC) (US$/t)(3) 133.51 154.01 143.65 199.61 (28%) (34%) (13%)
Weak coking coal (WCC) (US$/t)(3) 84.43 101.06 92.59 130.18 (29%) (33%) (16%)
Thermal coal (US$/t)(4) 55.91 58.55 57.10 77.90 (27%) (23%) (5%)
Nickel metal (US$/t) 12,459 15,715 13,860 12,462 11% 0% (21%)
(1) Based on provisional, unaudited estimates. Prices exclude sales from equity accounted investments, third party product and internal sales, and represent the weighted average of various sales terms (for example: FOB, CIF and CFR), unless otherwise noted. Includes the impact of provisional pricing and finalisation adjustments.
(2) Includes internal sales.
(3) Hard coking coal (HCC) refers generally to those metallurgical coals with a Coke Strength after Reaction (CSR) of 35 and above, which includes coals across the spectrum from Premium Coking to Semi Hard Coking coals, while weak coking coal (WCC) refers generally to those metallurgical coals with a CSR below 35.
(4) Export sales only; excludes Cerrejón. Includes thermal coal sales from metallurgical coal mines.
In Copper, the provisional pricing and finalisation adjustments increased Underlying EBITDA by US$125 million in the
2020 financial year and is included in the average realised copper price in the above table.
The following exchange rates relative to the US dollar have been applied in the financial information:
Average Average
Year ended Year ended As at As at As at
30 June 30 June 30 June 30 June 30 June
2020 2019 2020 2019 2018
Australian dollar(1) 0.67 0.72 0.68 0.70 0.74
Chilean peso 771 673 816 680 648
(1) Displayed as US$ to A$1 based on common convention.
Depreciation, amortisation and impairments
Depreciation, amortisation and impairments increased by US$513 million to US$6.6 billion. This increase reflected
depreciation of right-of-use assets from the application of IFRS 16 Leases of US$656 million and higher impairment
charges mainly in relation to the Cerro Colorado exceptional impairment charge, offset by lower depreciation and
amortisation at Petroleum in line with lower production volumes and lower depreciation at Escondida and WAIO.
Net finance costs
Net finance costs decreased by US$153 million to US$911 million largely reflecting the benefit from lower interest rates
on a lower average debt balance (following the repayment on maturity of Group debt). This was partially offset by an
additional interest expense recognised on the application of IFRS 16 Leases of US$44 million.
BHP Results for the year ended 30 June 2020
17
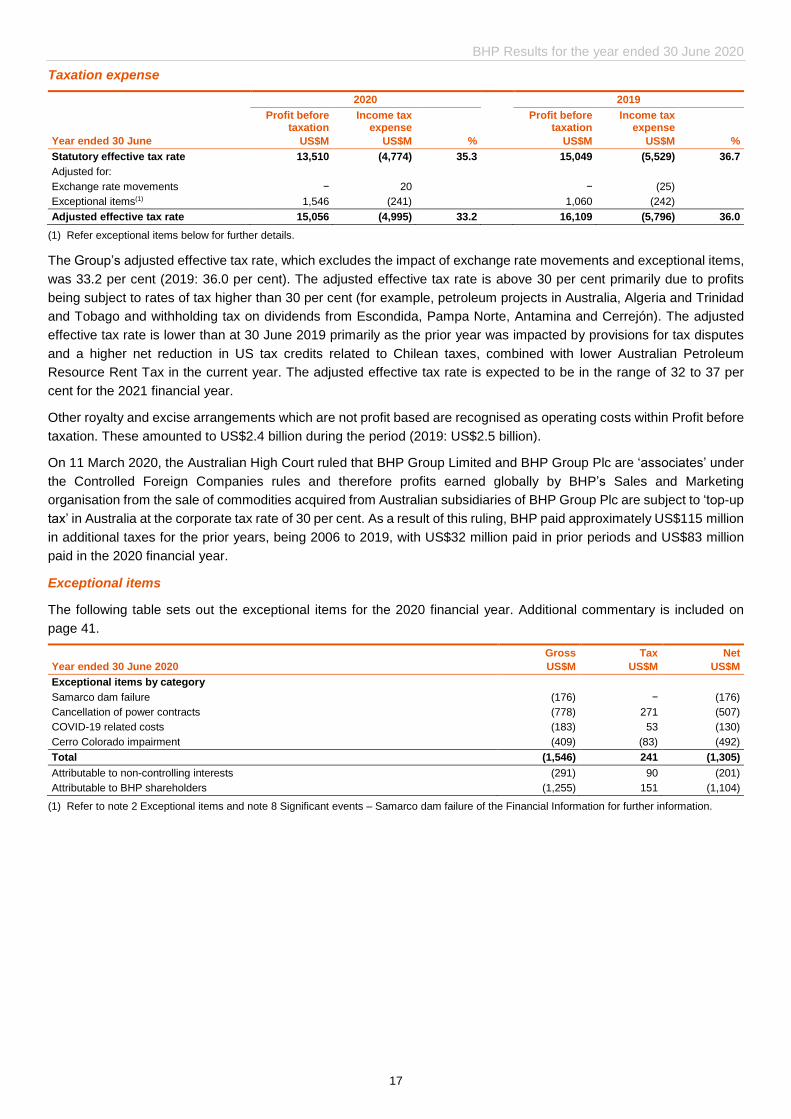
Taxation expense
2020 2019
Year ended 30 June
Profit before taxation
US$M
Income tax expense
US$M %
Profit before taxation
US$M
Income tax expense
US$M %
Statutory effective tax rate 13,510 (4,774) 35.3 15,049 (5,529) 36.7
Adjusted for:
Exchange rate movements − 20 − (25)
Exceptional items(1) 1,546 (241) 1,060 (242)
Adjusted effective tax rate 15,056 (4,995) 33.2 16,109 (5,796) 36.0
(1) Refer exceptional items below for further details.
The Group’s adjusted effective tax rate, which excludes the impact of exchange rate movements and exceptional items,
was 33.2 per cent (2019: 36.0 per cent). The adjusted effective tax rate is above 30 per cent primarily due to profits
being subject to rates of tax higher than 30 per cent (for example, petroleum projects in Australia, Algeria and Trinidad
and Tobago and withholding tax on dividends from Escondida, Pampa Norte, Antamina and Cerrejón). The adjusted
effective tax rate is lower than at 30 June 2019 primarily as the prior year was impacted by provisions for tax disputes
and a higher net reduction in US tax credits related to Chilean taxes, combined with lower Australian Petroleum
Resource Rent Tax in the current year. The adjusted effective tax rate is expected to be in the range of 32 to 37 per
cent for the 2021 financial year.
Other royalty and excise arrangements which are not profit based are recognised as operating costs within Profit before
taxation. These amounted to US$2.4 billion during the period (2019: US$2.5 billion).
On 11 March 2020, the Australian High Court ruled that BHP Group Limited and BHP Group Plc are ‘associates’ under
the Controlled Foreign Companies rules and therefore profits earned globally by BHP’s Sales and Marketing
organisation from the sale of commodities acquired from Australian subsidiaries of BHP Group Plc are subject to ‘top-up
tax’ in Australia at the corporate tax rate of 30 per cent. As a result of this ruling, BHP paid approximately US$115 million
in additional taxes for the prior years, being 2006 to 2019, with US$32 million paid in prior periods and US$83 million
paid in the 2020 financial year.
Exceptional items
The following table sets out the exceptional items for the 2020 financial year. Additional commentary is included on
page 41.
Year ended 30 June 2020
Gross
US$M
Tax
US$M
Net
US$M
Exceptional items by category
Samarco dam failure (176) − (176)
Cancellation of power contracts (778) 271 (507)
COVID-19 related costs (183) 53 (130)
Cerro Colorado impairment (409) (83) (492)
Total (1,546) 241 (1,305)
Attributable to non-controlling interests (291) 90 (201)
Attributable to BHP shareholders (1,255) 151 (1,104)
(1) Refer to note 2 Exceptional items and note 8 Significant events – Samarco dam failure of the Financial Information for further information.

News release
18
Debt management and liquidity
Net debt increased by US$2.6 billion during the 2020 financial year:
US$M
Net debt at 30 June 2019 9,446 Prior period balance restated to include the fair value of derivative financial instruments used to hedge cash and borrowings of US$231 million due to the change in net debt definition.
Application of IFRS 16:
IFRS 16 transition 1,778 New leases taken on from 1 July 2019 from the application of IFRS 16, excluding vessel lease contracts of US$523 million that are priced with reference to a freight index and are no longer included in net debt.
Other (145) Other includes new leases, repayments, discounting and transfers during the period.
1,633
Free cash flow (8,090)
Dividends paid 6,876 Dividend payments to shareholders (including FY19 final dividend and H1 FY20 interim dividend).
Dividends paid to NCI 1,043 Dividends paid to non-controlling interests.
Other movements 1,136 Includes derivatives, amortisation of discounting and other movements.
Net debt at 30 June 2020 12,044
Add cash and cash equivalents at 30 June 2020 13,426
Add vessel lease contracts(1) 1,160 Vessel lease contracts that are priced with reference to a freight index and re-measured at each reporting date.
Add derivatives included in net debt 418 Adjustment for derivatives included in net debt.
Total interest bearing liabilities at 30 June 2020 27,048
(1) Vessel lease contracts are included in total interest bearing liabilities, however as of 1 January 2020 these contracts have been excluded from net debt as they do not align with how the Group assesses net debt for decision making in relation to the Capital Allocation Framework.
During the 2020 financial year, total interest bearing liabilities increased from US$24.8 billion at 30 June 2019 to
US$27.0 billion at 30 June 2020. This reflects a US$1.6 billion impact from new leases and a US$1.2 billion impact from
vessel lease contracts that are priced with reference to a freight index (totalling US$2.8 billion) from the application of
IFRS 16 Leases, and a fair value adjustment of US$0.4 billion related to interest rate and exchange movements, partially
offset by the redemption of US$0.9 billion of bonds (consisting of an A$1 billion bond and the remaining amount of the
€600 million bond that matured).
At the subsidiary level, Escondida refinanced US$0.5 billion of maturing long-term debt.
The Group has a US$5.5 billion commercial paper program backed by a US$5.5 billion revolving credit facility, which
expires in October 2024. As at 30 June 2020, the Group had no outstanding US commercial paper, no drawn amount
under the revolving credit facility and US$13.4 billion in cash and cash equivalents.
Dividend
Our Board today determined to pay a final dividend of 55 US cents per share. The final dividend to be paid by BHP
Group Limited will be fully franked for Australian taxation purposes.
BHP’s Dividend Reinvestment Plan (DRP) will operate in respect of the final dividend. Full terms and conditions of the
DRP and details about how to participate can be found at: bhp.com
BHP Results for the year ended 30 June 2020
19
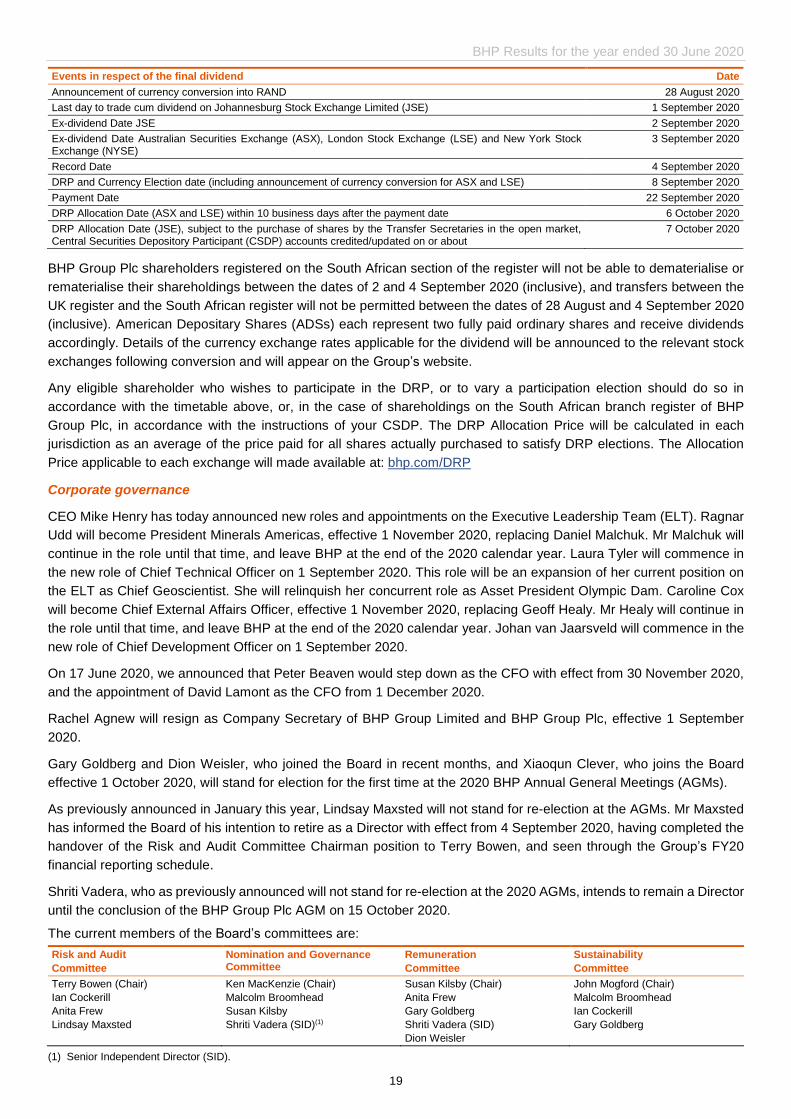
Events in respect of the final dividend Date
Announcement of currency conversion into RAND 28 August 2020
Last day to trade cum dividend on Johannesburg Stock Exchange Limited (JSE) 1 September 2020
Ex-dividend Date JSE 2 September 2020
Ex-dividend Date Australian Securities Exchange (ASX), London Stock Exchange (LSE) and New York Stock Exchange (NYSE)
3 September 2020
Record Date 4 September 2020
DRP and Currency Election date (including announcement of currency conversion for ASX and LSE) 8 September 2020
Payment Date 22 September 2020
DRP Allocation Date (ASX and LSE) within 10 business days after the payment date 6 October 2020
DRP Allocation Date (JSE), subject to the purchase of shares by the Transfer Secretaries in the open market, Central Securities Depository Participant (CSDP) accounts credited/updated on or about
7 October 2020
BHP Group Plc shareholders registered on the South African section of the register will not be able to dematerialise or
rematerialise their shareholdings between the dates of 2 and 4 September 2020 (inclusive), and transfers between the
UK register and the South African register will not be permitted between the dates of 28 August and 4 September 2020
(inclusive). American Depositary Shares (ADSs) each represent two fully paid ordinary shares and receive dividends
accordingly. Details of the currency exchange rates applicable for the dividend will be announced to the relevant stock
exchanges following conversion and will appear on the Group’s website.
Any eligible shareholder who wishes to participate in the DRP, or to vary a participation election should do so in
accordance with the timetable above, or, in the case of shareholdings on the South African branch register of BHP
Group Plc, in accordance with the instructions of your CSDP. The DRP Allocation Price will be calculated in each
jurisdiction as an average of the price paid for all shares actually purchased to satisfy DRP elections. The Allocation
Price applicable to each exchange will made available at: bhp.com/DRP
Corporate governance
CEO Mike Henry has today announced new roles and appointments on the Executive Leadership Team (ELT). Ragnar
Udd will become President Minerals Americas, effective 1 November 2020, replacing Daniel Malchuk. Mr Malchuk will
continue in the role until that time, and leave BHP at the end of the 2020 calendar year. Laura Tyler will commence in
the new role of Chief Technical Officer on 1 September 2020. This role will be an expansion of her current position on
the ELT as Chief Geoscientist. She will relinquish her concurrent role as Asset President Olympic Dam. Caroline Cox
will become Chief External Affairs Officer, effective 1 November 2020, replacing Geoff Healy. Mr Healy will continue in
the role until that time, and leave BHP at the end of the 2020 calendar year. Johan van Jaarsveld will commence in the
new role of Chief Development Officer on 1 September 2020.
On 17 June 2020, we announced that Peter Beaven would step down as the CFO with effect from 30 November 2020,
and the appointment of David Lamont as the CFO from 1 December 2020.
Rachel Agnew will resign as Company Secretary of BHP Group Limited and BHP Group Plc, effective 1 September
2020.
Gary Goldberg and Dion Weisler, who joined the Board in recent months, and Xiaoqun Clever, who joins the Board
effective 1 October 2020, will stand for election for the first time at the 2020 BHP Annual General Meetings (AGMs).
As previously announced in January this year, Lindsay Maxsted will not stand for re-election at the AGMs. Mr Maxsted
has informed the Board of his intention to retire as a Director with effect from 4 September 2020, having completed the
handover of the Risk and Audit Committee Chairman position to Terry Bowen, and seen through the Group’s FY20
financial reporting schedule.
Shriti Vadera, who as previously announced will not stand for re-election at the 2020 AGMs, intends to remain a Director
until the conclusion of the BHP Group Plc AGM on 15 October 2020.
The current members of the Board’s committees are:
Risk and Audit
Committee
Nomination and Governance Committee
Remuneration
Committee
Sustainability
Committee
Terry Bowen (Chair)
Ian Cockerill
Anita Frew
Lindsay Maxsted
Ken MacKenzie (Chair)
Malcolm Broomhead
Susan Kilsby
Shriti Vadera (SID)(1)
Susan Kilsby (Chair)
Anita Frew
Gary Goldberg
Shriti Vadera (SID)
Dion Weisler
John Mogford (Chair)
Malcolm Broomhead
Ian Cockerill
Gary Goldberg
(1) Senior Independent Director (SID).

News release
20
Segment summary(1)
A summary of performance for the 2020 and 2019 financial years is presented below.
Year ended 30 June 2020 US$M Revenue(2)
Underlying EBITDA(3)
Underlying EBIT(3)
Exceptional items(4)
Net operating
assets(3) Capital
expenditure Exploration
gross(5) Exploration
to profit(6)
Petroleum 4,070 2,207 750 (6) 8,247 909 564 394
Copper 10,666 4,347 2,590 (1,228) 24,407 2,434 54 54
Iron Ore 20,797 14,554 12,924 (614) 18,400 2,328 87 47
Coal 6,242 1,632 811 (18) 9,509 603 22 9
Group and unallocated items(7) 1,219 (669) (1,201) 413 4,340 626 13 13
Inter-segment adjustment(8) (63) − − − − − − −
Total Group 42,931 22,071 15,874 (1,453) 64,903 6,900 740 517
Year ended 30 June 2019 (Restated) US$M Revenue(2)
Underlying EBITDA(3)
Underlying EBIT(3)
Exceptional items
Net operating
assets(3) Capital
expenditure Exploration
gross(5) Exploration
to profit(6)
Petroleum 5,930 4,061 2,480 − 8,332 645 685 409
Copper 10,838 4,550 2,587 − 24,088 2,735 62 62
Iron Ore 17,255 11,129 9,397 (971) 17,486 1,611 93 41
Coal 9,121 4,067 3,400 − 9,674 655 23 15
Group and unallocated items(7) 1,225 (649) (799) 19 2,476 604 10 10
Inter-segment adjustment(8) (81) − − − − − − −
Total Group 44,288 23,158 17,065 (952) 62,056 6,250 873 537
(1) Group and segment level information is reported on a statutory basis which reflects the application of the equity accounting method in preparing the Group financial statements – in accordance with IFRS. Underlying EBITDA of the Group and the reportable segments, includes depreciation, amortisation and impairments (D&A), net finance costs and taxation expense of US$446 million (2019: US$505 million) related to equity accounted investments. It excludes exceptional items loss of US$508 million (2019: US$945 million loss) related to share of profit/loss from equity accounted investments, related impairments and expenses.
Group profit before taxation comprised Underlying EBITDA, exceptional items, depreciation, amortisation and impairments of US$7,650 million (2019: US$7,045 million) and net finance costs of US$911 million (2019: US$1,064 million).
(2) Revenue is based on Group realised prices and includes third party products. Sale of third party products by the Group contributed revenue of US$1,171 million and Underlying EBITDA of US$32 million (2019: US$1,198 million and US$129 million).
(3) For more information on the reconciliation of certain alternative performance measures to our statutory measures, reasons for usefulness and calculation methodology, please refer to alternative performance measures set on pages 51 and 62.
(4) Exceptional items loss of US$1,453 million excludes net finance costs of US$93 million included in the total loss before taxation of US$176 million related to the Samarco dam failure. Refer to note 2 Exceptional items and note 8 Significant events – Samarco dam failure of the Financial Information for further information.
(5) Includes US$223 million capitalised exploration (2019: US$357 million).
(6) Includes US$ nil of exploration expenditure previously capitalised, written off as impaired (included in depreciation and amortisation) (2019: US$21 million).
(7) Group and unallocated items includes functions, other unallocated operations including Potash, Nickel West and legacy assets (previously disclosed as closed mines in the Petroleum reportable segment), and consolidation adjustments. Comparative information for the year ended 30 June 2019 have been restated to reflect the inclusion of legacy assets in Group and unallocated items. Revenue not attributable to reportable segments comprises the sale of freight and fuel to third parties, as well as revenues from unallocated operations. Exploration and technology activities are recognised within relevant segments.
Year ended 30 June 2020 US$M Revenue
Underlying EBITDA(3) D&A
Underlying EBIT(3)
Net operating
assets(3) Capital
expenditure Exploration
gross Exploration
to profit
Potash − (127) 3 (130) 4,068 201 − −
Nickel West 1,189 (37) 71 (108) 60 254 13 13
Year ended 30 June 2019 US$M Revenue
Underlying EBITDA(3) D&A
Underlying EBIT(3)
Net operating
assets(3) Capital
expenditure Exploration
gross Exploration
to profit
Potash − (127) 4 (131) 3,737 174 − −
Nickel West 1,193 102 11 91 (158) 274 9 9
(8) Comprises revenue of US$62 million generated by Petroleum (2019: US$77 million), US$1 million generated by Coal (2019: US$ nil) and US$ nil generated by Iron Ore (2019: US$4 million).
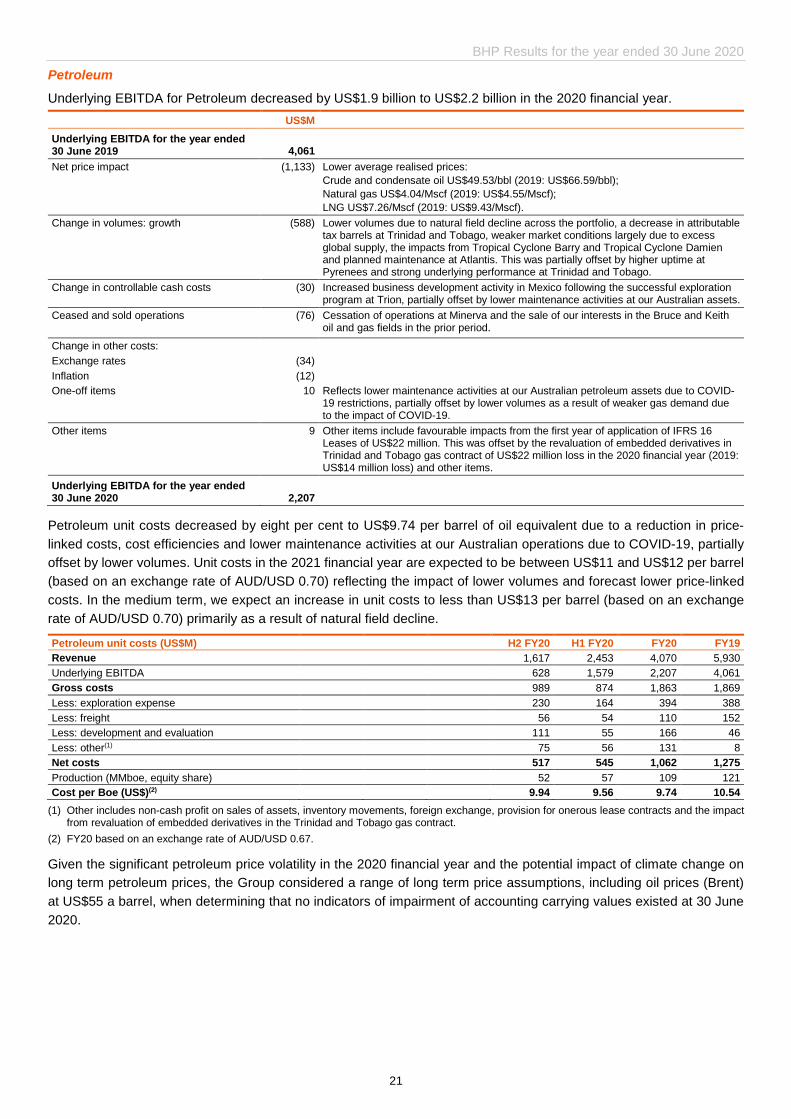
BHP Results for the year ended 30 June 2020
21
Petroleum
Underlying EBITDA for Petroleum decreased by US$1.9 billion to US$2.2 billion in the 2020 financial year.
US$M
Underlying EBITDA for the year ended 30 June 2019 4,061
Net price impact (1,133) Lower average realised prices:
Crude and condensate oil US$49.53/bbl (2019: US$66.59/bbl);
Natural gas US$4.04/Mscf (2019: US$4.55/Mscf);
LNG US$7.26/Mscf (2019: US$9.43/Mscf).
Change in volumes: growth (588) Lower volumes due to natural field decline across the portfolio, a decrease in attributable tax barrels at Trinidad and Tobago, weaker market conditions largely due to excess global supply, the impacts from Tropical Cyclone Barry and Tropical Cyclone Damien and planned maintenance at Atlantis. This was partially offset by higher uptime at Pyrenees and strong underlying performance at Trinidad and Tobago.
Change in controllable cash costs (30) Increased business development activity in Mexico following the successful exploration program at Trion, partially offset by lower maintenance activities at our Australian assets.
Ceased and sold operations (76) Cessation of operations at Minerva and the sale of our interests in the Bruce and Keith oil and gas fields in the prior period.
Change in other costs:
Exchange rates (34)
Inflation (12)
One-off items 10 Reflects lower maintenance activities at our Australian petroleum assets due to COVID-19 restrictions, partially offset by lower volumes as a result of weaker gas demand due to the impact of COVID-19.
Other items 9 Other items include favourable impacts from the first year of application of IFRS 16 Leases of US$22 million. This was offset by the revaluation of embedded derivatives in Trinidad and Tobago gas contract of US$22 million loss in the 2020 financial year (2019: US$14 million loss) and other items.
Underlying EBITDA for the year ended 30 June 2020 2,207
Petroleum unit costs decreased by eight per cent to US$9.74 per barrel of oil equivalent due to a reduction in price-
linked costs, cost efficiencies and lower maintenance activities at our Australian operations due to COVID-19, partially
offset by lower volumes. Unit costs in the 2021 financial year are expected to be between US$11 and US$12 per barrel
(based on an exchange rate of AUD/USD 0.70) reflecting the impact of lower volumes and forecast lower price-linked
costs. In the medium term, we expect an increase in unit costs to less than US$13 per barrel (based on an exchange
rate of AUD/USD 0.70) primarily as a result of natural field decline.
Petroleum unit costs (US$M) H2 FY20 H1 FY20 FY20 FY19
Revenue 1,617 2,453 4,070 5,930
Underlying EBITDA 628 1,579 2,207 4,061
Gross costs 989 874 1,863 1,869
Less: exploration expense 230 164 394 388
Less: freight 56 54 110 152
Less: development and evaluation 111 55 166 46
Less: other(1) 75 56 131 8
Net costs 517 545 1,062 1,275
Production (MMboe, equity share) 52 57 109 121
Cost per Boe (US$)(2) 9.94 9.56 9.74 10.54
(1) Other includes non-cash profit on sales of assets, inventory movements, foreign exchange, provision for onerous lease contracts and the impact from revaluation of embedded derivatives in the Trinidad and Tobago gas contract.
(2) FY20 based on an exchange rate of AUD/USD 0.67.
Given the significant petroleum price volatility in the 2020 financial year and the potential impact of climate change on
long term petroleum prices, the Group considered a range of long term price assumptions, including oil prices (Brent)
at US$55 a barrel, when determining that no indicators of impairment of accounting carrying values existed at 30 June
2020.
News release
22
As previously announced, in light of the significant disruption to oil and gas markets we have reviewed our investment
program for the next 12 months. Petroleum capital and exploration expenditure of approximately US$1.6 billion is now
planned in the 2021 financial year as a result of a delay of the Scarborough gas development and several small and
medium sized projects, and an approximately US$250 million reduction in our exploration and appraisal program. These
delays will maximise the value of the projects by ensuring that production will commence at a time when we expect
prices to be higher. Reflecting these changes in our plans as well as natural field decline, production is expected to
average approximately 104 MMboe over the next five years, with lower volumes now also expected at the end of the
five year period as a result of the delay of the Scarborough gas development.
Petroleum exploration
Petroleum exploration expenditure for the 2020 financial year was US$564 million, of which US$394 million was
expensed. An approximately US$450 million exploration and appraisal program is planned for the 2021 financial year.
This is a reduction of approximately US$250 million to our medium-term program, and as a result, our focus will be on
delivering the highest priority opportunities in the portfolio and our licence commitments. The 2021 financial year
exploration and appraisal program includes the Broadside exploration well in our Trinidad and Tobago Southern
licences, preparation for exploration drilling in our Green Canyon blocks in the US Gulf of Mexico and appraisal planning
in our Trinidad and Tobago Northern licences. Our planned activities are subject to any further COVID-19 delays.
In Trinidad and Tobago, we drilled two exploration wells in our Northern licences and completed Phase 4 of our
deepwater drilling campaign in the first half of the 2020 financial year. The campaign included two wells; Boom-1(v)
encountered hydrocarbons and Carnival-1(v) was a dry hole. Technical work is ongoing to evaluate an appraisal program,
development planning and commercial options for the discoveries in the Northern Gas play.
In Barbados, the offshore exploration licences for the Carlisle Bay and Bimshire blocks were declared effective as of
27 January 2020. The first exploration phase is a three-year program with commitment of seismic data.
In the US Gulf of Mexico, we expanded our acreage positions through lease sale participation. In the 2020 financial
year, the Regulator awarded two blocks (vi) in Green Canyon, central Gulf of Mexico and 19 blocks(vii) in the western Gulf
of Mexico. In July 2020, the Regulator awarded two blocks(viii) in Green Canyon, central Gulf of Mexico and three blocks(ix)
in the western Gulf of Mexico. In the western US Gulf of Mexico, the final processed data from the Ocean Bottom Node(x)
seismic acquisition was received in April 2020 and technical work is ongoing to inform the exploration program. We
continue to advance evaluation of options to optimise value at Wildling through progressive development of the
discovery. Different options for the development concept are under review, including a tieback to the Shenzi facility.
In Mexico, we drilled the Trion 3DEL appraisal well(v) in the first half of the 2020 financial year where we encountered
oil in the reservoirs up dip from all previous well intersections. The results provided greater confidence around the scale,
and quality, of the resource and we now have sufficient information to underpin development planning.
In Eastern Canada, technical evaluation is ongoing on our two licences in the Orphan Basin to support exploration well
planning.
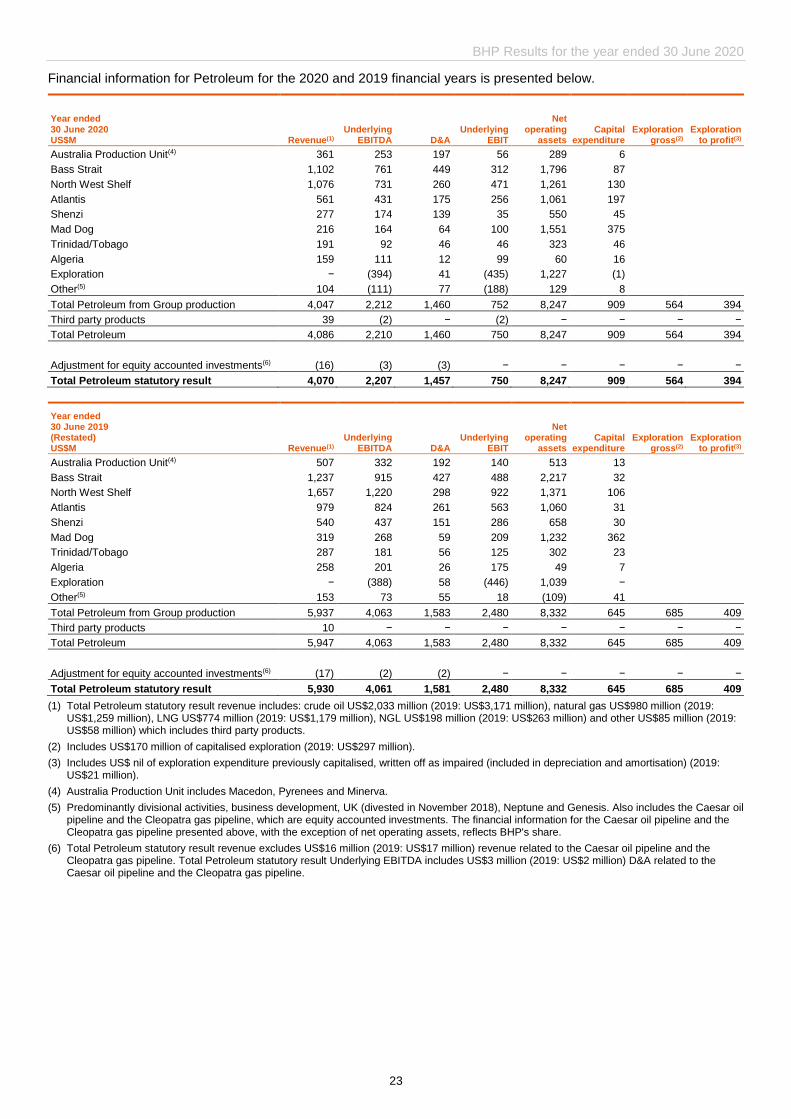
BHP Results for the year ended 30 June 2020
23
Financial information for Petroleum for the 2020 and 2019 financial years is presented below.
Year ended 30 June 2020 US$M Revenue(1)
Underlying EBITDA D&A
Underlying EBIT
Net operating
assets Capital
expenditure Exploration
gross(2) Exploration
to profit(3)
Australia Production Unit(4) 361 253 197 56 289 6
Bass Strait 1,102 761 449 312 1,796 87
North West Shelf 1,076 731 260 471 1,261 130
Atlantis 561 431 175 256 1,061 197
Shenzi 277 174 139 35 550 45
Mad Dog 216 164 64 100 1,551 375
Trinidad/Tobago 191 92 46 46 323 46
Algeria 159 111 12 99 60 16
Exploration − (394) 41 (435) 1,227 (1)
Other(5) 104 (111) 77 (188) 129 8
Total Petroleum from Group production 4,047 2,212 1,460 752 8,247 909 564 394
Third party products 39 (2) − (2) − − − −
Total Petroleum 4,086 2,210 1,460 750 8,247 909 564 394
Adjustment for equity accounted investments(6) (16) (3) (3) − − − − −
Total Petroleum statutory result 4,070 2,207 1,457 750 8,247 909 564 394
Year ended 30 June 2019 (Restated) US$M Revenue(1)
Underlying EBITDA D&A
Underlying EBIT
Net operating
assets Capital
expenditure Exploration
gross(2) Exploration
to profit(3)
Australia Production Unit(4) 507 332 192 140 513 13
Bass Strait 1,237 915 427 488 2,217 32
North West Shelf 1,657 1,220 298 922 1,371 106
Atlantis 979 824 261 563 1,060 31
Shenzi 540 437 151 286 658 30
Mad Dog 319 268 59 209 1,232 362
Trinidad/Tobago 287 181 56 125 302 23
Algeria 258 201 26 175 49 7
Exploration − (388) 58 (446) 1,039 −
Other(5) 153 73 55 18 (109) 41
Total Petroleum from Group production 5,937 4,063 1,583 2,480 8,332 645 685 409
Third party products 10 − − − − − − −
Total Petroleum 5,947 4,063 1,583 2,480 8,332 645 685 409
Adjustment for equity accounted investments(6) (17) (2) (2) − − − − −
Total Petroleum statutory result 5,930 4,061 1,581 2,480 8,332 645 685 409
(1) Total Petroleum statutory result revenue includes: crude oil US$2,033 million (2019: US$3,171 million), natural gas US$980 million (2019: US$1,259 million), LNG US$774 million (2019: US$1,179 million), NGL US$198 million (2019: US$263 million) and other US$85 million (2019: US$58 million) which includes third party products.
(2) Includes US$170 million of capitalised exploration (2019: US$297 million).
(3) Includes US$ nil of exploration expenditure previously capitalised, written off as impaired (included in depreciation and amortisation) (2019: US$21 million).
(4) Australia Production Unit includes Macedon, Pyrenees and Minerva.
(5) Predominantly divisional activities, business development, UK (divested in November 2018), Neptune and Genesis. Also includes the Caesar oil pipeline and the Cleopatra gas pipeline, which are equity accounted investments. The financial information for the Caesar oil pipeline and the Cleopatra gas pipeline presented above, with the exception of net operating assets, reflects BHP's share.
(6) Total Petroleum statutory result revenue excludes US$16 million (2019: US$17 million) revenue related to the Caesar oil pipeline and the Cleopatra gas pipeline. Total Petroleum statutory result Underlying EBITDA includes US$3 million (2019: US$2 million) D&A related to the Caesar oil pipeline and the Cleopatra gas pipeline.
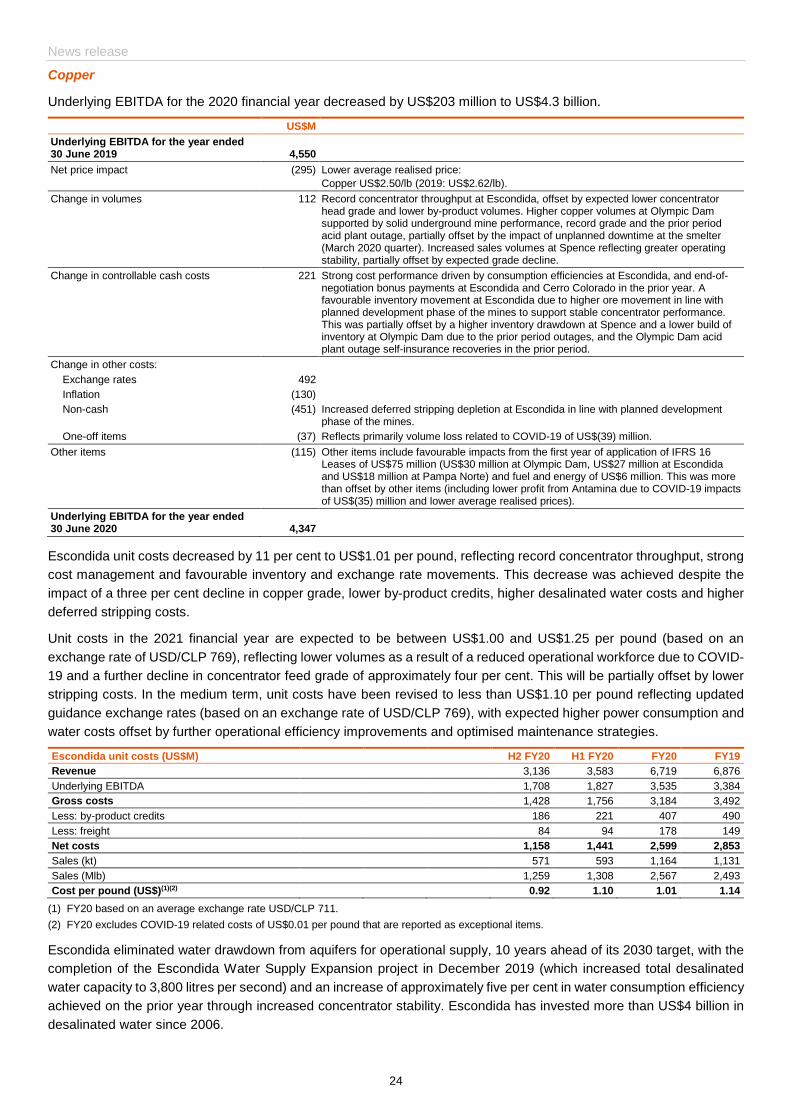
News release
24
Copper
Underlying EBITDA for the 2020 financial year decreased by US$203 million to US$4.3 billion.
US$M
Underlying EBITDA for the year ended 30 June 2019 4,550
Net price impact (295) Lower average realised price:
Copper US$2.50/lb (2019: US$2.62/lb).
Change in volumes 112 Record concentrator throughput at Escondida, offset by expected lower concentrator head grade and lower by-product volumes. Higher copper volumes at Olympic Dam supported by solid underground mine performance, record grade and the prior period acid plant outage, partially offset by the impact of unplanned downtime at the smelter (March 2020 quarter). Increased sales volumes at Spence reflecting greater operating stability, partially offset by expected grade decline.
Change in controllable cash costs 221 Strong cost performance driven by consumption efficiencies at Escondida, and end-of-negotiation bonus payments at Escondida and Cerro Colorado in the prior year. A favourable inventory movement at Escondida due to higher ore movement in line with planned development phase of the mines to support stable concentrator performance. This was partially offset by a higher inventory drawdown at Spence and a lower build of inventory at Olympic Dam due to the prior period outages, and the Olympic Dam acid plant outage self-insurance recoveries in the prior period.
Change in other costs:
Exchange rates 492
Inflation (130)
Non-cash (451) Increased deferred stripping depletion at Escondida in line with planned development phase of the mines.
One-off items (37) Reflects primarily volume loss related to COVID-19 of US$(39) million.
Other items (115) Other items include favourable impacts from the first year of application of IFRS 16 Leases of US$75 million (US$30 million at Olympic Dam, US$27 million at Escondida and US$18 million at Pampa Norte) and fuel and energy of US$6 million. This was more than offset by other items (including lower profit from Antamina due to COVID-19 impacts of US$(35) million and lower average realised prices).
Underlying EBITDA for the year ended 30 June 2020 4,347
Escondida unit costs decreased by 11 per cent to US$1.01 per pound, reflecting record concentrator throughput, strong
cost management and favourable inventory and exchange rate movements. This decrease was achieved despite the
impact of a three per cent decline in copper grade, lower by-product credits, higher desalinated water costs and higher
deferred stripping costs.
Unit costs in the 2021 financial year are expected to be between US$1.00 and US$1.25 per pound (based on an
exchange rate of USD/CLP 769), reflecting lower volumes as a result of a reduced operational workforce due to COVID-
19 and a further decline in concentrator feed grade of approximately four per cent. This will be partially offset by lower
stripping costs. In the medium term, unit costs have been revised to less than US$1.10 per pound reflecting updated
guidance exchange rates (based on an exchange rate of USD/CLP 769), with expected higher power consumption and
water costs offset by further operational efficiency improvements and optimised maintenance strategies.
Escondida unit costs (US$M) H2 FY20 H1 FY20 FY20 FY19
Revenue 3,136 3,583 6,719 6,876
Underlying EBITDA 1,708 1,827 3,535 3,384
Gross costs 1,428 1,756 3,184 3,492
Less: by-product credits 186 221 407 490
Less: freight 84 94 178 149
Net costs 1,158 1,441 2,599 2,853
Sales (kt) 571 593 1,164 1,131
Sales (Mlb) 1,259 1,308 2,567 2,493
Cost per pound (US$)(1)(2) 0.92 1.10 1.01 1.14
(1) FY20 based on an average exchange rate USD/CLP 711.
(2) FY20 excludes COVID-19 related costs of US$0.01 per pound that are reported as exceptional items.
Escondida eliminated water drawdown from aquifers for operational supply, 10 years ahead of its 2030 target, with the
completion of the Escondida Water Supply Expansion project in December 2019 (which increased total desalinated
water capacity to 3,800 litres per second) and an increase of approximately five per cent in water consumption efficiency
achieved on the prior year through increased concentrator stability. Escondida has invested more than US$4 billion in
desalinated water since 2006.
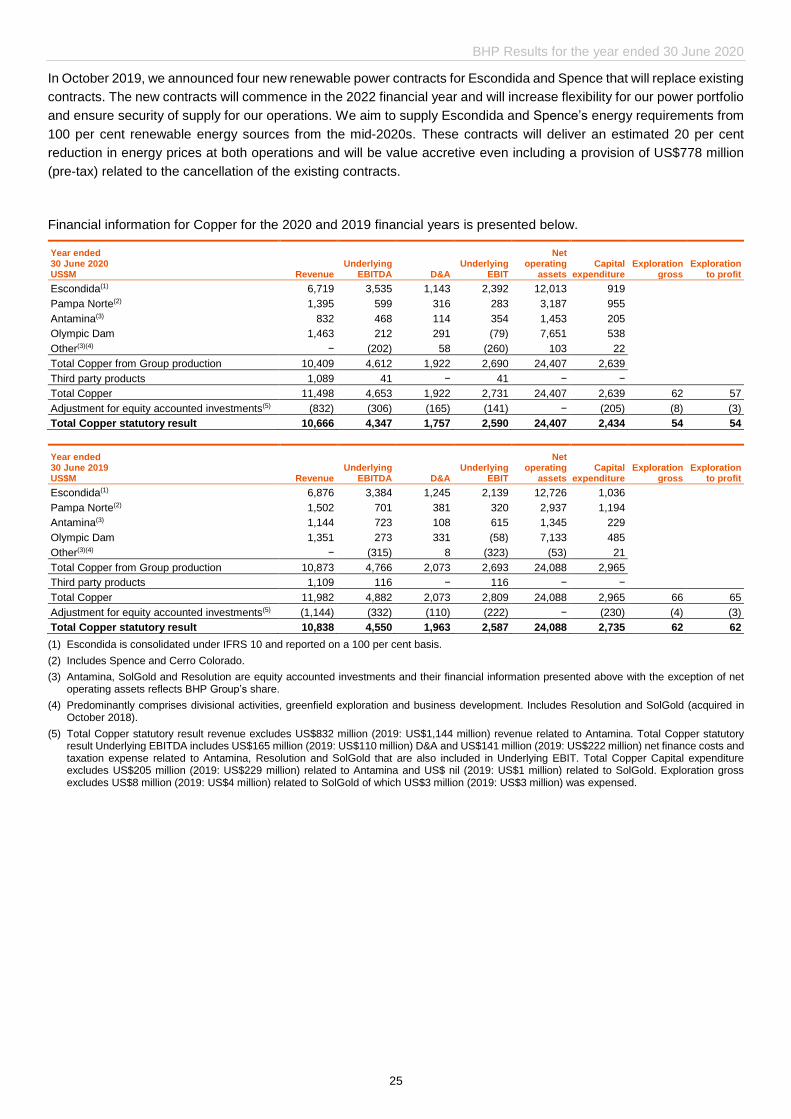
BHP Results for the year ended 30 June 2020
25
In October 2019, we announced four new renewable power contracts for Escondida and Spence that will replace existing
contracts. The new contracts will commence in the 2022 financial year and will increase flexibility for our power portfolio
and ensure security of supply for our operations. We aim to supply Escondida and Spence’s energy requirements from
100 per cent renewable energy sources from the mid-2020s. These contracts will deliver an estimated 20 per cent
reduction in energy prices at both operations and will be value accretive even including a provision of US$778 million
(pre-tax) related to the cancellation of the existing contracts.
Financial information for Copper for the 2020 and 2019 financial years is presented below.
Year ended 30 June 2020 US$M Revenue
Underlying EBITDA D&A
Underlying EBIT
Net operating
assets Capital
expenditure Exploration
gross Exploration
to profit
Escondida(1) 6,719 3,535 1,143 2,392 12,013 919
Pampa Norte(2) 1,395 599 316 283 3,187 955
Antamina(3) 832 468 114 354 1,453 205
Olympic Dam 1,463 212 291 (79) 7,651 538
Other(3)(4) − (202) 58 (260) 103 22
Total Copper from Group production 10,409 4,612 1,922 2,690 24,407 2,639
Third party products 1,089 41 − 41 − −
Total Copper 11,498 4,653 1,922 2,731 24,407 2,639 62 57
Adjustment for equity accounted investments(5) (832) (306) (165) (141) − (205) (8) (3)
Total Copper statutory result 10,666 4,347 1,757 2,590 24,407 2,434 54 54
Year ended 30 June 2019 US$M Revenue
Underlying EBITDA D&A
Underlying EBIT
Net operating
assets Capital
expenditure Exploration
gross Exploration
to profit
Escondida(1) 6,876 3,384 1,245 2,139 12,726 1,036
Pampa Norte(2) 1,502 701 381 320 2,937 1,194
Antamina(3) 1,144 723 108 615 1,345 229
Olympic Dam 1,351 273 331 (58) 7,133 485
Other(3)(4) − (315) 8 (323) (53) 21
Total Copper from Group production 10,873 4,766 2,073 2,693 24,088 2,965
Third party products 1,109 116 − 116 − −
Total Copper 11,982 4,882 2,073 2,809 24,088 2,965 66 65
Adjustment for equity accounted investments(5) (1,144) (332) (110) (222) − (230) (4) (3)
Total Copper statutory result 10,838 4,550 1,963 2,587 24,088 2,735 62 62
(1) Escondida is consolidated under IFRS 10 and reported on a 100 per cent basis.
(2) Includes Spence and Cerro Colorado.
(3) Antamina, SolGold and Resolution are equity accounted investments and their financial information presented above with the exception of net operating assets reflects BHP Group’s share.
(4) Predominantly comprises divisional activities, greenfield exploration and business development. Includes Resolution and SolGold (acquired in October 2018).
(5) Total Copper statutory result revenue excludes US$832 million (2019: US$1,144 million) revenue related to Antamina. Total Copper statutory result Underlying EBITDA includes US$165 million (2019: US$110 million) D&A and US$141 million (2019: US$222 million) net finance costs and taxation expense related to Antamina, Resolution and SolGold that are also included in Underlying EBIT. Total Copper Capital expenditure excludes US$205 million (2019: US$229 million) related to Antamina and US$ nil (2019: US$1 million) related to SolGold. Exploration gross excludes US$8 million (2019: US$4 million) related to SolGold of which US$3 million (2019: US$3 million) was expensed.
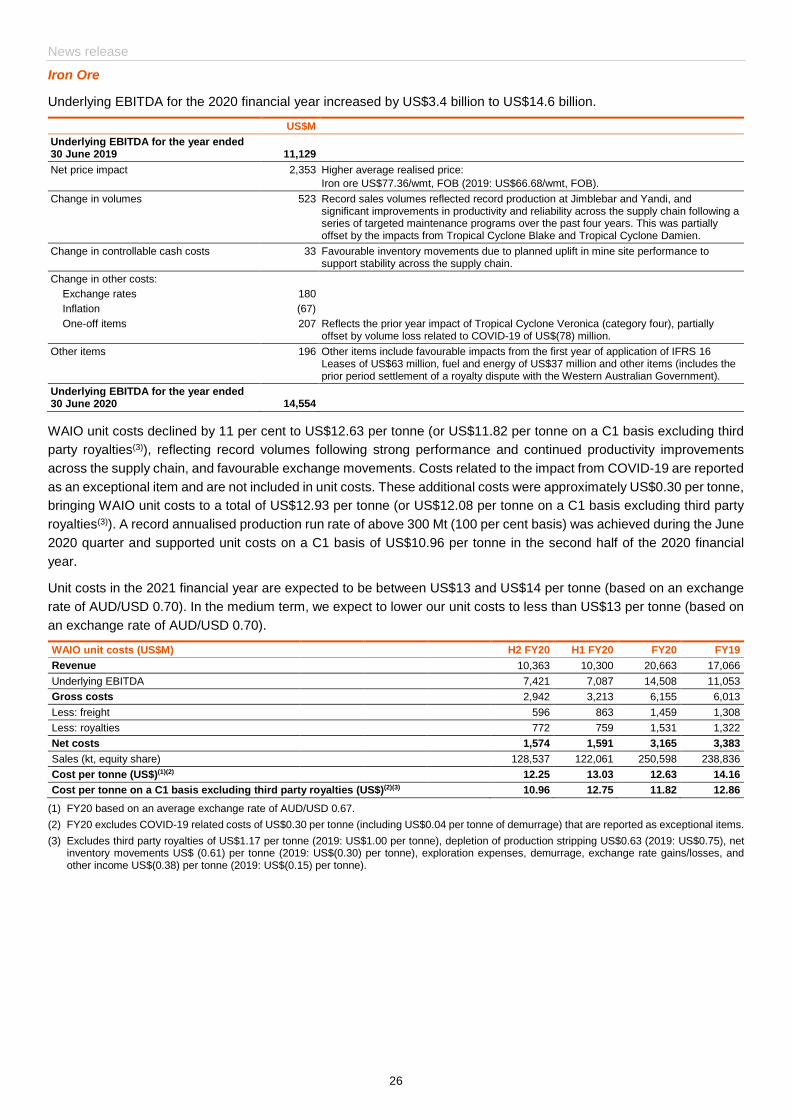
News release
26
Iron Ore
Underlying EBITDA for the 2020 financial year increased by US$3.4 billion to US$14.6 billion.
US$M
Underlying EBITDA for the year ended 30 June 2019 11,129
Net price impact 2,353 Higher average realised price:
Iron ore US$77.36/wmt, FOB (2019: US$66.68/wmt, FOB).
Change in volumes 523 Record sales volumes reflected record production at Jimblebar and Yandi, and significant improvements in productivity and reliability across the supply chain following a series of targeted maintenance programs over the past four years. This was partially offset by the impacts from Tropical Cyclone Blake and Tropical Cyclone Damien.
Change in controllable cash costs 33 Favourable inventory movements due to planned uplift in mine site performance to support stability across the supply chain.
Change in other costs:
Exchange rates 180
Inflation (67)
One-off items 207 Reflects the prior year impact of Tropical Cyclone Veronica (category four), partially offset by volume loss related to COVID-19 of US$(78) million.
Other items 196 Other items include favourable impacts from the first year of application of IFRS 16 Leases of US$63 million, fuel and energy of US$37 million and other items (includes the prior period settlement of a royalty dispute with the Western Australian Government).
Underlying EBITDA for the year ended 30 June 2020 14,554
WAIO unit costs declined by 11 per cent to US$12.63 per tonne (or US$11.82 per tonne on a C1 basis excluding third
party royalties(3)), reflecting record volumes following strong performance and continued productivity improvements
across the supply chain, and favourable exchange movements. Costs related to the impact from COVID-19 are reported
as an exceptional item and are not included in unit costs. These additional costs were approximately US$0.30 per tonne,
bringing WAIO unit costs to a total of US$12.93 per tonne (or US$12.08 per tonne on a C1 basis excluding third party
royalties(3)). A record annualised production run rate of above 300 Mt (100 per cent basis) was achieved during the June
2020 quarter and supported unit costs on a C1 basis of US$10.96 per tonne in the second half of the 2020 financial
year.
Unit costs in the 2021 financial year are expected to be between US$13 and US$14 per tonne (based on an exchange
rate of AUD/USD 0.70). In the medium term, we expect to lower our unit costs to less than US$13 per tonne (based on
an exchange rate of AUD/USD 0.70).
WAIO unit costs (US$M) H2 FY20 H1 FY20 FY20 FY19
Revenue 10,363 10,300 20,663 17,066
Underlying EBITDA 7,421 7,087 14,508 11,053
Gross costs 2,942 3,213 6,155 6,013
Less: freight 596 863 1,459 1,308
Less: royalties 772 759 1,531 1,322
Net costs 1,574 1,591 3,165 3,383
Sales (kt, equity share) 128,537 122,061 250,598 238,836
Cost per tonne (US$)(1)(2) 12.25 13.03 12.63 14.16
Cost per tonne on a C1 basis excluding third party royalties (US$)(2)(3) 10.96 12.75 11.82 12.86
(1) FY20 based on an average exchange rate of AUD/USD 0.67.
(2) FY20 excludes COVID-19 related costs of US$0.30 per tonne (including US$0.04 per tonne of demurrage) that are reported as exceptional items.
(3) Excludes third party royalties of US$1.17 per tonne (2019: US$1.00 per tonne), depletion of production stripping US$0.63 (2019: US$0.75), net inventory movements US$ (0.61) per tonne (2019: US$(0.30) per tonne), exploration expenses, demurrage, exchange rate gains/losses, and other income US$(0.38) per tonne (2019: US$(0.15) per tonne).
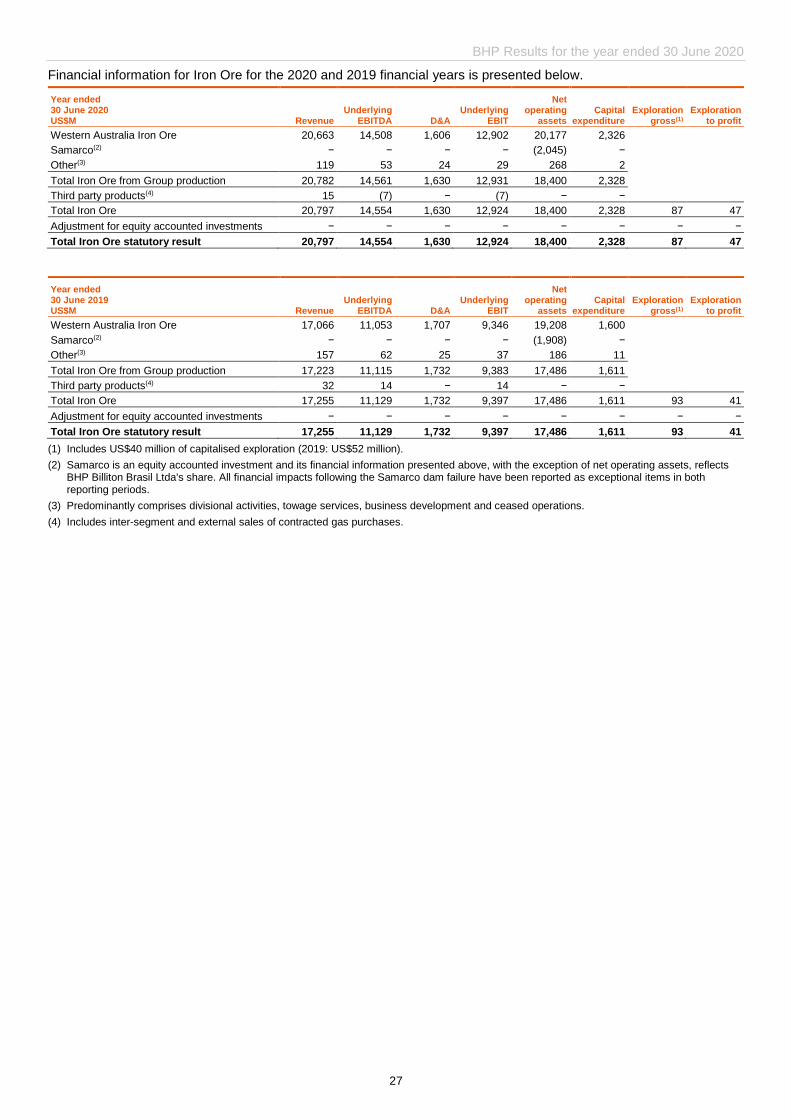
BHP Results for the year ended 30 June 2020
27
Financial information for Iron Ore for the 2020 and 2019 financial years is presented below.
Year ended 30 June 2020 US$M Revenue
Underlying EBITDA D&A
Underlying EBIT
Net operating
assets Capital
expenditure Exploration
gross(1) Exploration
to profit
Western Australia Iron Ore 20,663 14,508 1,606 12,902 20,177 2,326
Samarco(2) − − − − (2,045) −
Other(3) 119 53 24 29 268 2
Total Iron Ore from Group production 20,782 14,561 1,630 12,931 18,400 2,328
Third party products(4) 15 (7) − (7) − −
Total Iron Ore 20,797 14,554 1,630 12,924 18,400 2,328 87 47
Adjustment for equity accounted investments − − − − − − − −
Total Iron Ore statutory result 20,797 14,554 1,630 12,924 18,400 2,328 87 47
Year ended 30 June 2019 US$M Revenue
Underlying EBITDA D&A
Underlying EBIT
Net operating
assets Capital
expenditure Exploration
gross(1) Exploration
to profit
Western Australia Iron Ore 17,066 11,053 1,707 9,346 19,208 1,600
Samarco(2) − − − − (1,908) −
Other(3) 157 62 25 37 186 11
Total Iron Ore from Group production 17,223 11,115 1,732 9,383 17,486 1,611
Third party products(4) 32 14 − 14 − −
Total Iron Ore 17,255 11,129 1,732 9,397 17,486 1,611 93 41
Adjustment for equity accounted investments − − − − − − − −
Total Iron Ore statutory result 17,255 11,129 1,732 9,397 17,486 1,611 93 41
(1) Includes US$40 million of capitalised exploration (2019: US$52 million).
(2) Samarco is an equity accounted investment and its financial information presented above, with the exception of net operating assets, reflects BHP Billiton Brasil Ltda's share. All financial impacts following the Samarco dam failure have been reported as exceptional items in both reporting periods.
(3) Predominantly comprises divisional activities, towage services, business development and ceased operations.
(4) Includes inter-segment and external sales of contracted gas purchases.
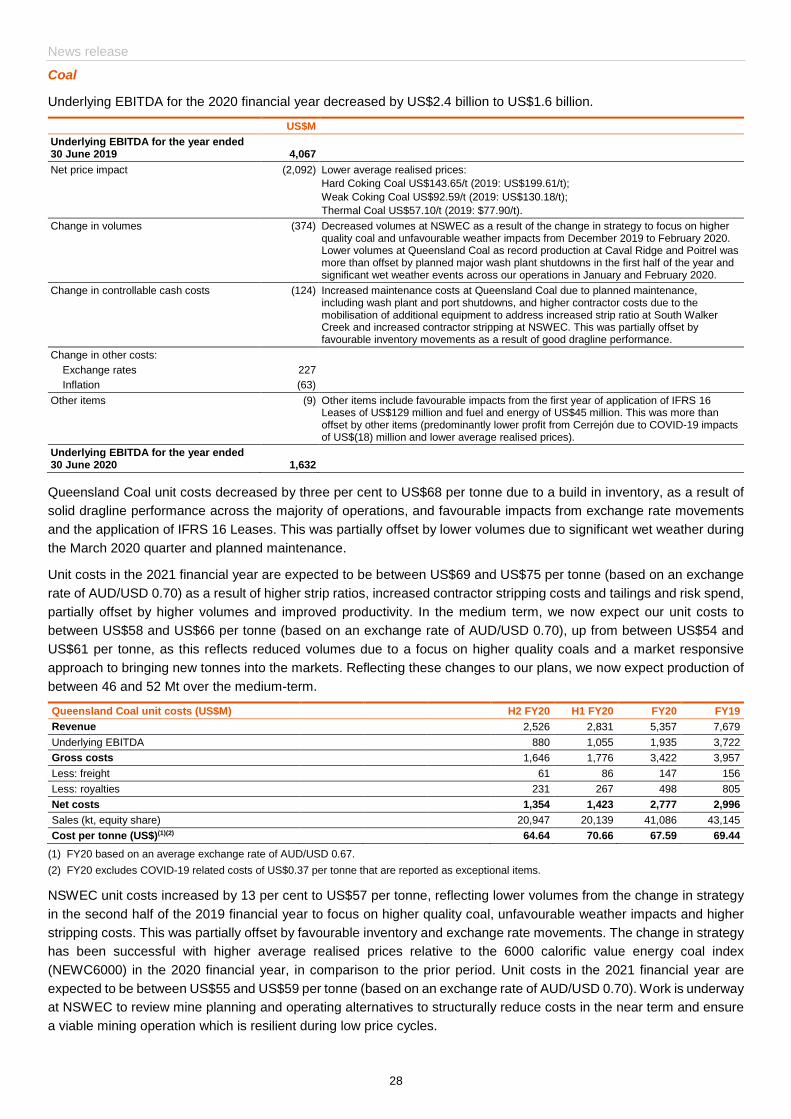
News release
28
Coal
Underlying EBITDA for the 2020 financial year decreased by US$2.4 billion to US$1.6 billion.
US$M
Underlying EBITDA for the year ended 30 June 2019 4,067
Net price impact (2,092) Lower average realised prices:
Hard Coking Coal US$143.65/t (2019: US$199.61/t);
Weak Coking Coal US$92.59/t (2019: US$130.18/t);
Thermal Coal US$57.10/t (2019: $77.90/t).
Change in volumes (374) Decreased volumes at NSWEC as a result of the change in strategy to focus on higher quality coal and unfavourable weather impacts from December 2019 to February 2020. Lower volumes at Queensland Coal as record production at Caval Ridge and Poitrel was more than offset by planned major wash plant shutdowns in the first half of the year and significant wet weather events across our operations in January and February 2020.
Change in controllable cash costs (124) Increased maintenance costs at Queensland Coal due to planned maintenance, including wash plant and port shutdowns, and higher contractor costs due to the mobilisation of additional equipment to address increased strip ratio at South Walker Creek and increased contractor stripping at NSWEC. This was partially offset by favourable inventory movements as a result of good dragline performance.
Change in other costs:
Exchange rates 227
Inflation (63)
Other items (9) Other items include favourable impacts from the first year of application of IFRS 16 Leases of US$129 million and fuel and energy of US$45 million. This was more than offset by other items (predominantly lower profit from Cerrejón due to COVID-19 impacts of US$(18) million and lower average realised prices).
Underlying EBITDA for the year ended 30 June 2020 1,632
Queensland Coal unit costs decreased by three per cent to US$68 per tonne due to a build in inventory, as a result of
solid dragline performance across the majority of operations, and favourable impacts from exchange rate movements
and the application of IFRS 16 Leases. This was partially offset by lower volumes due to significant wet weather during
the March 2020 quarter and planned maintenance.
Unit costs in the 2021 financial year are expected to be between US$69 and US$75 per tonne (based on an exchange
rate of AUD/USD 0.70) as a result of higher strip ratios, increased contractor stripping costs and tailings and risk spend,
partially offset by higher volumes and improved productivity. In the medium term, we now expect our unit costs to
between US$58 and US$66 per tonne (based on an exchange rate of AUD/USD 0.70), up from between US$54 and
US$61 per tonne, as this reflects reduced volumes due to a focus on higher quality coals and a market responsive
approach to bringing new tonnes into the markets. Reflecting these changes to our plans, we now expect production of
between 46 and 52 Mt over the medium-term.
Queensland Coal unit costs (US$M) H2 FY20 H1 FY20 FY20 FY19
Revenue 2,526 2,831 5,357 7,679
Underlying EBITDA 880 1,055 1,935 3,722
Gross costs 1,646 1,776 3,422 3,957
Less: freight 61 86 147 156
Less: royalties 231 267 498 805
Net costs 1,354 1,423 2,777 2,996
Sales (kt, equity share) 20,947 20,139 41,086 43,145
Cost per tonne (US$)(1)(2) 64.64 70.66 67.59 69.44
(1) FY20 based on an average exchange rate of AUD/USD 0.67.
(2) FY20 excludes COVID-19 related costs of US$0.37 per tonne that are reported as exceptional items.
NSWEC unit costs increased by 13 per cent to US$57 per tonne, reflecting lower volumes from the change in strategy
in the second half of the 2019 financial year to focus on higher quality coal, unfavourable weather impacts and higher
stripping costs. This was partially offset by favourable inventory and exchange rate movements. The change in strategy
has been successful with higher average realised prices relative to the 6000 calorific value energy coal index
(NEWC6000) in the 2020 financial year, in comparison to the prior period. Unit costs in the 2021 financial year are
expected to be between US$55 and US$59 per tonne (based on an exchange rate of AUD/USD 0.70). Work is underway
at NSWEC to review mine planning and operating alternatives to structurally reduce costs in the near term and ensure
a viable mining operation which is resilient during low price cycles.
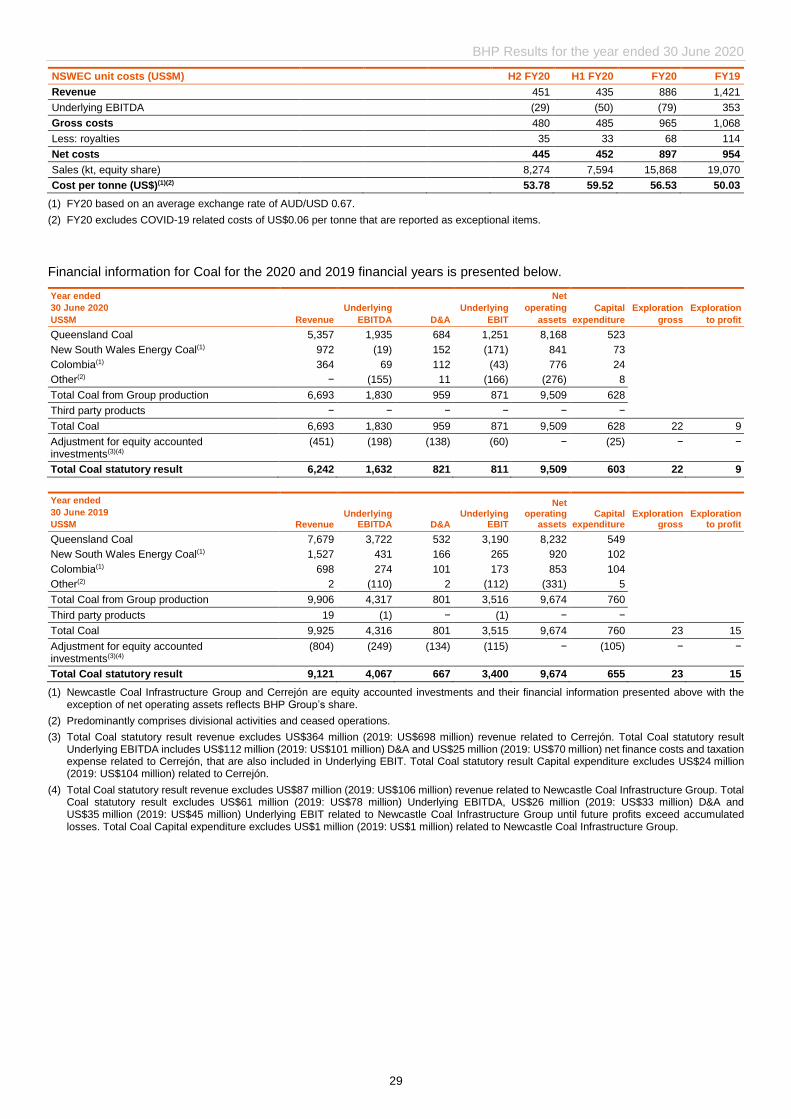
BHP Results for the year ended 30 June 2020
29
NSWEC unit costs (US$M) H2 FY20 H1 FY20 FY20 FY19
Revenue 451 435 886 1,421
Underlying EBITDA (29) (50) (79) 353
Gross costs 480 485 965 1,068
Less: royalties 35 33 68 114
Net costs 445 452 897 954
Sales (kt, equity share) 8,274 7,594 15,868 19,070
Cost per tonne (US$)(1)(2) 53.78 59.52 56.53 50.03
(1) FY20 based on an average exchange rate of AUD/USD 0.67.
(2) FY20 excludes COVID-19 related costs of US$0.06 per tonne that are reported as exceptional items.
Financial information for Coal for the 2020 and 2019 financial years is presented below.
Year ended
30 June 2020
US$M Revenue
Underlying
EBITDA D&A
Underlying
EBIT
Net
operating
assets
Capital
expenditure
Exploration
gross
Exploration
to profit
Queensland Coal 5,357 1,935 684 1,251 8,168 523
New South Wales Energy Coal(1) 972 (19) 152 (171) 841 73
Colombia(1) 364 69 112 (43) 776 24
Other(2) − (155) 11 (166) (276) 8
Total Coal from Group production 6,693 1,830 959 871 9,509 628
Third party products − − − − − −
Total Coal 6,693 1,830 959 871 9,509 628 22 9
Adjustment for equity accounted investments(3)(4)
(451) (198) (138) (60) − (25) − −
Total Coal statutory result 6,242 1,632 821 811 9,509 603 22 9
Year ended
30 June 2019
US$M Revenue Underlying
EBITDA D&A Underlying
EBIT
Net operating
assets Capital
expenditure Exploration
gross Exploration
to profit
Queensland Coal 7,679 3,722 532 3,190 8,232 549
New South Wales Energy Coal(1) 1,527 431 166 265 920 102
Colombia(1) 698 274 101 173 853 104
Other(2) 2 (110) 2 (112) (331) 5
Total Coal from Group production 9,906 4,317 801 3,516 9,674 760
Third party products 19 (1) − (1) − −
Total Coal 9,925 4,316 801 3,515 9,674 760 23 15
Adjustment for equity accounted investments(3)(4)
(804) (249) (134) (115) − (105) − −
Total Coal statutory result 9,121 4,067 667 3,400 9,674 655 23 15
(1) Newcastle Coal Infrastructure Group and Cerrejón are equity accounted investments and their financial information presented above with the exception of net operating assets reflects BHP Group’s share.
(2) Predominantly comprises divisional activities and ceased operations.
(3) Total Coal statutory result revenue excludes US$364 million (2019: US$698 million) revenue related to Cerrejón. Total Coal statutory result Underlying EBITDA includes US$112 million (2019: US$101 million) D&A and US$25 million (2019: US$70 million) net finance costs and taxation expense related to Cerrejón, that are also included in Underlying EBIT. Total Coal statutory result Capital expenditure excludes US$24 million (2019: US$104 million) related to Cerrejón.
(4) Total Coal statutory result revenue excludes US$87 million (2019: US$106 million) revenue related to Newcastle Coal Infrastructure Group. Total Coal statutory result excludes US$61 million (2019: US$78 million) Underlying EBITDA, US$26 million (2019: US$33 million) D&A and US$35 million (2019: US$45 million) Underlying EBIT related to Newcastle Coal Infrastructure Group until future profits exceed accumulated losses. Total Coal Capital expenditure excludes US$1 million (2019: US$1 million) related to Newcastle Coal Infrastructure Group.
News release
30
Greenfield minerals exploration
Consistent with our exploration focus on future facing commodities, in June 2020 at the Oak Dam copper discovery in
South Australia, we completed the third phase of the drilling program, bringing the total meters drilled to approximately
21,500 m. This follows encouraging results from the previous drilling phases, which confirmed high-grade mineralised
intercepts of copper, with associated gold, uranium and silver. The results from the latest drilling phase are currently
being analysed and an update is expected to be provided before the end of the 2020 calendar year.
We have also added to our early stage nickel optionality. In June 2020, BHP agreed to acquire the Honeymoon Well
tenements and a 50 per cent interest in the Albion Downs North and Jericho exploration joint ventures. BHP is currently
a 50 per cent shareholder in the Albion Downs North and Jericho Joint Ventures. The combined tenement package is
located in the northern Goldfields region of Western Australia, approximately 50 km from our Mt Keith mine and 100 km
from the Leinster concentrator. Completion of the agreement is subject to a number of conditions including government
and third party approvals.
Group and unallocated items
The Underlying EBITDA loss for Group and unallocated items was broadly unchanged from the prior year at
US$(669) million in the 2020 financial year. An increase in the closure and rehabilitation provision for closed mines and
a decrease in Underlying EBITDA at Nickel West was offset by favourable impacts from a change in the accounting
treatment of certain freight costs following the application of IFRS 16 Leases, exchange rate movements, as well as
from non-recurring prior year charges related to self-insurance claims (Olympic Dam acid plant outage) and restructuring
and redundancy costs (World Class Functions initiative).
Following the adoption of IFRS 16 Leases on 1 July 2019, certain freight costs previously included in Underlying EBITDA
are charged to the income statement over the term of the lease as depreciation and interest expense.
Nickel West’s Underlying EBITDA decreased from US$102 million to a loss of US$(37) million for the 2020 financial
year, reflecting lower volumes as a result of the major quadrennial maintenance shutdowns at both the refinery and the
smelter, as well as costs associated with the transition and ramp up of new mines. This decrease was partially offset by
higher prices, and favourable inventory and exchange rate movements.
Following a successful brownfield exploration program at Nickel West over a number of years, we have increased our
estimated Ore Reserves (contained Nickel) by over 90 per cent up to 1,740 kt from financial years 2017 to 2020.
BHP Results for the year ended 30 June 2020
31
The Financial Information set out on pages 34 to 50 for the year ended 30 June 2020 has been prepared on the basis of accounting policies and methods of computation consistent with those applied in the 30 June 2019 financial statements contained within the Annual Report of the Group, with the exception of new accounting standards and interpretations which became effective from 1 July 2019. This news release including the financial information is unaudited. Variance analysis relates to the relative financial and/or production performance of BHP and/or its operations during the 2020 financial year compared with the 2019 financial year, unless otherwise noted. Operations includes operated and non-operated assets, unless otherwise noted. Medium term refers to our five year plan. Numbers presented may not add up precisely to the totals provided due to rounding.
The following abbreviations may have been used throughout this report: barrels (bbl); billion cubic feet (bcf); barrels of oil equivalent (boe); billion tonnes (Bt); cost and freight (CFR); cost, insurance and freight (CIF), carbon dioxide equivalent (CO2-e), dry metric tonne unit (dmtu); free on board (FOB); giga litres (GL); grams per tonne (g/t); kilograms per tonne (kg/t); kilometre (km); metre (m); million barrels of oil equivalent (MMboe); million barrels of oil equivalent per day (MMboe/d); thousand cubic feet equivalent (Mcfe); million cubic feet per day (MMcf/d); million ounces per annum (Mozpa); million pounds (Mlb); million tonnes (Mt); million tonnes per annum (Mtpa); ounces (oz); pounds (lb); thousand barrels of oil equivalent (Mboe); thousand ounces (koz); thousand ounces per annum (kozpa); thousand standard cubic feet (Mscf); thousand tonnes (kt); thousand tonnes per annum (ktpa); thousand tonnes per day (ktpd); tonnes (t); total recordable injury frequency (TRIF); and wet metric tonnes (wmt).
The following footnotes apply to this Results Announcement:
(i) We use various alternative performance measures to reflect our underlying performance. For further information on the reconciliations of certain alternative performance measures to our statutory measures, reasons for usefulness and calculation methodology, please refer to alternative performance measures set out on pages 51 to 62.
(ii) Copper equivalent production based on 2020 financial year average realised prices. Excludes production from Onshore US.
(iii) Maintenance capital includes non-discretionary spend for the following purposes: deferred development and production stripping; risk reduction, compliance and asset integrity.
(iv) There is also a positive feedback loop to steel demand from decarbonisation. For instance, the production of wind turbines and building pipelines for the transport of captured carbon are both highly steel-intensive activities.
(v) Refer to BHP Operational Review for the quarter ended 30 September 2019 for details.
(vi) Leases were awarded in blocks: GC124 and GC168.
(vii) Leases were awarded in blocks: GB721, GB630, GB574, GB575, GB619, GB676, GB677, EB655, EB656, EB701, GB762, GB805, GB806, GB851, GB852, GB895, GB672, GB716 and GB760.
(viii) Leases were awarded in blocks: GC80 and GC123.
(ix) Leases were awarded in blocks: AC36, AC80 and AC81.
(x) WGOM OBN 2018 Seismic Permit is OCS Permit T18-010.
Forward-looking statements
This release contains forward-looking statements, including statements regarding: trends in commodity prices and currency exchange rates; demand for commodities; production forecasts; plans, strategies and objectives of management; closure or divestment of certain assets, operations or facilities (including associated costs); anticipated production or construction commencement dates; capital costs and scheduling; operating costs and shortages of materials and skilled employees; anticipated productive lives of projects, mines and facilities; provisions and contingent liabilities; and tax and regulatory developments.
Forward-looking statements may be identified by the use of terminology, including, but not limited to, ‘intend’, ‘aim’, ‘project’, ‘anticipate’, ‘estimate’, ‘plan’, ‘believe’, ‘expect’, ‘may’, ‘should’, ‘will’, ‘would’, ‘continue’, ‘annualised’ or similar words. These statements discuss future expectations concerning the results of assets or financial conditions, or provide other forward-looking information.
These forward-looking statements are based on the information available as at the date of this release and are not guarantees or predictions of future performance, and involve known and unknown risks, uncertainties and other factors, many of which are beyond our control, and which may cause actual results to differ materially from those expressed in the statements contained in this release. BHP cautions against reliance on any forward-looking statements or guidance, particularly in light of the current economic climate and the significant volatility, uncertainty and disruption arising in connection with COVID-19.
For example, our future revenues from our assets, projects or mines described in this release will be based, in part, upon the market price of the minerals, metals or petroleum produced, which may vary significantly from current levels. These variations, if materially adverse, may affect the timing or the feasibility of the development of a particular project, the expansion of certain facilities or mines, or the continuation of existing assets.
Other factors that may affect the actual construction or production commencement dates, costs or production output and anticipated lives of assets, mines or facilities include our ability to profitably produce and transport the minerals, petroleum and/or metals extracted to applicable markets; the impact of foreign currency exchange rates on the market prices of the minerals, petroleum or metals we produce; activities of government authorities in the countries where we sell our products and in the countries where we are exploring or developing projects, facilities or mines, including increases in taxes; changes in environmental and other regulations, the duration and severity of the COVID-19 pandemic and its impact on our business; political uncertainty; labour unrest; and other factors identified in the risk factors discussed in BHP’s filings with the U.S. Securities and Exchange Commission (the ‘SEC’) (including in Annual Reports on Form 20-F) which are available on the SEC’s website at www.sec.gov.
Except as required by applicable regulations or by law, BHP does not undertake to publicly update or review any forward-looking statements, whether as a result of new information or future events.
Past performance cannot be relied on as a guide to future performance.
No offer of securities
Nothing in this release should be construed as either an offer, or a solicitation of an offer, to buy or sell BHP securities in any jurisdiction, or be treated or relied upon as a recommendation or advice by BHP.
Reliance on third party information
The views expressed in this release contain information that has been derived from publicly available sources that have not been independently verified. No representation or warranty is made as to the accuracy, completeness or reliability of the information. This release should not be relied upon as a recommendation or forecast by BHP.
No financial or investment advice – South Africa
BHP does not provide any financial or investment 'advice' as that term is defined in the South African Financial Advisory and Intermediary Services Act, 37 of 2002, and we strongly recommend that you seek professional advice.

News release
32
BHP and its subsidiaries
In this release, the terms ‘BHP’, the ‘Company, the ‘Group’, ‘BHP Group’, ‘our business’, ‘organisation’, ‘we’, ‘us’, ‘our’ and ourselves’ refer to BHP Group Limited, BHP Group plc and, except where the context otherwise requires, their respective subsidiaries as defined in note 28 ‘Subsidiaries’ in section 5.1 of BHP’s 30 June 2019 Annual Report and Form 20-F.Those terms do not include non-operated assets.
This release covers BHP’s assets (including those under exploration, projects in development or execution phases, sites and closed operations) that have been wholly owned and/or operated by BHP and that have been owned as a joint venture(1) operated by BHP (referred to in this release as ‘operated assets’ or ‘operations’) during the period from 1 July 2019 to 30 June 2020. Our functions are also included.
BHP also holds interests in assets that are owned as a joint venture but not operated by BHP (referred to in this release as ‘non-operated joint ventures’ or ‘non-operated assets’). Our non-operated assets include Antamina, Cerrejón, Samarco, Atlantis, Mad Dog, Bass Strait and North West Shelf. Notwithstanding that this release may include production, financial and other information from non-operated assets, non-operated assets are not included in the BHP Group and, as a result, statements regarding our operations, assets and values apply only to our operated assets unless stated otherwise. (1) References in this release to a ‘joint venture’ are used for convenience to collectively describe assets that are not wholly owned by BHP. Such references are not intended to characterise the legal relationship between the owners of the asset.
BHP Results for the year ended 30 June 2020
33
Further information on BHP can be found at bhp.com
Authorised for lodgement by:
The Board of BHP Group Limited and BHP Group Plc
Media Relations
Email: [email protected]
Investor Relations
Email: [email protected]
Australia and Asia
Gabrielle Notley Tel: +61 3 9609 3830 Mobile: +61 411 071 715 United Kingdom and South Africa
Neil Burrows Tel: +44 20 7802 7484 Mobile: +44 7786 661 683 North America
Judy Dane Tel: +1 713 961 8283 Mobile: +1 713 299 5342
Australia and Asia
Tara Dines Tel: +61 3 9609 2222 Mobile: +61 499 249 005 United Kingdom and South Africa
Elisa Morniroli Tel: +44 20 7802 7611 Mobile: +44 7825 926 646 Americas
Brian Massey Tel: +1 713 296 7919 Mobile: +1 832 870 7677
BHP Group Limited ABN 49 004 028 077
LEI WZE1WSENV6JSZFK0JC28
Registered in Australia
Registered Office: Level 18, 171 Collins Street
Melbourne Victoria 3000 Australia
Tel +61 1300 55 4757 Fax +61 3 9609 3015
BHP Group Plc Registration number 3196209
LEI 549300C116EOWV835768
Registered in England and Wales
Registered Office: Nova South, 160 Victoria Street
London SW1E 5LB United Kingdom
Tel +44 20 7802 4000 Fax +44 20 7802 4111
Members of the BHP Group which is
headquartered in Australia
Follow us on social media

Financial information
34
BHP
Financial Information
Year ended
30 June 2020

BHP Results for the year ended 30 June 2020
35
Contents
Financial Information Page
Consolidated Income Statement for the year ended 30 June 2020 36
Consolidated Statement of Comprehensive Income for the year ended 30 June 2020 36
Consolidated Balance Sheet as at 30 June 2020 37
Consolidated Cash Flow Statement for the year ended 30 June 2020 38
Consolidated Statement of Changes in Equity for the year ended 30 June 2020 39
Notes to the Financial Information 40 - 50
The financial information included in this document for the year ended 30 June 2020 is unaudited and has been derived
from the draft financial report of the Group for the year ended 30 June 2020. The financial information does not constitute
the Group’s full statutory accounts for the year ended 30 June 2020, which will be approved by the Board, reported on
by the auditors, and subsequently filed with the UK Registrar of Companies and the Australian Securities and
Investments Commission.
The financial information set out on pages 34 to 50 for the year ended 30 June 2020 has been prepared on the basis of
accounting policies and methods of computation consistent with those applied in the 30 June 2019 financial statements
contained within the Annual Report of the Group, with the exception of the early adoption of amendments to IFRS 9
‘Financial Instruments’ and IFRS 7 ‘Financial Instruments Disclosures’ in relation to Interest Rate Benchmark Reform
and the following new accounting standards and interpretations which became effective from 1 July 2019:
IFRS 16/AASB 16 ‘Leases’; and
IFRIC 23 ‘Uncertainty over Income Tax Treatments’.
The comparative figures for the financial years ended 30 June 2019 and 30 June 2018 are not the statutory accounts
of the Group for those financial years. Those accounts have been reported on by the company’s auditor (at the relevant
time) and delivered to the Registrar of Companies. The reports of the auditor were (i) unqualified, (ii) did not include a
reference to any matters to which the auditor drew attention by way of emphasis without qualifying the reports and (iii)
did not contain a statement under Section 498(2) or (3) of the UK Companies Act 2006.
All amounts are expressed in US dollars unless otherwise noted. The Group’s presentation currency and the functional
currency of the majority of its operations is US dollars as this is the principal currency of the economic environment in
which it operates. Amounts in this financial information have, unless otherwise indicated, been rounded to the nearest
million dollars.
The financial information has been prepared on a going concern basis. Where applicable, comparative periods have
been adjusted to disclose them on the same basis as the current period figures.
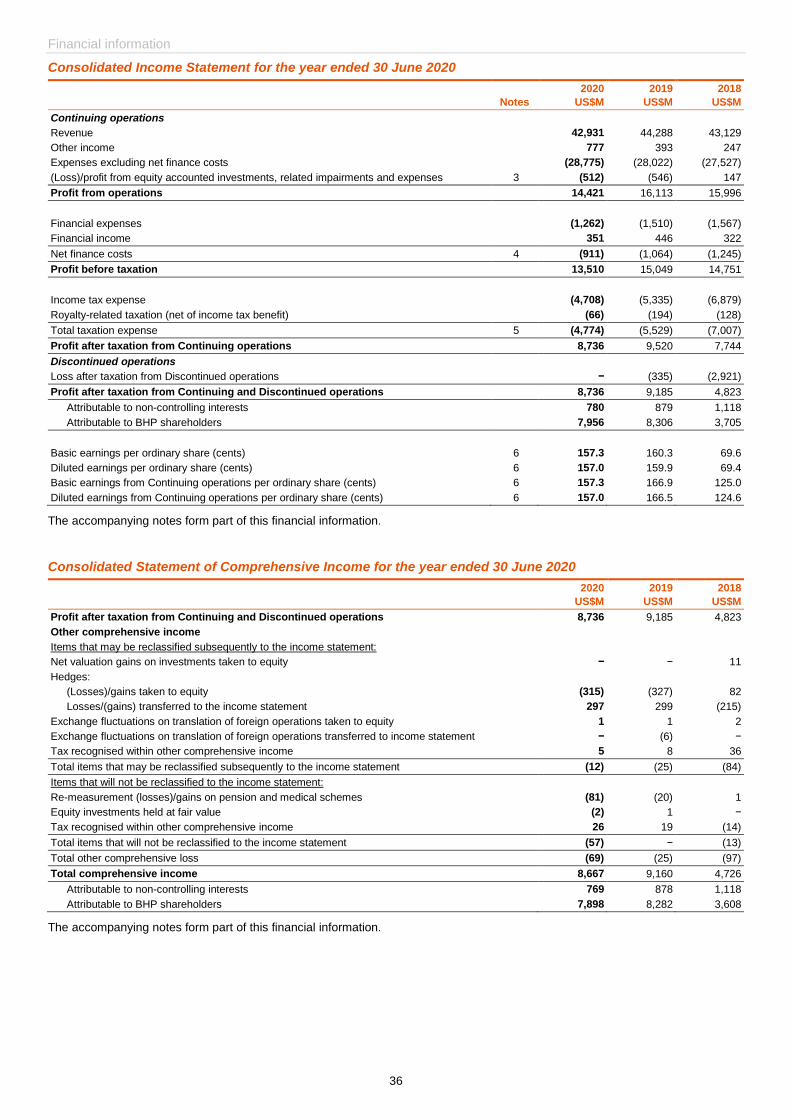
Financial information
36
Consolidated Income Statement for the year ended 30 June 2020
Notes
2020
US$M
2019
US$M
2018
US$M
Continuing operations
Revenue 42,931 44,288 43,129
Other income 777 393 247
Expenses excluding net finance costs (28,775) (28,022) (27,527)
(Loss)/profit from equity accounted investments, related impairments and expenses 3 (512) (546) 147
Profit from operations 14,421 16,113 15,996
Financial expenses (1,262) (1,510) (1,567)
Financial income 351 446 322
Net finance costs 4 (911) (1,064) (1,245)
Profit before taxation 13,510 15,049 14,751
Income tax expense (4,708) (5,335) (6,879)
Royalty-related taxation (net of income tax benefit) (66) (194) (128)
Total taxation expense 5 (4,774) (5,529) (7,007)
Profit after taxation from Continuing operations 8,736 9,520 7,744
Discontinued operations
Loss after taxation from Discontinued operations − (335) (2,921)
Profit after taxation from Continuing and Discontinued operations 8,736 9,185 4,823
Attributable to non-controlling interests 780 879 1,118
Attributable to BHP shareholders 7,956 8,306 3,705
Basic earnings per ordinary share (cents) 6 157.3 160.3 69.6
Diluted earnings per ordinary share (cents) 6 157.0 159.9 69.4
Basic earnings from Continuing operations per ordinary share (cents) 6 157.3 166.9 125.0
Diluted earnings from Continuing operations per ordinary share (cents) 6 157.0 166.5 124.6
The accompanying notes form part of this financial information.
Consolidated Statement of Comprehensive Income for the year ended 30 June 2020
2020
US$M
2019
US$M
2018
US$M
Profit after taxation from Continuing and Discontinued operations 8,736 9,185 4,823
Other comprehensive income
Items that may be reclassified subsequently to the income statement:
Net valuation gains on investments taken to equity − − 11
Hedges:
(Losses)/gains taken to equity (315) (327) 82
Losses/(gains) transferred to the income statement 297 299 (215)
Exchange fluctuations on translation of foreign operations taken to equity 1 1 2
Exchange fluctuations on translation of foreign operations transferred to income statement − (6) −
Tax recognised within other comprehensive income 5 8 36
Total items that may be reclassified subsequently to the income statement (12) (25) (84)
Items that will not be reclassified to the income statement:
Re-measurement (losses)/gains on pension and medical schemes (81) (20) 1
Equity investments held at fair value (2) 1 −
Tax recognised within other comprehensive income 26 19 (14)
Total items that will not be reclassified to the income statement (57) − (13)
Total other comprehensive loss (69) (25) (97)
Total comprehensive income 8,667 9,160 4,726
Attributable to non-controlling interests 769 878 1,118
Attributable to BHP shareholders 7,898 8,282 3,608
The accompanying notes form part of this financial information.
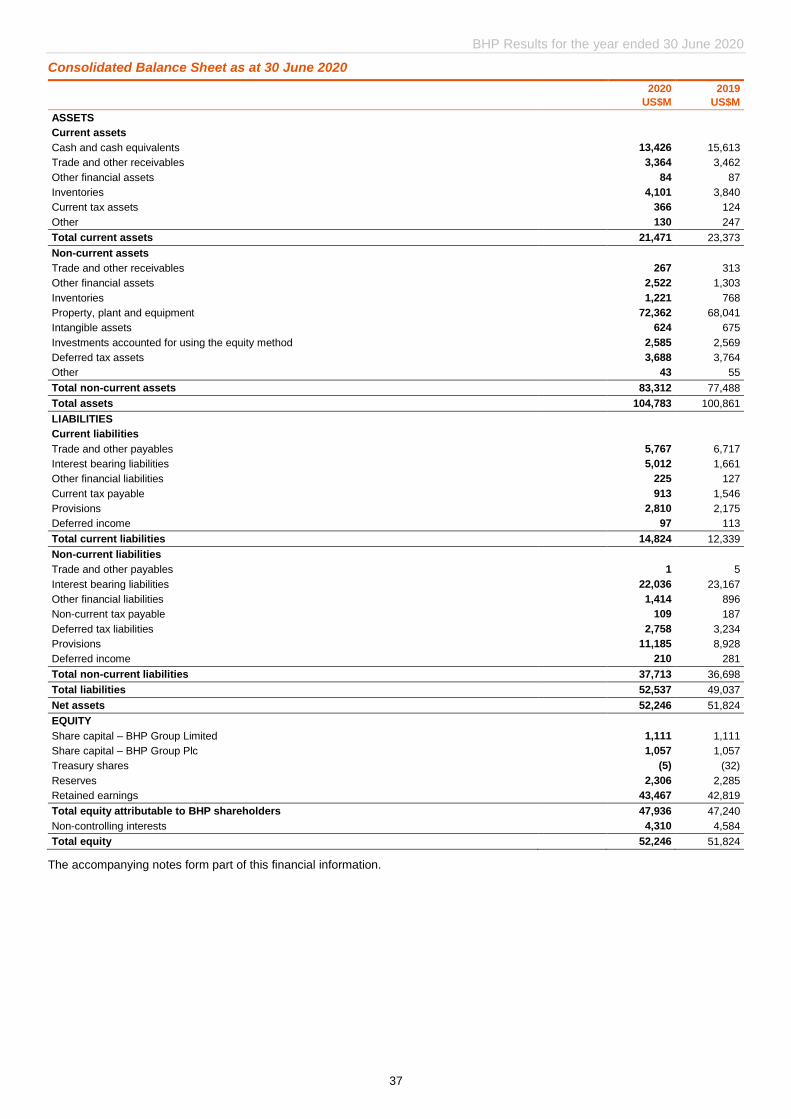
BHP Results for the year ended 30 June 2020
37
Consolidated Balance Sheet as at 30 June 2020
2020
US$M
2019
US$M
ASSETS
Current assets
Cash and cash equivalents 13,426 15,613
Trade and other receivables 3,364 3,462
Other financial assets 84 87
Inventories 4,101 3,840
Current tax assets 366 124
Other 130 247
Total current assets 21,471 23,373
Non-current assets
Trade and other receivables 267 313
Other financial assets 2,522 1,303
Inventories 1,221 768
Property, plant and equipment 72,362 68,041
Intangible assets 624 675
Investments accounted for using the equity method 2,585 2,569
Deferred tax assets 3,688 3,764
Other 43 55
Total non-current assets 83,312 77,488
Total assets 104,783 100,861
LIABILITIES
Current liabilities
Trade and other payables 5,767 6,717
Interest bearing liabilities 5,012 1,661
Other financial liabilities 225 127
Current tax payable 913 1,546
Provisions 2,810 2,175
Deferred income 97 113
Total current liabilities 14,824 12,339
Non-current liabilities
Trade and other payables 1 5
Interest bearing liabilities 22,036 23,167
Other financial liabilities 1,414 896
Non-current tax payable 109 187
Deferred tax liabilities 2,758 3,234
Provisions 11,185 8,928
Deferred income 210 281
Total non-current liabilities 37,713 36,698
Total liabilities 52,537 49,037
Net assets 52,246 51,824
EQUITY
Share capital – BHP Group Limited 1,111 1,111
Share capital – BHP Group Plc 1,057 1,057
Treasury shares (5) (32)
Reserves 2,306 2,285
Retained earnings 43,467 42,819
Total equity attributable to BHP shareholders 47,936 47,240
Non-controlling interests 4,310 4,584
Total equity 52,246 51,824
The accompanying notes form part of this financial information.
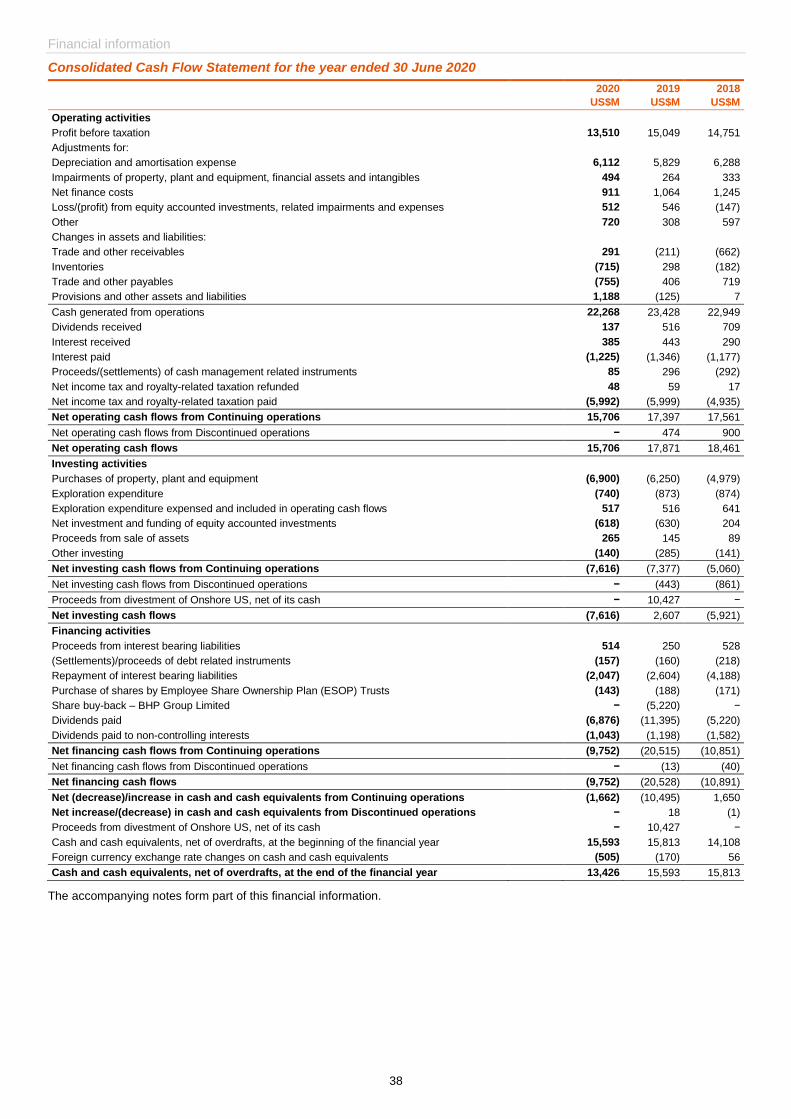
Financial information
38
Consolidated Cash Flow Statement for the year ended 30 June 2020
2020
US$M
2019
US$M
2018
US$M
Operating activities
Profit before taxation 13,510 15,049 14,751
Adjustments for:
Depreciation and amortisation expense 6,112 5,829 6,288
Impairments of property, plant and equipment, financial assets and intangibles 494 264 333
Net finance costs 911 1,064 1,245
Loss/(profit) from equity accounted investments, related impairments and expenses 512 546 (147)
Other 720 308 597
Changes in assets and liabilities:
Trade and other receivables 291 (211) (662)
Inventories (715) 298 (182)
Trade and other payables (755) 406 719
Provisions and other assets and liabilities 1,188 (125) 7
Cash generated from operations 22,268 23,428 22,949
Dividends received 137 516 709
Interest received 385 443 290
Interest paid (1,225) (1,346) (1,177)
Proceeds/(settlements) of cash management related instruments 85 296 (292)
Net income tax and royalty-related taxation refunded 48 59 17
Net income tax and royalty-related taxation paid (5,992) (5,999) (4,935)
Net operating cash flows from Continuing operations 15,706 17,397 17,561
Net operating cash flows from Discontinued operations − 474 900
Net operating cash flows 15,706 17,871 18,461
Investing activities
Purchases of property, plant and equipment (6,900) (6,250) (4,979)
Exploration expenditure (740) (873) (874)
Exploration expenditure expensed and included in operating cash flows 517 516 641
Net investment and funding of equity accounted investments (618) (630) 204
Proceeds from sale of assets 265 145 89
Other investing (140) (285) (141)
Net investing cash flows from Continuing operations (7,616) (7,377) (5,060)
Net investing cash flows from Discontinued operations − (443) (861)
Proceeds from divestment of Onshore US, net of its cash − 10,427 −
Net investing cash flows (7,616) 2,607 (5,921)
Financing activities
Proceeds from interest bearing liabilities 514 250 528
(Settlements)/proceeds of debt related instruments (157) (160) (218)
Repayment of interest bearing liabilities (2,047) (2,604) (4,188)
Purchase of shares by Employee Share Ownership Plan (ESOP) Trusts (143) (188) (171)
Share buy-back – BHP Group Limited − (5,220) −
Dividends paid (6,876) (11,395) (5,220)
Dividends paid to non-controlling interests (1,043) (1,198) (1,582)
Net financing cash flows from Continuing operations (9,752) (20,515) (10,851)
Net financing cash flows from Discontinued operations − (13) (40)
Net financing cash flows (9,752) (20,528) (10,891)
Net (decrease)/increase in cash and cash equivalents from Continuing operations (1,662) (10,495) 1,650
Net increase/(decrease) in cash and cash equivalents from Discontinued operations − 18 (1)
Proceeds from divestment of Onshore US, net of its cash − 10,427 −
Cash and cash equivalents, net of overdrafts, at the beginning of the financial year 15,593 15,813 14,108
Foreign currency exchange rate changes on cash and cash equivalents (505) (170) 56
Cash and cash equivalents, net of overdrafts, at the end of the financial year 13,426 15,593 15,813
The accompanying notes form part of this financial information.
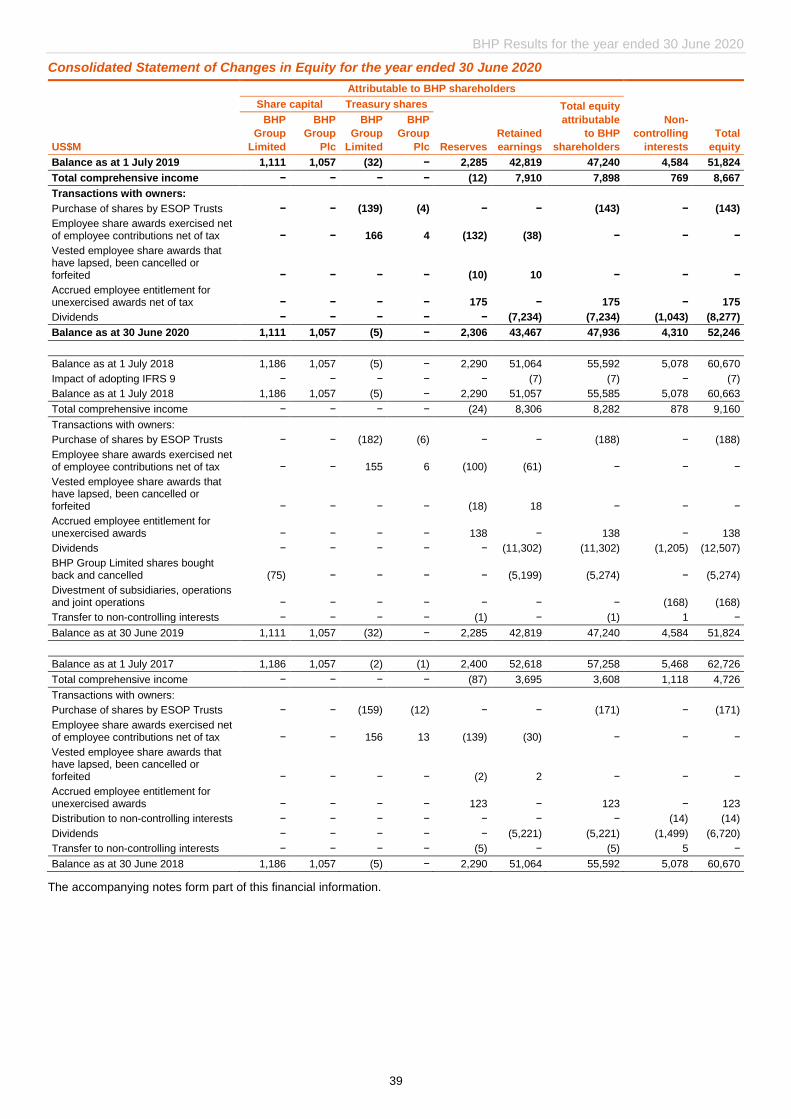
BHP Results for the year ended 30 June 2020
39
Consolidated Statement of Changes in Equity for the year ended 30 June 2020
Attributable to BHP shareholders
Share capital Treasury shares Total equity
attributable
to BHP
shareholders
Non-
controlling
interests
US$M
BHP
Group
Limited
BHP
Group
Plc
BHP
Group
Limited
BHP
Group
Plc Reserves
Retained
earnings
Total
equity
Balance as at 1 July 2019 1,111 1,057 (32) − 2,285 42,819 47,240 4,584 51,824
Total comprehensive income − − − − (12) 7,910 7,898 769 8,667
Transactions with owners:
Purchase of shares by ESOP Trusts − − (139) (4) − − (143) − (143)
Employee share awards exercised net of employee contributions net of tax − − 166 4 (132) (38) − − −
Vested employee share awards that have lapsed, been cancelled or forfeited − − − − (10) 10 − − −
Accrued employee entitlement for unexercised awards net of tax − − − − 175 − 175 − 175
Dividends − − − − − (7,234) (7,234) (1,043) (8,277)
Balance as at 30 June 2020 1,111 1,057 (5) − 2,306 43,467 47,936 4,310 52,246
Balance as at 1 July 2018 1,186 1,057 (5) − 2,290 51,064 55,592 5,078 60,670
Impact of adopting IFRS 9 − − − − − (7) (7) − (7)
Balance as at 1 July 2018 1,186 1,057 (5) − 2,290 51,057 55,585 5,078 60,663
Total comprehensive income − − − − (24) 8,306 8,282 878 9,160
Transactions with owners:
Purchase of shares by ESOP Trusts − − (182) (6) − − (188) − (188)
Employee share awards exercised net of employee contributions net of tax − − 155 6 (100) (61) − − −
Vested employee share awards that have lapsed, been cancelled or forfeited − − − − (18) 18 − − −
Accrued employee entitlement for unexercised awards − − − − 138 − 138 − 138
Dividends − − − − − (11,302) (11,302) (1,205) (12,507)
BHP Group Limited shares bought back and cancelled (75) − − − − (5,199) (5,274) − (5,274)
Divestment of subsidiaries, operations and joint operations − − − − − − − (168) (168)
Transfer to non-controlling interests − − − − (1) − (1) 1 −
Balance as at 30 June 2019 1,111 1,057 (32) − 2,285 42,819 47,240 4,584 51,824
Balance as at 1 July 2017 1,186 1,057 (2) (1) 2,400 52,618 57,258 5,468 62,726
Total comprehensive income − − − − (87) 3,695 3,608 1,118 4,726
Transactions with owners:
Purchase of shares by ESOP Trusts − − (159) (12) − − (171) − (171)
Employee share awards exercised net of employee contributions net of tax − − 156 13 (139) (30) − − −
Vested employee share awards that have lapsed, been cancelled or forfeited − − − − (2) 2 − − −
Accrued employee entitlement for unexercised awards − − − − 123 − 123 − 123
Distribution to non-controlling interests − − − − − − − (14) (14)
Dividends − − − − − (5,221) (5,221) (1,499) (6,720)
Transfer to non-controlling interests − − − − (5) − (5) 5 −
Balance as at 30 June 2018 1,186 1,057 (5) − 2,290 51,064 55,592 5,078 60,670
The accompanying notes form part of this financial information.
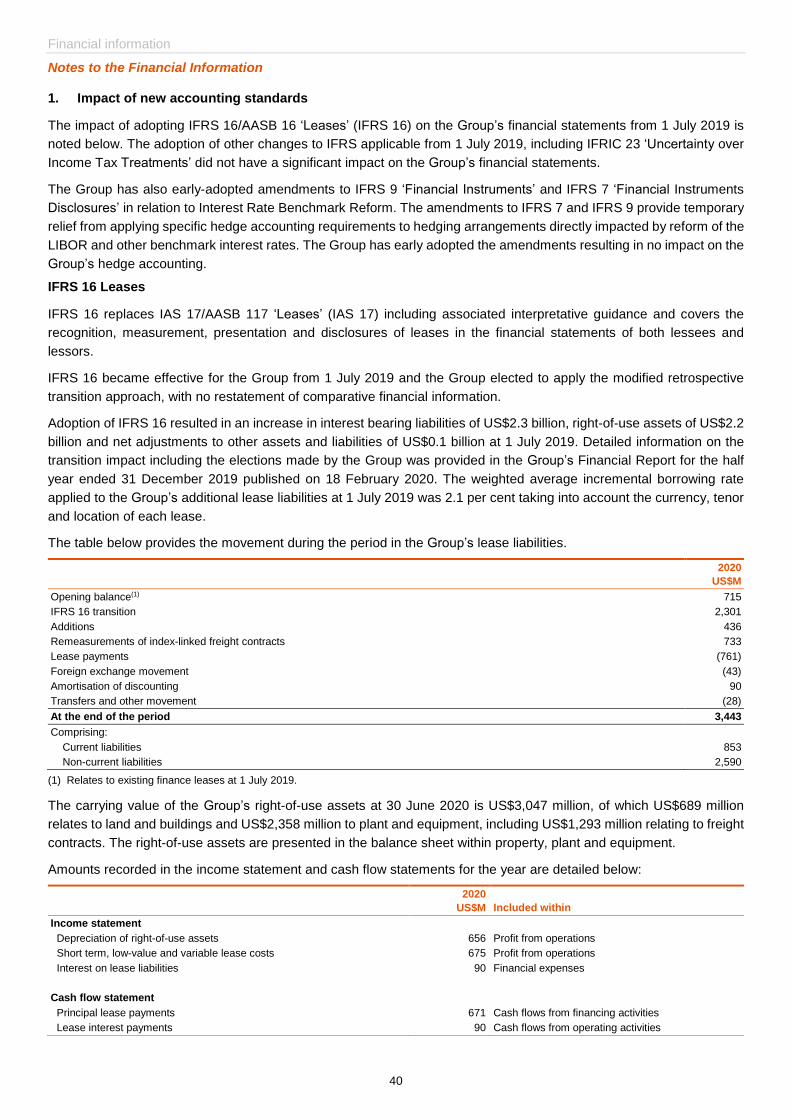
Financial information
40
Notes to the Financial Information
1. Impact of new accounting standards
The impact of adopting IFRS 16/AASB 16 ‘Leases’ (IFRS 16) on the Group’s financial statements from 1 July 2019 is
noted below. The adoption of other changes to IFRS applicable from 1 July 2019, including IFRIC 23 ‘Uncertainty over
Income Tax Treatments’ did not have a significant impact on the Group’s financial statements.
The Group has also early-adopted amendments to IFRS 9 ‘Financial Instruments’ and IFRS 7 ‘Financial Instruments
Disclosures’ in relation to Interest Rate Benchmark Reform. The amendments to IFRS 7 and IFRS 9 provide temporary
relief from applying specific hedge accounting requirements to hedging arrangements directly impacted by reform of the
LIBOR and other benchmark interest rates. The Group has early adopted the amendments resulting in no impact on the
Group’s hedge accounting.
IFRS 16 Leases
IFRS 16 replaces IAS 17/AASB 117 ‘Leases’ (IAS 17) including associated interpretative guidance and covers the
recognition, measurement, presentation and disclosures of leases in the financial statements of both lessees and
lessors.
IFRS 16 became effective for the Group from 1 July 2019 and the Group elected to apply the modified retrospective
transition approach, with no restatement of comparative financial information.
Adoption of IFRS 16 resulted in an increase in interest bearing liabilities of US$2.3 billion, right-of-use assets of US$2.2
billion and net adjustments to other assets and liabilities of US$0.1 billion at 1 July 2019. Detailed information on the
transition impact including the elections made by the Group was provided in the Group’s Financial Report for the half
year ended 31 December 2019 published on 18 February 2020. The weighted average incremental borrowing rate
applied to the Group’s additional lease liabilities at 1 July 2019 was 2.1 per cent taking into account the currency, tenor
and location of each lease.
The table below provides the movement during the period in the Group’s lease liabilities.
2020
US$M
Opening balance(1) 715
IFRS 16 transition 2,301
Additions 436
Remeasurements of index-linked freight contracts 733
Lease payments (761)
Foreign exchange movement (43)
Amortisation of discounting 90
Transfers and other movement (28)
At the end of the period 3,443
Comprising:
Current liabilities 853
Non-current liabilities 2,590
(1) Relates to existing finance leases at 1 July 2019.
The carrying value of the Group’s right-of-use assets at 30 June 2020 is US$3,047 million, of which US$689 million
relates to land and buildings and US$2,358 million to plant and equipment, including US$1,293 million relating to freight
contracts. The right-of-use assets are presented in the balance sheet within property, plant and equipment.
Amounts recorded in the income statement and cash flow statements for the year are detailed below:
2020
US$M Included within
Income statement
Depreciation of right-of-use assets 656 Profit from operations
Short term, low-value and variable lease costs 675 Profit from operations
Interest on lease liabilities 90 Financial expenses
Cash flow statement
Principal lease payments 671 Cash flows from financing activities
Lease interest payments 90 Cash flows from operating activities
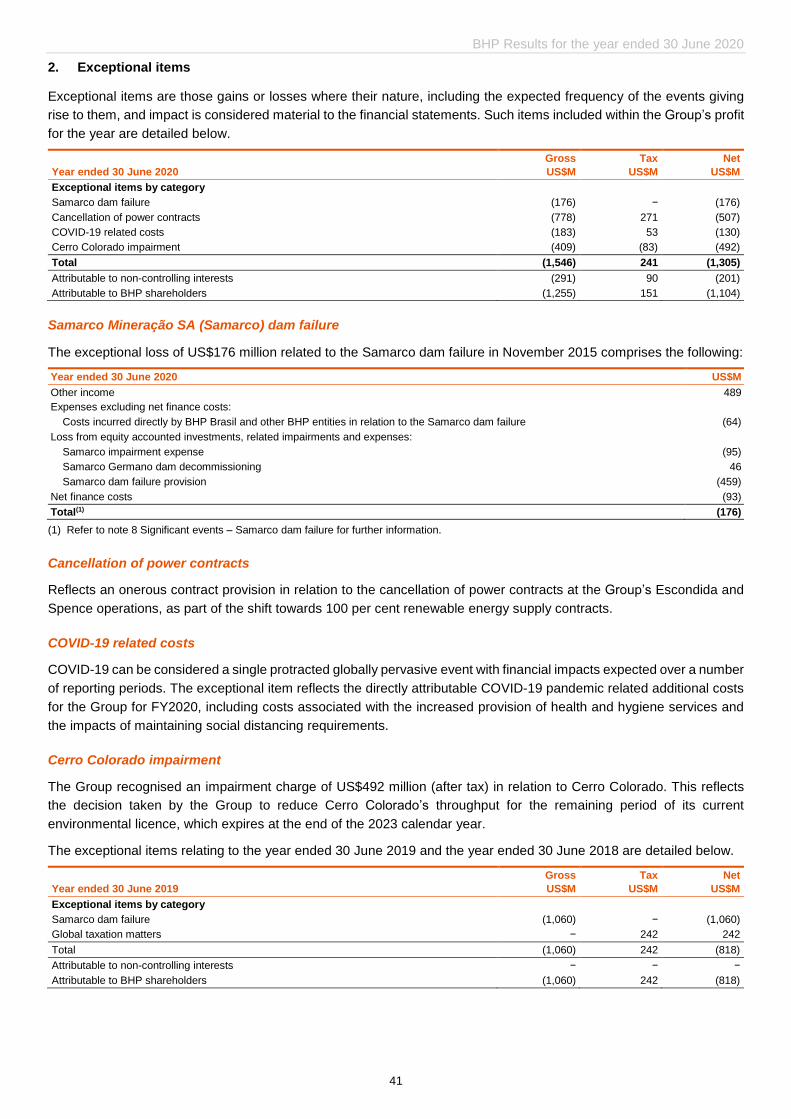
BHP Results for the year ended 30 June 2020
41
2. Exceptional items
Exceptional items are those gains or losses where their nature, including the expected frequency of the events giving
rise to them, and impact is considered material to the financial statements. Such items included within the Group’s profit
for the year are detailed below.
Year ended 30 June 2020
Gross
US$M
Tax
US$M
Net
US$M
Exceptional items by category
Samarco dam failure (176) − (176)
Cancellation of power contracts (778) 271 (507)
COVID-19 related costs (183) 53 (130)
Cerro Colorado impairment (409) (83) (492)
Total (1,546) 241 (1,305)
Attributable to non-controlling interests (291) 90 (201)
Attributable to BHP shareholders (1,255) 151 (1,104)
Samarco Mineração SA (Samarco) dam failure
The exceptional loss of US$176 million related to the Samarco dam failure in November 2015 comprises the following:
Year ended 30 June 2020 US$M
Other income 489
Expenses excluding net finance costs:
Costs incurred directly by BHP Brasil and other BHP entities in relation to the Samarco dam failure (64)
Loss from equity accounted investments, related impairments and expenses:
Samarco impairment expense (95)
Samarco Germano dam decommissioning 46
Samarco dam failure provision (459)
Net finance costs (93)
Total(1) (176)
(1) Refer to note 8 Significant events – Samarco dam failure for further information.
Cancellation of power contracts
Reflects an onerous contract provision in relation to the cancellation of power contracts at the Group’s Escondida and
Spence operations, as part of the shift towards 100 per cent renewable energy supply contracts.
COVID-19 related costs
COVID-19 can be considered a single protracted globally pervasive event with financial impacts expected over a number
of reporting periods. The exceptional item reflects the directly attributable COVID-19 pandemic related additional costs
for the Group for FY2020, including costs associated with the increased provision of health and hygiene services and
the impacts of maintaining social distancing requirements.
Cerro Colorado impairment
The Group recognised an impairment charge of US$492 million (after tax) in relation to Cerro Colorado. This reflects
the decision taken by the Group to reduce Cerro Colorado’s throughput for the remaining period of its current
environmental licence, which expires at the end of the 2023 calendar year.
The exceptional items relating to the year ended 30 June 2019 and the year ended 30 June 2018 are detailed below.
Year ended 30 June 2019
Gross
US$M
Tax
US$M
Net
US$M
Exceptional items by category
Samarco dam failure (1,060) − (1,060)
Global taxation matters − 242 242
Total (1,060) 242 (818)
Attributable to non-controlling interests − − −
Attributable to BHP shareholders (1,060) 242 (818)
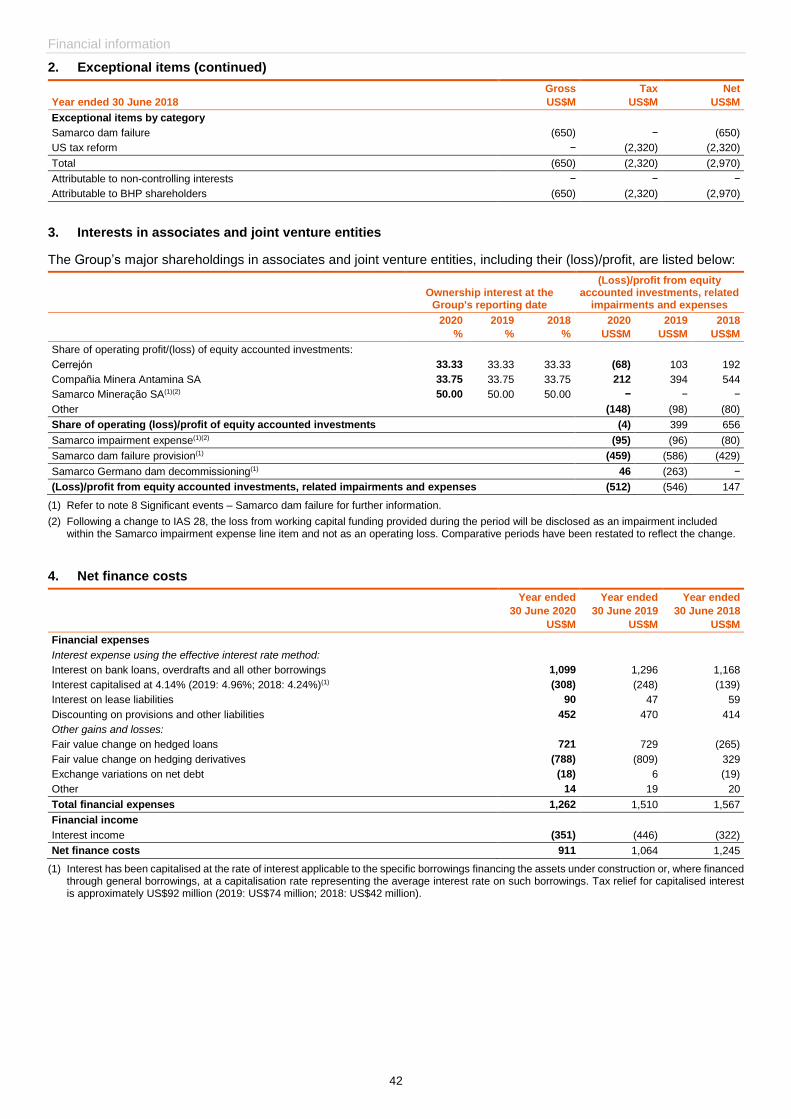
Financial information
42
2. Exceptional items (continued)
Year ended 30 June 2018
Gross
US$M
Tax
US$M
Net
US$M
Exceptional items by category
Samarco dam failure (650) − (650)
US tax reform − (2,320) (2,320)
Total (650) (2,320) (2,970)
Attributable to non-controlling interests − − −
Attributable to BHP shareholders (650) (2,320) (2,970)
3. Interests in associates and joint venture entities
The Group’s major shareholdings in associates and joint venture entities, including their (loss)/profit, are listed below:
Ownership interest at the
Group's reporting date
(Loss)/profit from equity accounted investments, related
impairments and expenses
2020
%
2019
%
2018
%
2020
US$M
2019
US$M
2018
US$M
Share of operating profit/(loss) of equity accounted investments:
Cerrejόn 33.33 33.33 33.33 (68) 103 192
Compañia Minera Antamina SA 33.75 33.75 33.75 212 394 544
Samarco Mineração SA(1)(2) 50.00 50.00 50.00 − − −
Other (148) (98) (80)
Share of operating (loss)/profit of equity accounted investments (4) 399 656
Samarco impairment expense(1)(2) (95) (96) (80)
Samarco dam failure provision(1) (459) (586) (429)
Samarco Germano dam decommissioning(1) 46 (263) −
(Loss)/profit from equity accounted investments, related impairments and expenses (512) (546) 147
(1) Refer to note 8 Significant events – Samarco dam failure for further information.
(2) Following a change to IAS 28, the loss from working capital funding provided during the period will be disclosed as an impairment included within the Samarco impairment expense line item and not as an operating loss. Comparative periods have been restated to reflect the change.
4. Net finance costs
Year ended
30 June 2020
US$M
Year ended
30 June 2019
US$M
Year ended
30 June 2018
US$M
Financial expenses
Interest expense using the effective interest rate method:
Interest on bank loans, overdrafts and all other borrowings 1,099 1,296 1,168
Interest capitalised at 4.14% (2019: 4.96%; 2018: 4.24%)(1) (308) (248) (139)
Interest on lease liabilities 90 47 59
Discounting on provisions and other liabilities 452 470 414
Other gains and losses:
Fair value change on hedged loans 721 729 (265)
Fair value change on hedging derivatives (788) (809) 329
Exchange variations on net debt (18) 6 (19)
Other 14 19 20
Total financial expenses 1,262 1,510 1,567
Financial income
Interest income (351) (446) (322)
Net finance costs 911 1,064 1,245
(1) Interest has been capitalised at the rate of interest applicable to the specific borrowings financing the assets under construction or, where financed through general borrowings, at a capitalisation rate representing the average interest rate on such borrowings. Tax relief for capitalised interest is approximately US$92 million (2019: US$74 million; 2018: US$42 million).
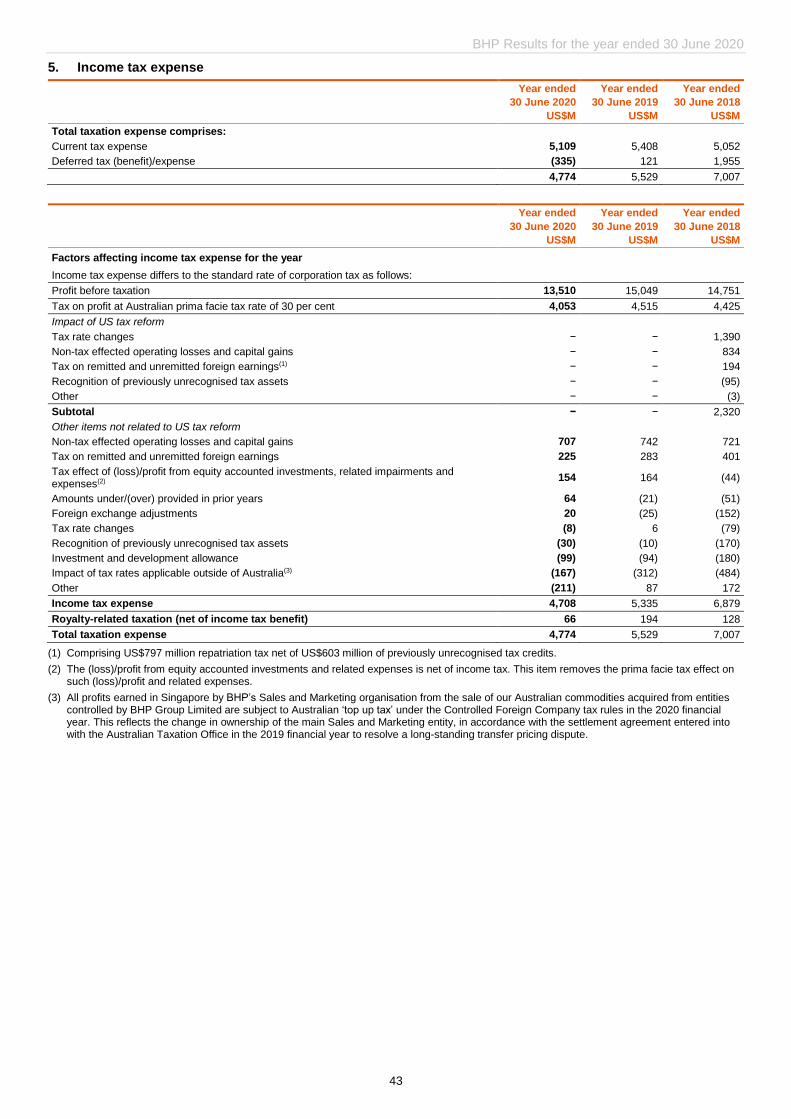
BHP Results for the year ended 30 June 2020
43
5. Income tax expense
Year ended
30 June 2020
US$M
Year ended
30 June 2019
US$M
Year ended
30 June 2018
US$M
Total taxation expense comprises:
Current tax expense 5,109 5,408 5,052
Deferred tax (benefit)/expense (335) 121 1,955
4,774 5,529 7,007
Year ended
30 June 2020
US$M
Year ended
30 June 2019
US$M
Year ended
30 June 2018
US$M
Factors affecting income tax expense for the year Income tax expense differs to the standard rate of corporation tax as follows:
Profit before taxation 13,510 15,049 14,751
Tax on profit at Australian prima facie tax rate of 30 per cent 4,053 4,515 4,425
Impact of US tax reform
Tax rate changes − − 1,390
Non-tax effected operating losses and capital gains − − 834
Tax on remitted and unremitted foreign earnings(1) − − 194
Recognition of previously unrecognised tax assets − − (95)
Other − − (3)
Subtotal − − 2,320
Other items not related to US tax reform
Non-tax effected operating losses and capital gains 707 742 721
Tax on remitted and unremitted foreign earnings 225 283 401
Tax effect of (loss)/profit from equity accounted investments, related impairments and expenses(2)
154 164 (44)
Amounts under/(over) provided in prior years 64 (21) (51)
Foreign exchange adjustments 20 (25) (152)
Tax rate changes (8) 6 (79)
Recognition of previously unrecognised tax assets (30) (10) (170)
Investment and development allowance (99) (94) (180)
Impact of tax rates applicable outside of Australia(3) (167) (312) (484)
Other (211) 87 172
Income tax expense 4,708 5,335 6,879
Royalty-related taxation (net of income tax benefit) 66 194 128
Total taxation expense 4,774 5,529 7,007
(1) Comprising US$797 million repatriation tax net of US$603 million of previously unrecognised tax credits.
(2) The (loss)/profit from equity accounted investments and related expenses is net of income tax. This item removes the prima facie tax effect on such (loss)/profit and related expenses.
(3) All profits earned in Singapore by BHP’s Sales and Marketing organisation from the sale of our Australian commodities acquired from entities controlled by BHP Group Limited are subject to Australian ‘top up tax’ under the Controlled Foreign Company tax rules in the 2020 financial year. This reflects the change in ownership of the main Sales and Marketing entity, in accordance with the settlement agreement entered into with the Australian Taxation Office in the 2019 financial year to resolve a long-standing transfer pricing dispute.
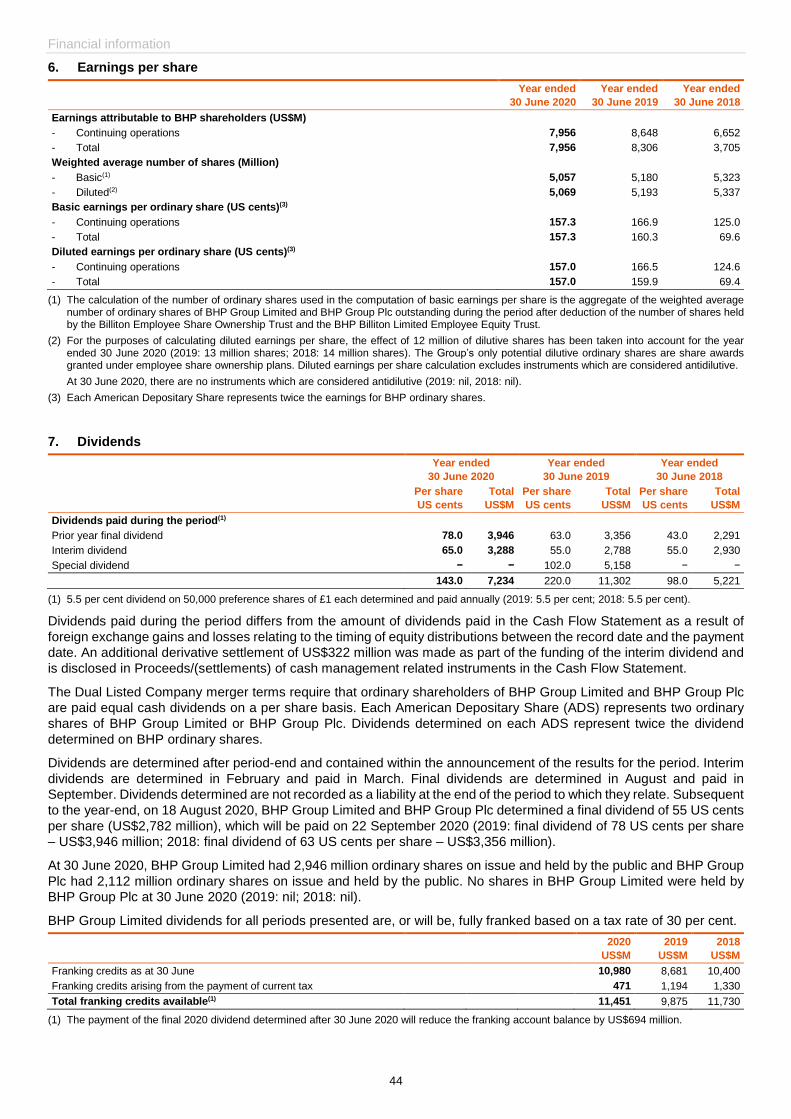
Financial information
44
6. Earnings per share
Year ended
30 June 2020
Year ended
30 June 2019
Year ended
30 June 2018
Earnings attributable to BHP shareholders (US$M)
- Continuing operations 7,956 8,648 6,652
- Total 7,956 8,306 3,705
Weighted average number of shares (Million)
- Basic(1) 5,057 5,180 5,323
- Diluted(2) 5,069 5,193 5,337
Basic earnings per ordinary share (US cents)(3)
- Continuing operations 157.3 166.9 125.0
- Total 157.3 160.3 69.6
Diluted earnings per ordinary share (US cents)(3)
- Continuing operations 157.0 166.5 124.6
- Total 157.0 159.9 69.4
(1) The calculation of the number of ordinary shares used in the computation of basic earnings per share is the aggregate of the weighted average number of ordinary shares of BHP Group Limited and BHP Group Plc outstanding during the period after deduction of the number of shares held by the Billiton Employee Share Ownership Trust and the BHP Billiton Limited Employee Equity Trust.
(2) For the purposes of calculating diluted earnings per share, the effect of 12 million of dilutive shares has been taken into account for the year ended 30 June 2020 (2019: 13 million shares; 2018: 14 million shares). The Group’s only potential dilutive ordinary shares are share awards granted under employee share ownership plans. Diluted earnings per share calculation excludes instruments which are considered antidilutive.
At 30 June 2020, there are no instruments which are considered antidilutive (2019: nil, 2018: nil).
(3) Each American Depositary Share represents twice the earnings for BHP ordinary shares.
7. Dividends
Year ended
30 June 2020
Year ended
30 June 2019
Year ended
30 June 2018
Per share
US cents
Total
US$M
Per share
US cents
Total
US$M
Per share
US cents
Total
US$M
Dividends paid during the period(1)
Prior year final dividend 78.0 3,946 63.0 3,356 43.0 2,291
Interim dividend 65.0 3,288 55.0 2,788 55.0 2,930
Special dividend − − 102.0 5,158 − −
143.0 7,234 220.0 11,302 98.0 5,221
(1) 5.5 per cent dividend on 50,000 preference shares of £1 each determined and paid annually (2019: 5.5 per cent; 2018: 5.5 per cent).
Dividends paid during the period differs from the amount of dividends paid in the Cash Flow Statement as a result of
foreign exchange gains and losses relating to the timing of equity distributions between the record date and the payment
date. An additional derivative settlement of US$322 million was made as part of the funding of the interim dividend and
is disclosed in Proceeds/(settlements) of cash management related instruments in the Cash Flow Statement.
The Dual Listed Company merger terms require that ordinary shareholders of BHP Group Limited and BHP Group Plc
are paid equal cash dividends on a per share basis. Each American Depositary Share (ADS) represents two ordinary
shares of BHP Group Limited or BHP Group Plc. Dividends determined on each ADS represent twice the dividend
determined on BHP ordinary shares.
Dividends are determined after period-end and contained within the announcement of the results for the period. Interim
dividends are determined in February and paid in March. Final dividends are determined in August and paid in
September. Dividends determined are not recorded as a liability at the end of the period to which they relate. Subsequent
to the year-end, on 18 August 2020, BHP Group Limited and BHP Group Plc determined a final dividend of 55 US cents
per share (US$2,782 million), which will be paid on 22 September 2020 (2019: final dividend of 78 US cents per share
– US$3,946 million; 2018: final dividend of 63 US cents per share – US$3,356 million).
At 30 June 2020, BHP Group Limited had 2,946 million ordinary shares on issue and held by the public and BHP Group
Plc had 2,112 million ordinary shares on issue and held by the public. No shares in BHP Group Limited were held by
BHP Group Plc at 30 June 2020 (2019: nil; 2018: nil).
BHP Group Limited dividends for all periods presented are, or will be, fully franked based on a tax rate of 30 per cent.
2020
US$M
2019
US$M
2018
US$M
Franking credits as at 30 June 10,980 8,681 10,400
Franking credits arising from the payment of current tax 471 1,194 1,330
Total franking credits available(1) 11,451 9,875 11,730
(1) The payment of the final 2020 dividend determined after 30 June 2020 will reduce the franking account balance by US$694 million.
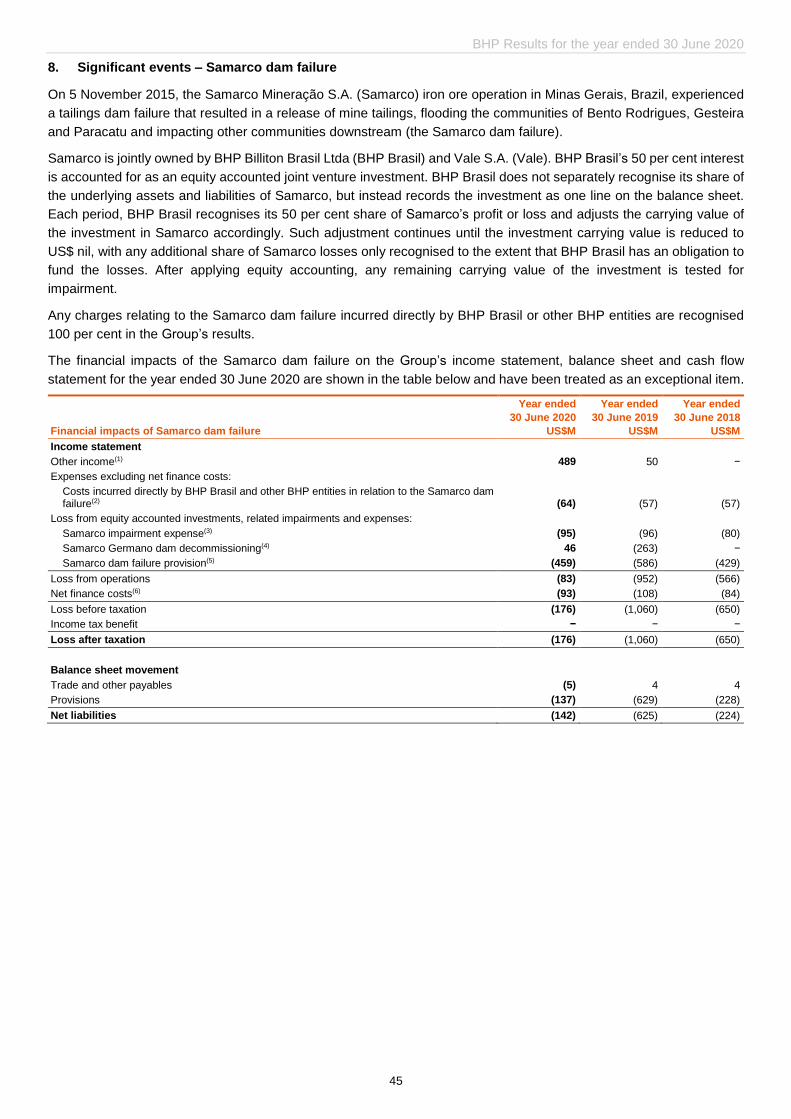
BHP Results for the year ended 30 June 2020
45
8. Significant events – Samarco dam failure
On 5 November 2015, the Samarco Mineração S.A. (Samarco) iron ore operation in Minas Gerais, Brazil, experienced
a tailings dam failure that resulted in a release of mine tailings, flooding the communities of Bento Rodrigues, Gesteira
and Paracatu and impacting other communities downstream (the Samarco dam failure).
Samarco is jointly owned by BHP Billiton Brasil Ltda (BHP Brasil) and Vale S.A. (Vale). BHP Brasil’s 50 per cent interest
is accounted for as an equity accounted joint venture investment. BHP Brasil does not separately recognise its share of
the underlying assets and liabilities of Samarco, but instead records the investment as one line on the balance sheet.
Each period, BHP Brasil recognises its 50 per cent share of Samarco’s profit or loss and adjusts the carrying value of
the investment in Samarco accordingly. Such adjustment continues until the investment carrying value is reduced to
US$ nil, with any additional share of Samarco losses only recognised to the extent that BHP Brasil has an obligation to
fund the losses. After applying equity accounting, any remaining carrying value of the investment is tested for
impairment.
Any charges relating to the Samarco dam failure incurred directly by BHP Brasil or other BHP entities are recognised
100 per cent in the Group’s results.
The financial impacts of the Samarco dam failure on the Group’s income statement, balance sheet and cash flow
statement for the year ended 30 June 2020 are shown in the table below and have been treated as an exceptional item.
Financial impacts of Samarco dam failure
Year ended
30 June 2020
US$M
Year ended
30 June 2019
US$M
Year ended
30 June 2018
US$M
Income statement
Other income(1) 489 50 −
Expenses excluding net finance costs:
Costs incurred directly by BHP Brasil and other BHP entities in relation to the Samarco dam failure(2) (64) (57) (57)
Loss from equity accounted investments, related impairments and expenses:
Samarco impairment expense(3) (95) (96) (80)
Samarco Germano dam decommissioning(4) 46 (263) −
Samarco dam failure provision(5) (459) (586) (429)
Loss from operations (83) (952) (566)
Net finance costs(6) (93) (108) (84)
Loss before taxation (176) (1,060) (650)
Income tax benefit − − −
Loss after taxation (176) (1,060) (650)
Balance sheet movement
Trade and other payables (5) 4 4
Provisions (137) (629) (228)
Net liabilities (142) (625) (224)
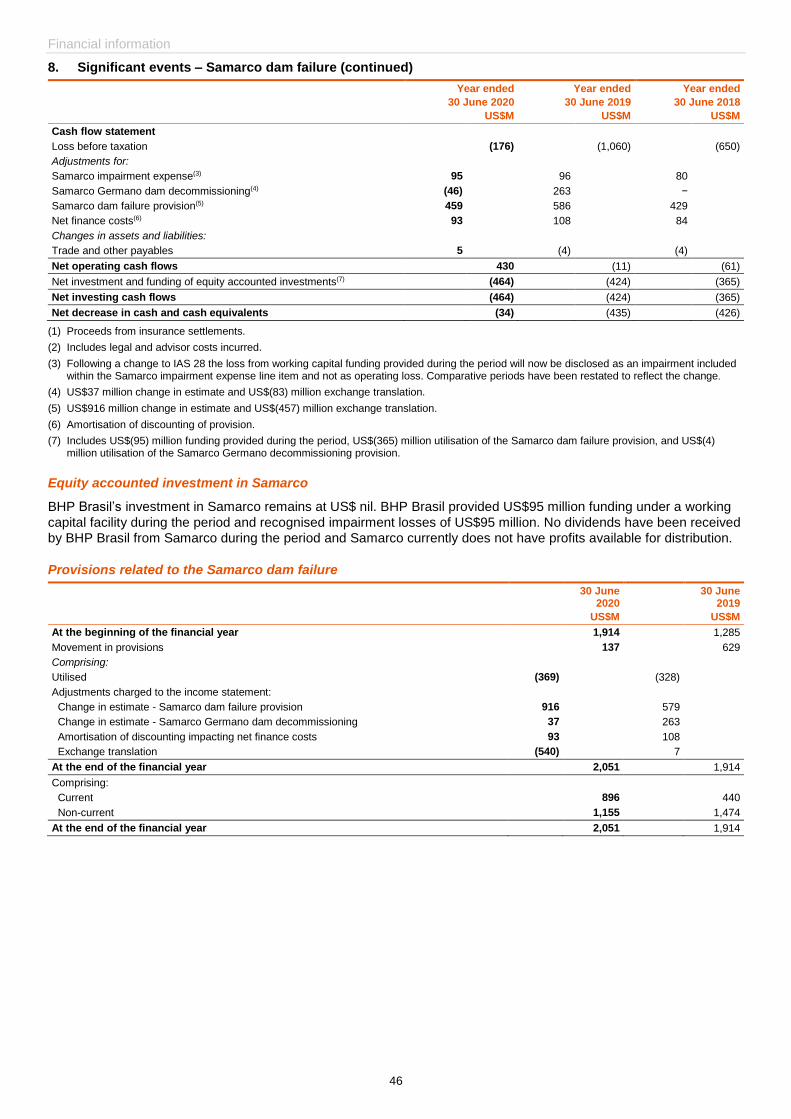
Financial information
46
8. Significant events – Samarco dam failure (continued)
Year ended
30 June 2020
US$M
Year ended
30 June 2019
US$M
Year ended
30 June 2018
US$M
Cash flow statement
Loss before taxation (176) (1,060) (650)
Adjustments for:
Samarco impairment expense(3) 95 96 80
Samarco Germano dam decommissioning(4) (46) 263 −
Samarco dam failure provision(5) 459 586 429
Net finance costs(6) 93 108 84
Changes in assets and liabilities:
Trade and other payables 5 (4) (4)
Net operating cash flows 430 (11) (61)
Net investment and funding of equity accounted investments(7) (464) (424) (365)
Net investing cash flows (464) (424) (365)
Net decrease in cash and cash equivalents (34) (435) (426)
(1) Proceeds from insurance settlements.
(2) Includes legal and advisor costs incurred.
(3) Following a change to IAS 28 the loss from working capital funding provided during the period will now be disclosed as an impairment included within the Samarco impairment expense line item and not as operating loss. Comparative periods have been restated to reflect the change.
(4) US$37 million change in estimate and US$(83) million exchange translation.
(5) US$916 million change in estimate and US$(457) million exchange translation.
(6) Amortisation of discounting of provision.
(7) Includes US$(95) million funding provided during the period, US$(365) million utilisation of the Samarco dam failure provision, and US$(4) million utilisation of the Samarco Germano decommissioning provision.
Equity accounted investment in Samarco
BHP Brasil’s investment in Samarco remains at US$ nil. BHP Brasil provided US$95 million funding under a working
capital facility during the period and recognised impairment losses of US$95 million. No dividends have been received
by BHP Brasil from Samarco during the period and Samarco currently does not have profits available for distribution.
Provisions related to the Samarco dam failure
30 June 2020
US$M
30 June 2019
US$M
At the beginning of the financial year 1,914 1,285
Movement in provisions 137 629
Comprising:
Utilised (369) (328)
Adjustments charged to the income statement:
Change in estimate - Samarco dam failure provision 916 579
Change in estimate - Samarco Germano dam decommissioning 37 263
Amortisation of discounting impacting net finance costs 93 108
Exchange translation (540) 7
At the end of the financial year 2,051 1,914
Comprising:
Current 896 440
Non-current 1,155 1,474
At the end of the financial year 2,051 1,914
BHP Results for the year ended 30 June 2020
47
8. Significant events – Samarco dam failure (continued)
Samarco dam failure provisions and contingencies
As at 30 June 2020, BHP Brasil has identified provisions and contingent liabilities arising as a consequence of the
Samarco dam failure as follows:
Provision for Samarco dam failure
On 2 March 2016, BHP Brasil, Samarco and Vale, entered into a Framework Agreement with the Federal Government
of Brazil, the states of Espírito Santo and Minas Gerais and certain other public authorities to establish a foundation
(Fundação Renova) that will develop and execute environmental and socio-economic programs (Programs) to
remediate and provide compensation for damage caused by the Samarco dam failure. Key Programs include those for
financial assistance and compensation of impacted persons, including fisherfolk impacted by the dam failure, and those
for remediation of impacted areas and resettlement of impacted communities. A committee (Interfederative Committee)
comprising representatives from the Brazilian Federal and State Governments, local municipalities, environmental
agencies, impacted communities and Public Defence Office oversees the activities of the Fundação Renova in order to
monitor, guide and assess the progress of actions agreed in the Framework Agreement. In addition, the 12th Federal
Court is supervising the work of the Fundação Renova and in July 2020 made decisions relating to financial
compensation for impacted persons in two municipalities. Further decisions are anticipated in FY2021.
The term of the Framework Agreement is 15 years, renewable for periods of one year successively until all obligations
under the Framework Agreement have been performed. Under the Framework Agreement, Samarco is responsible for
funding Fundação Renova’s annual calendar year budget for the duration of the Framework Agreement. The funding
amounts for each calendar year will be dependent on the remediation and compensation projects to be undertaken in a
particular year. Annual contributions may be reviewed under the Framework Agreement. To the extent that Samarco
does not meet its funding obligations, each of BHP Brasil and Vale has funding obligations under the Framework
Agreement in proportion to its 50 per cent shareholding in Samarco.
Samarco is currently progressing plans to resume operations, however significant uncertainties surrounding the nature
and extent of future operations remain. In light of these uncertainties and based on currently available information, BHP
Brasil’s provision for its obligations under the Framework Agreement Programs is US$1.8 billion before tax and after
discounting at 30 June 2020 (30 June 2019: US$1.7 billion).
Under a Governance Agreement ratified on 8 August 2018, BHP Brasil, Samarco and Vale were to establish a process
to renegotiate the Programs over two years to progress settlement of the R$155 billion (approximately US$28 billion)
Federal Public Prosecution Office claim (described below). The renegotiation process remains outstanding as certain
pre-requisites established in the Governance Agreement are yet to be implemented. However the renegotiation may be
extended for a further two years by mutual consent of the parties.
BHP Brasil, Samarco and Vale maintain security comprising R$1.3 billion (approximately US$240 million) in insurance
bonds and a charge of R$800 million (approximately US$145 million) over Samarco’s assets. A further R$100 million
(approximately US$20 million) in liquid assets previously maintained as security has been released for COVID-19 related
response efforts in Brazil. The security is maintained for a period of 30 months from ratification of the Governance
Agreement, after which BHP Brasil, Vale and Samarco will be required to provide security of an amount equal to the
Fundação Renova’s annual budget up to a limit of R$2.2 billion (approximately US$400 million).
Samarco Germano dam decommissioning
Samarco is currently progressing plans for the accelerated decommissioning of its upstream tailings dams (the Germano
dam complex). Given the significant uncertainties surrounding the nature and extent of Samarco’s future operations and
related cash flows BHP Brasil recognises a provision of US$227 million (30 June 2019: US$263 million) for a 50 per
cent share of the remaining expected Germano decommissioning cost. The decommissioning is at an early stage and
as a result, further engineering work and required validation by Brazilian authorities could lead to changes to estimates
in future reporting periods.
Financial information
48
8. Significant events – Samarco dam failure (continued)
Key judgements and estimates
Judgements
The outcomes of litigation are inherently difficult to predict and significant judgement has been applied in assessing
the likely outcome of legal claims and determining which legal claims require recognition of a provision or disclosure
of a contingent liability. The facts and circumstances relating to these cases are regularly evaluated in determining
whether a provision for any specific claim is required.
Management have determined that a provision can only be recognised for obligations under the Framework Agreement
and Samarco Germano dam decommissioning as at 30 June 2020. It is not yet possible to provide a range of possible
outcomes or a reliable estimate of potential future exposures to BHP in connection to the contingent liabilities noted
below, given their status.
Estimates
The provisions for Samarco dam failure and Samarco Germano dam decommissioning currently reflect the estimated
remaining costs to complete Programs under the Framework Agreement and estimated costs to complete the Germano
dam decommissioning and require the use of significant judgements, estimates and assumptions. Based on current
estimates, it is expected that approximately 75 per cent of remaining costs for Programs under the Framework
Agreement will be incurred by December 2021.
While the provisions have been measured based on information available as at 30 June 2020, likely changes in facts
and circumstances in future reporting periods may lead to revisions to these estimates. However, it is currently not
possible to determine what facts and circumstances may change, therefore the possible revisions in future reporting
periods cannot be reliably measured.
The key estimates that may have a material impact upon the provisions in the next and future reporting periods
include:
timing of repealing the fishing ban along the Rio Doce, which is subject to certain regulatory approvals and could
impact upon the duration of financial assistance and compensation payments;
number of people eligible for financial assistance and compensation, as duration of registration periods and
changes to geographical boundaries or eligibility criteria could impact estimated future costs;
costs to complete resettlement of the Bento Rodrigues, Gesteira and Paracatu communities.
The provisions may also be affected by factors including but not limited to:
resolution of existing and potential legal claims;
potential changes in scope of work and funding amounts required under the Framework Agreement including the
impact of the decisions of the Interfederative Committee along with further technical analysis, community
participation required under the Governance Agreement and rulings made by the 12th Federal Court;
the outcome of ongoing negotiations with State and Federal Prosecutors, including review of Fundação Renova’s
Programs as provided in the Governance Agreement;
actual costs incurred;
resolution of uncertainty in respect of the nature and extent of Samarco’s future operations;
costs to complete the Germano dam decommissioning;
updates to discount and foreign exchange rates.
Given these factors, future actual expenditures may differ from the amounts currently provided and changes to key
assumptions and estimates could result in a material impact to the provision in the next and future reporting periods.
BHP Results for the year ended 30 June 2020
49
8. Significant events – Samarco dam failure (continued)
Contingent liabilities
The following matters are disclosed as contingent liabilities and given the status of proceedings it is not possible to
provide a range of possible outcomes or a reliable estimate of potential future exposures for BHP, unless otherwise
stated. Ultimately, all the legal matters disclosed as contingent liabilities could have a material adverse impact on BHP’s
business, competitive position, cash flows, prospects, liquidity and shareholder returns.
Federal Public Prosecution Office claim
BHP Brasil is among the defendants named in a claim brought by the Federal Public Prosecution Office on 3 May 2016,
seeking R$155 billion (approximately US$28 billion) for reparation, compensation and moral damages in relation to the
Samarco dam failure.
The 12th Federal Court previously suspended the Federal Public Prosecution Office claim, including a R$7.7 billion
(approximately US$1.4 billion) injunction request. Despite suspension of the claim being for a period of two years from
the date of ratification of the Governance Agreement on 8 August 2018, the claim has not been resumed and the parties
may negotiate a further extension.
United States class action complaint – Samarco bond holders
On 14 November 2016, a putative class action complaint (Bondholder Complaint) was filed in the U.S. District Court for
the Southern District of New York on behalf of purchasers of Samarco’s ten-year bond notes due 2022-2024 between
31 October 2012 and 30 November 2015. The Bondholder Complaint was initially filed against Samarco and the former
chief executive officer of Samarco.
The Bondholder Complaint was subsequently amended to include BHP Group Limited, BHP Group Plc, BHP Brasil,
Vale S.A. and officers of Samarco, including four of Vale S.A. and BHP Brasil’s nominees to the Samarco Board. On 5
April 2017, the plaintiff discontinued its claims against the individual defendants.
The complaint, along with a second amended complaint, has previously been dismissed by the Court. The Plaintiff filed
a motion for reconsideration, or leave to file a third amended complaint, which was denied by the Court on 30 October
2019. The plaintiff has appealed this decision and the appeal remains pending before the Court.
The amount of damages sought by the putative class is unspecified.
Australian class action complaints
BHP Group Ltd is named as a defendant in a shareholder class action filed in the Federal Court of Australia on behalf
of persons who acquired shares in BHP Group Ltd on the Australian Securities Exchange or shares in BHP Group Plc
on the London Stock Exchange and Johannesburg Stock Exchange in periods prior to the Samarco dam failure. The
amount of damages sought is unspecified.
United Kingdom group action complaint
BHP Group Plc and BHP Group Ltd are named as defendants in group action claims for damages that have been filed
in the courts of England. These claims have been filed on behalf of certain individuals, governments, businesses and
communities in Brazil allegedly impacted by the Samarco dam failure. The amount of damages sought in these claims
is unspecified.
The court heard a preliminary application filed by BHP to strike out or stay this action on jurisdictional and other
procedural grounds in July 2020. The court has not yet issued its judgement on this application.
Criminal charges
The Federal Prosecutors’ Office has filed criminal charges against BHP Brasil, Samarco and Vale and certain employees
and former employees of BHP Brasil (Affected Individuals) in the Federal Court of Ponte Nova, Minas Gerais. On 3
March 2017, BHP Brasil filed its preliminary defences. The Federal Court terminated the charges against eight of the
Affected Individuals. The Federal Prosecutors’ Office has appealed seven of those decisions. BHP Brasil rejects outright
the charges against the company and the Affected Individuals and will defend the charges and fully support each of the
Affected Individuals in their defence of the charges.

Financial information
50
8. Significant events – Samarco dam failure (continued)
Other claims
The civil public actions filed by State Prosecutors in Minas Gerais (claiming damages of approximately R$7.5 billion,
US$1.4 billion), State Prosecutors in Espírito Santo (claiming damages of approximately R$2 billion, US$365 million),
and public defenders in Minas Gerais (claiming damages of approximately R$10 billion, US$1.8 billion), have been
consolidated before the 12th Federal Court and suspended. The Governance Agreement provides for a process to
review whether these civil public claims should be terminated or suspended.
BHP Brasil is among the companies named as defendants in a number of legal proceedings initiated by individuals,
non-governmental organisations, corporations and governmental entities in Brazilian Federal and State courts following
the Samarco dam failure. The other defendants include Vale, Samarco and Fundação Renova. The lawsuits include
claims for compensation, environmental rehabilitation and violations of Brazilian environmental and other laws, among
other matters. The lawsuits seek various remedies including rehabilitation costs, compensation to injured individuals
and families of the deceased, recovery of personal and property losses, moral damages and injunctive relief. In addition,
government inquiries and investigations relating to the Samarco dam failure have been commenced by numerous
agencies of the Brazilian government and are ongoing.
Additional lawsuits and government investigations relating to the Samarco dam failure could be brought against BHP
Brasil and possibly other BHP entities in Brazil or other jurisdictions.
BHP insurance
BHP has various third party liability insurances for claims related to the Samarco dam failure made directly against BHP
Brasil or other BHP entities, their directors and officers, including class actions. External insurers have been notified of
the Samarco dam failure, the third party claims and the class actions referred to above.
In the year ended 30 June 2020, BHP recognised income of US$489 million relating to proceeds from insurance
settlements. As at 30 June 2020, an insurance receivable has not been recognised for any potential recoveries in respect
of ongoing matters.
Commitments
Under the terms of the Samarco joint venture agreement, BHP Brasil does not have an existing obligation to fund
Samarco.
In November 2019, BHP approved US$44 million for BHP Brasil’s share of funding for work related to the restart of
Samarco’s operations. In December 2019, a further short-term facility of up to US$212 million was made available to
carry out remediation and stabilisation work and support Samarco’s care and maintenance and operational restart. In
the six months to 30 June 2020, US$68 million of the total amount approved has been provided to Samarco. Further
funds will be released to Samarco only as required and subject to the achievement of key milestones with amounts
undrawn expiring at 31 December 2020.
Any additional requests for funding or future investment provided would be subject to a future decision by BHP,
accounted for at that time.
9. Subsequent events
Other than the matters outlined elsewhere in this financial information, no matters or circumstances have arisen since
the end of the financial year that have significantly affected, or may significantly affect, the operations, results of
operations or state of affairs of the Group in subsequent accounting periods.

BHP Results for the year ended 30 June 2020
51
BHP
Alternative performance
measures
Year ended
30 June 2020
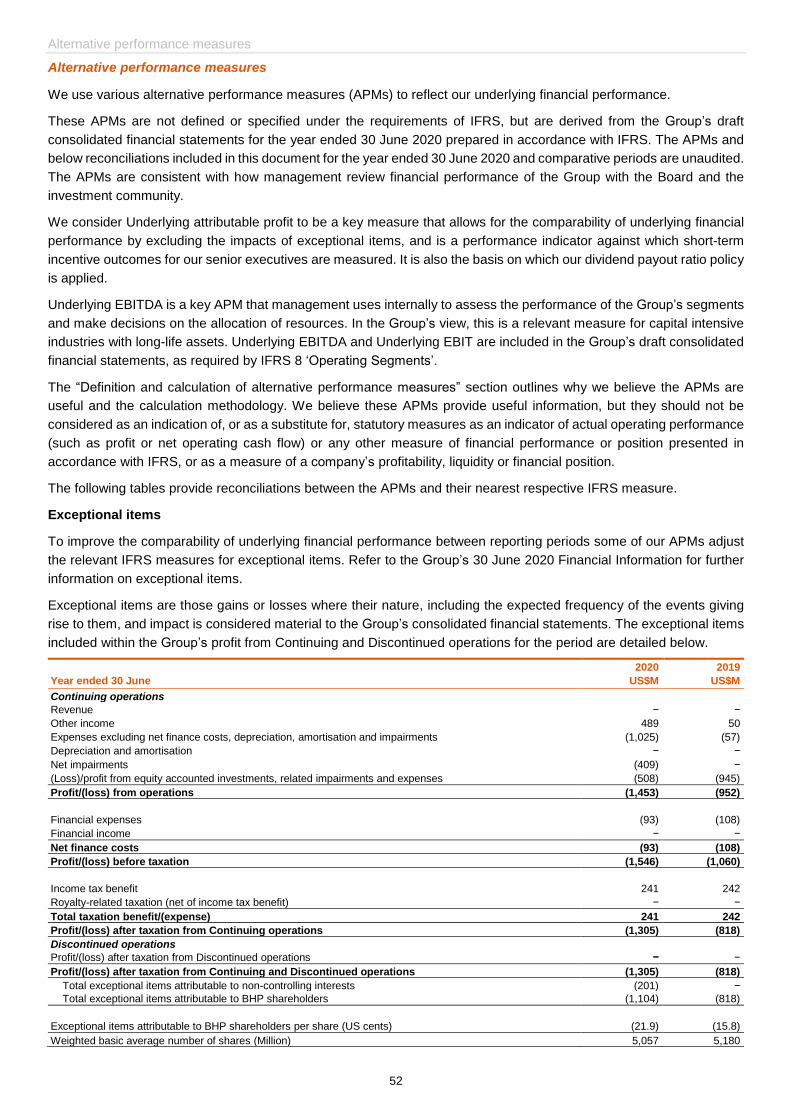
Alternative performance measures
52
Alternative performance measures
We use various alternative performance measures (APMs) to reflect our underlying financial performance.
These APMs are not defined or specified under the requirements of IFRS, but are derived from the Group’s draft
consolidated financial statements for the year ended 30 June 2020 prepared in accordance with IFRS. The APMs and
below reconciliations included in this document for the year ended 30 June 2020 and comparative periods are unaudited.
The APMs are consistent with how management review financial performance of the Group with the Board and the
investment community.
We consider Underlying attributable profit to be a key measure that allows for the comparability of underlying financial
performance by excluding the impacts of exceptional items, and is a performance indicator against which short-term
incentive outcomes for our senior executives are measured. It is also the basis on which our dividend payout ratio policy
is applied.
Underlying EBITDA is a key APM that management uses internally to assess the performance of the Group’s segments
and make decisions on the allocation of resources. In the Group’s view, this is a relevant measure for capital intensive
industries with long-life assets. Underlying EBITDA and Underlying EBIT are included in the Group’s draft consolidated
financial statements, as required by IFRS 8 ‘Operating Segments’.
The “Definition and calculation of alternative performance measures” section outlines why we believe the APMs are
useful and the calculation methodology. We believe these APMs provide useful information, but they should not be
considered as an indication of, or as a substitute for, statutory measures as an indicator of actual operating performance
(such as profit or net operating cash flow) or any other measure of financial performance or position presented in
accordance with IFRS, or as a measure of a company’s profitability, liquidity or financial position.
The following tables provide reconciliations between the APMs and their nearest respective IFRS measure.
Exceptional items
To improve the comparability of underlying financial performance between reporting periods some of our APMs adjust
the relevant IFRS measures for exceptional items. Refer to the Group’s 30 June 2020 Financial Information for further
information on exceptional items.
Exceptional items are those gains or losses where their nature, including the expected frequency of the events giving
rise to them, and impact is considered material to the Group’s consolidated financial statements. The exceptional items
included within the Group’s profit from Continuing and Discontinued operations for the period are detailed below.
Year ended 30 June
2020
US$M
2019
US$M
Continuing operations
Revenue − −
Other income 489 50
Expenses excluding net finance costs, depreciation, amortisation and impairments (1,025) (57)
Depreciation and amortisation − −
Net impairments (409) −
(Loss)/profit from equity accounted investments, related impairments and expenses (508) (945)
Profit/(loss) from operations (1,453) (952)
Financial expenses (93) (108)
Financial income − −
Net finance costs (93) (108)
Profit/(loss) before taxation (1,546) (1,060)
Income tax benefit 241 242
Royalty-related taxation (net of income tax benefit) − −
Total taxation benefit/(expense) 241 242
Profit/(loss) after taxation from Continuing operations (1,305) (818)
Discontinued operations
Profit/(loss) after taxation from Discontinued operations − −
Profit/(loss) after taxation from Continuing and Discontinued operations (1,305) (818)
Total exceptional items attributable to non-controlling interests (201) −
Total exceptional items attributable to BHP shareholders (1,104) (818)
Exceptional items attributable to BHP shareholders per share (US cents) (21.9) (15.8)
Weighted basic average number of shares (Million) 5,057 5,180
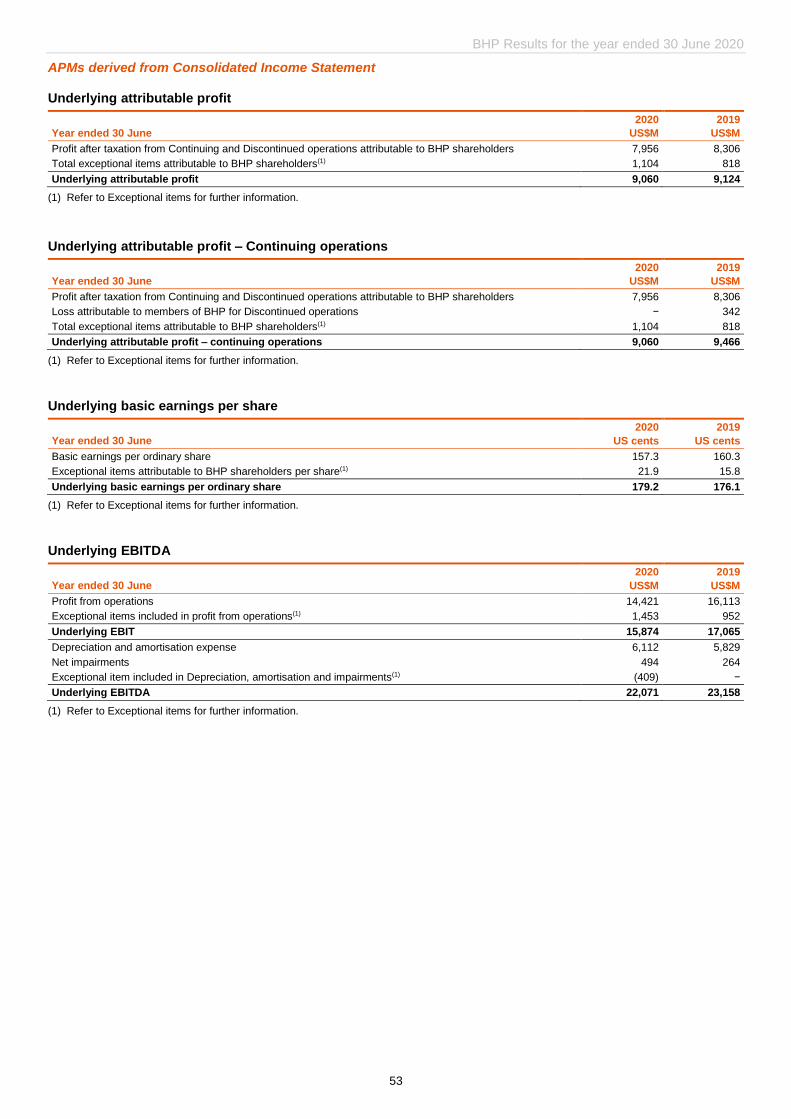
BHP Results for the year ended 30 June 2020
53
APMs derived from Consolidated Income Statement
Underlying attributable profit
Year ended 30 June
2020
US$M
2019
US$M
Profit after taxation from Continuing and Discontinued operations attributable to BHP shareholders 7,956 8,306
Total exceptional items attributable to BHP shareholders(1) 1,104 818
Underlying attributable profit 9,060 9,124
(1) Refer to Exceptional items for further information.
Underlying attributable profit – Continuing operations
Year ended 30 June
2020
US$M
2019
US$M
Profit after taxation from Continuing and Discontinued operations attributable to BHP shareholders 7,956 8,306
Loss attributable to members of BHP for Discontinued operations − 342
Total exceptional items attributable to BHP shareholders(1) 1,104 818
Underlying attributable profit – continuing operations 9,060 9,466
(1) Refer to Exceptional items for further information.
Underlying basic earnings per share
Year ended 30 June
2020
US cents
2019
US cents
Basic earnings per ordinary share 157.3 160.3
Exceptional items attributable to BHP shareholders per share(1) 21.9 15.8
Underlying basic earnings per ordinary share 179.2 176.1
(1) Refer to Exceptional items for further information.
Underlying EBITDA
Year ended 30 June
2020
US$M
2019
US$M
Profit from operations 14,421 16,113
Exceptional items included in profit from operations(1) 1,453 952
Underlying EBIT 15,874 17,065
Depreciation and amortisation expense 6,112 5,829
Net impairments 494 264
Exceptional item included in Depreciation, amortisation and impairments(1) (409) −
Underlying EBITDA 22,071 23,158
(1) Refer to Exceptional items for further information.
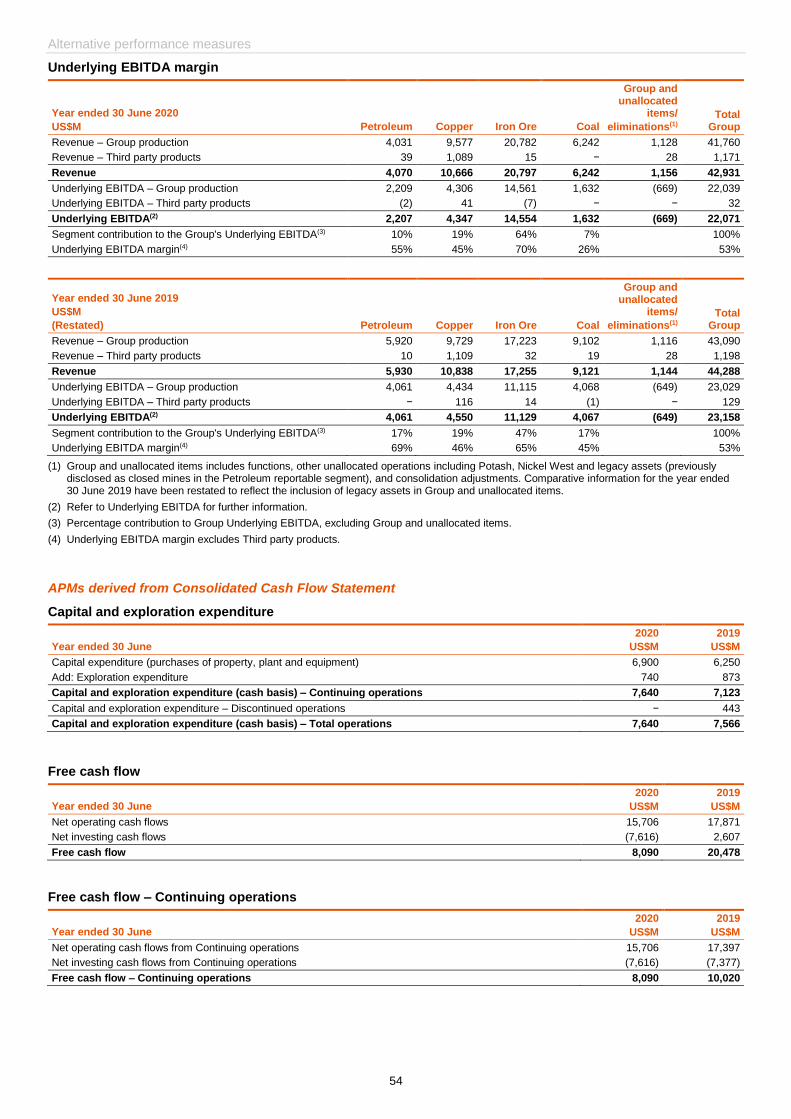
Alternative performance measures
54
Underlying EBITDA margin
Year ended 30 June 2020
US$M Petroleum Copper Iron Ore Coal
Group and unallocated
items/
eliminations(1) Total
Group
Revenue – Group production 4,031 9,577 20,782 6,242 1,128 41,760
Revenue – Third party products 39 1,089 15 − 28 1,171
Revenue 4,070 10,666 20,797 6,242 1,156 42,931
Underlying EBITDA – Group production 2,209 4,306 14,561 1,632 (669) 22,039
Underlying EBITDA – Third party products (2) 41 (7) − − 32
Underlying EBITDA(2) 2,207 4,347 14,554 1,632 (669) 22,071
Segment contribution to the Group's Underlying EBITDA(3) 10% 19% 64% 7% 100%
Underlying EBITDA margin(4) 55% 45% 70% 26% 53%
Year ended 30 June 2019
US$M
(Restated) Petroleum Copper Iron Ore Coal
Group and unallocated
items/
eliminations(1) Total
Group
Revenue – Group production 5,920 9,729 17,223 9,102 1,116 43,090
Revenue – Third party products 10 1,109 32 19 28 1,198
Revenue 5,930 10,838 17,255 9,121 1,144 44,288
Underlying EBITDA – Group production 4,061 4,434 11,115 4,068 (649) 23,029
Underlying EBITDA – Third party products − 116 14 (1) − 129
Underlying EBITDA(2) 4,061 4,550 11,129 4,067 (649) 23,158
Segment contribution to the Group's Underlying EBITDA(3) 17% 19% 47% 17% 100%
Underlying EBITDA margin(4) 69% 46% 65% 45% 53%
(1) Group and unallocated items includes functions, other unallocated operations including Potash, Nickel West and legacy assets (previously disclosed as closed mines in the Petroleum reportable segment), and consolidation adjustments. Comparative information for the year ended 30 June 2019 have been restated to reflect the inclusion of legacy assets in Group and unallocated items.
(2) Refer to Underlying EBITDA for further information.
(3) Percentage contribution to Group Underlying EBITDA, excluding Group and unallocated items.
(4) Underlying EBITDA margin excludes Third party products.
APMs derived from Consolidated Cash Flow Statement
Capital and exploration expenditure
Year ended 30 June
2020
US$M
2019
US$M
Capital expenditure (purchases of property, plant and equipment) 6,900 6,250
Add: Exploration expenditure 740 873
Capital and exploration expenditure (cash basis) – Continuing operations 7,640 7,123
Capital and exploration expenditure – Discontinued operations − 443
Capital and exploration expenditure (cash basis) – Total operations 7,640 7,566
Free cash flow
Year ended 30 June
2020
US$M
2019
US$M
Net operating cash flows 15,706 17,871
Net investing cash flows (7,616) 2,607
Free cash flow 8,090 20,478
Free cash flow – Continuing operations
Year ended 30 June
2020
US$M
2019
US$M
Net operating cash flows from Continuing operations 15,706 17,397
Net investing cash flows from Continuing operations (7,616) (7,377)
Free cash flow – Continuing operations 8,090 10,020
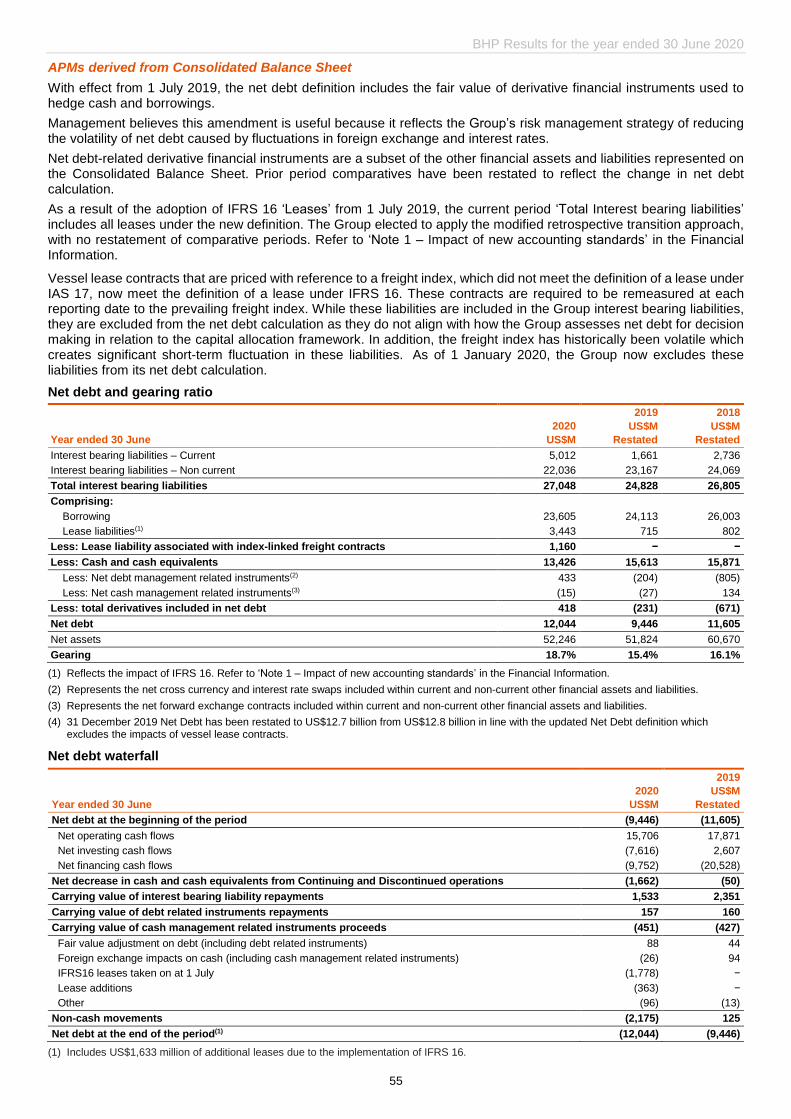
BHP Results for the year ended 30 June 2020
55
APMs derived from Consolidated Balance Sheet
With effect from 1 July 2019, the net debt definition includes the fair value of derivative financial instruments used to hedge cash and borrowings.
Management believes this amendment is useful because it reflects the Group’s risk management strategy of reducing the volatility of net debt caused by fluctuations in foreign exchange and interest rates.
Net debt-related derivative financial instruments are a subset of the other financial assets and liabilities represented on the Consolidated Balance Sheet. Prior period comparatives have been restated to reflect the change in net debt calculation.
As a result of the adoption of IFRS 16 ‘Leases’ from 1 July 2019, the current period ‘Total Interest bearing liabilities’ includes all leases under the new definition. The Group elected to apply the modified retrospective transition approach, with no restatement of comparative periods. Refer to ‘Note 1 – Impact of new accounting standards’ in the Financial Information.
Vessel lease contracts that are priced with reference to a freight index, which did not meet the definition of a lease under IAS 17, now meet the definition of a lease under IFRS 16. These contracts are required to be remeasured at each reporting date to the prevailing freight index. While these liabilities are included in the Group interest bearing liabilities, they are excluded from the net debt calculation as they do not align with how the Group assesses net debt for decision making in relation to the capital allocation framework. In addition, the freight index has historically been volatile which creates significant short-term fluctuation in these liabilities. As of 1 January 2020, the Group now excludes these liabilities from its net debt calculation.
Net debt and gearing ratio
Year ended 30 June
2020
US$M
2019
US$M
Restated
2018
US$M
Restated
Interest bearing liabilities – Current 5,012 1,661 2,736
Interest bearing liabilities – Non current 22,036 23,167 24,069
Total interest bearing liabilities 27,048 24,828 26,805
Comprising:
Borrowing 23,605 24,113 26,003
Lease liabilities(1) 3,443 715 802
Less: Lease liability associated with index-linked freight contracts 1,160 − −
Less: Cash and cash equivalents 13,426 15,613 15,871
Less: Net debt management related instruments(2) 433 (204) (805)
Less: Net cash management related instruments(3) (15) (27) 134
Less: total derivatives included in net debt 418 (231) (671)
Net debt 12,044 9,446 11,605
Net assets 52,246 51,824 60,670
Gearing 18.7% 15.4% 16.1%
(1) Reflects the impact of IFRS 16. Refer to ‘Note 1 – Impact of new accounting standards’ in the Financial Information.
(2) Represents the net cross currency and interest rate swaps included within current and non-current other financial assets and liabilities.
(3) Represents the net forward exchange contracts included within current and non-current other financial assets and liabilities.
(4) 31 December 2019 Net Debt has been restated to US$12.7 billion from US$12.8 billion in line with the updated Net Debt definition which excludes the impacts of vessel lease contracts.
Net debt waterfall
Year ended 30 June
2020
US$M
2019
US$M
Restated
Net debt at the beginning of the period (9,446) (11,605)
Net operating cash flows 15,706 17,871
Net investing cash flows (7,616) 2,607
Net financing cash flows (9,752) (20,528)
Net decrease in cash and cash equivalents from Continuing and Discontinued operations (1,662) (50)
Carrying value of interest bearing liability repayments 1,533 2,351
Carrying value of debt related instruments repayments 157 160
Carrying value of cash management related instruments proceeds (451) (427)
Fair value adjustment on debt (including debt related instruments) 88 44
Foreign exchange impacts on cash (including cash management related instruments) (26) 94
IFRS16 leases taken on at 1 July (1,778) −
Lease additions (363) −
Other (96) (13)
Non-cash movements (2,175) 125
Net debt at the end of the period(1) (12,044) (9,446)
(1) Includes US$1,633 million of additional leases due to the implementation of IFRS 16.
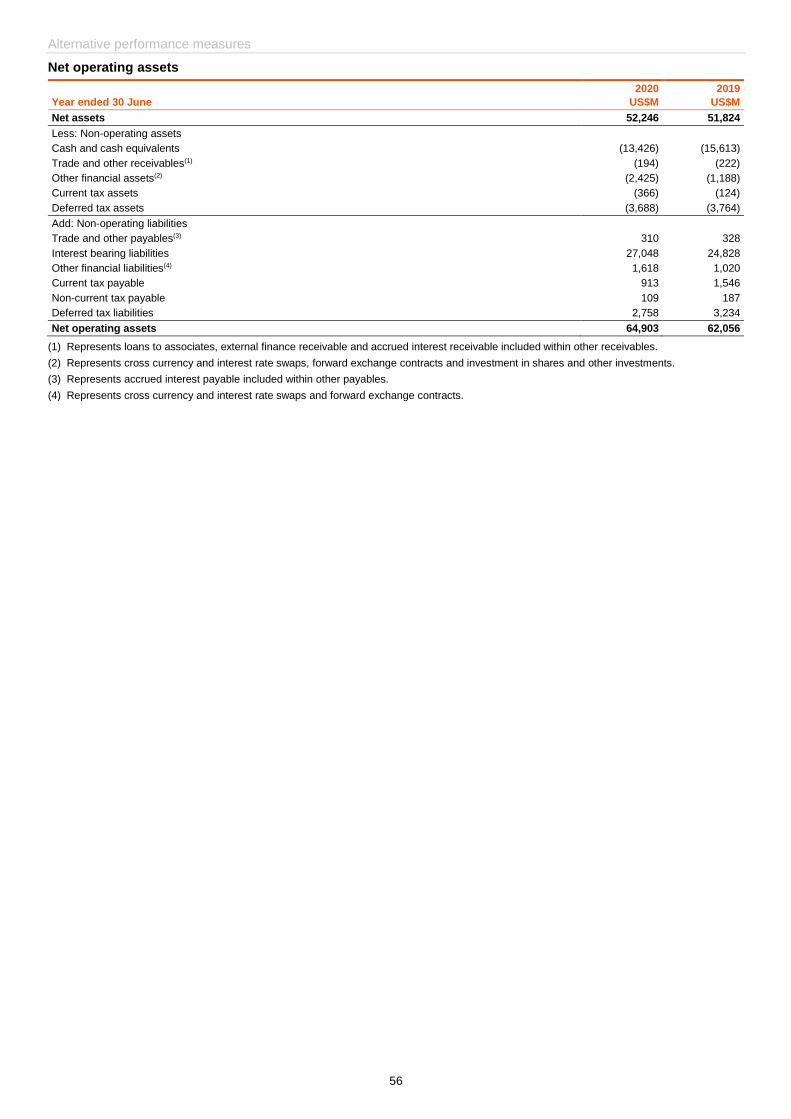
Alternative performance measures
56
Net operating assets
Year ended 30 June
2020
US$M
2019
US$M
Net assets 52,246 51,824
Less: Non-operating assets
Cash and cash equivalents (13,426) (15,613)
Trade and other receivables(1) (194) (222)
Other financial assets(2) (2,425) (1,188)
Current tax assets (366) (124)
Deferred tax assets (3,688) (3,764)
Add: Non-operating liabilities
Trade and other payables(3) 310 328
Interest bearing liabilities 27,048 24,828
Other financial liabilities(4) 1,618 1,020
Current tax payable 913 1,546
Non-current tax payable 109 187
Deferred tax liabilities 2,758 3,234
Net operating assets 64,903 62,056
(1) Represents loans to associates, external finance receivable and accrued interest receivable included within other receivables.
(2) Represents cross currency and interest rate swaps, forward exchange contracts and investment in shares and other investments.
(3) Represents accrued interest payable included within other payables.
(4) Represents cross currency and interest rate swaps and forward exchange contracts.
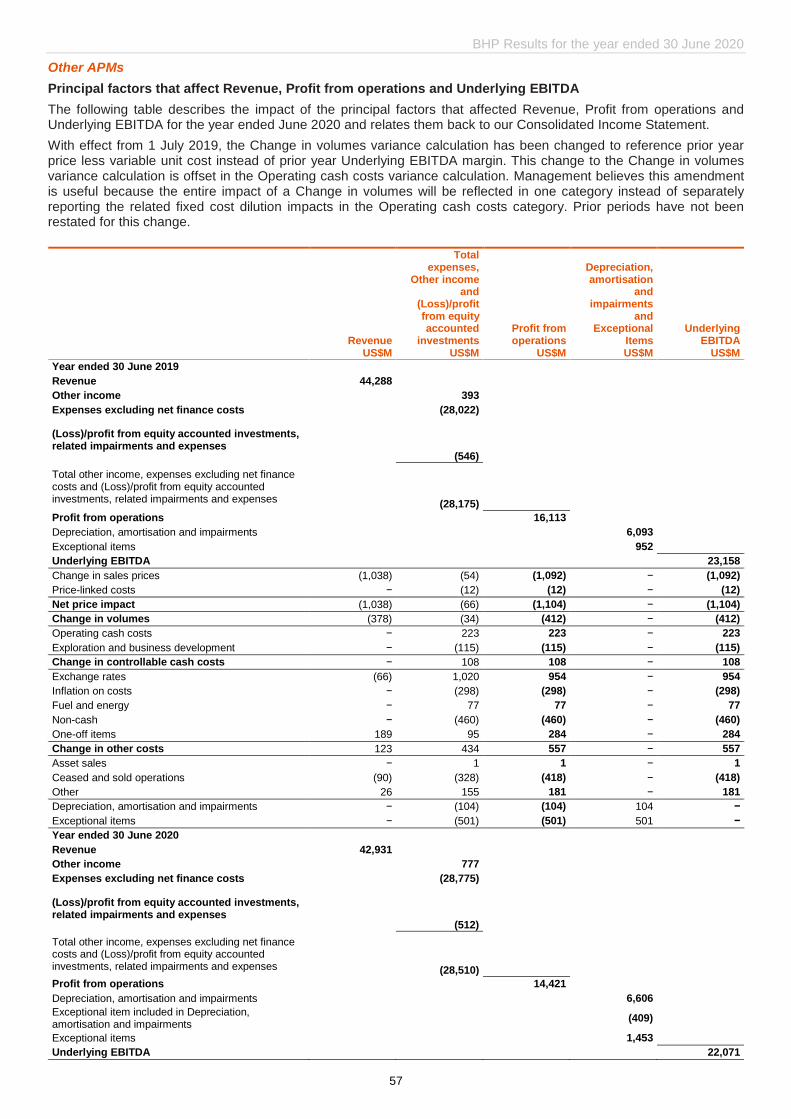
BHP Results for the year ended 30 June 2020
57
Other APMs
Principal factors that affect Revenue, Profit from operations and Underlying EBITDA
The following table describes the impact of the principal factors that affected Revenue, Profit from operations and Underlying EBITDA for the year ended June 2020 and relates them back to our Consolidated Income Statement.
With effect from 1 July 2019, the Change in volumes variance calculation has been changed to reference prior year price less variable unit cost instead of prior year Underlying EBITDA margin. This change to the Change in volumes variance calculation is offset in the Operating cash costs variance calculation. Management believes this amendment is useful because the entire impact of a Change in volumes will be reflected in one category instead of separately reporting the related fixed cost dilution impacts in the Operating cash costs category. Prior periods have not been restated for this change.
Revenue
US$M
Total expenses,
Other income and
(Loss)/profit from equity accounted
investments US$M
Profit from operations
US$M
Depreciation, amortisation
and impairments
and Exceptional
Items US$M
Underlying EBITDA
US$M
Year ended 30 June 2019
Revenue 44,288
Other income 393
Expenses excluding net finance costs (28,022)
(Loss)/profit from equity accounted investments, related impairments and expenses
(546)
Total other income, expenses excluding net finance costs and (Loss)/profit from equity accounted investments, related impairments and expenses (28,175)
Profit from operations 16,113
Depreciation, amortisation and impairments 6,093
Exceptional items 952
Underlying EBITDA 23,158
Change in sales prices (1,038) (54) (1,092) − (1,092)
Price-linked costs − (12) (12) − (12)
Net price impact (1,038) (66) (1,104) − (1,104)
Change in volumes (378) (34) (412) − (412)
Operating cash costs − 223 223 − 223
Exploration and business development − (115) (115) − (115)
Change in controllable cash costs − 108 108 − 108
Exchange rates (66) 1,020 954 − 954
Inflation on costs − (298) (298) − (298)
Fuel and energy − 77 77 − 77
Non-cash − (460) (460) − (460)
One-off items 189 95 284 − 284
Change in other costs 123 434 557 − 557
Asset sales − 1 1 − 1
Ceased and sold operations (90) (328) (418) − (418)
Other 26 155 181 − 181
Depreciation, amortisation and impairments − (104) (104) 104 −
Exceptional items − (501) (501) 501 −
Year ended 30 June 2020
Revenue 42,931
Other income 777
Expenses excluding net finance costs (28,775)
(Loss)/profit from equity accounted investments, related impairments and expenses
(512)
Total other income, expenses excluding net finance costs and (Loss)/profit from equity accounted investments, related impairments and expenses (28,510)
Profit from operations 14,421
Depreciation, amortisation and impairments 6,606
Exceptional item included in Depreciation, amortisation and impairments
(409)
Exceptional items 1,453
Underlying EBITDA 22,071
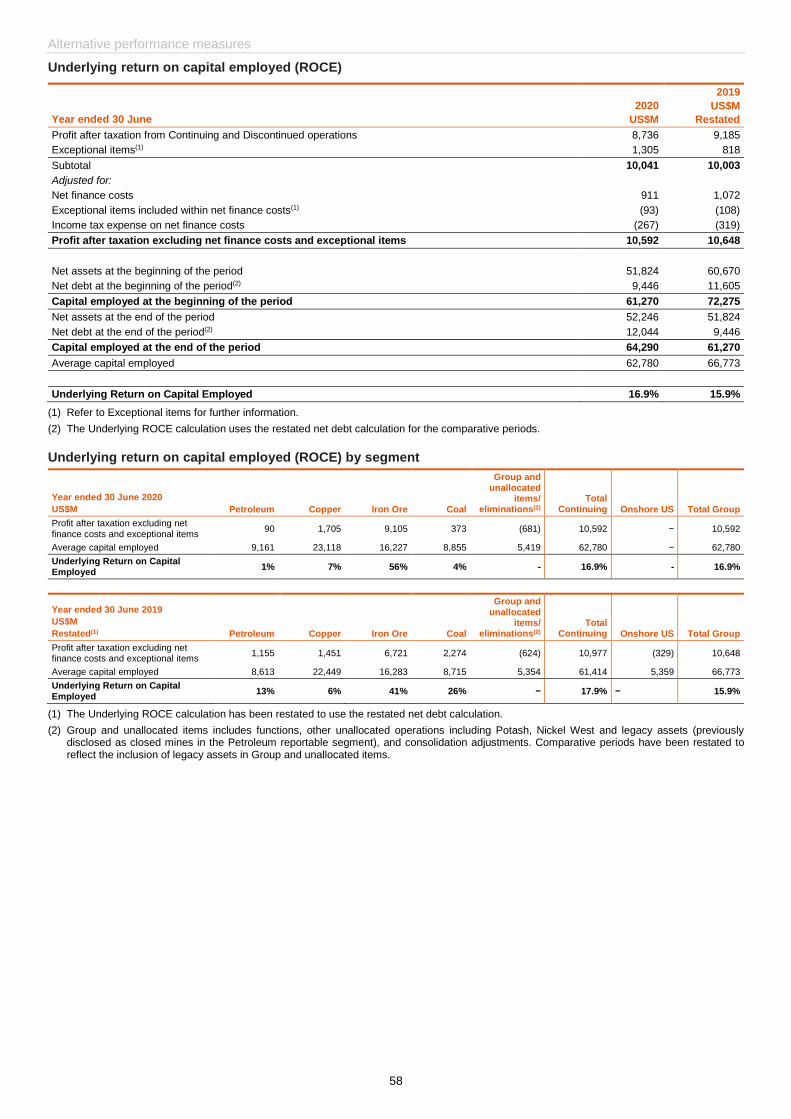
Alternative performance measures
58
Underlying return on capital employed (ROCE)
Year ended 30 June
2020
US$M
2019
US$M
Restated
Profit after taxation from Continuing and Discontinued operations 8,736 9,185
Exceptional items(1) 1,305 818
Subtotal 10,041 10,003
Adjusted for:
Net finance costs 911 1,072
Exceptional items included within net finance costs(1) (93) (108)
Income tax expense on net finance costs (267) (319)
Profit after taxation excluding net finance costs and exceptional items 10,592 10,648
Net assets at the beginning of the period 51,824 60,670
Net debt at the beginning of the period(2) 9,446 11,605
Capital employed at the beginning of the period 61,270 72,275
Net assets at the end of the period 52,246 51,824
Net debt at the end of the period(2) 12,044 9,446
Capital employed at the end of the period 64,290 61,270
Average capital employed 62,780 66,773
Underlying Return on Capital Employed 16.9% 15.9%
(1) Refer to Exceptional items for further information.
(2) The Underlying ROCE calculation uses the restated net debt calculation for the comparative periods.
Underlying return on capital employed (ROCE) by segment
Year ended 30 June 2020
US$M Petroleum Copper Iron Ore Coal
Group and unallocated
items/ eliminations(2)
Total Continuing Onshore US Total Group
Profit after taxation excluding net finance costs and exceptional items
90 1,705 9,105 373 (681) 10,592 − 10,592
Average capital employed 9,161 23,118 16,227 8,855 5,419 62,780 − 62,780
Underlying Return on Capital Employed
1% 7% 56% 4% - 16.9% - 16.9%
Year ended 30 June 2019
US$M
Restated(1) Petroleum Copper Iron Ore Coal
Group and unallocated
items/ eliminations(2)
Total Continuing Onshore US Total Group
Profit after taxation excluding net finance costs and exceptional items
1,155 1,451 6,721 2,274 (624) 10,977 (329) 10,648
Average capital employed 8,613 22,449 16,283 8,715 5,354 61,414 5,359 66,773
Underlying Return on Capital Employed
13% 6% 41% 26% − 17.9% − 15.9%
(1) The Underlying ROCE calculation has been restated to use the restated net debt calculation.
(2) Group and unallocated items includes functions, other unallocated operations including Potash, Nickel West and legacy assets (previously disclosed as closed mines in the Petroleum reportable segment), and consolidation adjustments. Comparative periods have been restated to reflect the inclusion of legacy assets in Group and unallocated items.
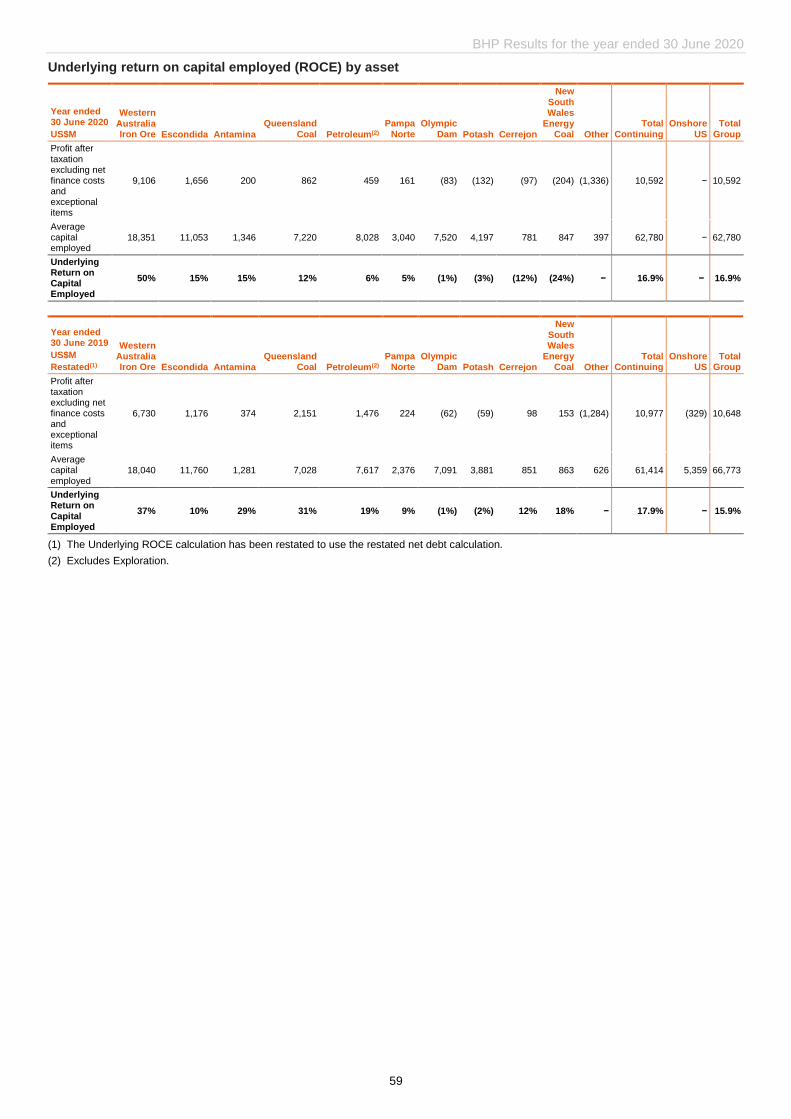
BHP Results for the year ended 30 June 2020
59
Underlying return on capital employed (ROCE) by asset
Year ended 30 June 2020
US$M
Western
Australia Iron Ore Escondida Antamina
Queensland Coal Petroleum(2)
Pampa Norte
Olympic Dam Potash Cerrejon
New South Wales
Energy Coal Other
Total Continuing
Onshore US
Total Group
Profit after taxation excluding net finance costs and exceptional items
9,106 1,656 200 862 459 161 (83) (132) (97) (204) (1,336) 10,592 − 10,592
Average capital employed
18,351 11,053 1,346 7,220 8,028 3,040 7,520 4,197 781 847 397 62,780 − 62,780
Underlying Return on Capital Employed
50% 15% 15% 12% 6% 5% (1%) (3%) (12%) (24%) − 16.9% − 16.9%
Year ended 30 June 2019
US$M
Restated(1)
Western Australia Iron Ore Escondida Antamina
Queensland Coal Petroleum(2)
Pampa Norte
Olympic Dam Potash Cerrejon
New South Wales
Energy Coal Other
Total Continuing
Onshore US
Total Group
Profit after taxation excluding net finance costs and exceptional items
6,730 1,176 374 2,151 1,476 224 (62) (59) 98 153 (1,284) 10,977 (329) 10,648
Average capital employed
18,040 11,760 1,281 7,028 7,617 2,376 7,091 3,881 851 863 626 61,414 5,359 66,773
Underlying Return on Capital Employed
37% 10% 29% 31% 19% 9% (1%) (2%) 12% 18% − 17.9% − 15.9%
(1) The Underlying ROCE calculation has been restated to use the restated net debt calculation.
(2) Excludes Exploration.

Alternative performance measures
60
Definition and calculation of alternative performance measures
Alternative Performance Measure (APM)
Reasons why we believe the APMs are useful Calculation methodology
Underlying attributable profit
Allows the comparability of underlying financial performance by excluding the impacts of exceptional items and is a performance indicator against which short-term incentive outcomes for our senior executives are measured. It is also the basis on which our dividend payout ratio policy is applied.
Profit after taxation attributable to BHP shareholders excluding any exceptional items attributable to BHP shareholders.
Underlying basic earnings per share
On a per share basis, allows the comparability of underlying financial performance by excluding the impacts of exceptional items.
Underlying attributable profit divided by the weighted basic average number of shares.
Underlying EBITDA Used to help assess current operational profitability excluding the impacts of sunk costs (i.e. depreciation from initial investment). Each is a measure that management uses internally to assess the performance of the Group’s segments and make decisions on the allocation of resources.
Earnings before net finance costs, depreciation, amortisation and impairments, taxation expense, discontinued operations and exceptional items. Underlying EBITDA includes BHP’s share of profit/(loss) from investments accounted for using the equity method including net finance costs, depreciation, amortisation and impairments and taxation expense/(benefit).
Underlying EBITDA margin
Underlying EBITDA excluding third party product EBITDA, divided by revenue excluding third party product revenue.
Underlying EBIT Used to help assess current operational profitability excluding net finance costs and taxation expense (each of which are managed at the Group level), as well as discontinued operations and any exceptional items.
Earnings before net finance costs, taxation expense, discontinued operations and any exceptional items. Underlying EBIT includes BHP’s share of profit/(loss) from investments accounted for using the equity method including net finance costs and taxation expense/(benefit).
Profit from operations Earnings before net finance costs, taxation expense and discontinued operations. Profit from operations includes Revenue, Other income, Expenses excluding net finance costs and BHP’s share of profit/(loss) from investments accounted for using the equity method including net finance costs and taxation expense/(benefit).
Capital and exploration expenditure
Used as part of our Capital Allocation Framework to assess efficient deployment of capital. Represents the total outflows of our operational investing expenditure.
Purchases of property, plant and equipment and exploration expenditure.
Free cash flow It is a key measure used as part of our Capital Allocation Framework. Reflects our operational cash performance inclusive of investment expenditure, which helps to highlight how much cash was generated in the period to be available for the servicing of debt and distribution to shareholders.
Net operating cash flows less Net investing cash flows.
Net debt Net debt shows the position of gross debt less index-linked freight contracts offset by cash immediately available to pay debt if required and any associated derivative financial instruments. Liability associated with index-linked freight contracts are excluded from the net debt calculation due to the short term volatility of the index they relate to not aligning with how the Group uses net debt for decision making in relation to the Capital Allocation Framework. Net debt, along with the gearing ratio, is used to monitor the Group’s capital management by relating net debt relative to equity from shareholders.
Interest bearing liabilities less liability associated with index-linked freight contracts less cash and cash equivalents less net cross currency and interest rate swaps less net cash management related instruments for the Group at the reporting date.
Gearing ratio Ratio of Net debt to Net debt plus Net assets.

BHP Results for the year ended 30 June 2020
61
Alternative Performance Measure (APM)
Reasons why we believe the APMs are useful Calculation methodology
Net operating assets Enables a clearer view of the assets deployed to generate earnings by highlighting the net operating assets of the business separate from the financing and tax balances. This measure helps provide an indicator of the underlying performance of our assets and enhances comparability between them.
Operating assets net of operating liabilities, including the carrying value of equity accounted investments and predominantly excludes cash balances, loans to associates, interest bearing liabilities, derivatives hedging our net debt and tax balances.
Underlying return on capital employed (ROCE)
Indicator of the Group’s capital efficiency and is provided on an underlying basis to allow comparability of underlying financial performance by excluding the impacts of exceptional items.
Profit after taxation excluding exceptional items and net finance costs (after taxation) divided by average capital employed.
Profit after taxation excluding exceptional items and net finance costs (after taxation) is profit after taxation from Continuing and Discontinued operations excluding exceptional items, net finance costs and the estimated taxation impact of net finance costs. These are annualised for a half-year end reporting period.
The estimated tax impact is calculated using a prima facie taxation rate on net finance costs (excluding any foreign exchange impact).
Average capital employed is calculated as the average of net assets less net debt for the last two reporting periods.
Adjusted effective tax rate Provides an underlying tax basis to allow comparability of underlying financial performance by excluding the impacts of exceptional items.
Total taxation expense/(benefit) excluding exceptional items and exchange rate movements included in taxation expense/(benefit) divided by Profit before taxation and exceptional items.
Unit cost Used to assess the controllable financial performance of the Group’s assets for each unit of production. Unit costs are adjusted for site specific non controllable factors to enhance comparability between the Group’s assets.
Ratio of net costs of the assets to the equity share of sales tonnage. Net costs is defined as revenue less Underlying EBITDA and excludes freight and other costs, depending on the nature of each asset. Freight is excluded as the Group believes it provides a similar basis of comparison to our peer group.
Petroleum unit costs exclude:
Exploration, development and evaluation expense as these costs do not represent our cost performance in relation to current production and the Group believes it provides a similar basis of comparison to our peer group;
Other costs that do not represent underlying cost performance of the business.
Escondida unit costs exclude:
By-product credits being the favourable impact of by-products (such as gold or silver) to determine the directly attributable costs of copper production.
WAIO, Queensland Coal and NSWEC unit cash costs exclude royalties as these are costs that are not deemed to be under the Group's control, and the Group believes exclusion provides a similar basis of comparison to our peer group.
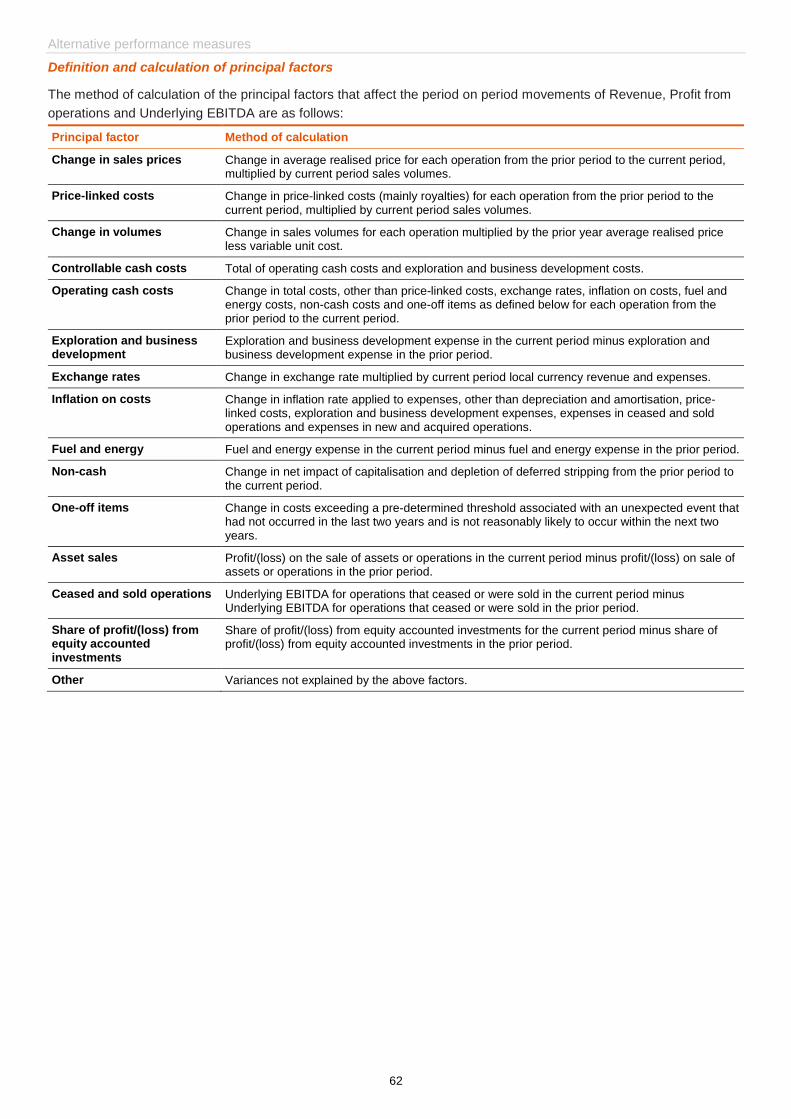
Alternative performance measures
62
Definition and calculation of principal factors
The method of calculation of the principal factors that affect the period on period movements of Revenue, Profit from
operations and Underlying EBITDA are as follows:
Principal factor Method of calculation
Change in sales prices Change in average realised price for each operation from the prior period to the current period, multiplied by current period sales volumes.
Price-linked costs Change in price-linked costs (mainly royalties) for each operation from the prior period to the current period, multiplied by current period sales volumes.
Change in volumes Change in sales volumes for each operation multiplied by the prior year average realised price less variable unit cost.
Controllable cash costs Total of operating cash costs and exploration and business development costs.
Operating cash costs Change in total costs, other than price-linked costs, exchange rates, inflation on costs, fuel and energy costs, non-cash costs and one-off items as defined below for each operation from the prior period to the current period.
Exploration and business development
Exploration and business development expense in the current period minus exploration and business development expense in the prior period.
Exchange rates Change in exchange rate multiplied by current period local currency revenue and expenses.
Inflation on costs Change in inflation rate applied to expenses, other than depreciation and amortisation, price-linked costs, exploration and business development expenses, expenses in ceased and sold operations and expenses in new and acquired operations.
Fuel and energy Fuel and energy expense in the current period minus fuel and energy expense in the prior period.
Non-cash Change in net impact of capitalisation and depletion of deferred stripping from the prior period to the current period.
One-off items Change in costs exceeding a pre-determined threshold associated with an unexpected event that had not occurred in the last two years and is not reasonably likely to occur within the next two years.
Asset sales Profit/(loss) on the sale of assets or operations in the current period minus profit/(loss) on sale of assets or operations in the prior period.
Ceased and sold operations Underlying EBITDA for operations that ceased or were sold in the current period minus Underlying EBITDA for operations that ceased or were sold in the prior period.
Share of profit/(loss) from equity accounted investments
Share of profit/(loss) from equity accounted investments for the current period minus share of profit/(loss) from equity accounted investments in the prior period.
Other Variances not explained by the above factors.
Top Related