


Languages
Pages
Legal

Recognizing and Valuing Variability
In Our Students and Ourselves
Jessica Utts
Department of Statistics
University of California, Davis
SOME STORIES
Statistics and my mother “Professors for the Future”
Program Watching colleagues teach
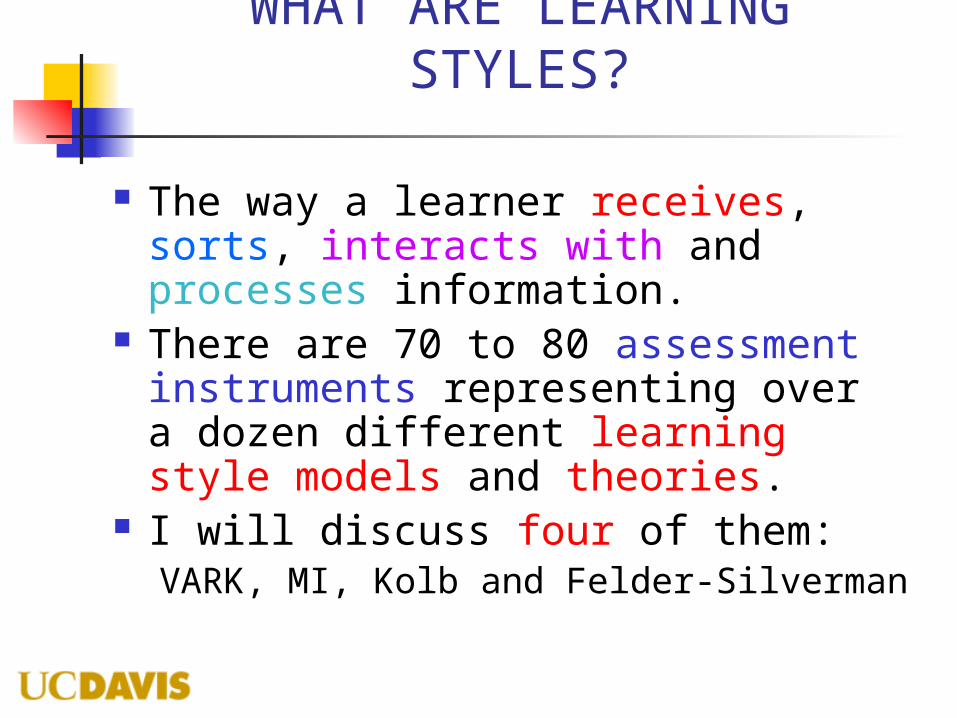
WHAT ARE LEARNING STYLES?
The way a learner receives, sorts, interacts with and processes information.
There are 70 to 80 assessment instruments representing over a dozen different learning style models and theories.
I will discuss four of them: VARK, MI, Kolb and Felder-Silverman
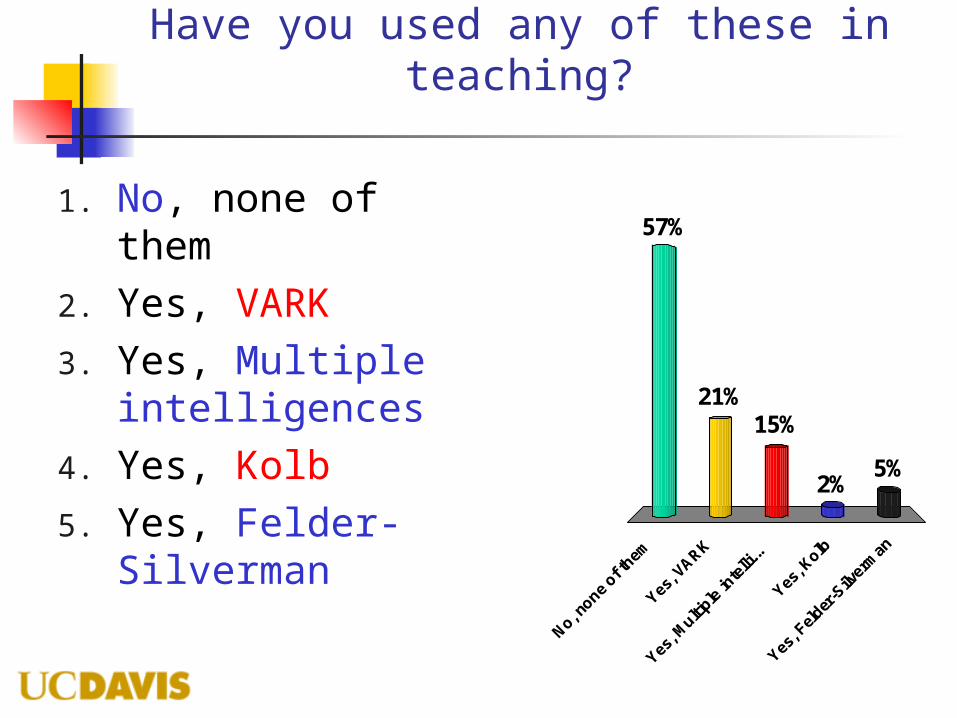
Have you used any of these in teaching?
No, n
one of t
hem
Yes
, VARK
Yes
, Multi
ple in
telli
...
Yes
, Kolb
Yes
, Fel
der-S
ilver
man
57%
21%
5%2%
15%
1. No, none of them
2. Yes, VARK3. Yes, Multiple
intelligences4. Yes, Kolb5. Yes, Felder-
Silverman

WHY CONSIDER LEARNING STYLES?
To understand how our students differ from us and from each other.
To provide learning tools for different styles of learners.
To help students strengthen their weaker modes of learning.
To help us strengthen our weaker modes of teaching.
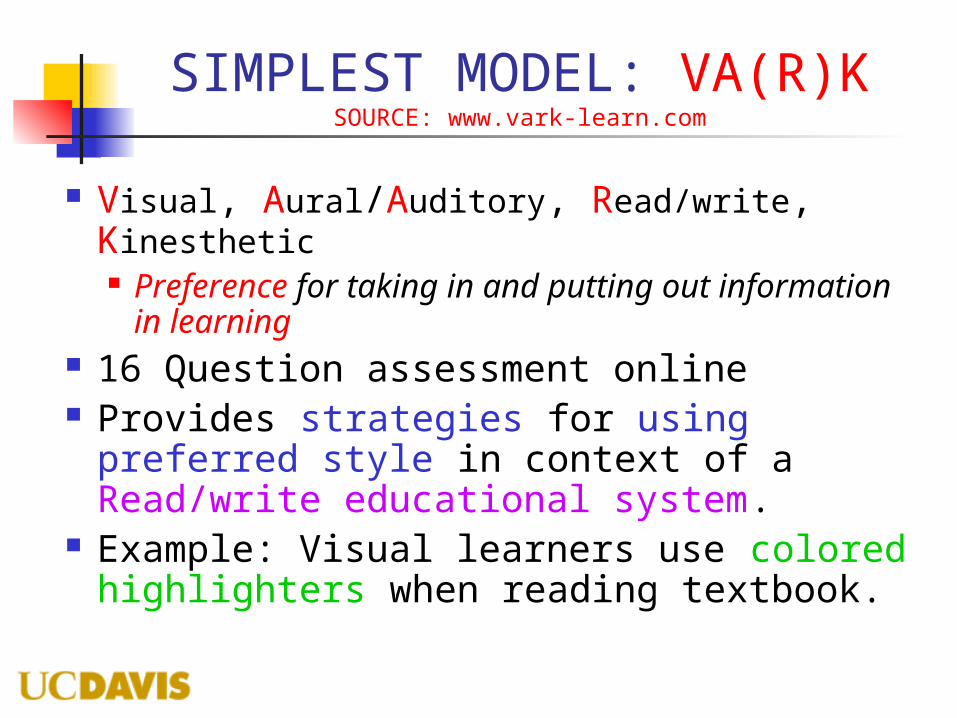
SIMPLEST MODEL: VA(R)KSOURCE: www.vark-learn.com
Visual, Aural/Auditory, Read/write, Kinesthetic Preference for taking in and putting out
information in learning 16 Question assessment online Provides strategies for using preferred
style in context of a Read/write educational system.
Example: Visual learners use colored highlighters when reading textbook.

Which One Is Strongest for You?
Vis
ual
Aura
l/Audito
ry
Rea
d/writ
e
Kin
esth
etic
42%
8%
44%
6%
1. Visual
2. Aural/Auditory 3. Read/write
4. Kinesthetic
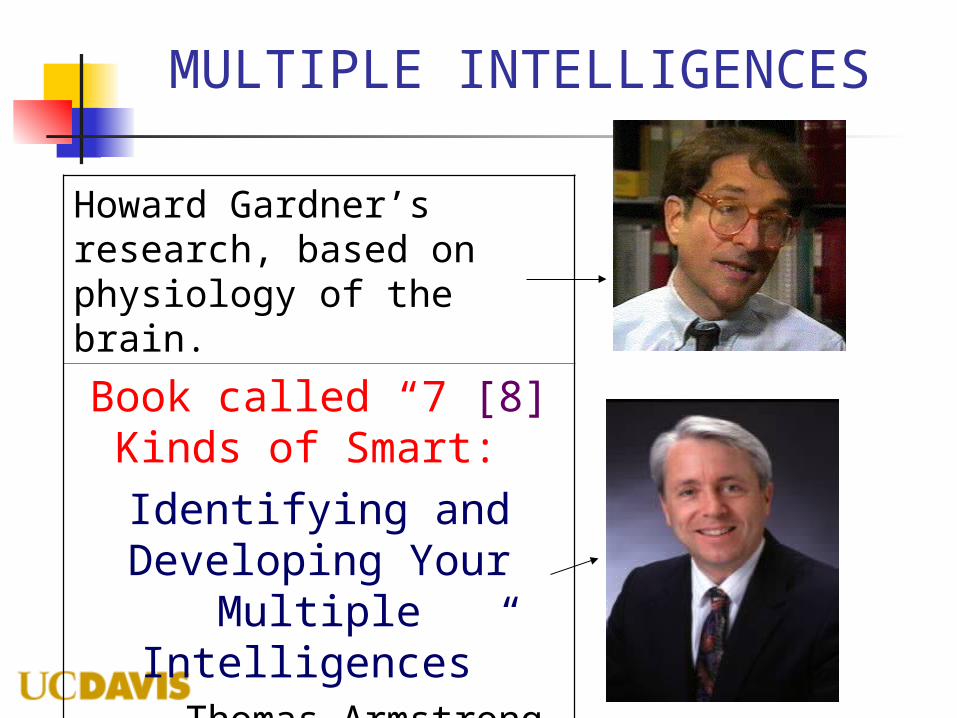
MULTIPLE INTELLIGENCES
Howard Gardner’s research, based on physiology of the brain.
Book called “7 [8] Kinds of Smart: Identifying and
Developing Your Multiple Intelligences”Thomas Armstrong, Ph.D.
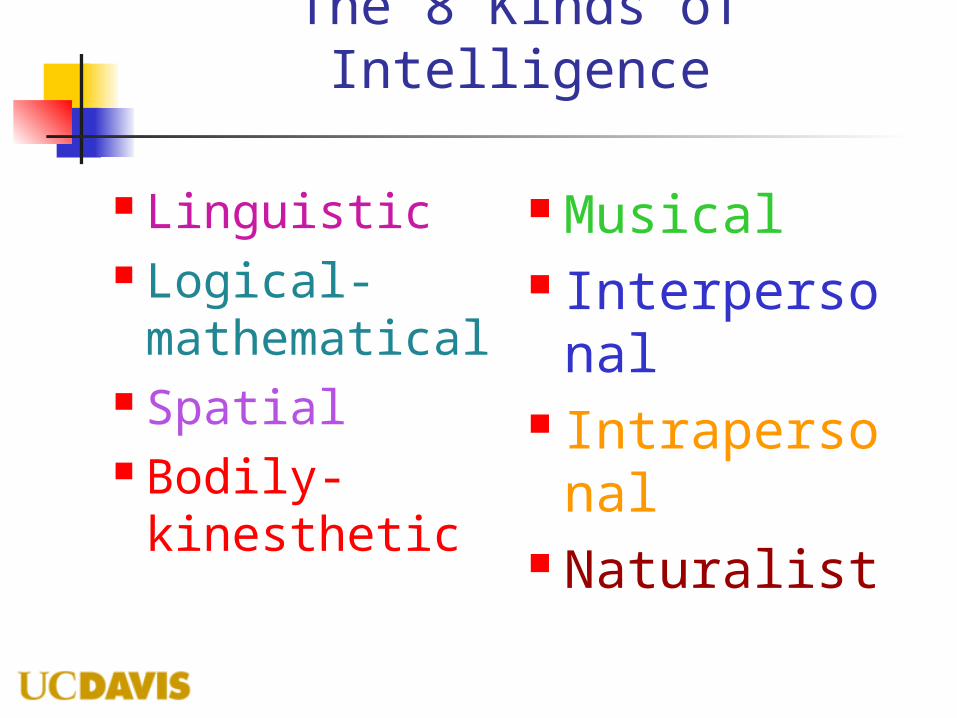
The 8 Kinds of Intelligence
Linguistic Logical-
mathematical Spatial Bodily-
kinesthetic
Musical Interpersona
l Intrapersona
l Naturalist

Characteristics of Each TypeFrom Armstrong’s book
LinguisticLikes words, language, reading, writing, puns
Logical-mathematicalCan discern logical/numerical patternsTry: Insert missing number in 11 12 14 __ 26
42 Spatial
Can manipulate visual/spatial world, see pictures
Bodily-kinestheticGood body coordination, balance, etc.
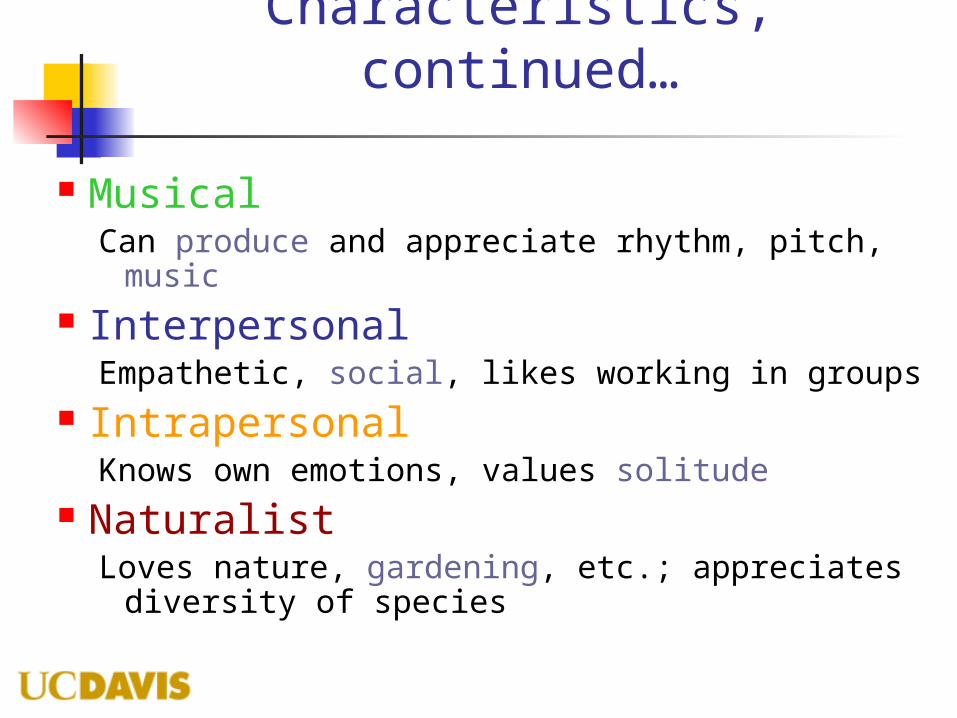
Characteristics, continued…
MusicalCan produce and appreciate rhythm, pitch,
music Interpersonal
Empathetic, social, likes working in groups Intrapersonal
Knows own emotions, values solitude Naturalist
Loves nature, gardening, etc.; appreciates diversity of species
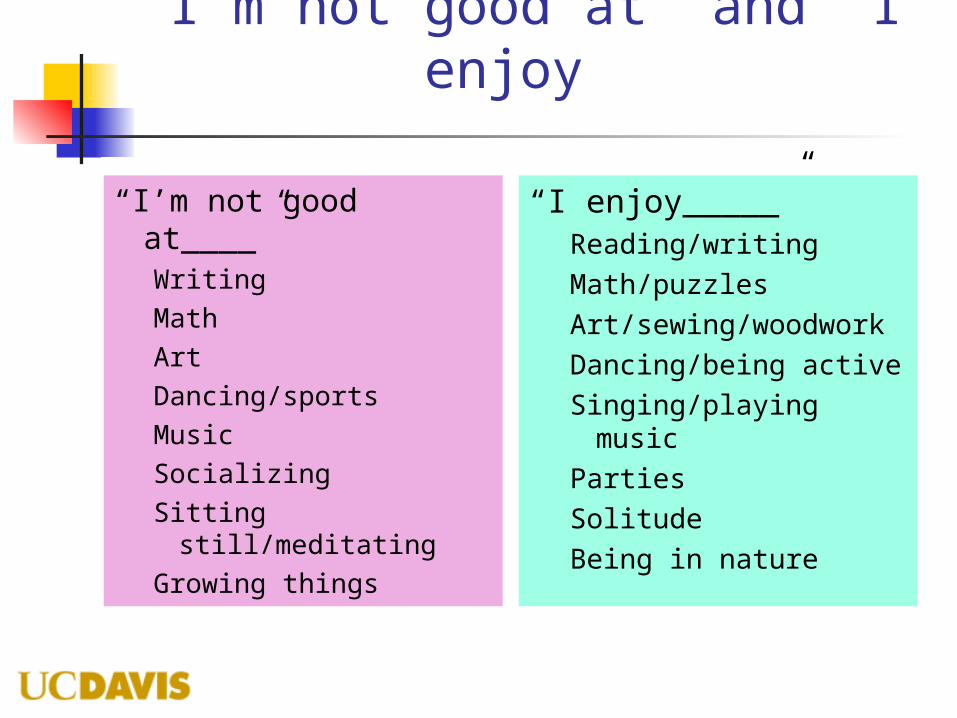
“I’m not good at” and “I enjoy”
“I’m not good at____”WritingMathArtDancing/sportsMusicSocializingSitting still/meditatingGrowing things
“I enjoy_____”Reading/writingMath/puzzlesArt/sewing/woodworkDancing/being activeSinging/playing
musicPartiesSolitudeBeing in nature

Example of Using this in Teaching
Explaining why Probability of H, H = 1/4 Linguistic: Explain in words Math: Use formulas Spatial: Show picture of 4 possible outcomes Kinesthetic: Give 8 coins to line up 4 outcomes Musical: Ask them to create a jingle about it (alphabet) Interpersonal: Pair students to discuss and solve Intrapersonal: Give answer, ask them to figure out why Naturalistic: Formulate in terms of biology instead, e.g.
blood types for two people
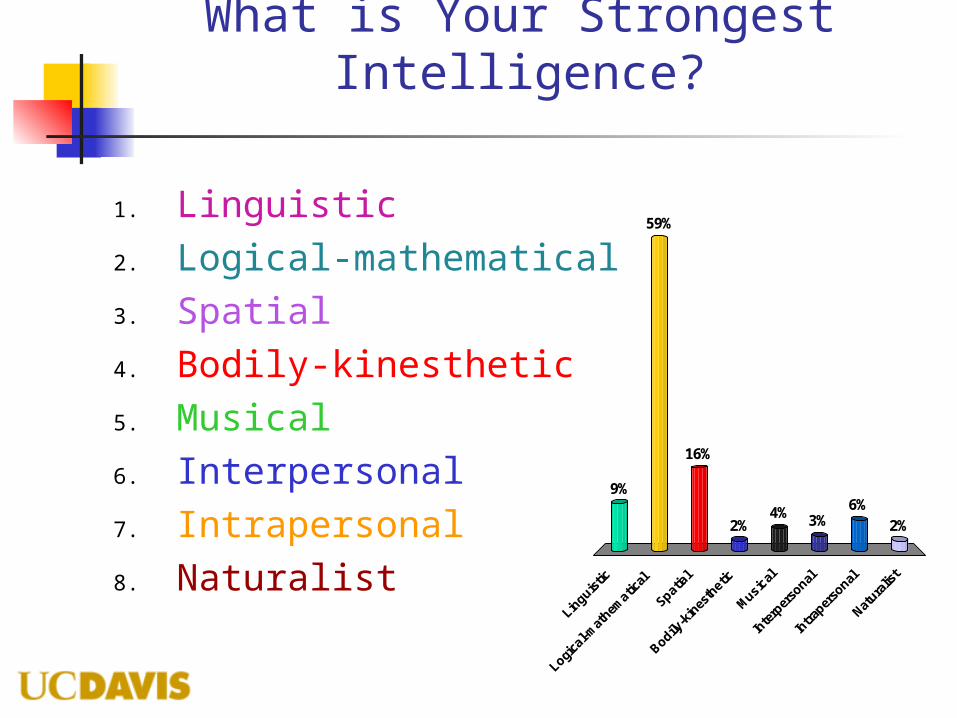
What is Your Strongest Intelligence?
Lin
guistic
Logi
cal-m
athem
atical
Spatia
l
Bodily
-kin
esth
etic
Music
al
Inte
rper
sonal
Intra
perso
nal
Nat
uralis
t
9%
59%
16%
2%6%
3%4%2%
1. Linguistic2. Logical-mathematical3. Spatial4. Bodily-kinesthetic5. Musical6. Interpersonal7. Intrapersonal8. Naturalist
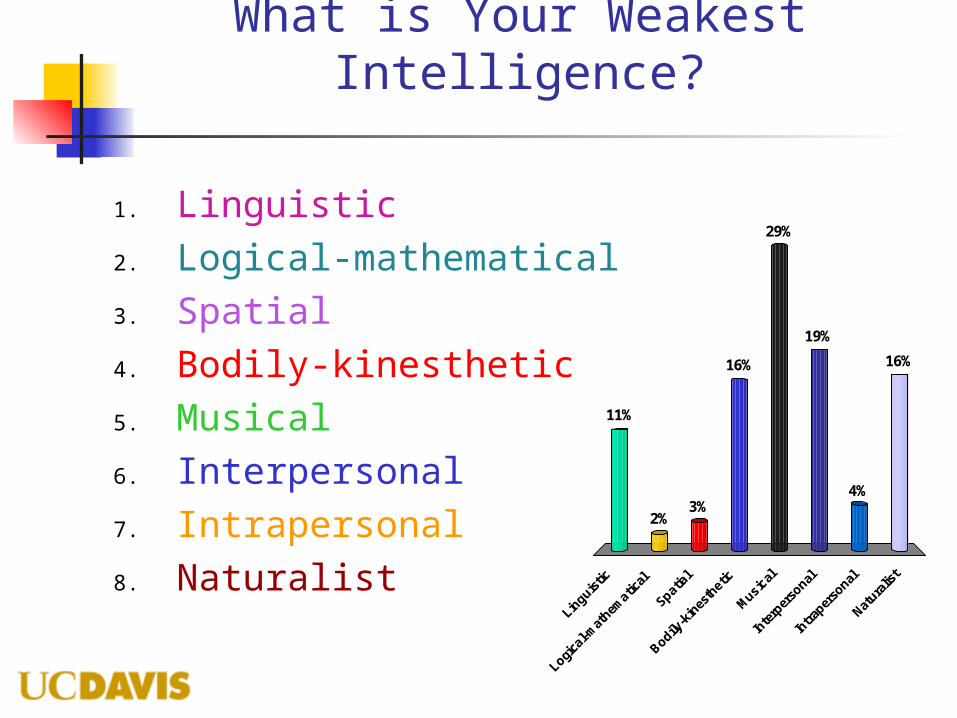
What is Your Weakest Intelligence?
Lin
guistic
Logi
cal-m
athem
atical
Spatia
l
Bodily
-kin
esth
etic
Music
al
Inte
rper
sonal
Intra
perso
nal
Nat
uralis
t
11%
2%3%
16%
4%
19%
29%
16%
1. Linguistic2. Logical-mathematical3. Spatial4. Bodily-kinesthetic5. Musical6. Interpersonal7. Intrapersonal8. Naturalist
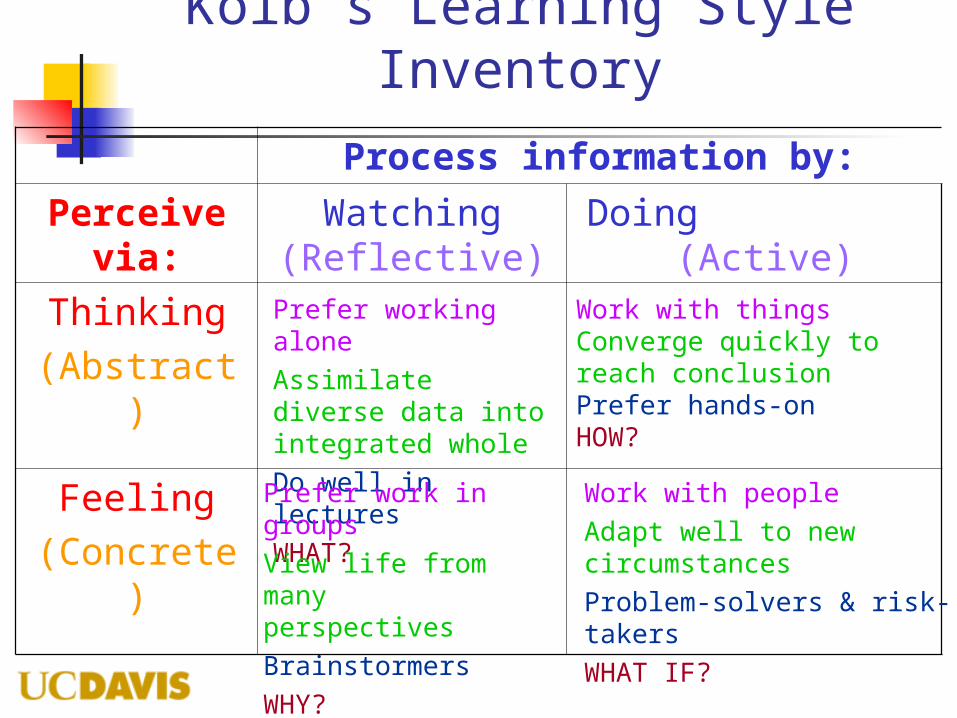
Kolb’s Learning Style Inventory
Process information by:
Perceive via:
Watching (Reflective)
Doing (Active)
Thinking(Abstract)
Feeling(Concrete)
Prefer working aloneAssimilate diverse data into integrated wholeDo well in lecturesWHAT?
Work with thingsConverge quickly to reach conclusionPrefer hands-onHOW?
Prefer work in groupsView life from many perspectivesBrainstormersWHY?
Work with peopleAdapt well to new circumstancesProblem-solvers & risk-takersWHAT IF?
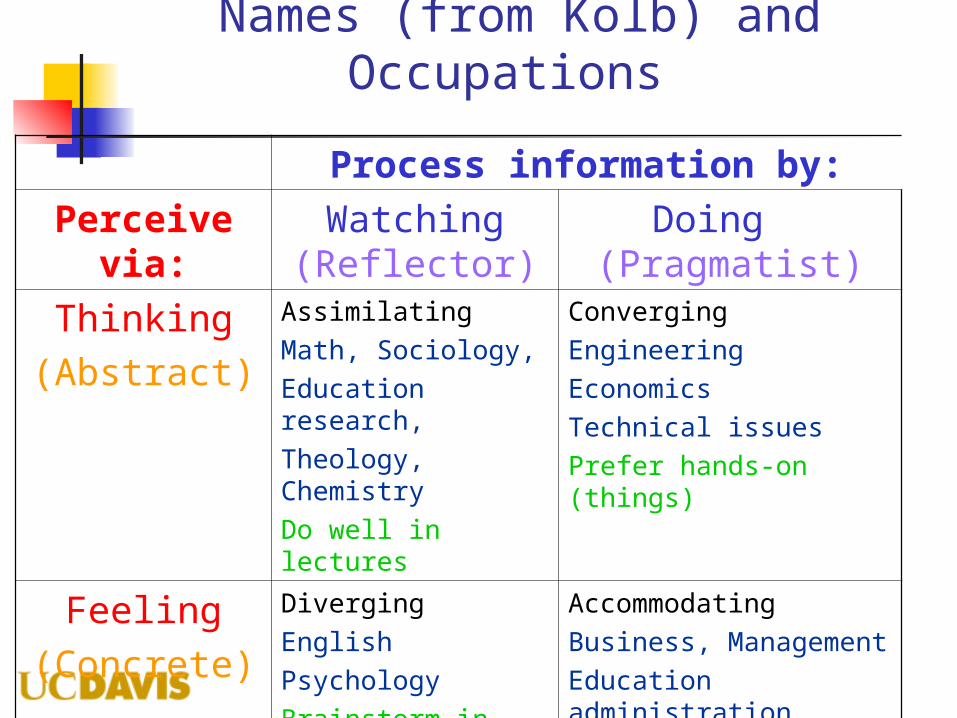
Names (from Kolb) and Occupations
Process information by:
Perceive via:
Watching (Reflector)
Doing (Pragmatist)
Thinking(Abstract)
AssimilatingMath, Sociology,Education research,Theology, ChemistryDo well in lectures
ConvergingEngineeringEconomicsTechnical issuesPrefer hands-on (things)
Feeling(Concrete)
DivergingEnglishPsychologyBrainstorm in groups
AccommodatingBusiness, ManagementEducation administrationProblem-solvers/risk-takers
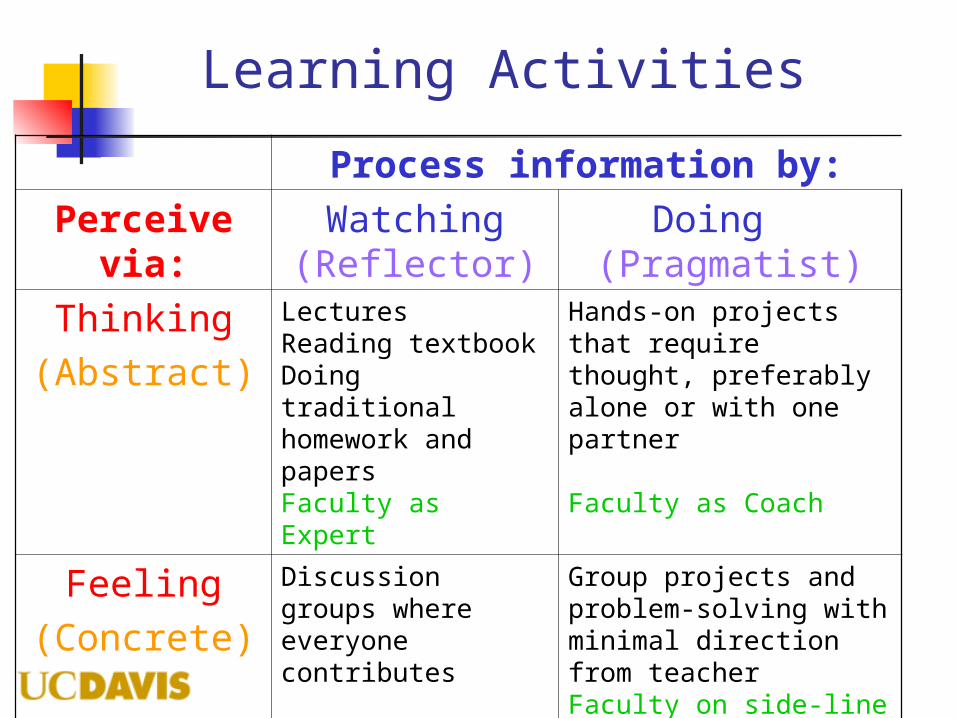
Learning Activities
Process information by:
Perceive via:
Watching (Reflector)
Doing (Pragmatist)
Thinking(Abstract)
LecturesReading textbookDoing traditional homework and papersFaculty as Expert
Hands-on projects that require thought, preferably alone or with one partner
Faculty as Coach
Feeling(Concrete)
Discussion groups where everyone contributes
Faculty as Motivator
Group projects and problem-solving with minimal direction from teacherFaculty on side-line
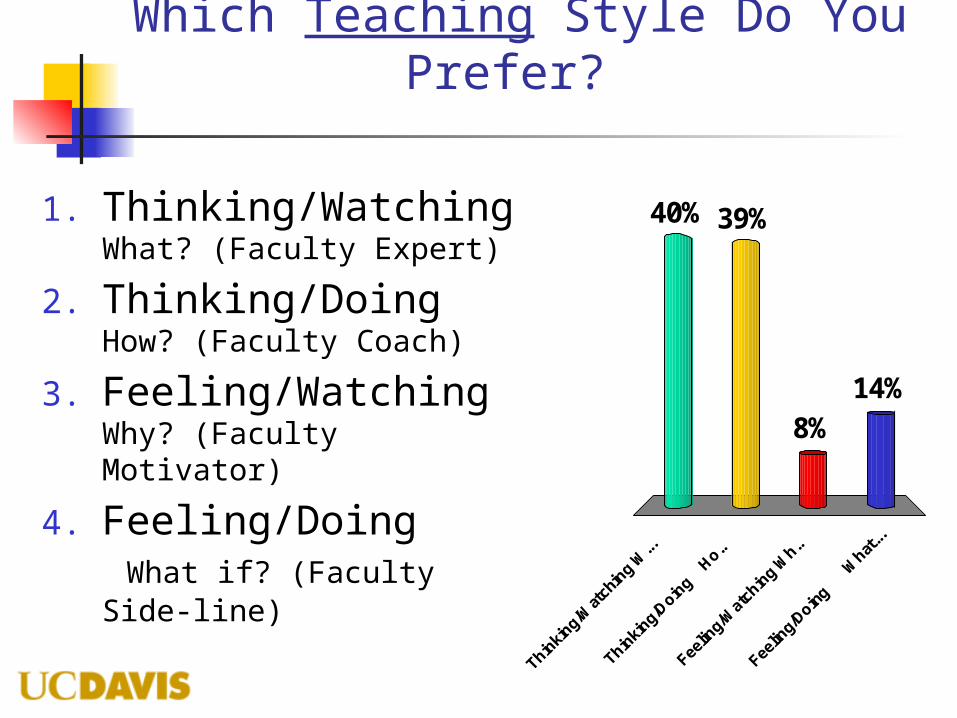
Which Teaching Style Do You Prefer?
Thin
king/W
atch
ing
W...
Thin
king/D
oing
Ho..
Fee
ling/
Wat
chin
g Wh..
Fee
ling/
Doing
W
hat...
40%
14%8%
39%1. Thinking/Watching What? (Faculty Expert)
2. Thinking/Doing How? (Faculty Coach)
3. Feeling/Watching Why? (Faculty Motivator)
4. Feeling/Doing What if? (Faculty Side-line)
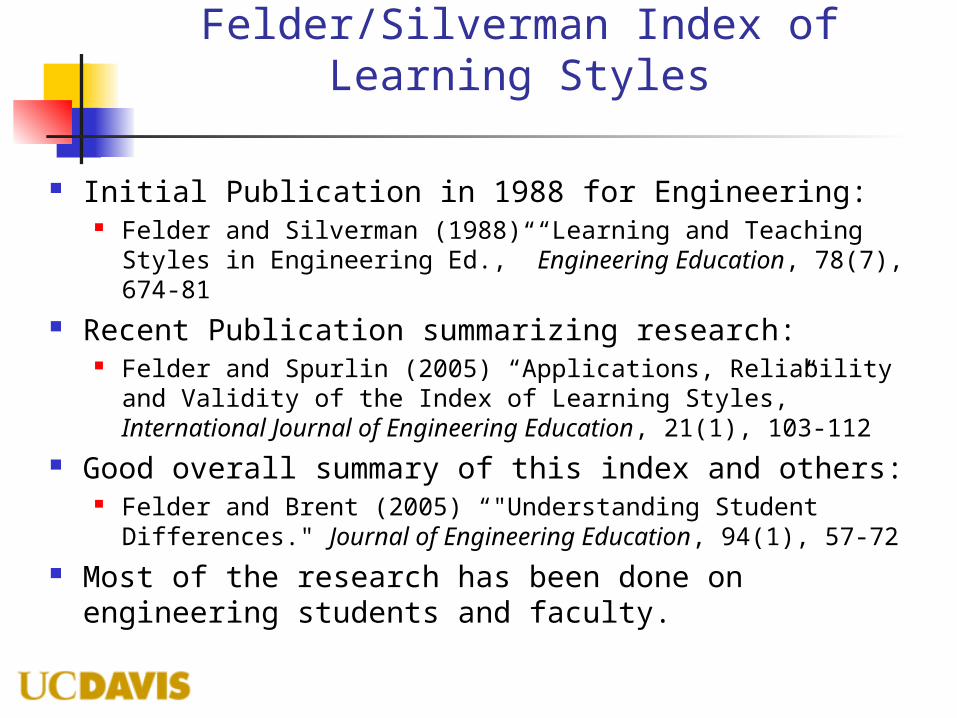
Felder/Silverman Index of Learning Styles
Initial Publication in 1988 for Engineering: Felder and Silverman (1988) “Learning and Teaching Styles
in Engineering Ed.,” Engineering Education, 78(7), 674-81 Recent Publication summarizing research:
Felder and Spurlin (2005) “Applications, Reliability and Validity of the Index of Learning Styles,” International Journal of Engineering Education, 21(1), 103-112
Good overall summary of this index and others: Felder and Brent (2005) “"Understanding Student
Differences." Journal of Engineering Education, 94(1), 57-72 Most of the research has been done on engineering
students and faculty.
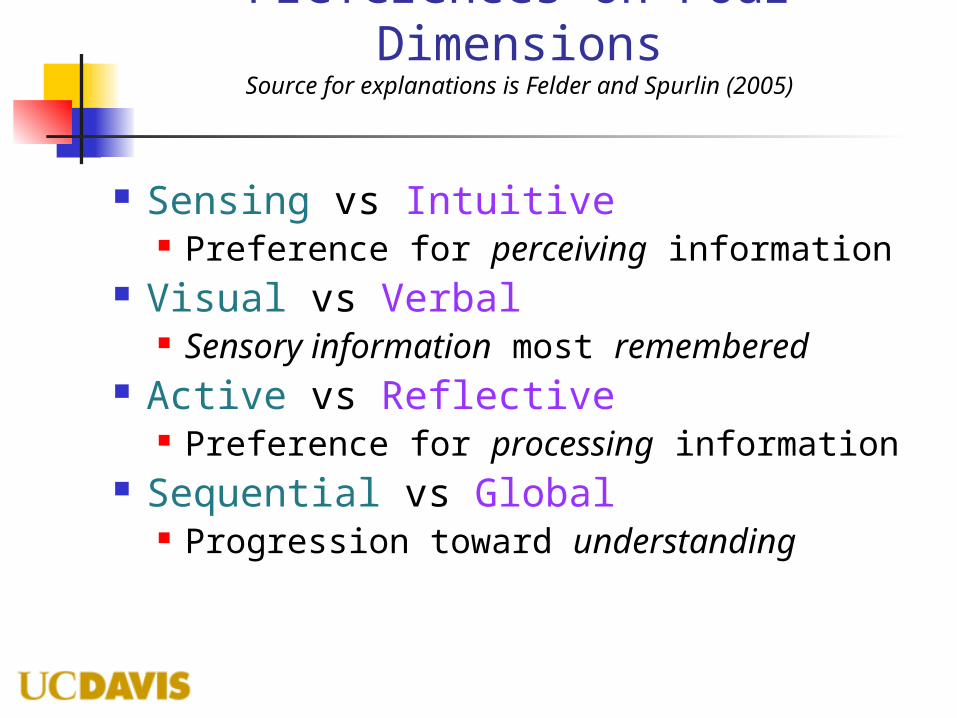
Preferences on Four DimensionsSource for explanations is Felder and Spurlin (2005)
Sensing vs Intuitive Preference for perceiving information
Visual vs Verbal Sensory information most remembered
Active vs Reflective Preference for processing information
Sequential vs Global Progression toward understanding
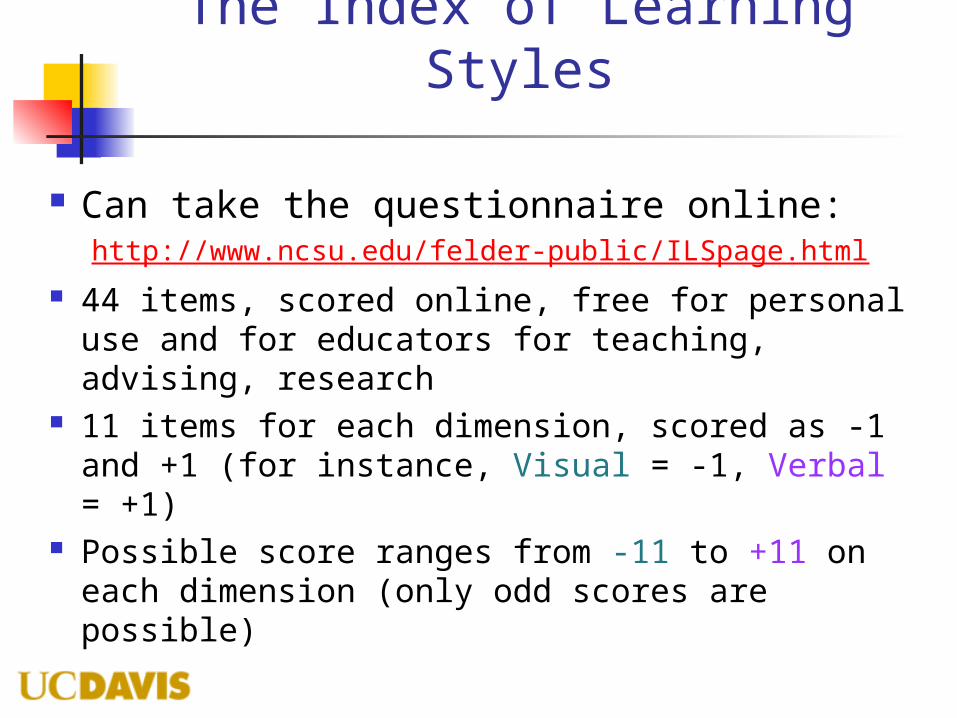
The Index of Learning Styles
Can take the questionnaire online:http://www.ncsu.edu/felder-public/ILSpage.html
44 items, scored online, free for personal use and for educators for teaching, advising, research
11 items for each dimension, scored as -1 and +1 (for instance, Visual = -1, Verbal = +1)
Possible score ranges from -11 to +11 on each dimension (only odd scores are possible)
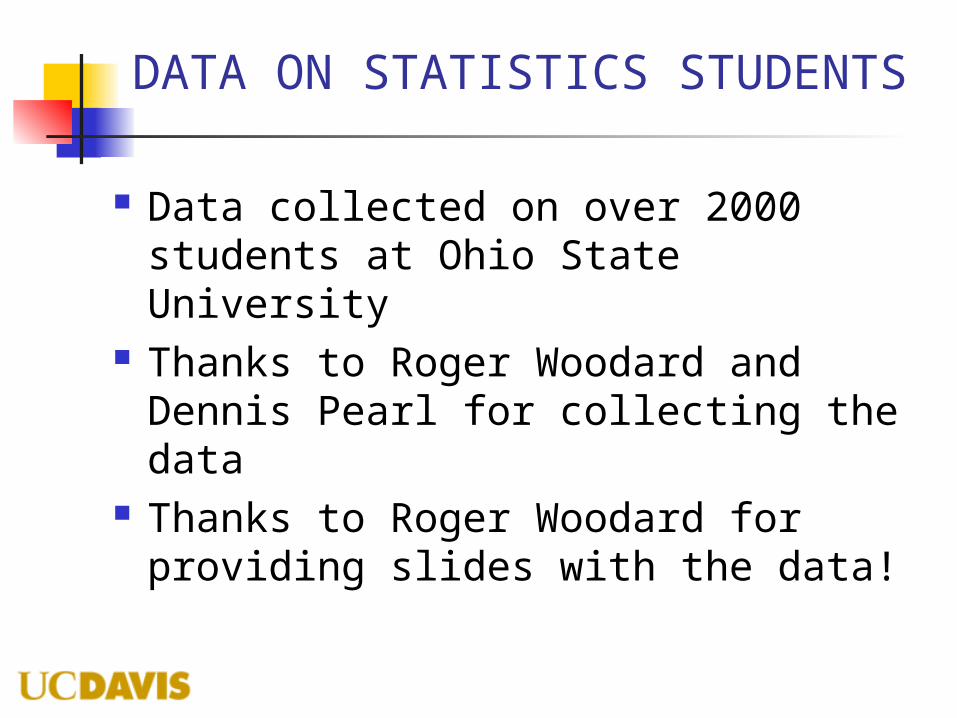
DATA ON STATISTICS STUDENTS
Data collected on over 2000 students at Ohio State University
Thanks to Roger Woodard and Dennis Pearl for collecting the data
Thanks to Roger Woodard for providing slides with the data!

Results From OSU Students
Felder ILS has been administered to over two thousand students. Part of two statistics courses Liberal arts students and business
students. Distributions essentially identical.
Slide courtesy of Roger Woodard, NCSU

Perceiving Information
Sensing Notice sights, sounds, physical sensations Concrete thinker Practical Like facts and procedures
Intuitive Notice memories, thoughts, insights Abstract thinker Innovative Like theories and underlying meanings
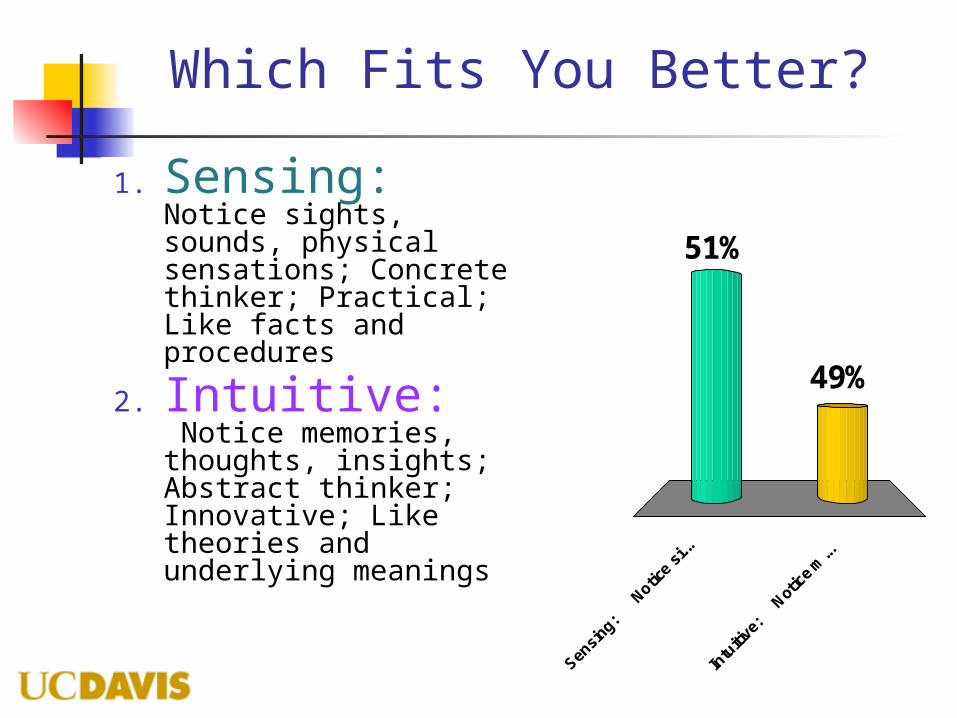
Which Fits You Better?
Sen
sing:
N
otice
si...
Intu
itive
:
Notic
e m
...
49%
51%
1. Sensing: Notice sights, sounds, physical sensations; Concrete thinker; Practical; Like facts and procedures
2. Intuitive: Notice memories, thoughts, insights; Abstract thinker; Innovative; Like theories and underlying meanings

Sensing vs. Intuitive
0
50
100
150
200
250
300
350
-11 -9 -7 -5 -3 -1 1 3 5 7 9 11
Sensing <=======================>Intuitive
Slide courtesy of Roger Woodard, NCSU
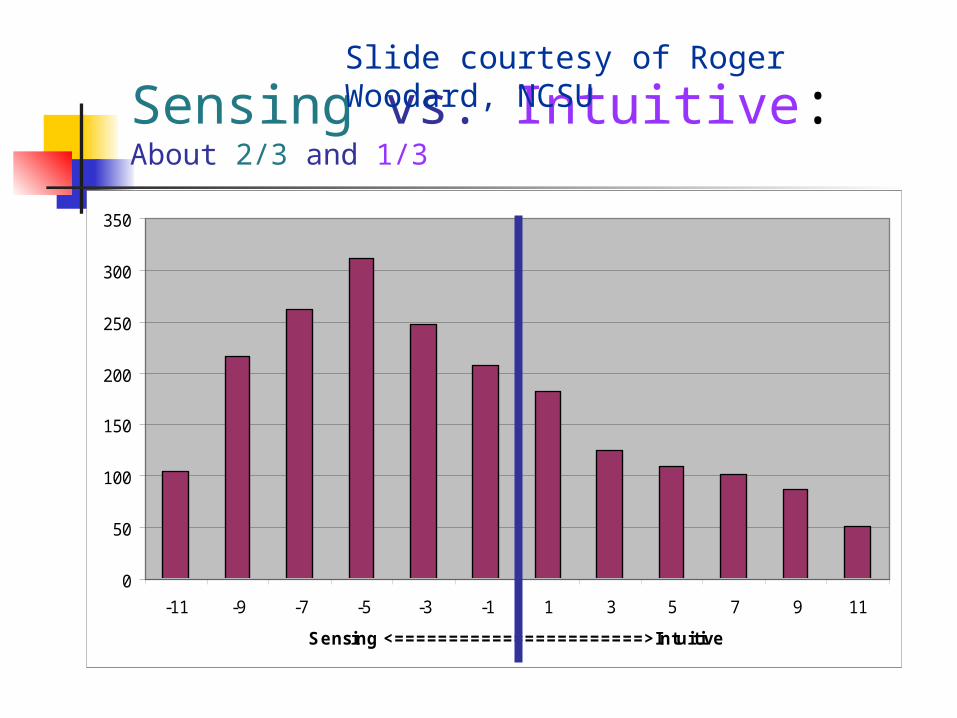
Sensing vs. Intuitive: About 2/3 and 1/3
0
50
100
150
200
250
300
350
-11 -9 -7 -5 -3 -1 1 3 5 7 9 11
Sensing <=======================>Intuitive
Slide courtesy of Roger Woodard, NCSU
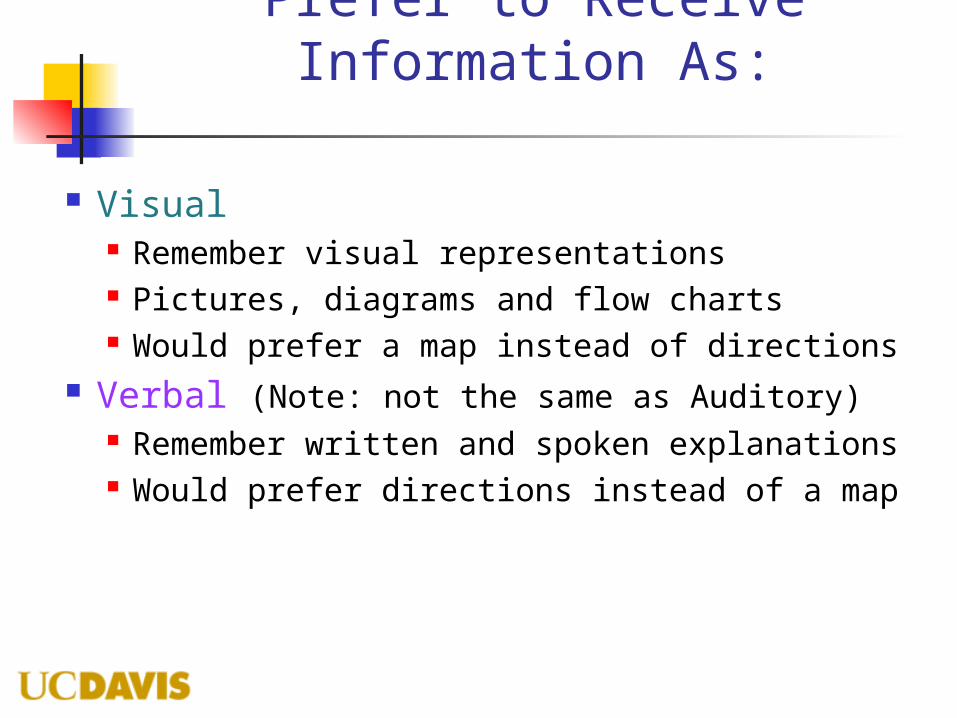
Prefer to Receive Information As:
Visual Remember visual representations Pictures, diagrams and flow charts Would prefer a map instead of directions
Verbal (Note: not the same as Auditory) Remember written and spoken
explanations Would prefer directions instead of a map

Which Do You Prefer?
Vis
ual: R
emem
ber v
i...
Ver
bal: R
emem
ber w
r...
24%
76%1. Visual: Remember
visual representations; Pictures, diagrams and flow charts; Would prefer a map instead of directions
2. Verbal: Remember written and spoken explanations; Would prefer directions instead of a map

Visual vs. Verbal
0
50
100
150
200
250
300
350
-11 -9 -7 -5 -3 -1 1 3 5 7 9 11
Visual <=======================>Verbal
Slide courtesy of Roger Woodard, NCSU
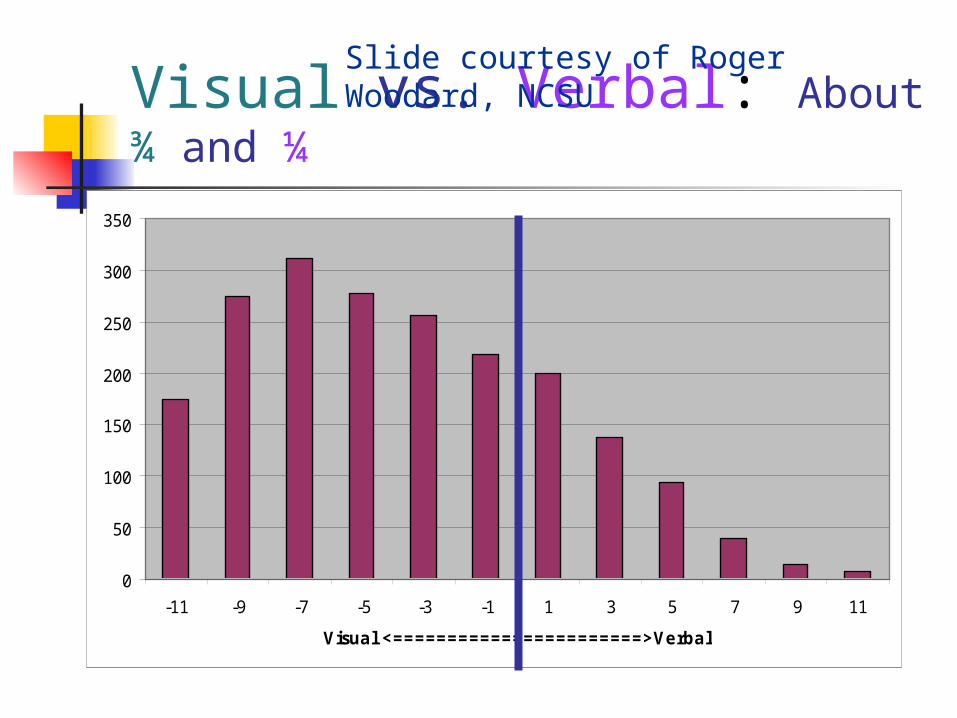
Visual vs. Verbal: About ¾ and ¼
0
50
100
150
200
250
300
350
-11 -9 -7 -5 -3 -1 1 3 5 7 9 11
Visual <=======================>Verbal
Slide courtesy of Roger Woodard, NCSU

Preference for Processing Information
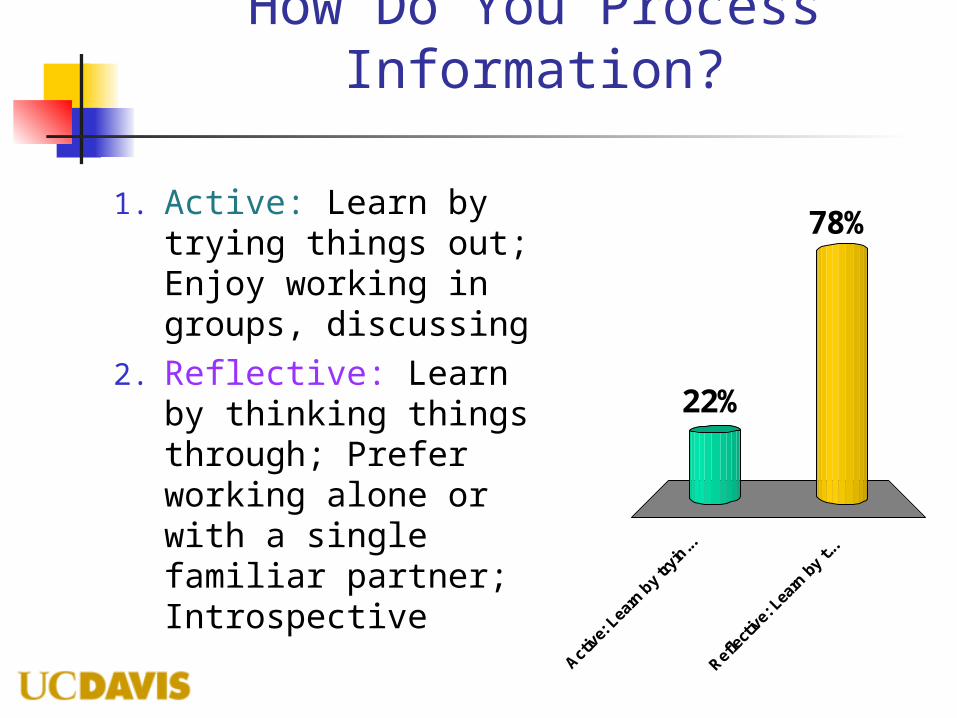
Active Learn by trying things out Enjoy working in groups, discussing
Reflective Learn by thinking things through Prefer working alone or with a single
familiar partner Introspective
How Do You Process Information?
Act
ive:
Lea
rn b
y try
in...
Ref
lect
ive:
Lea
rn b
y t..
.
78%
22%
1. Active: Learn by trying things out; Enjoy working in groups, discussing
2. Reflective: Learn by thinking things through; Prefer working alone or with a single familiar partner; Introspective
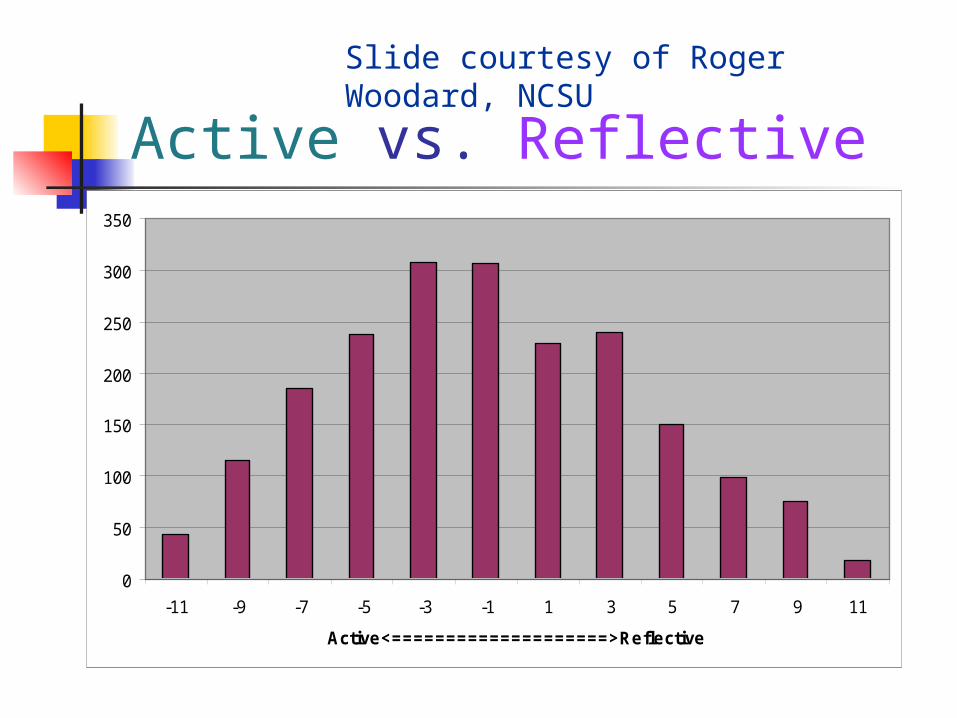
Active vs. Reflective
0
50
100
150
200
250
300
350
-11 -9 -7 -5 -3 -1 1 3 5 7 9 11
Active<====================>Reflective
Slide courtesy of Roger Woodard, NCSU
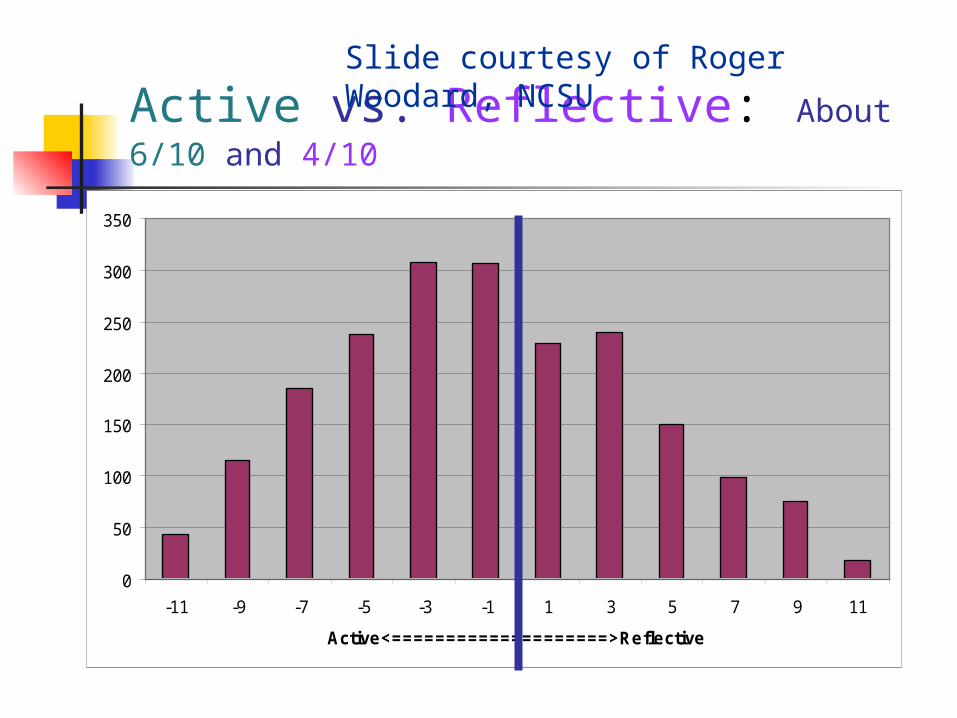
Active vs. Reflective: About 6/10 and 4/10
0
50
100
150
200
250
300
350
-11 -9 -7 -5 -3 -1 1 3 5 7 9 11
Active<====================>Reflective
Slide courtesy of Roger Woodard, NCSU

Gaining Understanding
Sequential Linear thinking process Learn or “get it” in small incremental steps Comfortable with partial information
Global Holisitic thinking process Learn or “get it” in large leaps Uncomfortable until they fully understand
and see the big picture

How Do You Gain Understanding?
Seq
uentia
l: Lin
ear t
h...
Glo
bal: H
olisiti
c th
inki
..
47%
53%1. Sequential: Linear thinking process; Learn or “get it” in small incremental steps; Comfortable with partial information
2. Global: Holisitic thinking process; Learn or “get it” in large leaps; Uncomfortable until you fully understand and see the big picture
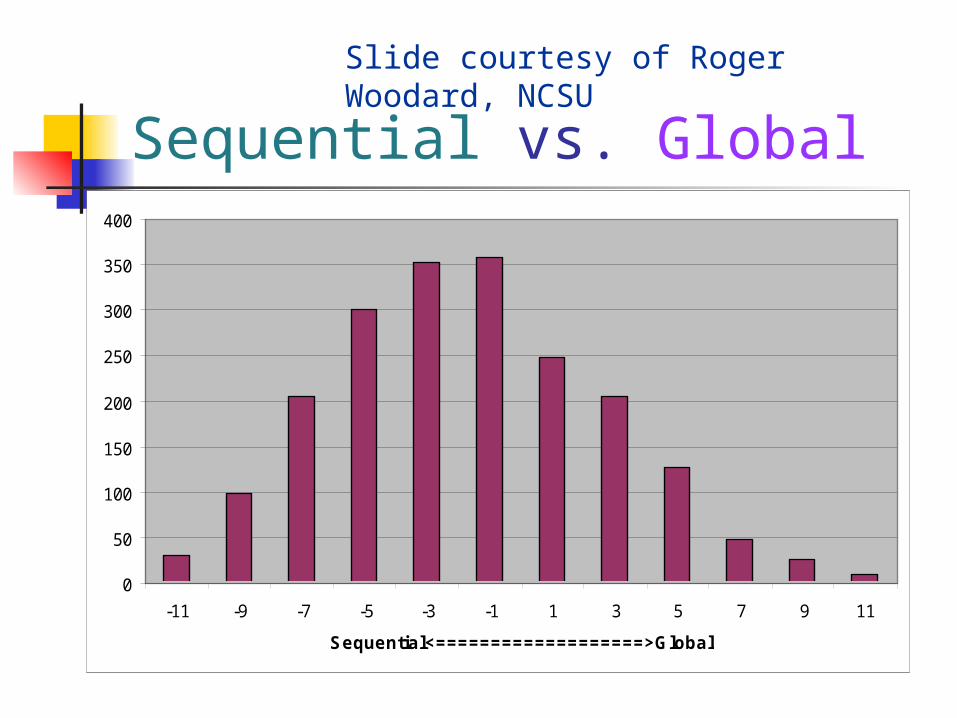
Sequential vs. Global
0
50
100
150
200
250
300
350
400
-11 -9 -7 -5 -3 -1 1 3 5 7 9 11
Sequential<===================>Global
Slide courtesy of Roger Woodard, NCSU
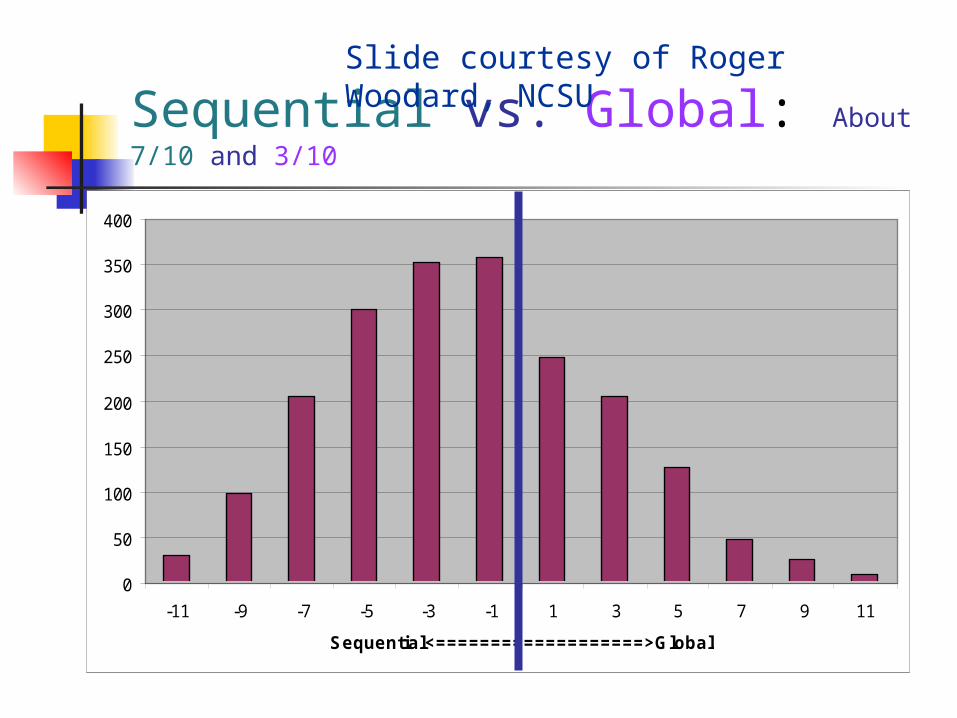
Sequential vs. Global: About 7/10 and 3/10
0
50
100
150
200
250
300
350
400
-11 -9 -7 -5 -3 -1 1 3 5 7 9 11
Sequential<===================>Global
Slide courtesy of Roger Woodard, NCSU
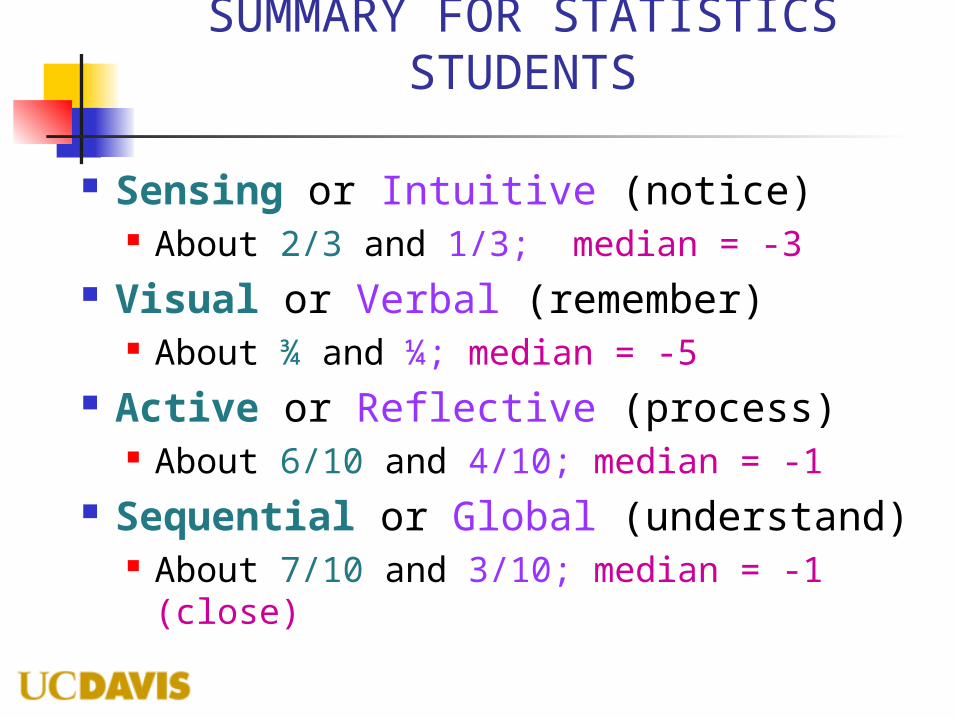
SUMMARY FOR STATISTICS STUDENTS
Sensing or Intuitive (notice) About 2/3 and 1/3; median = -3
Visual or Verbal (remember) About ¾ and ¼; median = -5
Active or Reflective (process) About 6/10 and 4/10; median = -1
Sequential or Global (understand) About 7/10 and 3/10; median = -1 (close)
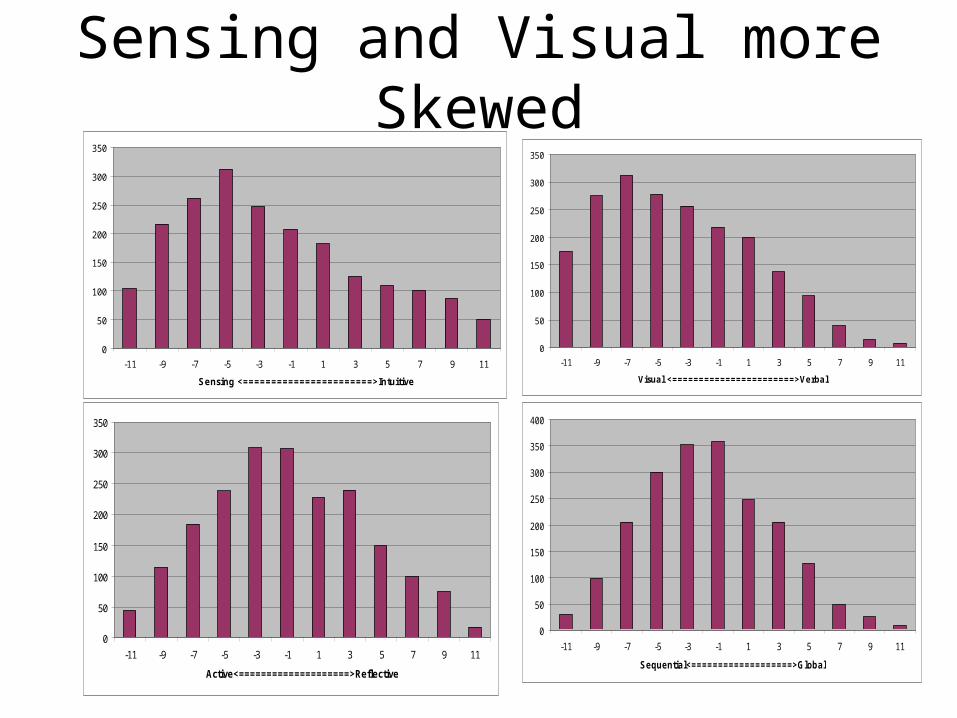
Sensing and Visual more Skewed
0
50
100
150
200
250
300
350
-11 -9 -7 -5 -3 -1 1 3 5 7 9 11
Sensing <=======================>Intuitive
0
50
100
150
200
250
300
350
-11 -9 -7 -5 -3 -1 1 3 5 7 9 11
Visual <=======================>Verbal
0
50
100
150
200
250
300
350
-11 -9 -7 -5 -3 -1 1 3 5 7 9 11
Active<====================>Reflective
0
50
100
150
200
250
300
350
400
-11 -9 -7 -5 -3 -1 1 3 5 7 9 11
Sequential<===================>Global
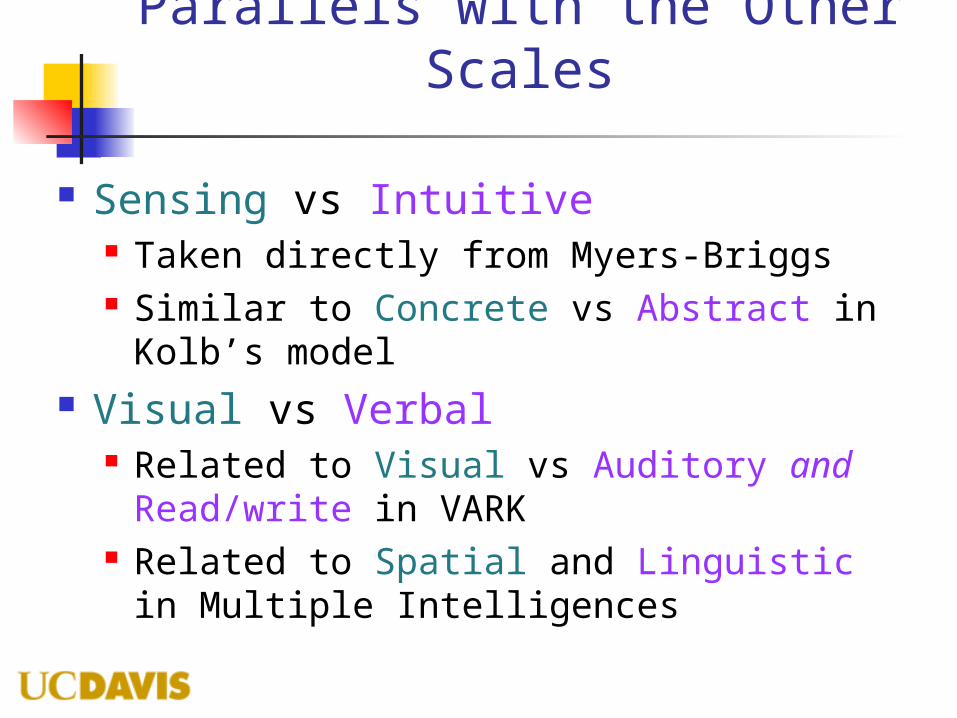
Parallels with the Other Scales
Sensing vs Intuitive Taken directly from Myers-Briggs Similar to Concrete vs Abstract in Kolb’s
model Visual vs Verbal
Related to Visual vs Auditory and Read/write in VARK
Related to Spatial and Linguistic in Multiple Intelligences
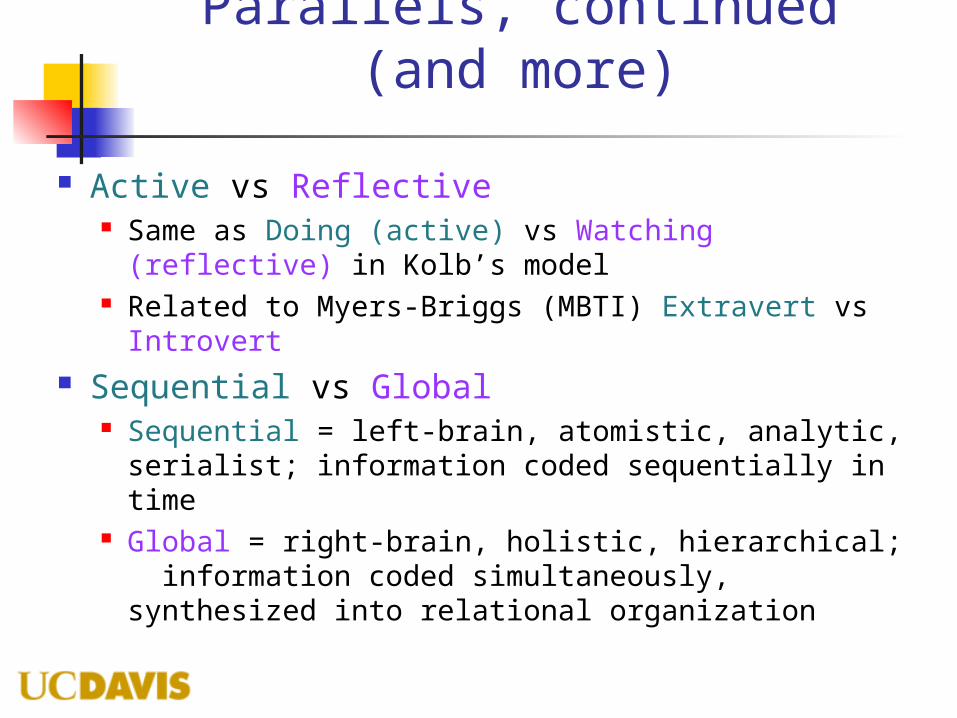
Parallels, continued (and more)
Active vs Reflective Same as Doing (active) vs Watching (reflective)
in Kolb’s model Related to Myers-Briggs (MBTI) Extravert vs
Introvert Sequential vs Global
Sequential = left-brain, atomistic, analytic, serialist; information coded sequentially in time
Global = right-brain, holistic, hierarchical; information coded simultaneously, synthesized into relational organization

Results for New TAs in My DeptAll but Visual/Verbal were 50/50

Faculty Results AND Teaching Aspect from Felder & Spurlin
Sensing/Intuitive (Concrete/abstract content) About 4/10 and 6/10
Visual/Verbal (Visual/verbal presentation) About 94% and 6%
Active/Reflective (Act./passive student participation) About 45% and 55%
Sequential/Global (Atomistic/holistic perspective) About 55% and 45%
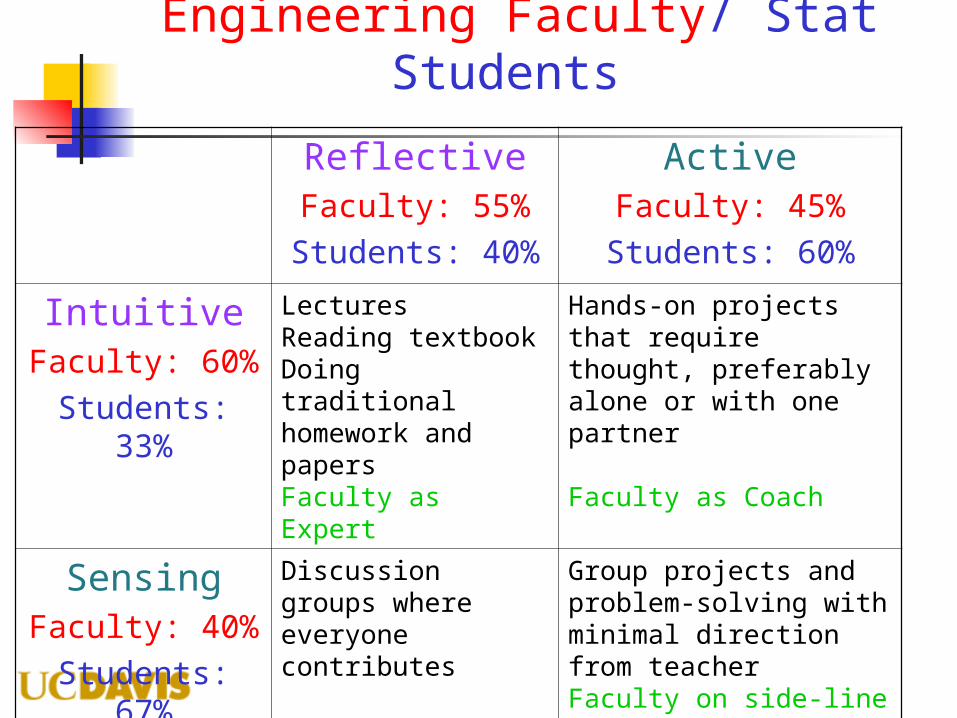
Engineering Faculty/ Stat Students
ReflectiveFaculty: 55%
Students: 40%
ActiveFaculty: 45%
Students: 60%
IntuitiveFaculty: 60%
Students: 33%
LecturesReading textbookDoing traditional homework and papersFaculty as Expert
Hands-on projects that require thought, preferably alone or with one partner
Faculty as Coach
SensingFaculty: 40%
Students: 67%
Discussion groups where everyone contributes
Faculty as Motivator
Group projects and problem-solving with minimal direction from teacherFaculty on side-line
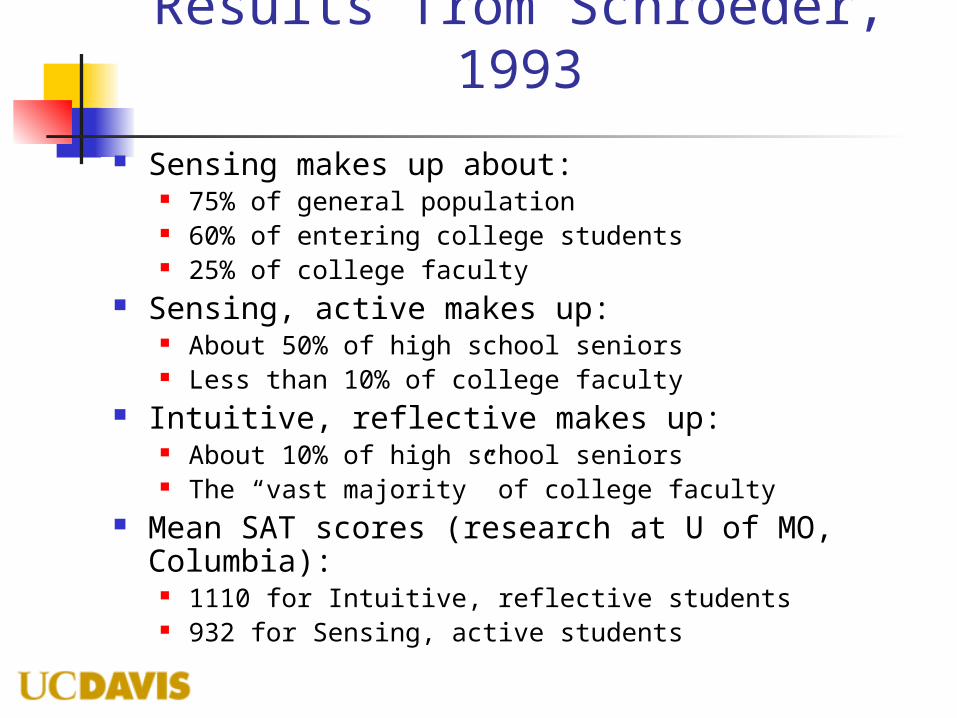
Results from Schroeder, 1993
Sensing makes up about: 75% of general population 60% of entering college students 25% of college faculty
Sensing, active makes up: About 50% of high school seniors Less than 10% of college faculty
Intuitive, reflective makes up: About 10% of high school seniors The “vast majority” of college faculty
Mean SAT scores (research at U of MO, Columbia):
1110 for Intuitive, reflective students 932 for Sensing, active students
CONCLUSIONS
Faculty are more Intuitive, Reflective Students are more Sensing, Active Intuitive, reflective people prefer
traditional teaching methods, concepts and ideas.
Sensing, active people prefer direct, concrete experience, with practical, physical, immediate application.
The people in this room are the pioneers, leading the way to a middle ground.
Top Related