


Languages
Pages
Legal

WP.246
SECTORAL ACTIVITIES PROGRAMME
Working Paper
Recent issues regarding collective bargaining and
conditions of work in the chemical industry
Yasuhiko Kamakura*
Working papers are preliminary documents circulated to stimulate discussion and obtain comments
* Yasuhiko Kamakura is a Technical Specialist of Sectoral Activities Branch (SECTOR), Social Dialogue, Labour Law, Labour Administration and Social Activities Department,
Social Dialogue Sector, International Labour Office (ILO).
International Labour Office Geneva
2006

Copyright © International Labour Organization 2007 Publications of the International Labour Office enjoy copyright under Protocol 2 of the Universal Copyright Convention. Nevertheless, short excerpts from them may be reproduced without authorization, on condition that the source is indicated. For rights of reproduction or translation, application should be made to ILO Publications (Rights and Permissions), International Labour Office, CH-1211 Geneva 22, Switzerland. The International Labour Office welcomes such applications. Libraries, institutions and other users registered in the United Kingdom with the Copyright Licensing Agency, 90 Tottenham Court Road, London W1T 4LP [Fax: (+44) (0)20 7631 5500; email: [email protected]], in the United States with the Copyright Clearance Center, 222 Rosewood Drive, Danvers, MA 01923 [Fax: (+1) (978) 750 4470; email: [email protected]] or in other countries with associated Reproduction Rights Organizations, may make photocopies in accordance with the licences issued to them for this purpose.
ISBN: 119217-2/978-92-2-119575-7 (print) 119218-0/978-92-2-119576-4 (web pdf)
First edition 2006
The designations employed in ILO publications, which are in conformity with United Nations practice, and the presentation of material therein do not imply the expression of any opinion whatsoever on the part of the International Labour Office concerning the legal status of any country, area or territory or of its authorities, or concerning the delimitation of its frontiers. The responsibility for opinions expressed in signed articles, studies and other contributions rests solely with their authors, and publication does not constitute an endorsement by the International Labour Office of the opinions expressed in them. Reference to names of firms and commercial products and processes does not imply their endorsement by the International Labour Office, and any failure to mention a particular firm, commercial product or process is not a sign of disapproval. ILO publications can be obtained through major booksellers or ILO local offices in many countries, or direct from ILO Publications, International Labour Office, CH-1211 Geneva 22, Switzerland. Catalogues or lists of new publications are available free of charge from the above address, or by email: [email protected]. Visit our web site: www.ilo.org/publns.
Printed by the International Labour Office, Geneva, Switzerland

WP-246-External-En.doc iii
Preface The chemical industry is a crucial component of modern society. As one of the largest industries in the world, it is of strategic importance to the sustainable development of national economies. As societies and economies grow, so does the chemical industry. It currently employs an estimated 14 million workers worldwide and accounts for about 10 per cent of national GDP in developed countries. World trade in chemicals reached a record US$700 billion in 2004, and the industry is still growing. The chemical industry helps to improve standards of living worldwide; among its more than 70,000 products one finds many of the essentials that societies cannot do without. The chemical industry belongs to the category of highly capitalized industries. Much of the manual work has been replaced by automation, but significant parts of the operation still rely on human input. Sound employer-employee relations are therefore crucial to stable production and play a pivotal role in maintaining productivity. The aim of this paper is thus to explore some good practices in industrial relations and collective bargaining in the chemical industry. The study outlines essential elements for good industrial relations in the industry, including the ways in which collective bargaining can contribute to healthy employer-employee relations. The ILO hopes that this paper will provide an opportunity to consider how industrial relations can be improved in the interests of both decent work and greater productivity. Elizabeth Tinoco Chief, Sectoral Activities Branch (SECTOR) Social Dialogue, Labour Law, Labour Administration and Social Activities Department Social Dialogue Sector International Labour Office (ILO)

WP-246-External-En.doc iv
Contents Page
Preface ...................................................................................................................... iii
Introduction.............................................................................................................. 1
1. Challenges facing the chemical industry ..................................................... 3
1.1. Increased competitiveness ................................................................ 3 1.2. Growing uncertainty and lower returns ............................................ 3 1.3. Prices of feedstock............................................................................ 5
2. Characteristics of negotiations in the chemical industry ............................. 7
2.1. Overview .......................................................................................... 7 2.2. Benefits of sectoral bargaining ......................................................... 10
2.2.1. Benefits for employers........................................................... 10 2.2.2. Benefits for employees .......................................................... 10
2.3. Company-level negotiation............................................................... 11 2.4. Decentralization of sectoral bargaining............................................ 14 2.5. Changes in the coverage of sectoral collective agreements ............. 17 2.6. Collective bargaining on working time in the chemical
industry and its impact on sectoral negotiations............................... 18 2.6.1. Negotiations on shortening the working week ...................... 18 2.6.2. Implications of negotiations on flexible working time.......... 19
2.7. Flexibility in sectoral bargaining ...................................................... 21 2.7.1. National policy advocating wage moderation
in the interest of competitiveness .......................................... 21 2.7.2. Opening clauses ..................................................................... 22
2.7.2.1. Overview................................................................ 22 2.7.2.2. Variable pay provisions ......................................... 24
3. Implications of laws for collective agreements ........................................... 27
3.1. Legislation on collective bargaining decentralization ...................... 27 3.2. Company-based negotiation and competitiveness............................ 32 3.3. The role of collective agreements in times of
changing legal frameworks............................................................... 33
4. Trade union density and collective bargaining ............................................ 35
4.1. Overall trends in trade union density................................................ 35 4.2. Trends in trade union membership in the chemical industry............ 38
4.2.1. Overview ............................................................................... 38 4.2.2. A cause of the decline in trade union density ........................ 41
4.3. Trade union density and collective bargaining ................................. 42
5. Industrial disputes ........................................................................................ 44
WP-246-External-En.doc v
6. Teamworking ............................................................................................... 46
6.1. General considerations...................................................................... 46 6.2. Quality Circles activities................................................................... 47 6.3. Outcomes of teamworking................................................................ 49
7. Wage system ................................................................................................ 52
7.1. Pay system for salaried employees in the Finnish chemical industry................................................................ 52
7.2. Changes made to the pay system ...................................................... 54 7.2.1. Pay grading system – a case study at a
UK chemical company .......................................................... 54 7.2.2. Departure from qualification-based seniority pay
system towards a job grading pay system ............................. 59 7.3. Performance appraisal....................................................................... 70 7.4. Salary system for managerial employees.......................................... 80
8. Remuneration............................................................................................... 87
8.1. Pay level in general........................................................................... 87 8.2. Salaries for chemists ......................................................................... 89 8.3. Wage differences by gender ............................................................. 89 8.4. Harmonization of wages in the German chemical industry.............. 91 8.5. Measures aimed at redressing inequalities........................................ 92
8.5.1. Family-friendly policies ........................................................ 92 8.5.2. Training as an instrument for promoting opportunities......... 94
8.5.2.1. Time account ......................................................... 94 8.5.2.2. Training in restructuring ........................................ 95
9. Cross-continent organizing campaigns by chemical trade unions.............. 96
9.1. The ICEM’s campaigns for chemical multinationals ....................... 96 9.2. Transnational bargaining – An EU approach ................................... 99
10. Conclusion ................................................................................................... 102
11. Bibliography ................................................................................................ 109
Sectoral working papers .......................................................................................... 126
Appendices 1. Evolution of overall employment and female employment in
the industrial chemicals sector, selected countries, 1990-2002................... 112 2. Evolution of real wages per employee in industrial chemical
sector in US$ and national currency, selected countries, non-adjusted, 1990-2002 ............................................................................. 119

WP-246-External-En.doc vi
List of tables Table 1. Value of production in basic chemicals and the number of
establishments, selected countries, 1995 and 2000................................ 3 Table 2. Levels of collective wage bargaining and bargaining coverage,
selected uropean countries, 2003 .......................................................... 8 Table 3. Number of workers covered by sectoral agreements,
Germany, 2000....................................................................................... 10 Table 4. Minimum annual pay rates in the Spanish
chemical industry, 2004 ......................................................................... 11 Table 5. Pay settlements in the Swiss chemical industry, 1998-2004 ................. 13 Table 6. Sectoral collective bargaining coverage of companies by sector, ........
Germany, 1995, 1997 and 2000............................................................. 15 Table 7. Sectoral collective bargaining coverage of employees by sector,
Germany, 1995, 1997 and 2000............................................................. 16 Table 8. Sectoral collective bargaining coverage of companies,
by company size, Germany, 1997 and 2000 .......................................... 16 Table 9. Workplaces covered by collective agreements, wage difference
and wage gap by sector and firm size, Hungary, 1998 .......................... 17 Table 10. Estimated average annual earnings by sector, Norway, 2002-05 .......... 22 Table 11. A selection of agreed deviations from collectively agreed sectoral
provisions, Germany, 1997 .................................................................... 25 Table 12. Productivity in the United States chemical industry, 1997-2005........... 33 Table 13. Union density in selected countries, adjusted data, 1970-2003 ............. 36 Table 14. Evolution of trade union membership in Austria,
by sector, 1970-96.................................................................................. 39 Table 15. Evolution of trade union membership by central and
sectoral organization, Norway, 2002-05 ................................................ 40 Table 16. Shift in the membership composition of the major trade union
confederations in Spain, 1985 and 1997 ................................................ 41 Table 17. Collective industrial disputes in Switzerland, by sector
and issue,1990-99 .................................................................................. 44 Table 18. Job requirement and contractual monthly salary for salaried
employees in the Finnish chemical industry .......................................... 53 Table 19. Seniority bonus for salaried employees in the Finnish
chemical industry, 2006-07.................................................................... 54 Table 20. Examples of job titles and entry requirements in the new integrated
grading structure at a UK chemical company, 1993.............................. 56 Table 21. Pre-existing and revised salary ranges for the new
grading system at a UK chemical company, 1993................................. 58 Table 22. Organization of job groups at Kissei Pharmaceutical Co., Ltd.............. 66 Table 23. Comparison between the competency system (new) and
the job function and qualification system (old) ..................................... 71 Table 24. Overview of personnel evaluation at Toagosei Co., Ltd........................ 75 Table 25. Questions to be asked when conducting a resulted-oriented
evaluation at Toagosei Co., Ltd. ............................................................ 75

WP-246-External-En.doc vii
Table 26. Average monthly wages among unionized production workers in the chemical industry, selected countries, 2000 ................................ 87
Table 27. Average total monthly earnings by sex and by industry in Norway, 2004-05 ............................................................................... 90
Table 28. Pay harmonization between eastern and western Germany as at 31 December 1997......................................................................... 91
Table 29. Transnational agreements and other joint texts signed by multinational chemical companies in the EU, 2006 .............................. 100
List of figures
Figure 1. Average operating cash flow (OCF) margins for Dow Chemical, DuPont, ICI and BASF, 1961-95........................................................... 4
Figure 2. United States petrochemical industry return on replacement capital (pre-tax), 1982-2003................................................................... 5
Figure 3. Crude oil prices: all countries spot price FOB weighted by Estimated Export Volume, 1978-2006 .................................................. 5
Figure 4. United States Natural Gas Wellhead Price, 1976-2006 ......................... 6 Figure 5. Evolution of global employment in the industrial
chemicals sector, 1995-99...................................................................... 38 Figure 6. Collective bargaining coverage and trade union density,
selected countries, 2000 ......................................................................... 42 Figure 7. Organization rate of employers in EU-15 and EU
accession countries, 2000....................................................................... 43 Figure 8. Relative rates of pay in a UK chemical plant under the
old grading system, 1991 ....................................................................... 55 Figure 9. The three Ps concept in creating Kao Corporation’s
new wage system ................................................................................... 60 Figure 10. How Kao Corporation changed its grading system ............................... 61 Figure 11. Pay structure by job function at Kao Corporation ................................. 62 Figure 12. Simulation of a possible pay increase by job function at
Kao Corporation in the new grading system.......................................... 63 Figure 13. Remuneration structure in accordance with job function
and performance at Kao Corporation..................................................... 64 Figure 14. Level of discretion and time given to employees to perform
a given task, Kisei Pharmaceutical Co. Ltd. .......................................... 67 Figure 15. Job rankings of managerial employees at
Kissei Pharmaceutical Co. Ltd............................................................... 69 Figure 16. The 27 factors of competency at Unicharm Corporation....................... 73 Figure 17. Flow chart of personnel evaluations at Toagosei Co., Ltd..................... 78 Figure 18. Simplification of managers’ job ranks at
Asahi Kasei Corporation........................................................................ 84 Figure 19. Salary and bonus system for managers at
Asahi Kasei Corporation........................................................................ 85
WP-246-External-En.doc viii
Figure 20. Wage disparity among unionized production workers in the chemical industries, 2000............................................................. 88
Figure 21. Median salary for chemists with years lapse since degree earned, United States .......................................................................................... 89
List of boxes Box 1. Summary of the 2004 legislation on the reform of collective
bargaining in France .............................................................................. 30 Box 2. Framework agreement on teamworking in Germany ............................ 46 Box 3. The ICEM’s multinational corporate network in the
chemical industry ................................................................................... 96
WP-246-External-En.doc 1
Introduction This paper was produced as part of follow-up activities to the Tripartite Meeting on Best Practices in Work-Flexibility Schemes and their Impact on the Quality of Working Life in the Chemical Industries, held in Geneva, Switzerland in 2003.1 The meeting was part of the Sectoral Activities Programme at the ILO. (Further information on the meeting and other activities of the Sectoral Activities Programme is available at www.ilo.org/sector.) The aim of the paper is to stimulate discussion between member States and social partners of the ILO as well as other stakeholders on what constitutes good industrial relations in the chemical industry that meet all stakeholders’ interests. It examines collective bargaining and conditions of work in the industry and investigates some possible elements of best practices as regards the industrial relations system within it. Many sources of data and information used for this paper rely heavily on public information. Data and information cited in this paper are not necessarily the most recent available, although an attempt has been made to provide information that is as current as possible. They are above all intended to highlight the main trends and important events that have marked the recent past of industrial relations in the chemical industry. The context and outline of the paper are as follows: Chapter 1 discusses some important challenges confronting the chemical industry. Being a cyclic business, the chemical industry is affected by external economic behaviours and their evolution because many chemical products are used for durable goods. Economic turndowns directly hit the industry’s growth. This chapter addresses some economic factors underlying the growing uncertainty in the chemical industry. Chapter 2 focuses on some recent phenomena regarding negotiations and collective bargaining. It outlines sectoral and company/plant level negotiations common in the chemical industry before discussing the benefits of sectoral negotiations for the management and employees. It looks at sectoral negotiations, which have been dominant in the European chemical industry, and their increasing flexibility in recent years. Chapter 3 investigates how changes in the legal framework have affected collective bargaining. It addresses two important issues: first, the centralizing or decentralizing effect of laws in relation to collective bargaining and, second, how laws concerning collective bargaining could contribute to improving productivity. Chapter 4 examines whether there is a direct linkage between the level of unionization and collective bargaining.
1 ILO Report for discussion at the Tripartite Meeting on Best Practices in Work-Flexibility Schemes and their Impact on the Quality of Working Life in the Chemical Industries, Geneva, 2003, TMWFCI/2003 and the Note on the Proceedings, TMWFCI/2003/11.
WP-246-External-En.doc 2
Chapter 5 considers how collective agreements can contribute to maintaining industrial peace in the chemical industry. Chapter 6 examines the implementation of teamworking in the chemical industry and some impacts of Quality Circle activities. It also discusses what roles collective agreements could play in improving employees’ knowledge and skills. Chapter 7 considers some significant characteristics of pay systems in the chemical industry. It examines how teamworking or changes in work organization can affect pay systems in the chemical industry. These have been shifting from somewhat rigid schemes to more flexible ones, enhancing individual employees’ motivation while linking the pay system to financial results of the units or departments to which they belong, in order to increase productivity. Chapter 8 examines wage levels and pay disparities in the chemical industry as well as attempts to redress inequalities. In particular, it discusses how the chemical industry devises family-friendly policies as a means of addressing gender equality issues. Chapter 9 looks at how, in a globalized chemical industry, trade unions have developed their international ties to leverage their power in collective bargaining conducted at the national level. Chapter 10, the conclusion, gives a summary of earlier chapters and puts forward some considerations of actions for promoting good industrial relations in the chemical industry. Some essential information for this study was provided by ILO social partners. The author wishes to express his thanks to the International Chemical Employers Labour Relations Committee (LRC) of the International Organisation of Employers (IOE), and the International Federation of Chemical, Energy, Mine and General Workers’ Unions (ICEM) for providing valuable material. Substantial background information and case studies used in this paper were provided by the ILO Library.
WP-246-External-En.doc 3
1. Challenges facing the chemical industry
1.1. Increased competitiveness
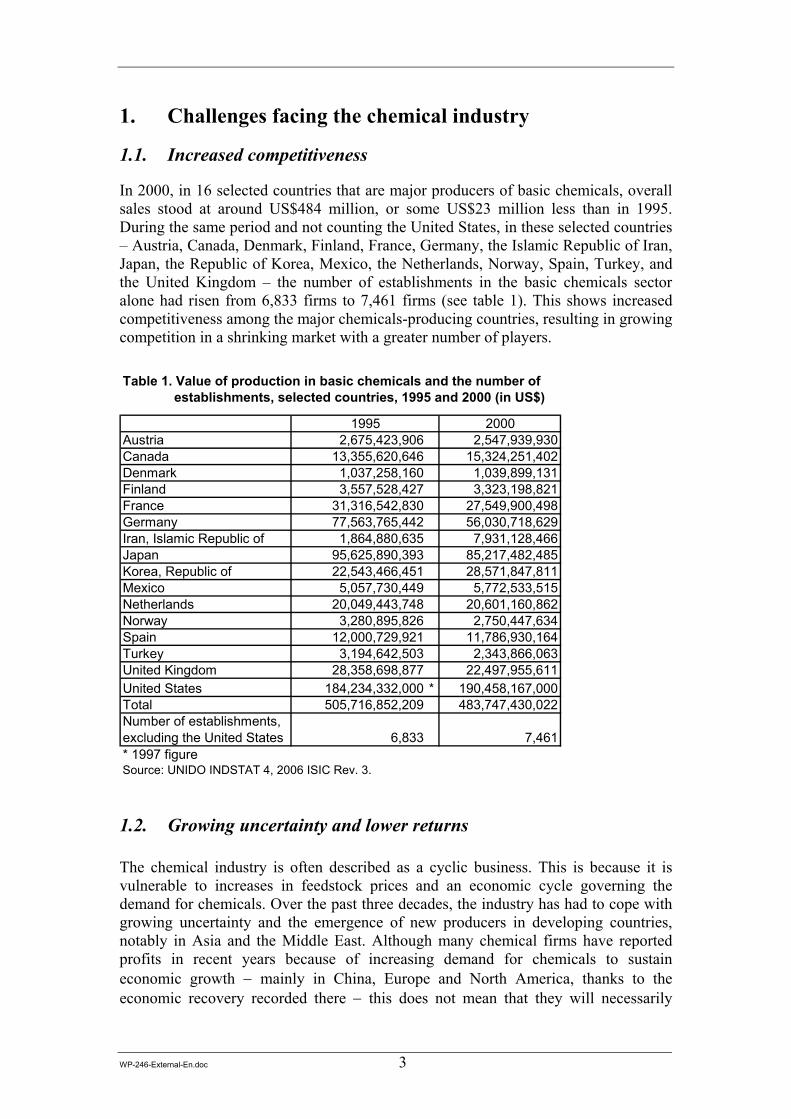
In 2000, in 16 selected countries that are major producers of basic chemicals, overall sales stood at around US$484 million, or some US$23 million less than in 1995. During the same period and not counting the United States, in these selected countries – Austria, Canada, Denmark, Finland, France, Germany, the Islamic Republic of Iran, Japan, the Republic of Korea, Mexico, the Netherlands, Norway, Spain, Turkey, and the United Kingdom – the number of establishments in the basic chemicals sector alone had risen from 6,833 firms to 7,461 firms (see table 1). This shows increased competitiveness among the major chemicals-producing countries, resulting in growing competition in a shrinking market with a greater number of players.
Table 1. Value of production in basic chemicals and the number of establishments, selected countries, 1995 and 2000 (in US$)
2000Austria 2,675,423,906 2,547,939,930Canada 13,355,620,646 15,324,251,402Denmark 1,037,258,160 1,039,899,131Finland 3,557,528,427 3,323,198,821France 31,316,542,830 27,549,900,498Germany 77,563,765,442 56,030,718,629Iran, Islamic Republic of 1,864,880,635 7,931,128,466Japan 95,625,890,393 85,217,482,485Korea, Republic of 22,543,466,451 28,571,847,811Mexico 5,057,730,449 5,772,533,515Netherlands 20,049,443,748 20,601,160,862Norway 3,280,895,826 2,750,447,634Spain 12,000,729,921 11,786,930,164Turkey 3,194,642,503 2,343,866,063United Kingdom 28,358,698,877 22,497,955,611United States 184,234,332,000 * 190,458,167,000Total 505,716,852,209 483,747,430,022Number of establishments,excluding the United States 6,833 7,461* 1997 figure
1995
Source: UNIDO INDSTAT 4, 2006 ISIC Rev. 3.
1.2. Growing uncertainty and lower returns The chemical industry is often described as a cyclic business. This is because it is vulnerable to increases in feedstock prices and an economic cycle governing the demand for chemicals. Over the past three decades, the industry has had to cope with growing uncertainty and the emergence of new producers in developing countries, notably in Asia and the Middle East. Although many chemical firms have reported profits in recent years because of increasing demand for chemicals to sustain economic growth − mainly in China, Europe and North America, thanks to the economic recovery recorded there − this does not mean that they will necessarily
WP-246-External-En.doc 4
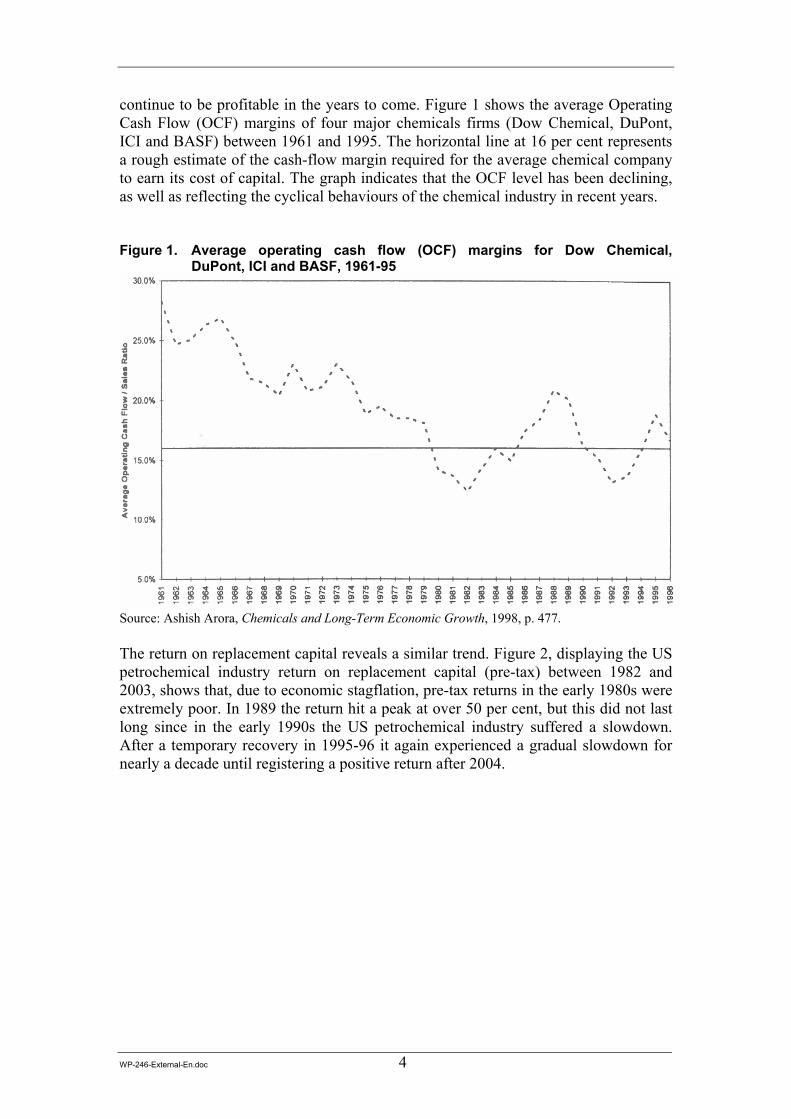
continue to be profitable in the years to come. Figure 1 shows the average Operating Cash Flow (OCF) margins of four major chemicals firms (Dow Chemical, DuPont, ICI and BASF) between 1961 and 1995. The horizontal line at 16 per cent represents a rough estimate of the cash-flow margin required for the average chemical company to earn its cost of capital. The graph indicates that the OCF level has been declining, as well as reflecting the cyclical behaviours of the chemical industry in recent years. Figure 1. Average operating cash flow (OCF) margins for Dow Chemical,
DuPont, ICI and BASF, 1961-95
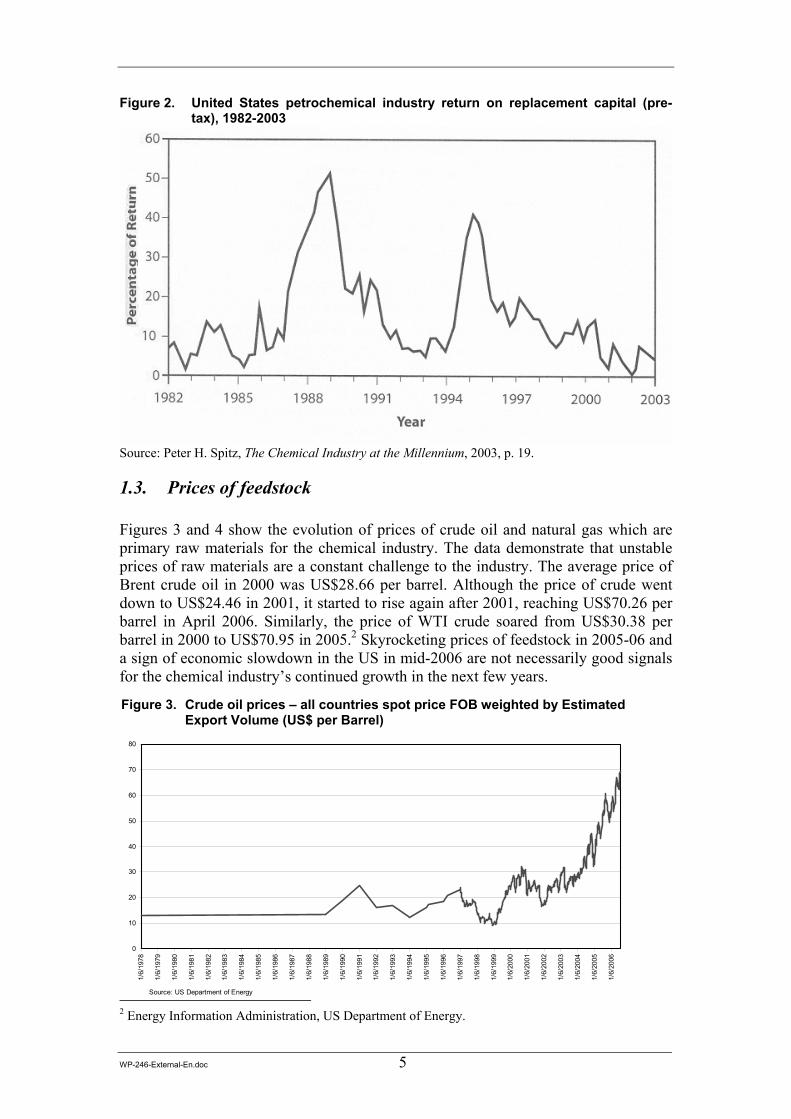
Source: Ashish Arora, Chemicals and Long-Term Economic Growth, 1998, p. 477. The return on replacement capital reveals a similar trend. Figure 2, displaying the US petrochemical industry return on replacement capital (pre-tax) between 1982 and 2003, shows that, due to economic stagflation, pre-tax returns in the early 1980s were extremely poor. In 1989 the return hit a peak at over 50 per cent, but this did not last long since in the early 1990s the US petrochemical industry suffered a slowdown. After a temporary recovery in 1995-96 it again experienced a gradual slowdown for nearly a decade until registering a positive return after 2004.
WP-246-External-En.doc 5
Figure 3 Crude oil prices - all countries spot price FOB weighted by Estimated Export Volume (US$ per Barrel)
0
10
20
30
40
50
60
70
80
1/6/
1978
1/6/
1979
1/6/
1980
1/6/
1981
1/6/
1982
1/6/
1983
1/6/
1984
1/6/
1985
1/6/
1986
1/6/
1987
1/6/
1988
1/6/
1989
1/6/
1990
1/6/
1991
1/6/
1992
1/6/
1993
1/6/
1994
1/6/
1995
1/6/
1996
1/6/
1997
1/6/
1998
1/6/
1999
1/6/
2000
1/6/
2001
1/6/
2002
1/6/
2003
1/6/
2004
1/6/
2005
1/6/
2006
Source: US Department of Energy
Figure 2. United States petrochemical industry return on replacement capital (pre-tax), 1982-2003
Source: Peter H. Spitz, The Chemical Industry at the Millennium, 2003, p. 19.
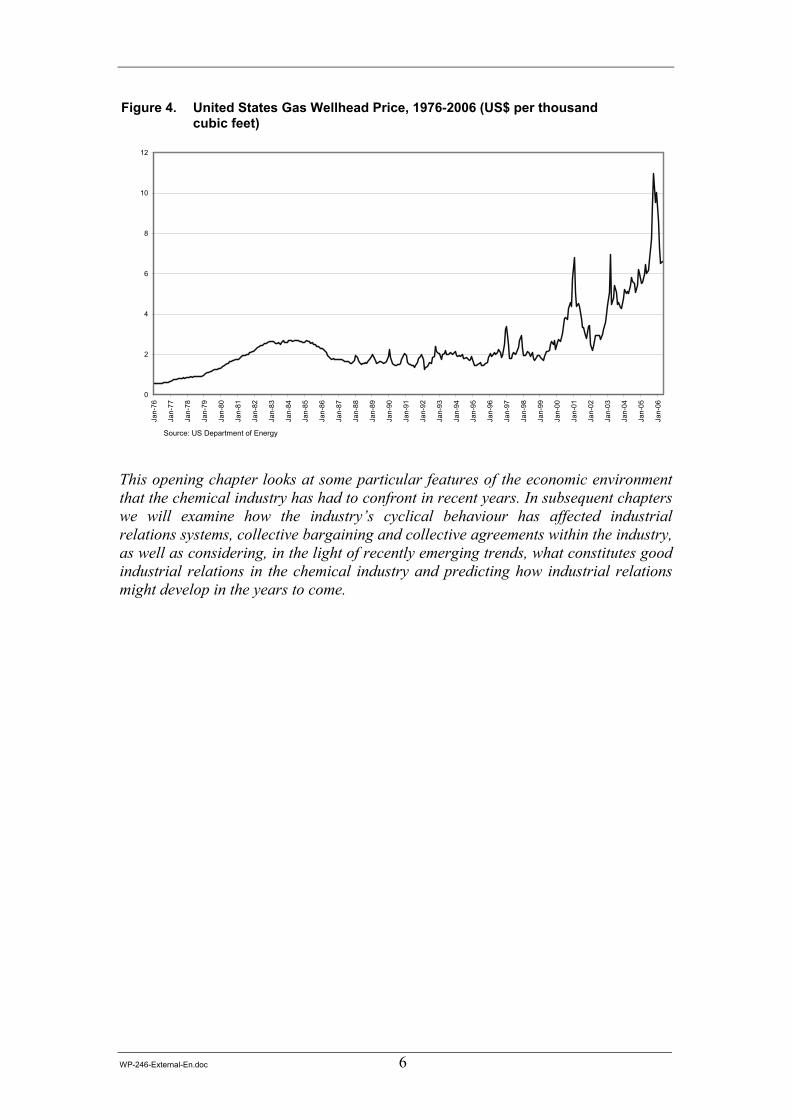
1.3. Prices of feedstock Figures 3 and 4 show the evolution of prices of crude oil and natural gas which are primary raw materials for the chemical industry. The data demonstrate that unstable prices of raw materials are a constant challenge to the industry. The average price of Brent crude oil in 2000 was US$28.66 per barrel. Although the price of crude went down to US$24.46 in 2001, it started to rise again after 2001, reaching US$70.26 per barrel in April 2006. Similarly, the price of WTI crude soared from US$30.38 per barrel in 2000 to US$70.95 in 2005.2 Skyrocketing prices of feedstock in 2005-06 and a sign of economic slowdown in the US in mid-2006 are not necessarily good signals for the chemical industry’s continued growth in the next few years.
2 Energy Information Administration, US Department of Energy.
Figure 3. Crude oil prices – all countries spot price FOB weighted by Estimated Export Volume (US$ per Barrel)
WP-246-External-En.doc 6
Figure 4. United States Natural Gas Wellhead Price, 1976-2006 (US$ per Thousand Cubic Feet)
0
2
4
6
8
10
12Ja
n-76
Jan-
77
Jan-
78
Jan-
79
Jan-
80
Jan-
81
Jan-
82
Jan-
83
Jan-
84
Jan-
85
Jan-
86
Jan-
87
Jan-
88
Jan-
89
Jan-
90
Jan-
91
Jan-
92
Jan-
93
Jan-
94
Jan-
95
Jan-
96
Jan-
97
Jan-
98
Jan-
99
Jan-
00
Jan-
01
Jan-
02
Jan-
03
Jan-
04
Jan-
05
Jan-
06
Source: US Department of Energy
This opening chapter looks at some particular features of the economic environment that the chemical industry has had to confront in recent years. In subsequent chapters we will examine how the industry’s cyclical behaviour has affected industrial relations systems, collective bargaining and collective agreements within the industry, as well as considering, in the light of recently emerging trends, what constitutes good industrial relations in the chemical industry and predicting how industrial relations might develop in the years to come.
Figure 4. United States Gas Wellhead Price, 1976-2006 (US$ per thousand cubic feet)

WP-246-External-En.doc 7
2. Characteristics of negotiations in the chemical industry
2.1. Overview
Table 2 provides an overview of various levels of bargaining in 26 selected European countries. Three groups of countries may be distinguished:
The first group consists of four countries (Belgium, Finland, Ireland and Slovenia) where the intersectoral level is the most important bargaining level for wage determination. In addition, there are five countries (Greece, Estonia, Hungary, Lithuania and Romania) where the national minimum wage is determined by bipartite or tripartite agreement at national level. Since in these countries sectoral and company level bargaining coverage is much lower, the intersectoral level may be deemed as the most important bargaining level; however, except for the national minimum wage, lower bargaining levels are of greater importance for wage determination.
The 11 countries making up the second group – Austria, Bulgaria, Denmark, Germany, Greece, Italy, the Netherlands, Norway, Slovakia, Spain and Sweden – have national bargaining systems in which sectoral bargaining is the most important level for wage determination.
The ten countries in the third group – Cyprus, Czech Republic, Estonia, Hungary, Latvia, Lithuania, Malta, Poland, Romania and the United Kingdom – have relatively decentralized bargaining systems in which company bargaining is dominant.
France does not fit into any of these groups since it has no bargaining level that is clearly more important than the rest. While for small and medium-sized companies in particular the sector level is the most important, for most larger companies it is the company level that is of crucial importance.3
3 “Changes in national collective bargaining systems since 1990”, the European Industrial Relations Observatory Online (EIRO), 2005.

WP-246-External-En.doc 8
Table 2. Levels of collective wage bargaining and bargaining coverage, selected European countries, 2003
Intersectoral level
Sectoral level
Company level
Belgium* XXX X X >90%Finland XXX X X +/-90%Ireland** XXX X X >44%Slovenia XXX X X <100%
Austria XXX X 98% - 99%Bulgaria X XXX X 25% - 30%Denmark*** X XXX X +/- 77%Germany**** XXX X +/- 70%Greece (XXX) XXX X 60% - 70%Italy XXX X +/- 90%Netherlands X XXX X +/- 80%Norway XX XXX X 70% - 77%Spain X XXX X +/- 80%Slovakia XXX X +/- 40%Sweden XXX X >90%
France X XX XX +/- 90%
Cyprus***** X XXX 27%Czech Republic X XXX 25% - 30%Estonia (XXX) X XXX 20% - 30%Hungary (XXX) X XXX +/- 40%Latvia X XXX 10% - 20%Lithuania (XXX) X XXX +/- 10%Malta****** X XXX +/- 50%Poland X XXX +/- 40%Romania******* (XXX) X XXX NDUnited Kingdom X XXX <40%
Importance of bargaining levels Collective bargaining coverage
Notes: X=existing level of wage bargaining; XX=important, but not dominant level of wage bargaining; XXX=dominant level of wage bargaining; (XXX)=bargaining on national minimum wage.
*Consultation on the minimum wage in the sense that the social partners will probably consult the government if they plan to modify the minimum wage. **There are no figures on Irish bargaining coverage available, but coverage must be above 44.5% (which is the union density rate) since all union members are automatically covered by national agreements, while many non-union employees de facto receive the nationally agreed pay increases. ***There is one main intersectoral agreement covering all manufacturing sections in Denmark; bargaining coverage refers to private sector only. ****Bargaining coverage refers to west Germany - in east Germany bargaining coverage is only about 54%. ***** Bargaining coverage refers to Cypriot private sector only. ******There is automatic annual adjustment of wages to price developments in Malta; different studies estimate the proportion of employees covered by collective agreements at between 40% and 60%. *******All employees in Romania are covered by the national agreement on minimum wages; no figures are available on the coverage of sectoral and company agree
Source: European Industrial Relations Observatory Online (EIRO); European Commission, Industrial Relations in Europe 2004.
Intersectoral bargaining dominant
Sectoral bargaining dominant
No bargaining level clearly dominant
Company bargaining dominant
WP-246-External-En.doc 9
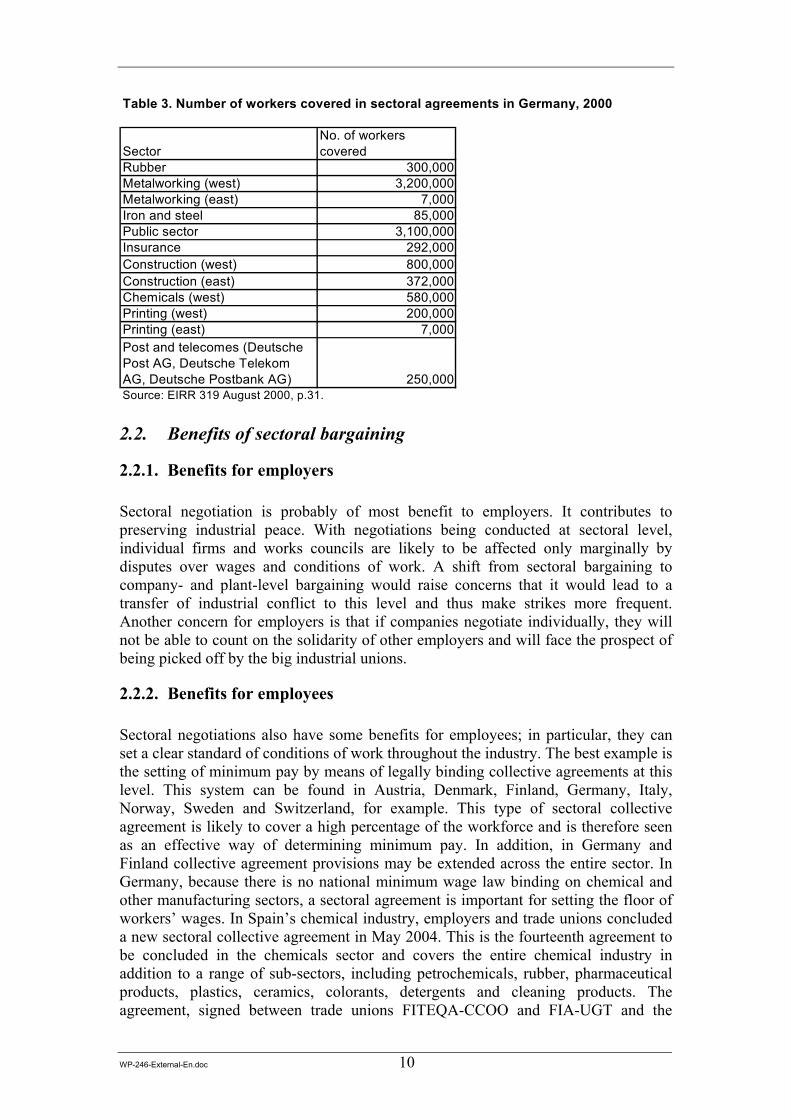
In some countries, in particular in Europe, centralized sectoral collective bargaining remains important in deciding chemical workers’ wages and conditions of work. Norway, for example, has a long history of centralized sectoral negotiations on pay. In Belgium, sectoral negotiations remain the cornerstone of collective bargaining in the chemical industry: social partners at national level negotiate an intersectoral agreement every two years to cover all companies and private sector employees, and once a national framework accord is formed, sectoral negotiations begin. More than 168 sectors hold negotiations, ranging from major national employers such as chemicals and petrochemical sectors to much smaller joint committees such as that for limestone quarrying in a specific geographical area of the country. In Germany, collective bargaining takes place primarily at sectoral level, with negotiations in the chemical industry conducted regionally. Sectoral bargaining is found in industries such as chemicals, engineering, and retail, though negotiations at this level are closely coordinated among the respective national organizations of trade unions and employers, so that regional variations are effectively minimal. Historically, in many countries the metal-making industry has been the pattern setter in sectoral negotiations. However, the chemical industry is becoming increasingly prominent and playing a more central role in such negotiations. In Germany, for example, where metalworking has been the leading sector in collective bargaining, in the 2000 bargaining round the social partners in the chemical industry succeeded in being the first major sector to conclude a new agreement. This is probably due to differences in the relationship atmosphere between the social partners in different industries. Trade union negotiators in the chemicals sector are generally seen by employers as being more moderate than their counterparts in the metalworking sector, even though in western Germany collective bargaining coverage is lower in the chemical industry than in the metalworking sector (see table 3). The Belgian chemical industry also often functions as a pattern setter in sectoral bargaining. For example, in 1999, the first collective agreements to be concluded were in the chemical and petrochemical industries. The national accord established a 5.9-per cent “wage margin” which represents the maximum level for pay growth during 1999 and 2000. The agreement in the chemicals sector covered some 50,000 blue-collar workers. The provisions of the agreement included, inter alia, increasing hourly pay by a total of BEF 6. Likewise, the collective agreement in the petrochemical sector covered about 2,000 blue-collar workers. Its provisions included increasing hourly pay by BEF 9 from 1 January 1999, and allowing employees to take early retirement from the age of 56 provided they have been working for 33 years, including 20 years of night work. Some companies could also offer early retirement from the age of 55 if the workers had been employed for 38 years, as well as establishing a pool of labour comprising workers who have been made redundant and who should be given priority when petrochemical companies are recruiting new workers. This was in response to the restructuring of the petrochemical industry in the late 1990s.4
4 “Deals in chemicals and petrochemicals”, EIRR 302, March 1999, pp. 3-4.
WP-246-External-En.doc 10
Table 3. Number of workers covered in sectoral agreements in Germany, 2000
SectorNo. of workers covered
Rubber 300,000Metalworking (west) 3,200,000Metalworking (east) 7,000Iron and steel 85,000Public sector 3,100,000Insurance 292,000Construction (west) 800,000Construction (east) 372,000Chemicals (west) 580,000Printing (west) 200,000Printing (east) 7,000Post and telecomes (Deutsche Post AG, Deutsche Telekom AG, Deutsche Postbank AG) 250,000Source: EIRR 319 August 2000, p.31.
2.2. Benefits of sectoral bargaining
2.2.1. Benefits for employers Sectoral negotiation is probably of most benefit to employers. It contributes to preserving industrial peace. With negotiations being conducted at sectoral level, individual firms and works councils are likely to be affected only marginally by disputes over wages and conditions of work. A shift from sectoral bargaining to company- and plant-level bargaining would raise concerns that it would lead to a transfer of industrial conflict to this level and thus make strikes more frequent. Another concern for employers is that if companies negotiate individually, they will not be able to count on the solidarity of other employers and will face the prospect of being picked off by the big industrial unions.
2.2.2. Benefits for employees Sectoral negotiations also have some benefits for employees; in particular, they can set a clear standard of conditions of work throughout the industry. The best example is the setting of minimum pay by means of legally binding collective agreements at this level. This system can be found in Austria, Denmark, Finland, Germany, Italy, Norway, Sweden and Switzerland, for example. This type of sectoral collective agreement is likely to cover a high percentage of the workforce and is therefore seen as an effective way of determining minimum pay. In addition, in Germany and Finland collective agreement provisions may be extended across the entire sector. In Germany, because there is no national minimum wage law binding on chemical and other manufacturing sectors, a sectoral agreement is important for setting the floor of workers’ wages. In Spain’s chemical industry, employers and trade unions concluded a new sectoral collective agreement in May 2004. This is the fourteenth agreement to be concluded in the chemicals sector and covers the entire chemical industry in addition to a range of sub-sectors, including petrochemicals, rubber, pharmaceutical products, plastics, ceramics, colorants, detergents and cleaning products. The agreement, signed between trade unions FITEQA-CCOO and FIA-UGT and the

WP-246-External-En.doc 11
employers’ organization FIEQUE, runs from 1 January 2004 to 31 December 2006. It covers around 180,000 workers in over 5,000 companies, and indirectly affects an additional 50,000 chemical workers outside the collective agreement. As shown in table 4, minimum annual pay rates in Spain’s chemical industry in 2004 ranged from €11,143.37 a year for grade 1 employees to €29,529.13 a year for those in grade 8. The minimum rate excludes seniority payments, shift bonuses, bonuses for working in dangerous jobs and/or with dangerous materials, other types of bonuses, and sales commissions and incentives. In 2005 and 2006, minimum rates were to increase by an amount in line with government inflation forecasts for the year in question, plus 0.5 per cent.5 Table 4. Minimum annual pay rates in the Spanish chemical industry, 2004
Grade Annual pay (in €)1 11,143.372 11,923.093 12,925.974 14,374.585 16,379.846 19,166.117 23,289.018 29,529.13
Source: EIRR 270, November 2004, p. 23.
2.3. Company-level negotiation In many countries, the negotiations take place at the company or plant level. The chemical industry in the Netherlands, for example, is dependent on company-level negotiations such as those that take place at Unilever, Shell Netherlands Beheer BV, and Akzo Nobel Netherland BV. The companies negotiate separately a rise in basic pay and compensations for cost-of-living increase and holiday bonuses which relate to a period of more than one year (niveaubasis), and an adjusted annualized figure relating to the total increase in one particular year (jaarbasis). For example, in 1998 they concluded collective agreements on a pay increase: Unilever’s agreed increase (niveaubasis) was 3.0 per cent and total annualized increase (jaarbasis) 3.2 per cent; Shell’s 2.7 per cent for each of the two types of increase; and Akzo Nobel’s 2.3 and 2.6 per cent, respectively.6 In Switzerland’s chemical industry, too, company negotiations are gaining in importance. The industry employs around 70,000 people and is one of the country’s most important sectors, accounting for the highest percentage of foreign trade, with a 34.3-per cent share of exports and a 22.1-per cent share of imports in 2002. In addition, the pharmaceutical sector’s contribution to the country’s GDP amounted to around CHF 14.4 billion or 4.2 per cent of the total CHF 350 billion in 2001. The sector employs about 30,000 people. Pay bargaining takes place annually and in the past has been split between two elements – a purchasing-power increase (Teuerungsausgleich) and a real-term pay rise (Reallöhnerhöhung). However, pay has increasingly been negotiated as a single issue, while automatic annual pay rises
5 “New agreement in chemicals”, EIRR 370, November 2004, pp. 22-24. 6 “Bargaining analysis reveals rising pay trend”, EIRR 298, November 1998, p. 21.
WP-246-External-En.doc 12
negotiated as part of a long-term deal are very rare. This stands in contrast to the situation prevailing in the1980s, when most collective agreements contained provisions for automatic annual pay increases. Pay bargaining is increasingly characterized by the inclusion of flexible performance-related arrangements. Companies are awarding pay settlements divided into two elements, namely general and individual increases. In the chemicals sector, pay bargaining takes place at company level; consequently, pay bargaining at sectoral level has been diminishing over time. Trade unions have been demanding that pay increases be awarded on a collective rather than an individual basis. The unions’ aim is to boost pay for those on low and middle incomes and break the growing differential with high earners that has resulted from individual pay increases. Over the past few years, pay awards have been split between collective and individual increases, trends which are apparent in the chemicals and engineering sectors. Decentralization of pay negotiations has resulted in a greater diversity of wage settlements in the chemical industry. In 1998, Roche awarded a 1.5-per cent total pay increase while Novartis and CSC split their total settlements, with Novartis awarding a 0.75-per cent pay rise and a 0.75-per cent bonus, and CSC agreeing to a 1-per cent pay rise and a 0.5-per cent bonus. At Clariant, workers received a 0.8-per cent pay increase and a bonus of CHF 600. Lonza divided its total 1.5-per cent pay award into three elements: a 1.3-per cent general pay increase and 0.2 per cent as individual pay increase and the shift premium.7 In 2002, many trade unions affiliated to the SGB (Swiss trade union confederation) demanded pay increases of 3 per cent, despite a deteriorating economic climate. Claims were generally made up of four main elements: automatic cost-of-living increases; real increases in pay of 1-2 per cent, depending on the company; a focus on general rather than individual increases; and a commitment to raising all monthly pay above a minimum net level of CHF 3,000. Overall, the trade unions were not successful in obtaining increases of that magnitude, nor were they entirely successful in getting employers to concede that cost-of-living increases should be automatic. They did not manage to stop the trend towards individual pay increases, either. In the chemicals sector, in 2002 the Trade Union for Construction and Industry (GBI) concluded an agreement with the Novartis group for the first time since 1997. Between 1997 and 2001, sectoral negotiations had failed and the company imposed individual pay increases. The agreement negotiated in 2002 provides for a 2.5-per cent increase in the wage bill for the six lowest grades, with a guaranteed increase of CHF 900 a year. For higher grades, an increase of 1.5 per cent of the wage bill was agreed, the annual holiday entitlement was increased by 1.6 days, and the accord was extended to technical personnel.8
7 “1998 collective bargaining round-up”, EIRR 310, November 1999, pp. 27-30. 8 “Collective bargaining in 2002”, EIRR 352, May 2003, pp. 27-30.

WP-246-External-En.doc 13
1998
1999
2000
2001
2002
2003
2004
Roch
e
1.5%
increa
se2.5
% ind
ividu
al inc
reas
es3%
indiv
idual
increa
se -
refus
ed by
GBI
trade
union
.3.2
5% in
dividu
al inc
rease
; mi
nimum
wag
e inc
rease
d by C
HF
60 pe
r mon
th (p
aid 14
times
a ye
ar).
2.5%
indivi
dual
increa
se2%
indiv
idual
increa
seGe
neral
incre
ases
of 2.
25%
Nova
rtis
0.75%
rise a
nd an
incre
ase o
f 0.7
5% in
bonu
s lev
els1.7
5% in
dividu
al inc
rease
s plus
bo
nus -
rejec
ted by
the u
nion.
2% in
dividu
al inc
rease
; 1.1%
inc
reas
e in b
onus
paym
ent -
refus
ed by
GBI
trade
union
.
3% in
dividu
al inc
rease
for
emplo
yees
on in
dividu
al co
ntrac
ts;
GBI u
nion r
ejecte
d the
3% of
fer fo
r em
ploye
es co
vered
by th
e co
llecti
ve ag
reeme
nt, de
mand
ing
5% to
inclu
de a
propo
rtion o
f ge
neral
incre
ase.
Increa
se of
2.5%
of th
e wag
e bill
for
the si
x low
est g
rades
, sub
ject to
a gu
aran
teed i
ncrea
se of
CHF
900 a
ye
ar; 1.
5% w
age b
ill inc
reas
e for
hig
her g
rades
, in ad
dition
to a
1%
bonu
s. An
nual
level
entitl
emen
t ex
tende
d by 1
.6 da
ys.
Pay n
egoti
ation
s fail
ed.
Emplo
yers
grante
d 1.3%
ind
ividu
al inc
rease
s; an
ad
dition
al 0.4
% fo
r wom
en;
and b
onus
es of
unsp
ecifie
d am
ounts
.
2/3%
pay i
ncrea
se, o
f whic
h 1.2%
wa
s gen
eral in
creas
es an
d 1.1%
ind
ividu
al inc
rease
s. CH
F 1,3
00 a
year
basic
incre
ase f
or all
em
ploye
es. A
nd, C
HF1,3
00 a
year
basic
incre
ase f
or all
emplo
yees
.
Nova
rtis N
yon
2% in
creas
e, of
which
at le
ast
CHF 5
00 w
as aw
arde
d to a
ll em
ploye
es, e
quiva
lent to
0.7
%; pl
us ad
dition
al ind
ividu
al inc
rease
s. Fa
mily
allow
ance
incre
ased
by C
HF
10 to
CHF
155.
Ciba
Spe
ciality
Ch
emica
ls
1.5%
incre
ase i
n the
wag
e bill
with
a gua
rantee
d inc
reas
e of C
HF 70
0 a y
ear; 1
.5% bo
nus.
Pay n
egoti
ation
s fail
ed.
Emplo
yers
impo
sed 0
.7%
indivi
dual
increa
ses.
CSC
1% in
creas
e and
0.5%
incre
ase
in bo
nus l
evels
1.8%
indivi
dual
incre
ases
2.5%
indivi
dual
incre
ase,
plus
enha
nced
bonu
s.
Betrie
be B
L
Gene
ral in
creas
es of
betw
een
1.5%
and 1
.9% an
d bon
uses
of
betw
een C
HF 50
0 and
CHF
1,0
00.
CILA
GInd
ividu
al inc
rease
of 1.
5% an
d pu
rchas
ing po
wer in
creas
e of
2% ge
neral
incre
ase;
1.5%
indivi
dual
increa
se.
Clari
ant
0.8%
increa
se an
d a bo
nus o
f CH
F 600
Lonz
a1.5
% inc
rease
of w
hich 1
.3% is
ge
nera
l, 0.3%
is in
dividu
al an
d 0.1
% is
a shif
t prem
ium.
1.5%
increa
se an
d bon
uses
2.75%
gene
ral in
creas
e; 0.3
5% in
dividu
al inc
reas
e.
Table
5. P
ay se
ttlem
ents
in th
e Swi
ss ch
emica
l indu
stry,
1998
-2004
Sour
ce: E
IRR
Tabl
e 5.
Pa
y se
ttlem
ents
in th
e Sw
iss
chem
ical
indu
stry
, 199
8-20
04
WP-246-External-En.doc 14
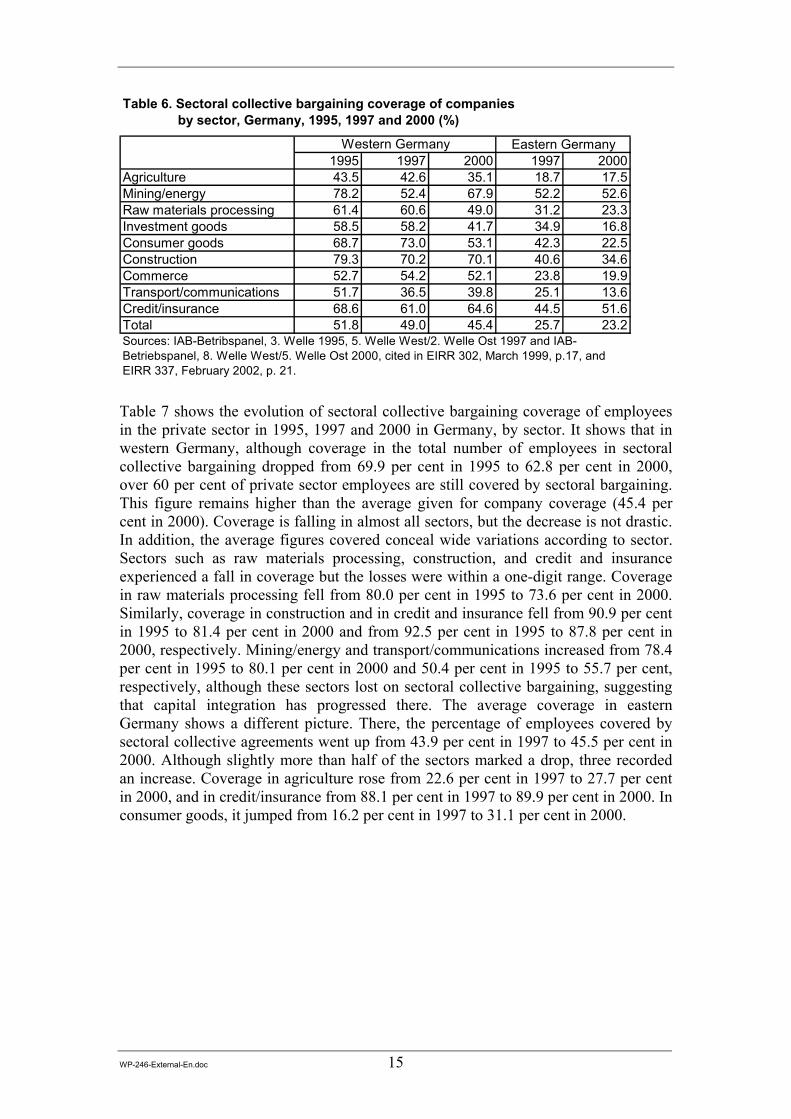
2.4. Decentralization of sectoral bargaining Studies indicate that in Germany company-level bargaining outside sectoral agreements is, generally speaking, on the rise. Tables 5, 6 and 7 were created on the basis of substantial research published by the labour market and employment research institute (IAB – Institut für Arbeitsmarkt- und Berufsforschung) of the German Ministry of Labour. Data for 1995 and 1997 were collected from some 3,400 companies in western Germany and 3,500 in eastern Germany. The companies operated in a wide variety of sectors across the economy, including the chemical industry, and were of varying sizes, ranging from firms employing between one and four employees to establishments with over 1,000 employees. The sample is representative of around 1.47 million companies in the west and 3,500 in the east, employing a total of 22 million people.9 For the 2000 sample, data were collected from almost 14,000 companies in western and eastern Germany (the breakdown is not given). The sample is representative of around 1.7 million companies in western Germany and 440,000 in eastern Germany, together accounting for over 34 million people.10 Tables exclude the data entry for company services, other service, not-for-profit organizations and regional administrative bodies/social security. Table 6 shows sectoral collective bargaining coverage of private sector companies, by sector, in 1995, 1997 and 2000. It can be seen that the number of private sector companies covered by a sectoral collective agreement in western Germany fell by 6.4 percentage points, from 51.8 per cent in 1995 to 49.0 per cent in 1997 and subsequently down to 45.4 per cent in 2000. This indicates that less than half of private companies are covered by sectoral bargaining provisions. Coverage in eastern Germany is also on the decline, down from 25.7 per cent in 1997 to 23.2 per cent. The table shows diverse coverage at the sectoral level; in 2000, in western Germany coverage ranged from 70.1 per cent in construction, 67.9 per cent in mining and energy, and 64.6 per cent in credit and insurance to 35.1 per cent in agriculture. Levels of coverage by sectoral agreement fell in all sectors between 1995 and 2000: in agriculture from 43.5 per cent in 1995 to 35.1 per cent in 2000; in investment goods from 58.5 to 41.7 per cent; in construction from 79.3 to 70.1 per cent; and in credit and insurance from 68.6 to 64.6 per cent. Coverage in transport/communications and in raw materials processing dropped dramatically: in the former sector from 51.7 per cent in 1995 to 39.8 per cent in 2000, while in raw material processing, including the chemical industry, it fell by 12.4 percentage points during the same period, down from 61.4 per cent in 1995 and 60.6 per cent in 1997 to 49.0 per cent in 2000. In eastern Germany coverage in most of the sectors fell, although the drop was not drastic. In raw materials processing, for example, it fell from 31.2 per cent in 1997 to 23.3 per cent in 2000. Meanwhile, coverage in mining and energy and in credit and insurance went up from 52.2 per cent in 1997 to 52.6 per cent in 2000 and from 44.5 per cent in 1997 to 51.6 per cent in 2000, respectively.
9 “Decline of sectoral bargaining coverage”, EIRR 302, March 1999, pp. 16-18. 10 “Further decline of sectoral bargaining coverage”, EIRR 337, February 2002, pp. 20-23.
WP-246-External-En.doc 15
Table 6. Sectoral collective bargaining coverage of companies by sector, Germany, 1995, 1997 and 2000 (%)
1995 1997 2000 1997 2000Agriculture 43.5 42.6 35.1 18.7 17.5Mining/energy 78.2 52.4 67.9 52.2 52.6Raw materials processing 61.4 60.6 49.0 31.2 23.3Investment goods 58.5 58.2 41.7 34.9 16.8Consumer goods 68.7 73.0 53.1 42.3 22.5Construction 79.3 70.2 70.1 40.6 34.6Commerce 52.7 54.2 52.1 23.8 19.9Transport/communications 51.7 36.5 39.8 25.1 13.6Credit/insurance 68.6 61.0 64.6 44.5 51.6Total 51.8 49.0 45.4 25.7 23.2
Western Germany Eastern Germany
Sources: IAB-Betribspanel, 3. Welle 1995, 5. Welle West/2. Welle Ost 1997 and IAB-Betriebspanel, 8. Welle West/5. Welle Ost 2000, cited in EIRR 302, March 1999, p.17, and EIRR 337, February 2002, p. 21. Table 7 shows the evolution of sectoral collective bargaining coverage of employees in the private sector in 1995, 1997 and 2000 in Germany, by sector. It shows that in western Germany, although coverage in the total number of employees in sectoral collective bargaining dropped from 69.9 per cent in 1995 to 62.8 per cent in 2000, over 60 per cent of private sector employees are still covered by sectoral bargaining. This figure remains higher than the average given for company coverage (45.4 per cent in 2000). Coverage is falling in almost all sectors, but the decrease is not drastic. In addition, the average figures covered conceal wide variations according to sector. Sectors such as raw materials processing, construction, and credit and insurance experienced a fall in coverage but the losses were within a one-digit range. Coverage in raw materials processing fell from 80.0 per cent in 1995 to 73.6 per cent in 2000. Similarly, coverage in construction and in credit and insurance fell from 90.9 per cent in 1995 to 81.4 per cent in 2000 and from 92.5 per cent in 1995 to 87.8 per cent in 2000, respectively. Mining/energy and transport/communications increased from 78.4 per cent in 1995 to 80.1 per cent in 2000 and 50.4 per cent in 1995 to 55.7 per cent, respectively, although these sectors lost on sectoral collective bargaining, suggesting that capital integration has progressed there. The average coverage in eastern Germany shows a different picture. There, the percentage of employees covered by sectoral collective agreements went up from 43.9 per cent in 1997 to 45.5 per cent in 2000. Although slightly more than half of the sectors marked a drop, three recorded an increase. Coverage in agriculture rose from 22.6 per cent in 1997 to 27.7 per cent in 2000, and in credit/insurance from 88.1 per cent in 1997 to 89.9 per cent in 2000. In consumer goods, it jumped from 16.2 per cent in 1997 to 31.1 per cent in 2000.

WP-246-External-En.doc 16
Table 7. Sectoral collective bargaining coverage of employees by sector, Germany, 1995, 1997 and 2000 (%)
1995 1997 2000 1997 2000Agriculture 62.1 57.3 43.4 22.6 27.7Mining/energy 78.4 71.4 80.1 84.6 79.8Raw materials processing 80.0 77.7 73.6 52.8 41.8Investment goods 81.7 77.4 65.7 43.2 35.1Consumer goods 79.0 77.2 64.4 16.2 31.1Construction 90.9 85.3 81.4 49.8 43.5Commerce 70.7 69.2 64.6 47.0 36.7Transport/communications 50.4 44.6 55.7 42.5 25.8Credit/insurance 92.5 83.8 87.8 88.1 89.9Total 69.9 65.3 62.8 43.9 45.5Sources: IAB-Betribspanel, 3. Welle 1995, 5. Welle West/2. Welle Ost 1997 and IAB-Betriebspanel, 8. Welle West/5. Welle Ost 2000, cited in EIRR 302, March 1999, p.17, and EIRR 337, February 2002, p. 22.
Western Germany Eastern Germany
Table 8 shows sectoral collective bargaining coverage of companies by company size (the number of employees) in the private sector in 1997 and 2000. In western Germany the percentage of small and medium-sized sized companies fell, while the rate of coverage in companies with over 1,000 employees went up from 75.8 per cent in 1997 to 81.2 per cent in 2000. In eastern Germany, in both small (20-49 and 50-99 employees) and medium-sized companies (100-199 and 200-499 employees) the percentages increased. These data suggest that the size of an establishment has a significant bearing on the likelihood of it belonging to sectoral employers’ organizations. Large companies are more likely to adhere to sectoral bargaining. Table 8. Sectoral collective bargaining coverage of companies, by company size, Germany, 1997 and 2000 (%)
1997 2000 1997 20001-4 35.7 35.1 18.9 15.55-9 56.5 49.4 26.5 24.210-19 57.5 54.1 32.5 33.020-49 59.9 59.7 40.3 44.050-99 70.3 56.9 42.3 48.1100-199 73.3 64.8 56.2 53.8200-499 72.8 68.9 54.3 56.6500-999 73.3 78.4 80.2 74.51,000 and over 75.8 81.2 77.7 77.0Total 49.0 45.4 25.7 23.2Source: IAB-Betribspanel, p. 3. Welle 1995, p. 5. Welle West/2. Welle Ost 1997 and IAB-Betriebspanel, p. 8. Welle West/5. Welle Ost 2000, cited in EIRR 302, March 1999, p. 18, and EIRR 337, February 2002, p. 22.
Western GermanyNo. of employees (at 30 June of each year)
Eastern Germany
Table 9 lists the workplaces covered by collective agreements by sector in Hungary in 1998, which shows that collective agreement coverage is likely to be high at companies with a large number of employees. Similar to the cases in Germany, such sectors as chemicals, mining, and transport and communication do not show high percentages of such coverage, the rates being 72, 63 and 85 per cent, respectively.

WP-246-External-En.doc 17
However, large companies in these sectors are more likely to be covered by collective agreements. For example, coverage in the chemicals sector was 91 per cent in companies with more than 300 employees; in transport and communication it was 94 per cent, while the mining sector revealed 100-per cent collective agreement coverage. Table 9. Workplaces covered by collective agreements, wage difference and wage gap by sector and firm size, Hungary, 1998
All firmsOver 300 employees All firms
Over 300 employees All firms
Over 300 employees
Agriculture and fisheries 25 72 24 -1 -0.054 -0.109Mining 63 100 75 0.217Food processing 55 74 20 3 0.066Textiles and garments 34 55 6 -10 -0.056 -0.065Paper and printing 41 69 22 -21 0.707Chemicals 72 91 58 68 0.104 0.125Non-metal processing 46 65 10 -10 0.168 0.197Metallurgy 49 89 45 41Engineering 36 54 14 17 0.173 0.2Electrical and electronics 36 43 14 13 -0.52 -0.05Vehicle manufacturing 62 73 -1 -13 0.065Electricity, gas and water 82 88 20 9 0.105 0.176Construction 25 70 59 6 0.099 0.124Commerce 33 56 -8 11 0.038 0.051Hotels and catering 41 67 69 76Transport and communication 85 94 -8 0.092Financial services 51 62 -19 -14 - -Property services 21 38 14 34 0.102 0.102Education, health, other services 48 56 54 0.024Total industries 49 74 25 10 0.055 0.027* p < 0.001 for all published dataSource: László Neumann, "Does Decentralized Collective Bargaining Have an Impact on the Labour Market in Hungary?," European Journal of Industrial Relations , 2002, Vol. 8 No. 1, p. 17.
Workplaces covered by collective agreements (%)
Wage difference by collective agreement (%)
Wage gap by collective agreements*Industry
2.5. Changes in the coverage of sectoral collective agreements Decentralization of sectoral bargaining is the result of economic necessity caused by a changing economic environment. It occurs because some issues are more adequately addressed at the company or plant level than at the central or sectoral level. A study in Finland discusses this point. In 1998, the Finnish Work Environment Fund (Työsuojelurahasto) – a tripartite government body – conducted research to clarify and produce an impartial and objective picture of local bargaining in Finnish workplaces. The research covered 692 establishments, including some in the chemical industry. Its main findings are as follows:
The incidence of decentralization within the centralized system of collective bargaining increased throughout the 1990s. It is clear that in the late 1990s the central, sectoral and local levels of bargaining complemented each other in all sectors of the economy. However, despite the increase in local bargaining, the principle of centralized bargaining has not been seriously challenged.
WP-246-External-En.doc 18
Management representatives favour greater local bargaining, but union representatives feel that the status quo is satisfactory.
In 90 per cent of establishments a local agreement on at least one issue was in place. On average there were 13 contracts per establishment – the larger the establishment, the greater the number of agreements. Above-average numbers of local agreements were to be found in the chemical, electricity, energy, metalworking, telecommunications and electronics industries.
The most common form of local bargaining was that dealing with working time (five agreements per establishment) and wage issues (five agreements per establishment).
Wage agreements mostly constituted some form of improvement to pay levels set by national collective agreements. Local agreements on wage increases were found in 41 per cent of establishments; wage cuts were comparatively rare, concerning 7 per cent of agreements only, and dealt with pay levels above the minimum rates set by national accords. Local agreements on productivity bonuses (in 44 per cent of establishments) and pay systems (40 per cent) were also quite common.
The most common type of working time accord dealt with the issue of flexitime (in 52 per cent of establishments), the length of breaks (46 per cent), the standard length of daily (40 per cent) and weekly (35 per cent) working time, averaging out periods in the case of flexible working time arrangements (37 per cent), and the maximum number of overtime hours (35 per cent); other significant local bargaining issues included training (39 per cent of establishments), health and safety at work (34 per cent), the use of subcontracted labour (28 per cent), productivity-improving measures (26 per cent) and gender equality at work (12 per cent). On average, there were around two agreements on each of these issues per establishment.
A similar survey of 710 firms, conducted in Finland in 1992 by a tripartite labour law committee, showed that in a relatively high percentage of establishments trade unions had made concessions in order to avoid redundancies and lay-offs. The survey found that local bargaining was held to be usual in negotiating lay-offs (in 22 per cent of establishments), holiday pay (16 per cent), and controlling wage drift (5 per cent). Bargaining over these three issues directly reflected the deep economic recession experienced by Finland in the early 1990s. In contrast, by 1998 local agreements on these issues were less common as the country was experiencing economic prosperity once again. Local bargaining over wage increases was more than double the 1992 figures which showed that local agreements over wage increases existed in only 7 per cent of establishments.
2.6. Collective bargaining on working time in the chemical industry and its impact on sectoral negotiations
2.6.1. Negotiations on shortening the working week Since the 1990s, the chemical industry has explored a variety of flexible working time arrangements. At the 1997 company-level negotiation, Akzo Nobel concluded an agreement on introducing flexible working time arrangements, reducing working time to 36 hours per week. Before that, the normal working week was 40 hours and until 1
WP-246-External-En.doc 19
July 1997 contractual working time was 38 hours per week. By virtue of the agreement, flexible and reduced working time arrangements were implemented on a voluntary trial basis in different company groups. Working time at Akzo Nobel is considered on an annual basis, with the total gross number of hours per year standing at 2,088, based on the eight-hour working day. In 1983, Akzo Nobel and trade unions negotiated a working time reduction of 104 hours, extended to 120 hours in 1990. The flexible working time structure added another 64 hours to these 120, so that working time reductions totalled 184 hours. However, the net number of hours is much lower, due to public holiday entitlements (48 hours) and annual holiday entitlements (184 hours). Under flexible working arrangements, the employer can implement up to 50 per cent of the working time reduction unilaterally by setting up a working schedule that best meets the company’s needs and production demands. The remaining 50 per cent of the quota can be used in the same way but only with the consent of individual employees, as in principle this portion of the quota is at the employees’ disposal. If the employees are not interested in reducing working time, thus not using their quota of hours, they can sell these hours to the company. However, neither the employee nor the employer is obligated to either sell or buy back hours from the other.11 In Germany, many collective agreements include provisions relating to working time flexibility, most commonly in the form of allowing working time to be averaged out over a specific period. This period is usually 12 months, although in some cases it is longer. To enable employers and employees to keep track of hours worked under these arrangements, time banking accounts are set up. Many agreements allow significant leeway in relation to these accounts, typically allowing credits of 130 hours and debits of 70 hours to be taken or made up over a period of 18 months.12
2.6.2. Implications of negotiations on flexible working time Following the reunification of Germany, the monetary union of two formerly separate economies in 1990 contributed to a drastic rise in unemployment. The country’s trade unions have since suffered a decline in membership. Added to economic pressures at the origin of this drop, German chemical trade unions, as others elsewhere in the world, are also under pressure from globalization. German chemical companies are increasingly taking part in the transnationalization of production and locating production sites abroad, for example in Central Europe or further afield. Germany’s traditional system of collective bargaining has been weakened owing to increasing pressure towards flexibility of conditions of work. Collective bargaining has also suffered as a result of companies refusing to join employers’ associations. The negotiations on reducing working time are reportedly one of the causes behind the growing decentralization of sectoral collective bargaining. As in many other countries, one of the most important subjects for collective bargaining in Germany throughout the 1980s and 1990s was the reduction of weekly working time. The first breakthrough came in the 1984 bargaining round. Following the negotiation, major industrial action resulted in a breach of the previous 40-hour threshold, with the introduction of a 35.5-hour working week in the metalworking and printing sectors.
11 “Akzo Nobel introduces flexible working”, EIRR 285, October 1997, pp. 22-23. 12 “Collective bargaining in 1999”, EIRR 316, May 2000, p. 28.
WP-246-External-En.doc 20
The 38.5-hour week was then extended to other sectors in the 1985 and 1986 bargaining rounds. Moreover, in the 1987 bargaining round the metalworking and printing unions secured a two-stage cut to a 37-hour week from 1989. Similar reductions followed in other industries in the 1988 and 1989 negotiation rounds. Finally, in 1990, the principle of the 35-hour week was adopted in the metalworking and printing sectors, with agreements providing for a phased move to this level by 1995. However, in exchange for shorter hours the German trade unions made concessions to the employers’ demands for greater flexibility in the organization of working time. They cleared the way for a move from a centrally determined policy on hours towards company-level negotiations between management and works councils (primarily trade unions). In the chemicals sector, a degree of flexibility in relation to working time has been introduced by the negotiation of provisions on “work-sharing” arrangements. The implementation of such provisions is optional rather than obligatory, and sectoral agreements generally leave it up to the individual employers and works councils to decide whether they wish to introduce work-sharing schemes. Moreover, the German chemical industry allows company-specific variations from the 37.5-hour per week norm to be negotiated within a “working time corridor”. In January 1994 the industry concluded an agreement enabling employers and works councils to negotiate variations from the 37.5-hour norm within a framework or “corridor”, where weekly working time may be reduced to as little as 35 hours with proportional reductions in wages, or increased to 40 hours without payment of overtime premiums. The provision remains intact. In 1994, a new framework agreement for professionals and middle managers was concluded between the chemical employers’ federation, the DAG white-collar union, the Association of Public Physicians (the Marburger Bund) and IG Chemie (now IG BCE). It contained an opt-out clause allowing the negotiation of individual contracts on working time, which in effect enabled professional workers to work longer hours than those set out in the sectoral collective agreement.13 The trend of increasing flexibility in sectoral agreements seems unstoppable. In 1998, most sectoral agreements contained provisions allowing flexibility in the organization of working time, usually in the form of averaging out over a set period of time. The most common averaging-out period is 12 months, although some agreements allow a longer one. The agreement in the German chemical industry allows a reference period of up to 36 months, which is one of the longest periods, whereas in the metalworking agreement for Baden-Württemberg working time may be averaged out over up to 24 months by agreement, and up to 27 months in special cases.14 In 1999, the working week was lengthened in some sectors. For example, the framework agreement for pharmacists lengthened the working week from 38 to 38.5 hours from 1 July 1999.15
13 “Bargaining round-up”, EIRR 249, October 1994, p. 6. 14 “Collective bargaining in 1997”, EIRR 295, August 1998, pp. 17-21. 15 “Collective bargaining in 1999”, EIRR 316, May 2000, p. 28.
WP-246-External-En.doc 21
2.7. Flexibility in sectoral bargaining
2.7.1. National policy advocating wage moderation in the interest of competitiveness
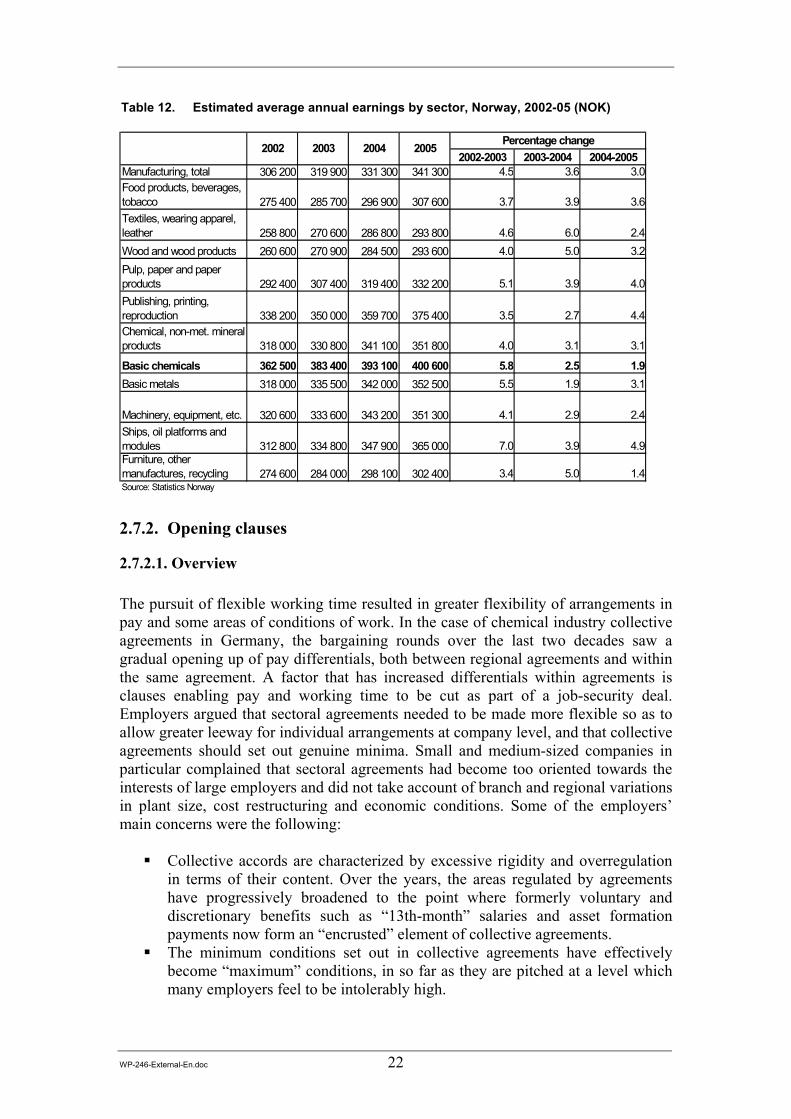
National policies set the ground rules that regulate collective agreements. Norway, for example, has been keeping with the wage settlement policy on negotiations called the solidarity alternative (solidaritetsalternativet), which has guided its incomes policy with a considerable degree of success since 1992. The solidarity alternative is based on a report issued in 1992 by the country’s Employment Commission. Under this policy, the government and the main blue-collar trade union confederation LO has an informal understanding that pay growth should be kept down to moderate levels with a view to improving the competitiveness of the Norwegian economy. This has been accompanied by an active labour market policy with the aim of reducing unemployment levels. However, not everyone agrees that the solidarity alternative is the best way forward. The wage negotiations throughout the 1990s managed to adhere to its general principles, despite pressures from a more buoyant economy and demands from some trade unions for bigger increases. Nevertheless, it was clear that support for the strategy of moderation was waning. In the 1998 main round, the LO failed in its efforts to oversee a coordinated settlement in the private industries, and the bargaining that followed was seen to break with the strategy of wage moderation. Following the 1998 wage round, all the main labour market parties worked together for the first time in an attempt to re-establish the solidarity alternative, within the framework of the Arntsen Commission. This Commission was formed in December 1998 and given the brief of making recommendations for the 1999 wage round. It issued its report in early 1999, recommending that wage growth be kept down to 4.5 per cent in 1999 and 3.5 per cent in 2000, in line with estimated wage growth in Norway’s competitor countries.16 In fact, wage increases were relatively high between 2000 and 2003: the overall manufacturing sector saw a 4.5-per cent rise in 2000, 4.9 per cent in 2001 and 5.0 per cent in 2003. However, as shown in table 10, pay settlements have remained moderate since 2003 (wage increases in the basic chemicals sector dropped from 5.8 per cent in 2002-03 to 2.5 per cent in 2003-04 and 1.9 per cent in 2004-05): the strategy of wage moderation is likely to continue in the manufacturing industries, including the chemical industry, to keep the Norwegian industry competitive.
16 “What future for centralized pay moderation?”, EIRR 322, November 2000, pp. 19-21.
WP-246-External-En.doc 22
2002-2003 2003-2004 2004-2005Manufacturing, total 306 200 319 900 331 300 341 300 4.5 3.6 3.0Food products, beverages, tobacco 275 400 285 700 296 900 307 600 3.7 3.9 3.6Textiles, wearing apparel, leather 258 800 270 600 286 800 293 800 4.6 6.0 2.4Wood and wood products 260 600 270 900 284 500 293 600 4.0 5.0 3.2Pulp, paper and paper products 292 400 307 400 319 400 332 200 5.1 3.9 4.0Publishing, printing, reproduction 338 200 350 000 359 700 375 400 3.5 2.7 4.4Chemical, non-met. mineral products 318 000 330 800 341 100 351 800 4.0 3.1 3.1
Basic chemicals 362 500 383 400 393 100 400 600 5.8 2.5 1.9Basic metals 318 000 335 500 342 000 352 500 5.5 1.9 3.1
Machinery, equipment, etc. 320 600 333 600 343 200 351 300 4.1 2.9 2.4Ships, oil platforms and modules 312 800 334 800 347 900 365 000 7.0 3.9 4.9Furniture, other manufactures, recycling 274 600 284 000 298 100 302 400 3.4 5.0 1.4
Table 10. Estimated average annual earnings by sector, Norway, 2002-05 (NOK)
Source: Statistics Norway
Percentage change2002 2003 2004 2005
2.7.2. Opening clauses
2.7.2.1. Overview The pursuit of flexible working time resulted in greater flexibility of arrangements in pay and some areas of conditions of work. In the case of chemical industry collective agreements in Germany, the bargaining rounds over the last two decades saw a gradual opening up of pay differentials, both between regional agreements and within the same agreement. A factor that has increased differentials within agreements is clauses enabling pay and working time to be cut as part of a job-security deal. Employers argued that sectoral agreements needed to be made more flexible so as to allow greater leeway for individual arrangements at company level, and that collective agreements should set out genuine minima. Small and medium-sized companies in particular complained that sectoral agreements had become too oriented towards the interests of large employers and did not take account of branch and regional variations in plant size, cost restructuring and economic conditions. Some of the employers’ main concerns were the following:
Collective accords are characterized by excessive rigidity and overregulation in terms of their content. Over the years, the areas regulated by agreements have progressively broadened to the point where formerly voluntary and discretionary benefits such as “13th-month” salaries and asset formation payments now form an “encrusted” element of collective agreements.
The minimum conditions set out in collective agreements have effectively become “maximum” conditions, in so far as they are pitched at a level which many employers feel to be intolerably high.
Table 12. Estimated average annual earnings by sector, Norway, 2002-05 (NOK)
WP-246-External-En.doc 23
The trend towards uniform terms and conditions at national sectoral level (Bundesinheislinie) ignores the increasing differentiation of the economy and makes it more and more difficult to find solutions appropriate to the specific circumstances of individual enterprises.17
Consequently, some industries – including the chemical industry – negotiated so-called “opening clauses” (Öffnungsklauseln) under which individual companies finding themselves in difficult economic circumstances may postpone payment of all or part of the collectively agreed increase, by agreement with employee representatives, in return for a guarantee that there will be no redundancies during the lifetime of these clauses. Table 11 shows a snapshot of the variety of agreed provisions allowing the bargaining parties to deviate from the main collectively agreed provisions of sectoral accords in Germany. Sectoral agreements in other countries have come to offer opening clauses, allowing companies to waive, postpone or deviate from centrally agreed provisions. The Italian chemical industry, for example, introduced opening clauses in its 2006 agreement.18 The new agreement covers more than 215,000 chemical workers and will be valid until the end of 2007. The new sectoral agreement, signed in May 2006 by employers’ associations Federchimica and Farmindustria and the trade unions Filcem-Cgil, Femca-Cisl and UilCem-Uil, contains opening clauses allowing the social partners to jointly decide to waive certain provisions of the agreement. The measure is intended to support many chemical companies undergoing a crisis due to low productivity and poor competitiveness. Noting this agreement, Federchimica President Giorgio Squinzi stated that “[t]he chemical sector is a positive model of industrial relations and this is clearly demonstrated by the fact that the social partners have reached an accord without strike action.”19 German economic and social research institute (WSI) observes that the three main criteria which must be fulfilled in order to make use of opening clauses are:
proof that the company is in a difficult economic situation that may threaten jobs or the very existence of the company;
the size of the company. Many clauses stipulate that companies must be under a certain size. Limits on the size of the workforce range from ten to 50 employees; and
recruitment of certain types of employees, usually long-term unemployed, employees embarking on their career, and apprentices who have recently finished their training.20
17 “Which direction for bargaining reform?”, EIRR 245, June 1994, pp. 15-17. 18 The new agreement provides for an average pay increase of €100 a month for the 2006-07 period, in addition to enhanced vocational training leave entitlement. The pay increase will be distributed in three instalments: €44 a month from May 2006; €44 a month from January 2007; and €12 a month from October 2007. Workers will also receive a lump sum of €176 to cover the five-month period from the expiration of the previous agreement to the conclusion of the renewal. The old contract expired on 31 December 2005. Concerning vocational training, workers will have three more days a year during which they can attend vocational training courses aimed at improving the qualification and skills level of the workforce and company productivity. 19 “Agreement in chemicals”, EIRR 389, June 2006, p. 9. 20 “Flexibility, change and the future of sectoral bargaining”, EIRR 285, October 1997, pp. 24-27.
WP-246-External-En.doc 24
2.7.2.2. Variable pay provisions As mentioned above, work-sharing could be a cause of moving the chemical industry into the realm of flexibility at negotiations. Wage determination remains an important issue in sectoral negotiations, however. Where sectoral negotiations take place, the rates of pay set out in sectoral agreements are the minima. As a result, wage differentiation has traditionally only been possible if companies voluntarily offered wages and other conditions over and above these minima. However, the strains on the system are increasingly evident. In May 2005, the Austrian chemical industry concluded a 12-month collective agreement covering some 40,000 employees. In addition to pay rises, the agreement provided the alternative of a pay flexibility clause (Verteiloption), which allows employers more flexibility in the distribution of sectorally agreed pay.21 In the 1997 bargaining round the German chemical industry concluded a pay flexibility agreement. Under this deal, which came into force on 1 January 1998, chemical companies are allowed to pay up to 10 per cent below agreed rates, upon agreement with the works council and if this is linked to job security and increased competitiveness measures. The agreement also includes provision for companies to pay profit-related bonuses to their employees, by agreement, if the company is performing well. This agreement aims to provide flexibility in an attempt to cater for the very diverse needs of different sorts of companies. In 1998, the German chemical industry concluded an agreement to increase pay by 2.4 per cent for the duration of the 14-month deal. The pay rise was backdated to 1 March 1998 in the Länder of Rhineland, Hessen and Rhineland-Pfalz, to 1 April in Westphalia, Bavaria, Baden-Württemburg, Lower Saxony/Bremen, Schleswig-Holstein/Hamburg and Berlin, and to 1 May in the Saarland. In addition, a one-off non-consolidated sum equal to 1.1 per cent of a year’s pay was to be paid by the end of June 1998. However, employers were allowed to defer or reduce it if the company was in economic difficulties, provided they obtained the prior agreement of the works council (Betriebsrat). The IG BCE estimated the deal to be worth a total of 3 per cent when calculated on an annual basis. By contrast, BAVC estimated that it would result in a total increase in costs of 2 per cent on an annual basis, as the extra payment was not consolidated. The 1998 negotiation round broke into “new territory,” according to the IG BCE. The agreement provided for the two-part structure of pay increase which allowed the industry more room to react to economic conditions. Employers were of a similar opinion, with BAVC stating that the deal was “an acceptable compromise”. The employers were particularly pleased with the agreement on the one-off bonus which, as it was not consolidated and could be reduced or deferred by agreement, would not increase their costs unrealistically.22 Furthermore, the 2001 negotiation round − for the first time in the chemical industry − enabled employers to pay 90 per cent of agreed rates to new recruits who had previously been long-term unemployed, and 95 per cent of agreed rates to new starters at the beginning of their career.
21 “Chemicals sector agreement”, EIRR 377, June 2005, p. 4. 22 “14-month deal in chemicals”, EIRR 293, June 1998, pp. 17-18.
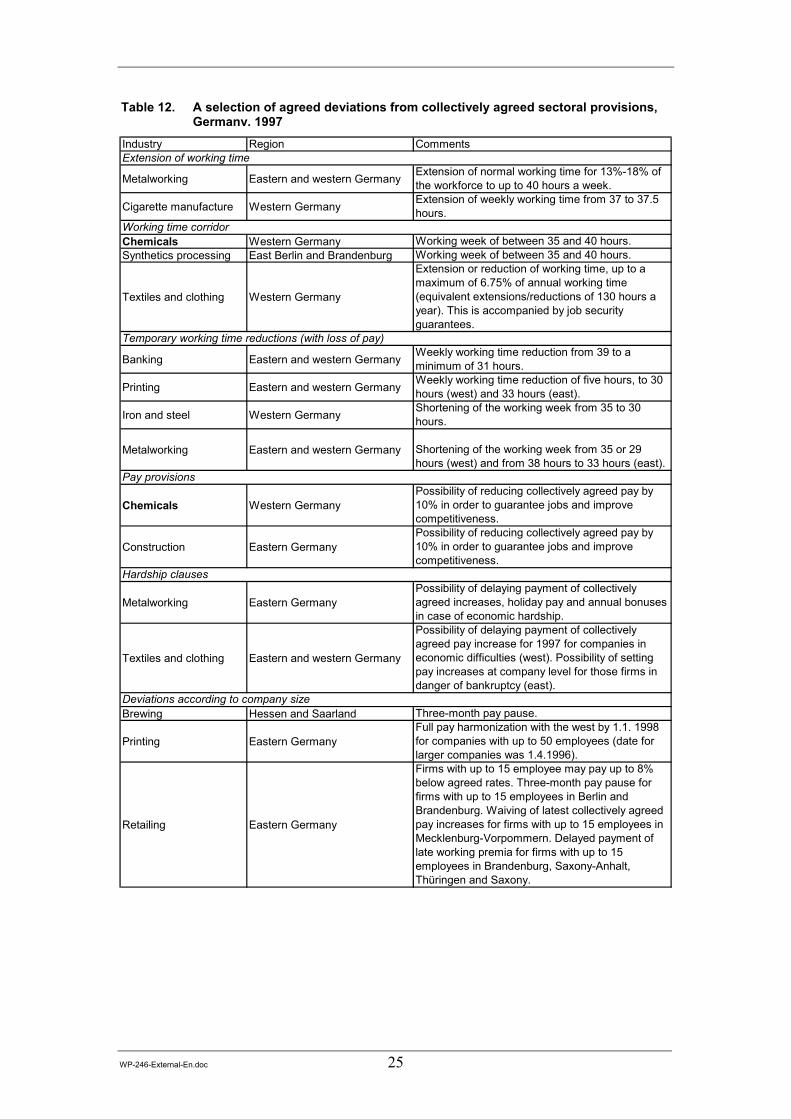
WP-246-External-En.doc 25
Table 11. A selection of agreed deviations from collectively agreed sectoral provisions, Germany, 1997
Industry Region Comments
Metalworking Eastern and western Germany Extension of normal working time for 13%-18% of the workforce to up to 40 hours a week.
Cigarette manufacture Western Germany Extension of weekly working time from 37 to 37.5 hours.
Chemicals Western Germany Working week of between 35 and 40 hours.Synthetics processing East Berlin and Brandenburg Working week of between 35 and 40 hours.
Textiles and clothing Western Germany
Extension or reduction of working time, up to a maximum of 6.75% of annual working time (equivalent extensions/reductions of 130 hours a year). This is accompanied by job security guarantees.
Banking Eastern and western Germany Weekly working time reduction from 39 to a minimum of 31 hours.
Printing Eastern and western Germany Weekly working time reduction of five hours, to 30 hours (west) and 33 hours (east).
Iron and steel Western Germany Shortening of the working week from 35 to 30 hours.
Metalworking Eastern and western Germany Shortening of the working week from 35 or 29 hours (west) and from 38 hours to 33 hours (east).
Chemicals Western GermanyPossibility of reducing collectively agreed pay by 10% in order to guarantee jobs and improve competitiveness.
Construction Eastern GermanyPossibility of reducing collectively agreed pay by 10% in order to guarantee jobs and improve competitiveness.
Metalworking Eastern GermanyPossibility of delaying payment of collectively agreed increases, holiday pay and annual bonuses in case of economic hardship.
Textiles and clothing Eastern and western Germany
Possibility of delaying payment of collectively agreed pay increase for 1997 for companies in economic difficulties (west). Possibility of setting pay increases at company level for those firms in danger of bankruptcy (east).
Brewing Hessen and Saarland Three-month pay pause.
Printing Eastern GermanyFull pay harmonization with the west by 1.1. 1998 for companies with up to 50 employees (date for larger companies was 1.4.1996).
Retailing Eastern Germany
Firms with up to 15 employee may pay up to 8% below agreed rates. Three-month pay pause for firms with up to 15 employees in Berlin and Brandenburg. Waiving of latest collectively agreed pay increases for firms with up to 15 employees in Mecklenburg-Vorpommern. Delayed payment of late working premia for firms with up to 15 employees in Brandenburg, Saxony-Anhalt, Thüringen and Saxony.
Hardship clauses
Deviations according to company size
Extension of working time
Working time corridor
Temporary working time reductions (with loss of pay)
Pay provisions
Table 12. A selection of agreed deviations from collectively agreed sectoral provisions, Germany, 1997

WP-246-External-En.doc 26
Industry Region Comments
Chemicals Western Germany90% starting rates for previously long-term unemployed recruits, 95% starting rates for certain new recruits.
Berliner Lufthansa Airport Services GmbH Berlin
Lower starting rates for those beginning their careers and those who have previously been unemployed for one year.
Construction Western GermanyCreation of a new pay grade just above the agreed minimum rate. New recruits who have been previously unemployed for at least nine months may be temporarily recruited at a lower grade.
Braunschweigische Braunkohlenbergwerke AG
Braunschweig 80% starting rates for new recruits and newly qualified apprentices.
Chemicals Western Germany Exceptions to the amount and payment date of the annual bonus.
Printing Western Germany
Payment of annual bonus may be postponed. Companies with up to 35 employees may cut the annual bonus from 95% to 60% of monthly pay once in four years, with job guarantees in the following year.
Paper manufacturing Eastern and western GermanyAnnual bonuses may be reduced for companies in difficult economic circumstances. Companies in the west may also reduce holiday pay by 50%.
Source: WSI-Tarifachiv 1997, cited in EIRR 285, October 1997, pp. 26-27.
Lower starting rates for certain employees
Holiday pay and bonuses
Financial vicissitudes bring about greater flexibility in sectoral bargaining in all industries, including the chemical industry. One of the benefits of flexibility in sectoral bargaining lies in inciting the industry to adopt a pragmatic way of dealing with any contingencies. While maintaining the important role of sectoral negotiations in deciding the framework of workers’ wages and working conditions, the introduction of opening clauses enables chemical companies requiring a flexible application of wages and working time to strengthen their competitiveness in the market. Flexibility in sectoral negotiations stems from the need for the chemical industry to maintain its level of business and ensure further growth. This pragmatic approach was made possible by the nature of the industry which naturally seeks to find amicable solutions to any problems in the field of industrial relations. The following chapters will examine other factors involved in increasing the flexibility of collective bargaining and decentralization of negotiations in the chemical industry.
WP-246-External-En.doc 27
3. Implications of laws for collective agreements
3.1. Legislation on collective bargaining decentralization Laws lay out the procedures for collective negotiations that the chemical industry must follow. In the United States, collective bargaining is organized at company and plant level only. The National Labor Relations Act (NLRA), enacted in 1935, established the concept of a “bargaining unit”. This could be only an “employer unit, craft unit, plant unit, or subdivision thereof” (NLRA, Section 9(a)). In order to be considered appropriate, the employees being considered for union representation were required to have a “community of interest”, that is common employment interests such as similar wage structure, tasks, and supervision. By the early 1940s, the National Labor Relations Board (NLRB) had established election as the preferred method of determining representation. From then on the bargaining unit could thus accurately be labelled an election unit which would be a bargaining unit only if the employees in the unit chose a trade union to represent them for collective purposes. In other words, union representation would exist only if a majority of the employees desired to be so represented. Moreover, as the law would later evolve, it added another element, namely that the desire for unionization must be a continuing one.23 A similar case can be encountered in France. Parsons (2005) explains the development of the legal framework on collective bargaining system there in the last century. After the Second World War, France was described as a country without a bargaining culture, and one that “does not like to negotiate”. This was mainly because of the weakness of trade unions. The 1950 Collective Bargaining Act provided the main legal framework for collective bargaining until the Auroux Laws of 1982. The 1950 Act stipulated that the industry level was the main level for collective bargaining. Little scope was given to multi-industry bargaining, while both employers and trade unions avoided plant-level bargaining. The function of collective bargaining was seen as being one of regulating the “rules of the trade” on a sectoral basis. Thus, the 1950 Act established some important principles:
Some trade unions were given nationally representative status and were therefore empowered to sign agreements regulating the “laws of the trade” on behalf of whole social groups. This was a function of certain characteristics of the organizations rather than being dependent on any mandate given by the groups they were presumed to represent, or on their membership numbers. Only unions not attached to one of the major confederations had to prove their representation.
As the trade unions were intrinsically representative of the whole workforce, an agreement was valid if it was signed by one representative union, regardless of its membership size.
All employees, whether unionized or not, benefited from a collective agreement if they were in the company, region or sector covered.
The Act allowed the State to make an agreement binding on all companies in a given sector, region, or even in the whole country after consultation with the
23 Richard N. Block, Bargaining for Competitiveness – Law, Research, and Case Studies, 2003, pp. 15-16.
WP-246-External-En.doc 28
Conseil supérieur des conventions collectives (now the Conseil national de la négociation collective – CNNC).
The notion of a hierarchy of norms was retained. As a result, collective agreements could only be signed by organizations deemed to be workers’ representatives, and could only improve upon any legal provision in force. All employees benefited from minimum legal guarantees, and any freely negotiated improvements thereon could be extended to all employees of a branch irrespective of their employer, the precise circumstances of their company, or whether they chose to be members of the signatory unions or not. Therefore, the greatest benefit of the Act was that despite trade union pluralism, the “laws of the trade” could be elaborated by the bargaining activities of trade unions and employers, activities that were institutionalized and delimitated by the State. At the time, collective bargaining largely took place at the national industry level to establish framework agreements. In the 1950s, 420 industry-level agreements were signed per year, and 143 at plant level, rising respectively to 990 and 356 a year between 1960 and 1967.24 Boulin (2000) indicates that collective bargaining in France shows a strong trend towards decentralization. He argues that this is rooted in the government policy. The absence of a consistent collective process at sectoral and cross-sectoral level, and especially the lack of any obligation to sign an agreement at all levels put in jeopardy the process of institutionalizing trade unions’ initiatives on sectoral and cross-sectoral agreements. He cites a 1978 attempt by the CFDT in support of his arguments. The CFDT had attempted to conclude central agreements in the late 1970s, but none of its attempts led to the signing of significant sectoral or cross-sectoral agreements. In addition, there were the Auroux Laws on the right to free expression, the requirement that companies should hold annual negotiations, and the implementation of derogating legislation. Boulin argues that government policies lacking legitimate support to institutionalize collective bargaining at sectoral and national levels, combined with laws that provided financial incentives for companies which agreed on working time reductions, resulted in weakening the position of trade unions in France at sectoral level.25 Parson (2005) states that the Auroux Laws began to democratize industry primarily by strengthening the position of employers and their collective organizations within the workplace. Decentralized collective bargaining was seen as a means of reinforcing employee influence over working conditions. The aim of the laws was to strengthen trade unions, and hence dialogue, and thereby facilitate the resolution of conflict through bargaining, thus allowing the State to disengage itself from the industrial relations arena. To strengthen the collective bargaining system, the 1982 Collective Bargaining Act obligated firms with a trade union branch present to negotiate annually over hours and pay at company level. Further legislation has reinforced the institutional framework of, and incentives for, employers to engage in company-level bargaining, particularly in the area of working time. A decree of 16 January 1982 first introduced the possibility of dispensation from the law on working time through 24 Nick Parsons, French Industrial Relations in the New World Economy, Routledge, 2005, pp. 113-132. 25 Jean-Yves Boulin, “Trade unions in France: how to challenge the trend towards de-unionisation?”, in Trade Unions in Europe – facing challenges and searching for solutions, ETUI, Brussels, 2000, pp. 215-248.

WP-246-External-En.doc 29
company-level agreements. The 1993 Five-Year Employment Law made this possible in companies without a trade union presence but covered by a branch-level agreement, after consultation with workplace representatives, who had the right of veto over such proposals. The multi-industry agreement of 30 October 1995 gave rise to the law of 12 November 1996, and aimed to make it easier to sign agreements that derogated from branch-level agreements in companies without a trade union presence. As in many other European countries, the issue of the reduction of working time stimulated the decentralization of collective bargaining in France. The Robien Law of 1996, and the 1998 and 2000 Aubry Laws on the reduction of working time have reinforced incentives for company-level bargaining by tying state financial aid to the conclusion of agreements. Furthermore, as few branch-level agreements were signed to facilitate bargaining in companies without trade union representation following the multi-industry agreement of 30 October 1995, the Aubry Laws took up the idea of a system of employee representatives “mandated” to conclude agreements in the absence of trade union representatives. In this case, however, no branch-level agreement is necessary for such mandating to take place. In addition, the second Aubry Law of 19 January 2000 introduced the idea of “majority consent” into the negotiating process. If trade unions could sign agreements that defined the actual conditions of work, rather than the minimal “laws of the trade”, and if these agreements could downgrade higher-level agreements or the law and were binding upon all employees in the workplace, such agreements needed greater legitimacy than that afforded by the signature of a trade union deemed to be representative of all employees in that workplace by dint of belonging to a “representative” national confederation. Therefore, the second Aubry Law on the 35-hour week made the granting of financial aid for the reduction of working time, in the form of reduced employer social contributions, conditional upon the agreement being signed by trade unions having won a majority of votes in the most recent works committee elections or by employee delegates with a majority of votes. Failing this, an agreement signed by unions representing a minority of the workforce, or by elected or mandated representatives, could be ratified by a referendum of the whole workforce.26 The survey by the French Ministry of Labour reveals that almost 23,000 company-level agreements were concluded in 2002.27 Box 1 gives an overview of the main provisions of the legislation of 4 May 2004. At the 2004 negotiation rounds there were no company-level collective agreements deviating from sector-level accords, but this possibility is now provided for by the new legislation. Although it is not conclusive, there is the possibility that the new law still depends on the way the social partners conduct themselves at sectoral level.
26 Nick Parsons, op.cit., pp. 113-132. 27 EIRR 368, September 2004, p. 29.

WP-246-External-En.doc 30
Box 1. Summary of the 2004 legislation on the reform of collective bargaining in France This law, which came into force in May 2004, aims to spur social dialogue and the collective bargaining process in France through a range of means. A summary of these is set out below. The majority principle – Until the adoption of this law, an agreement was valid if it was signed by one representative trade union only. This gave rise to cases where an agreement could be in force even though it had not been signed by most of the trade unions representing employees in a company or sector. The law seeks to address this by introducing a majority principle, under which an agreement must be supported by a majority of representative trade unions. It provides for two alternative models for creating such a situation, namely:
A numerical majority: an agreement will be valid if it is signed by one or more unions representing the majority of the employees or if it is accepted by a majority of the employees; or
An absence of opposition: an agreement will be valid if it is signed by a single union providing it is not opposed by a majority of unions or employees or the unions representing the majority of the employees.
The majority principle applies at multi-sector, sectoral and enterprise levels:
A multi-sector agreement will be valid if there is an absence of opposition among the majority of unions – i.e., three out of the five principal confederations operating in France;
A sectoral agreement is subject to the same requirements (absence of opposition), except when an extended agreement that has not been opposed is accepted by a majority. In this case, the sectoral agreement is valid if one or more unions representing a majority of employees in that sector has signed it; and
The validity of company agreements may be determined by sectoral agreements that are extended and not opposed, using the majority principle either in the form of majority acceptance or absence of dissent.
Hierarchy of agreements – the new law allows sectoral and company agreements to derogate from higher-level accords expect in specific circumstances, changing the hierarchical relationship between these different levels of agreements. This means that company agreements cannot derogate from agreed measures contained in an accord with a wider regional or sectoral application, as long as the relevant sectoral agreement does not prohibit this. However, the law provides for some safeguards:
WP-246-External-En.doc 31
The only company agreements that may derogate from higher-level agreements are majority agreements as defined by the law;
A sectoral accord may prohibit or limit the opportunities for derogation, providing this is expressly stated;
Derogations are excluded from four areas: minimum wages; job classifications; collective guarantees in relation to additional social protection; and management funds designed to finance vocational training; and
Such accords cannot have any retroactive effect. Thus, an agreement that was in place before the implementation of the law may not be subject to any derogation. Nevertheless, the social partners may revise the agreements, subject to the new majority rules, or annul them.
In an attempt to encourage collective bargaining in small firms, which often do not have trade union delegates, the new law states that in the absence of a union delegate, a company accord may be concluded by the company’s works council, employee representatives, or, if there are none of these in evidence, by an employee mandated by a trade union, on condition that this is allowed under the relevant sectoral agreement.
Source: EIRR 379, August 2005, p. 35.
Another example can be found in the 2004 collective agreement in the chemicals sector in Spain on the recruitment and work organization of employees. The agreement is valid from 1 January 2004 to 31 December 2006. All recruitment of workers is undertaken in accordance with the law in order to increase labour flexibility and protect workers’ rights. Another aim is to eradicate the practice of employees holding more one job. Thus, employers make a commitment not to employ people who already have a full-time contract with another company. Specific provisions exist regarding the recruitment of workers over the age of 45 and workers with disabilities. The agreement states that workers may be employed on a range of contracts:
indefinite; fixed-term; casual; part-time; job training (workers on these types of contracts receive training; their status is
similar to other workers’, although their terms and conditions are less favourable than those of regular employees); and
work experience (these are temporary contracts concluded with workers who have only recently acquired vocational qualifications, enabling them to apply and develop their vocational skills; the workers receive a wage, usually lower than the pay rates for normal employment contracts).
The workers covered by this agreement are grouped into six functional categories: production workers; maintenance workers; service workers; research and laboratory
WP-246-External-En.doc 32
workers; administration and information technology staff; and administrative staff. Staff within each functional category are grouped into eight grades.28 3.2. Company-based negotiation and competitiveness Negotiations in the chemical industry in the United States are either company-based or plant-based. Block (2003) discusses competitiveness as well as employment protection and creation in the context of company-based collective bargaining there. In the United States, collective bargaining is governed by the National Labor Relations Act (NLRA) as amended in 1947 and then again in 1959. Block points out that there is a contradiction on how collective bargaining would contribute to improving productivity based on dialogue between the parties concerned. The NLRA requires both parties to bargain in “good faith”, but the law amended in 1947 states that the obligation to bargain in good faith “does not compel either party to agree to a proposal or require the making of a concession” (NLRA as amended, Section 8(d)); however, this obligation does not apply to negotiations on workers’ and trade unions’ genuine intent to work with the companies in order to increase competitiveness of the company they work for. This is based on United States case law. As the US Supreme Court noted in NLRB v. Insurance Agents International Union, 361 U.S. 477 [1960, 484-487], commenting an early debate around legislation that would clarify the obligation to bargain in the 1935 law, “…United States labor law does not require either party to agree to any proposal made by the other party, including any matter regarding competitiveness and employment protection/creation. Labor laws only require each party to negotiate in good faith over matters involving terms and conditions of employment, so that parties must discuss employment protection and competitiveness, at least to the extent that compositeness is germane to terms and conditions of employment.” In Fibreboard v. NLRB, 379 U.S. 203 (1964), the Supreme Court held that any employer decision resulting in the termination of employment was a mandatory subject of bargaining. In the case at issue the firm had replaced its unionized employees with those of a contractor. The company had determined that it cost less to have the maintenance work done by a contractor than the bargaining unit employees, and it believed that the union would not agree to a contract that resulted in reducing cost. However, subsequent Supreme Court decisions excluded the possibility of compulsory negotiations between the parties concerned on matters relating to company’s competitiveness. In First National Maintenance Corporation v. NLRB, the Court decided that all management decisions could be characterized as one of three types with respect to bargaining:
Type I – decisions that had a substantial effect on the employer but only a minimal or indirect effect on the employment interest of employees, such as pricing, financing, advertising; these decisions were part of the management’s inherent freedom to manage its affairs unrelated to employment, and there was no obligation on its part to negotiate;
Type II – decisions that affected solely employment, such as wages, working hours, benefits, where bargaining was obligatory; and
28 “New agreement in chemicals”, EIRR 370, November 2004, pp. 22-24.
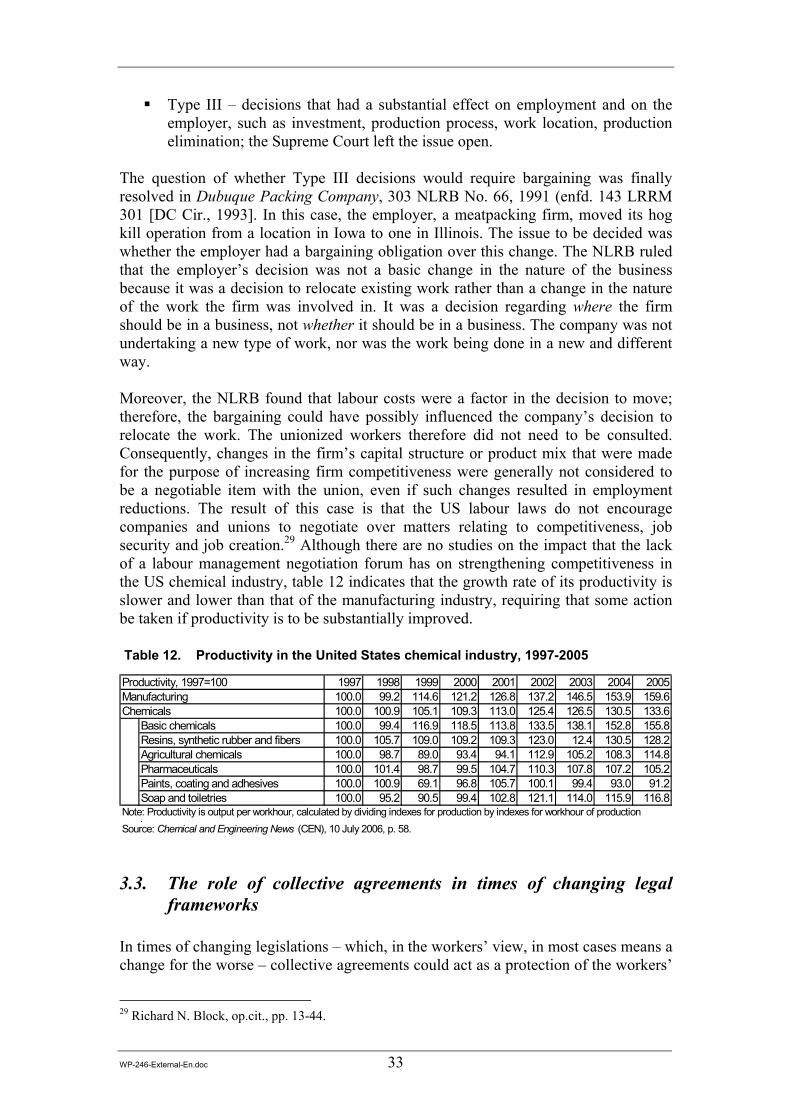
WP-246-External-En.doc 33
Type III – decisions that had a substantial effect on employment and on the employer, such as investment, production process, work location, production elimination; the Supreme Court left the issue open.
The question of whether Type III decisions would require bargaining was finally resolved in Dubuque Packing Company, 303 NLRB No. 66, 1991 (enfd. 143 LRRM 301 [DC Cir., 1993]. In this case, the employer, a meatpacking firm, moved its hog kill operation from a location in Iowa to one in Illinois. The issue to be decided was whether the employer had a bargaining obligation over this change. The NLRB ruled that the employer’s decision was not a basic change in the nature of the business because it was a decision to relocate existing work rather than a change in the nature of the work the firm was involved in. It was a decision regarding where the firm should be in a business, not whether it should be in a business. The company was not undertaking a new type of work, nor was the work being done in a new and different way. Moreover, the NLRB found that labour costs were a factor in the decision to move; therefore, the bargaining could have possibly influenced the company’s decision to relocate the work. The unionized workers therefore did not need to be consulted. Consequently, changes in the firm’s capital structure or product mix that were made for the purpose of increasing firm competitiveness were generally not considered to be a negotiable item with the union, even if such changes resulted in employment reductions. The result of this case is that the US labour laws do not encourage companies and unions to negotiate over matters relating to competitiveness, job security and job creation.29 Although there are no studies on the impact that the lack of a labour management negotiation forum has on strengthening competitiveness in the US chemical industry, table 12 indicates that the growth rate of its productivity is slower and lower than that of the manufacturing industry, requiring that some action be taken if productivity is to be substantially improved. Table 12. Productivity in the United States chemical industry, 1997-2005
1997 1998 1999 2000 2001 2002 2003 2004 2005Manufacturing 100.0 99.2 114.6 121.2 126.8 137.2 146.5 153.9 159.6Chemicals 100.0 100.9 105.1 109.3 113.0 125.4 126.5 130.5 133.6
Basic chemicals 100.0 99.4 116.9 118.5 113.8 133.5 138.1 152.8 155.8Resins, synthetic rubber and fibers 100.0 105.7 109.0 109.2 109.3 123.0 12.4 130.5 128.2Agricultural chemicals 100.0 98.7 89.0 93.4 94.1 112.9 105.2 108.3 114.8Pharmaceuticals 100.0 101.4 98.7 99.5 104.7 110.3 107.8 107.2 105.2Paints, coating and adhesives 100.0 100.9 69.1 96.8 105.7 100.1 99.4 93.0 91.2Soap and toiletries 100.0 95.2 90.5 99.4 102.8 121.1 114.0 115.9 116.8
Source: Chemical and Engineering News (CEN), 10 July 2006, p. 58.
Productivity, 1997=100
Note: Productivity is output per workhour, calculated by dividing indexes for production by indexes for workhour of production l
3.3. The role of collective agreements in times of changing legal frameworks In times of changing legislations – which, in the workers’ view, in most cases means a change for the worse – collective agreements could act as a protection of the workers’
29 Richard N. Block, op.cit., pp. 13-44.
Table 12. Productivity in the United States chemical industry, 1997-2005
WP-246-External-En.doc 34
right to retain the working conditions that would apply if the legislation in question were not being amended. For example, in Germany, the issue that dominated sectoral collective bargaining between 1996 and 1997 was sickness payments. On 25 September 1996 new legislation cutting sick-pay provision from 100 per cent to 80 per cent of previous earnings was passed, and came into force on 1 October 1996. The measure, introduced by the Government in an attempt to reduce public spending, sparked widespread protests among trade unions. In the unions’ view, it was unacceptable to reduce payment to employees who were unable to work due to illness. This resulted in the early re-negotiation of collective agreements to ensure that collectively agreed sickness payments were maintained at 100 per cent. The chemical industry succeeded in this. Maintenance of sickness payments at 100 per cent of previous earnings was financed in the chemical industry by measures such as changes to the calculation of sickness payments and cuts in premiums such as the 13th-month bonus and holiday pay.30 Likewise, the chemical industry attempted to create more jobs in combination with early retirement schemes. A law that came into effect on 1 August 1996 aimed to encourage older workers to take progressive early retirement, thus aiding job creation. The new law (Altersteilzeitgesetz) provided that workers aged 55 and over would be able to halve their working hours by 31 July 2001, thus enabling their employer to hire an unemployed young person or a trainee in their place. Employees who reduce their working hours received pay from the employer corresponding to the new number of hours worked, plus an additional 20 per cent, reimbursed to the employer by the Government. The provisions were implemented on a voluntary basis through sectoral or company collective agreements. In practice, a variety of agreements to this end have been signed, ensuring that the older workers who reduced their working hours received payments higher than the additional 20 per cent provided for by the law. An agreement in the chemical industry stipulates that employees should receive an additional sum amounting to 40 per cent of pay.31 National case studies demonstrate that the legal framework can have significant impact on the forms and nature of collective bargaining in the chemical industry. Cases suggest how national public policies defining the roles of collective bargaining could influence the way in which its national industrial relations are conducted. These cases not only highlight the importance of national policies on forming employer-employee relations, but also underscore the fact that the way in which collective bargaining is formulated in a given country determines the characteristics of good industrial relations. It has also been shown that in the absence of legal protection, collective bargaining acts as a means of safeguarding workers’ interests.
30 “Collective bargaining in 1996”, EIRR 282, July 1997, pp. 27-30. 31 ibid.

WP-246-External-En.doc 35
4. Trade union density and collective bargaining
4.1. Overall trends in trade union density In many countries, overall trade union density appears to be decreasing in recent years. Table 13 shows the evolution of trade union density in 25 selected countries which are also the main chemicals-producing countries. An overwhelming number of them (20 out of 25) have registered a fall in the trade unionization rate over the past three decades. For example, the unionization rate in Australia dropped from 50.2 per cent in 1970 to 22.9 per cent in 2003; in absolute figures, Australia lost 27.3 percentage points between 1976 and 2003. Austria’s unionization rate dropped from 62.8 per cent in 1970 to 35.4 per cent in 2002, or 27.3 points. In the United Kingdom the rate fell from 44.8 per cent in 1970 to 29.3 per cent in 2003, with a loss of 15.5 points in absolute figures. Japan’s unionization rate dropped from 35.1 per cent in 1970 to 19.7 per cent in 2003, or 15.4 points in absolute figures. France lost 13.4 points in absolute figures, a decrease from 21.7 per cent in 1970 to 8.3 per cent in 2003. Similarly, the United States lost 11.1 points, a drop from 23.5 per cent in 1973 to 12.4 per cent in 2003. The decline in Norway, Italy, and the Republic of Korea is relatively low: Norway lost 3.5 points in absolute figures of the trade unionization rate, standing at 53.3 per cent in 2003, while Italy lost only 3.3 points, from 37.0 per cent in 1970 to 33.7 per cent. Similarly, the Republic of Korea lost only 1.5 points in the trade unionization rate, from 12.6 per cent in 1970 to 11.2 per cent in 2003. In only five out of 25 sample countries the trade unionization rate went up – these countries are Belgium, Denmark, Finland, Spain and Sweden, where trade unions are traditionally strong and unionization rates have remained high.
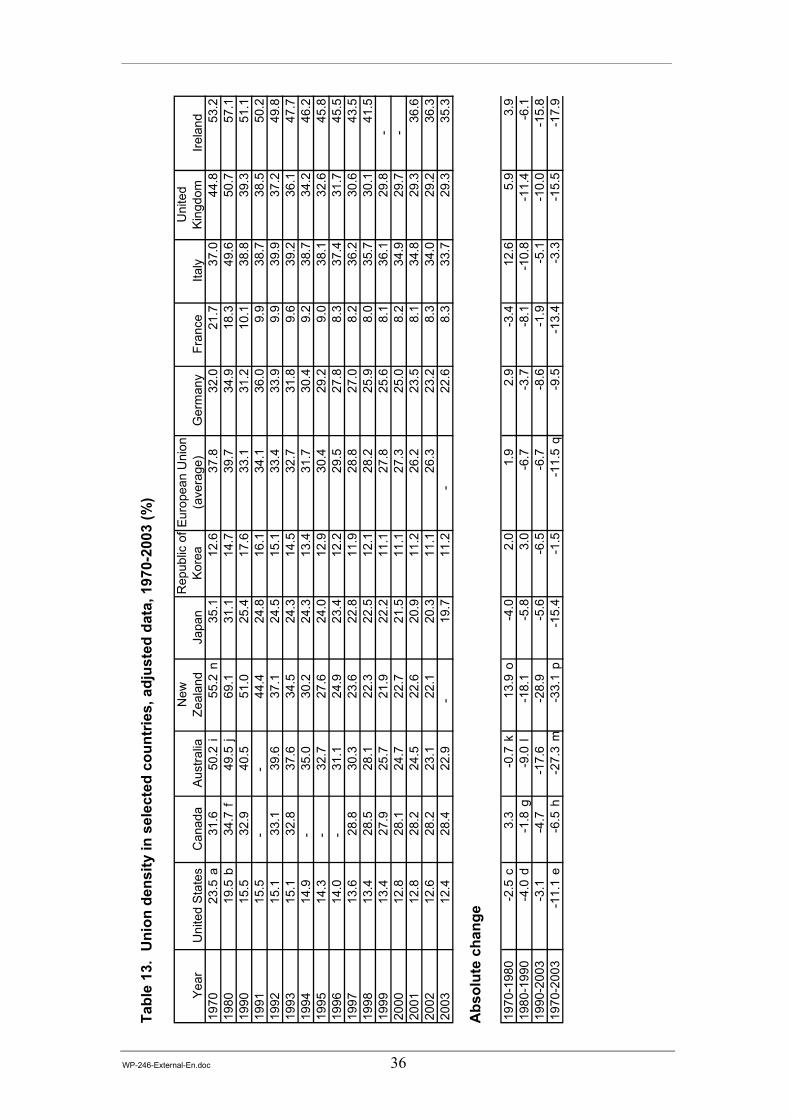
WP-246-External-En.doc 36
Tabl
e 13
. U
nion
den
sity
in s
elec
ted
coun
trie
s, a
djus
ted
data
, 197
0-20
03 (%
) A
bsol
ute
chan
ge
1970
-198
0-2
.5c
3.3
-0.7
k13
.9o
-4.0
2.0
1.9
2.9
-3.4
12.6
5.9
3.9
1980
-199
0-4
.0d
-1.8
g-9
.0l
-18.
1-5
.83.
0-6
.7-3
.7-8
.1-1
0.8
-11.
4-6
.119
90-2
003
-3.1
-4.7
-17.
6-2
8.9
-5.6
-6.5
-6.7
-8.6
-1.9
-5.1
-10.
0-1
5.8
1970
-200
3-1
1.1
e-6
.5h
-27.
3m
-33.
1p
-15.
4-1
.5-1
1.5
q-9
.5-1
3.4
-3.3
-15.
5-1
7.9
Year
Japa
nR
epub
lic o
f K
orea
Ger
man
yFr
ance
Italy
Uni
ted
Kin
gdom
Irela
nd19
7023
.5a
31.6
50.2
i55
.2n
35.1
12.6
37.8
32.0
21.7
37.0
44.8
53.2
1980
19.5
b34
.7f
49.5
j69
.131
.114
.739
.734
.918
.349
.650
.757
.119
9015
.532
.940
.551
.025
.417
.633
.131
.210
.138
.839
.351
.119
9115
.5-
-44
.424
.816
.134
.136
.09.
938
.738
.550
.219
9215
.133
.139
.637
.124
.515
.133
.433
.99.
939
.937
.249
.819
9315
.132
.837
.634
.524
.314
.532
.731
.89.
639
.236
.147
.719
9414
.9-
35.0
30.2
24.3
13.4
31.7
30.4
9.2
38.7
34.2
46.2
1995
14.3
-32
.727
.624
.012
.930
.429
.29.
038
.132
.645
.819
9614
.0-
31.1
24.9
23.4
12.2
29.5
27.8
8.3
37.4
31.7
45.5
1997
13.6
28.8
30.3
23.6
22.8
11.9
28.8
27.0
8.2
36.2
30.6
43.5
1998
13.4
28.5
28.1
22.3
22.5
12.1
28.2
25.9
8.0
35.7
30.1
41.5
1999
13.4
27.9
25.7
21.9
22.2
11.1
27.8
25.6
8.1
36.1
29.8
-20
0012
.828
.124
.722
.721
.511
.127
.325
.08.
234
.929
.7-
2001
12.8
28.2
24.5
22.6
20.9
11.2
26.2
23.5
8.1
34.8
29.3
36.6
2002
12.6
28.2
23.1
22.1
20.3
11.1
26.3
23.2
8.3
34.0
29.2
36.3
2003
12.4
28.4
22.9
-19
.711
.2-
22.6
8.3
33.7
29.3
35.3
Uni
ted
Sta
tes
Aus
tralia
Can
ada
New
Ze
alan
dEu
rope
an U
nion
(a
vera
ge)

WP-246-External-En.doc 37
Abs
olut
e ch
ange
19
70-1
980
18.1
10.3
1.5
18.3
-1.7
12.0
-2.
2-6
.0-
--
-19
80-1
990
2.9
2.8
0.2
-3.3
-10.
4-0
.2-0
.3-6
.8-9
.8-
--
-19
90-2
003
1.6
-2.8
-5.2
-4.9
-2.0
1.4
a3.
7-6
.5d
-11.
5a
-43.
6j
-19.
3j
-21.
2j
-18.
2j
1970
-200
322
.810
.3-3
.510
.1-1
4.2
13.3
b3.
4c
-11.
2e
-27.
3b
--
--
N
otes
: a=1
973;
b=1
983;
c=1
973-
1981
; d=1
983-
1990
; e=1
983-
2003
; f=1
984;
g=1
984-
1990
; h=1
984-
2003
; i=1
976;
j=19
82; k
=197
6-19
82; l
=198
2-19
90; m
=197
6-20
03; n
=197
1;
o=19
71-1
980;
p=1
990-
2002
; q=1
970-
2002
. So
urce
: Jel
le V
isse
r, “U
nion
mem
bers
hip
stat
istic
s in
24
coun
tries
,” M
onth
ly L
abor
Rev
iew
, Jan
uary
200
6, p
. 45.
Year
Finl
and
Swed
enN
orw
ayD
enm
ark
Net
herla
nds
1970
51.3
67.7
56.8
60.3
36.5
42.1
-28
.962
.8-
--
-19
8069
.478
.058
.378
.634
.854
.112
.931
.156
.7-
--
-19
9072
.580
.858
.575
.324
.353
.912
.524
.346
.9-
78.8
78.7
53.1
1991
75.5
80.6
58.1
75.8
24.1
54.3
14.7
22.7
45.5
--
--
1992
75.4
83.3
58.1
75.8
25.2
54.3
16.5
23.0
44.3
--
--
1993
78.4
83.9
58.0
77.3
25.9
55.0
18.0
22.9
43.2
--
--
1994
80.7
83.8
57.8
77.5
25.6
54.7
17.6
23.3
41.4
--
--
1995
80.3
83.1
57.3
77.0
25.7
55.7
16.3
22.8
41.1
63.4
46.3
57.3
32.9
1996
80.4
82.7
56.3
77.1
25.1
55.9
16.1
22.9
40.1
--
--
1997
79.5
82.2
55.5
75.3
25.1
56.0
15.7
22.6
38.9
--
--
1998
78.0
81.3
55.5
75.6
24.5
55.4
16.4
21.7
38.4
32.8
--
24.2
1999
76.3
80.6
54.5
74.1
24.6
55.1
16.2
21.0
37.4
--
--
2000
15.0
79.1
53.7
73.3
23.1
55.6
16.1
19.4
36.5
--
--
2001
74.5
78.0
52.8
72.5
22.5
-16
.117
.835
.719
.927
.036
.114
.720
0274
.878
.053
.0-
22.4
55.4
16.2
-35
.4-
--
-20
0374
.178
.053
.370
.422
.3-
16.3
--
--
--
Switz
erla
ndAu
stria
Spai
nH
unga
ryC
zech
R
epub
lic
Slov
akia
Pola
ndBe
lgiu
m

WP-246-External-En.doc 38
4.2. Trends in trade union membership in the chemical industry
4.2.1. Overview Although there are no official statistics on the current unionization in the global chemical industry, a fall in trade union membership appears to be an undeniable trend, with some convincing statistical evidence. According to UNIDO Industrial Statistics, employment figures in the industrial chemical segments in the chemical industry are estimated to have dropped from 8.8 million people in 1995 to about 8 million in 1999 (see figure 5). A decline in employment therefore seems to be a clear trend. (See also Appendix 1. Evolution of overall employment and female employment in the industrial chemicals sector, selected countries, 1990-2002)
Figure 5. Evolution of global employment in the industrial chemicals sector, 1995-99 (estimate)
7,600,000
7,800,000
8,000,000
8,200,000
8,400,000
8,600,000
8,800,000
9,000,000
1995 1996 1997 1998 1999
Source: UNIDO INDUSTAT 3 2005 ISIC Rev. 2.
A fall in global employment in the chemical industry may account for the lower number of union members at national level. As shown in table 14, in Austria, for example, the Chemical Workers’ Union lost about 37 per cent of its membership (or 26,218 members) between 1970 and 1996, a drop from 69,919 in 1970 to 43,701 in 1996. Similarly, the metalworkers’ union lost 26 per cent of its members, a decrease from 283,006 in 1970 to 210,469 in 1996. However, trade unionization numbers at the national trade union confederation (ÖGB) increased with the recruitment of 14,794 new members, bringing the total to about 1.5 million in 1996. This is because a fall in union membership in the manufacturing sector was compensated by a rise in the service sectors. For example, the Union of Hotel, Restaurant and Personal Service Workers gained 13,237 new members between 1970 and 1996 (an increase of some 34 per cent), bringing the figure to 51,673. Similarly, with 9,115 new members the
Figure 5. Evolution of global employment in the industrial chemicals sector, 1995-99 (estimate)

WP-246-External-En.doc 39
Commerce and Transport Workers’ Union increased its membership from 27,233 in 1970 to 36,348 in 1996, a rise of about 33 per cent.
1970 1975 1980 1985 1990 1995 1996
Union of Construction and Wood Workers 192,022 190,855 197,575 184,797 185,065 184,257 175,825Chemical Workers' Union 69,919 67,458 64,824 59,591 56,998 46,525 43,701Union of Workers in Printing and Paper Trade 25,334 24,824 24,280 23,662 23,362 19,585 19,287Commerce and Transport Workers' Union 27,233 30,559 35,330 38,120 37,855 37,541 36,348Union of Hotel, Restaurant and Personal Service Workers 38,436 41,889 43,378 52,372 53,656 52,280 51,673Union of Agriculture, Food and Allied Industries 89,652 70,445 66,758 62,611 57,904 50,576 47,678Union of Metal, Mining and Power Supply Workers 283,006 281,787 273,841 251,521 239,839 219,462 210,469Union of Textile, Clothing and Leather Workers 69,146 66,596 60,224 47,510 38,094 25,215 22,127
Union of the Private Sector's White-collar Workers 263,565 300,127 338,290 347,215 337,564 326,372 315,434Blue-collar unions (private sector) total 794,748 774,413 766,210 720,184 692,773 635,441 607,108White collar unions (private sector) total 263,565 300,127 338,290 347,215 337,564 326,372 315,434Public sector unions total 446,506 498,134 539,901 586,298 598,228 605,074 596,492ÖGB total 1,520,259 1,587,643 1,660,985 1,671,381 1,644,841 1,583,176 1,535,053Trade union density (%) 58 54 53 53 47 43 43
Blue-collar unions (private sector)
White-collar unions (private sector)
Source: Jeremy Waddington and Reiner Hoffmann, Trade Unions in Europe - Facing Challenges and Searching for Solutions , 2000, pp. 91-93.
Table 14. Evolution of trade union membership in Austria, by sector, 1970-96
Table 15 shows the evolution of trade union membership for central and sectoral organizations in Norway between 2002 and 2005. The Norwegian Union of Chemical Industry Workers lost 2,649 members between 2002 and 2005, or about 9 per cent of the total. Similar to the case in Austria, trade unions in the manufacturing sector saw their membership decline, while a service trade union gained new members, going from 59,138 in 2002 to 60,399 in 2005. A rise in the membership of salaried employees’ trade unions added 11,447 members to the national total of unionized workers, an increase from 1,505,995 in 2002 to 1,517,442 in 2005.
Table 14. Evolution of trade union membership in Austria, by sector, 1970-96
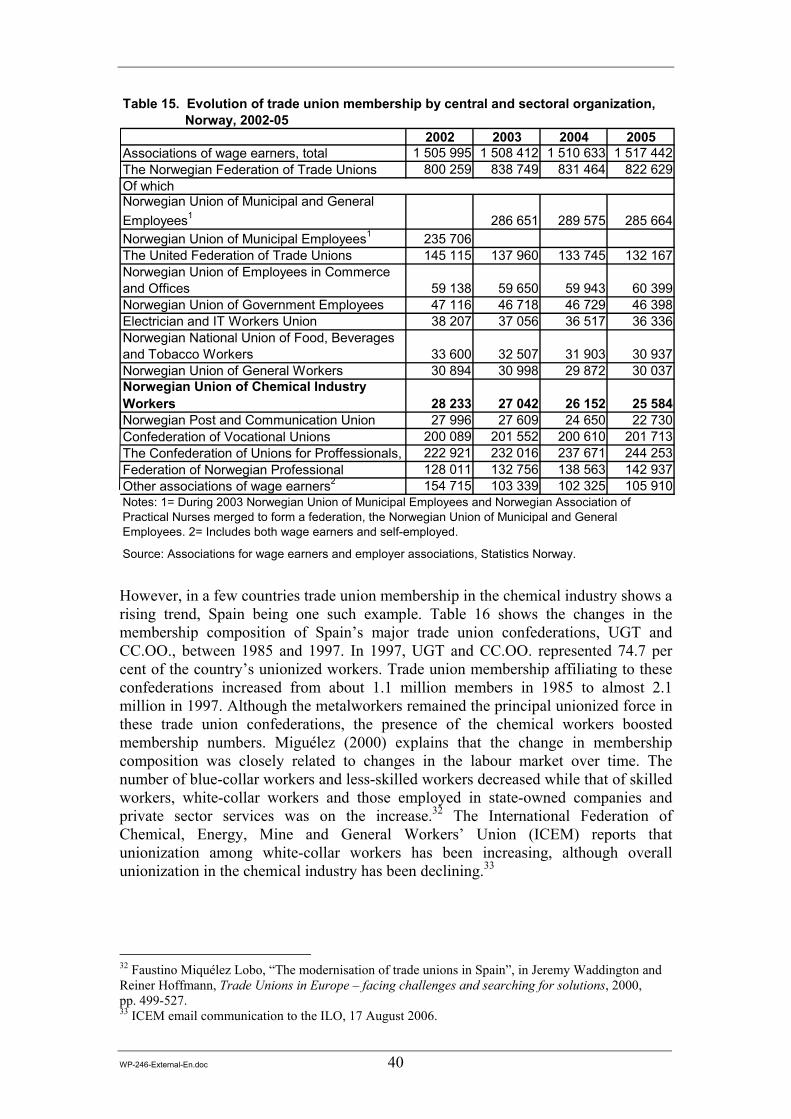
WP-246-External-En.doc 40
Table 15. Evolution of trade union membership by central and sectoral organization, Norway, 2002-05
2002 2003 2004 20051 505 995 1 508 412 1 510 633 1 517 442 800 259 838 749 831 464 822 629
Norwegian Union of Municipal and General Employees1 286 651 289 575 285 664Norwegian Union of Municipal Employees1 235 706The United Federation of Trade Unions 145 115 137 960 133 745 132 167Norwegian Union of Employees in Commerce and Offices 59 138 59 650 59 943 60 399Norwegian Union of Government Employees 47 116 46 718 46 729 46 398Electrician and IT Workers Union 38 207 37 056 36 517 36 336Norwegian National Union of Food, Beverages and Tobacco Workers 33 600 32 507 31 903 30 937Norwegian Union of General Workers 30 894 30 998 29 872 30 037Norwegian Union of Chemical Industry Workers 28 233 27 042 26 152 25 584Norwegian Post and Communication Union 27 996 27 609 24 650 22 730
200 089 201 552 200 610 201 713 222 921 232 016 237 671 244 253 128 011 132 756 138 563 142 937 154 715 103 339 102 325 105 910Other associations of wage earners2
Associations of wage earners, totalThe Norwegian Federation of Trade Unions
Source: Associations for wage earners and employer associations, Statistics Norway.
Notes: 1= During 2003 Norwegian Union of Municipal Employees and Norwegian Association of Practical Nurses merged to form a federation, the Norwegian Union of Municipal and General Employees. 2= Includes both wage earners and self-employed.
Of which
Confederation of Vocational UnionsThe Confederation of Unions for Proffessionals, Federation of Norwegian Professional
However, in a few countries trade union membership in the chemical industry shows a rising trend, Spain being one such example. Table 16 shows the changes in the membership composition of Spain’s major trade union confederations, UGT and CC.OO., between 1985 and 1997. In 1997, UGT and CC.OO. represented 74.7 per cent of the country’s unionized workers. Trade union membership affiliating to these confederations increased from about 1.1 million members in 1985 to almost 2.1 million in 1997. Although the metalworkers remained the principal unionized force in these trade union confederations, the presence of the chemical workers boosted membership numbers. Miguélez (2000) explains that the change in membership composition was closely related to changes in the labour market over time. The number of blue-collar workers and less-skilled workers decreased while that of skilled workers, white-collar workers and those employed in state-owned companies and private sector services was on the increase.32 The International Federation of Chemical, Energy, Mine and General Workers’ Union (ICEM) reports that unionization among white-collar workers has been increasing, although overall unionization in the chemical industry has been declining.33
32 Faustino Miquélez Lobo, “The modernisation of trade unions in Spain”, in Jeremy Waddington and Reiner Hoffmann, Trade Unions in Europe – facing challenges and searching for solutions, 2000, pp. 499-527. 33 ICEM email communication to the ILO, 17 August 2006.
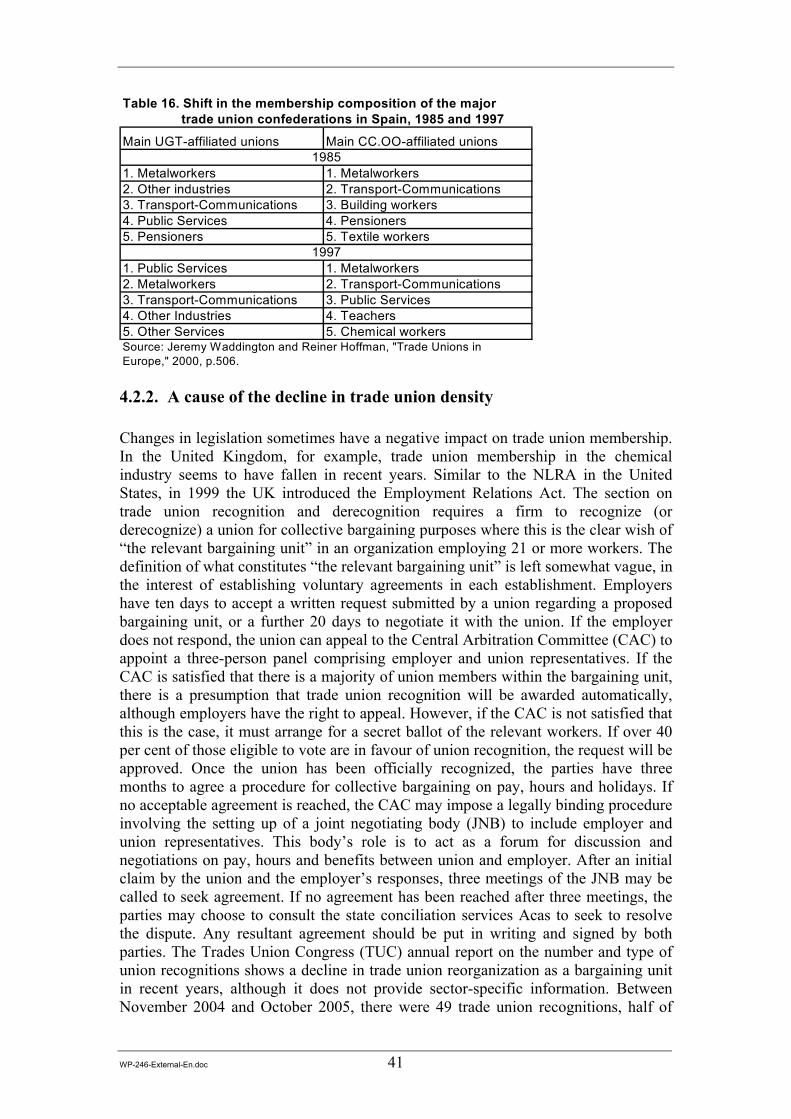
WP-246-External-En.doc 41
Table 16. Shift in the membership composition of the major trade union confederations in Spain, 1985 and 1997
Main UGT-affiliated unions Main CC.OO-affiliated unions
1. Metalworkers 1. Metalworkers2. Other industries 2. Transport-Communications3. Transport-Communications 3. Building workers4. Public Services 4. Pensioners5. Pensioners 5. Textile workers
1. Public Services 1. Metalworkers2. Metalworkers 2. Transport-Communications3. Transport-Communications 3. Public Services4. Other Industries 4. Teachers5. Other Services 5. Chemical workers
1985
1997
Source: Jeremy Waddington and Reiner Hoffman, "Trade Unions in Europe," 2000, p.506.
4.2.2. A cause of the decline in trade union density Changes in legislation sometimes have a negative impact on trade union membership. In the United Kingdom, for example, trade union membership in the chemical industry seems to have fallen in recent years. Similar to the NLRA in the United States, in 1999 the UK introduced the Employment Relations Act. The section on trade union recognition and derecognition requires a firm to recognize (or derecognize) a union for collective bargaining purposes where this is the clear wish of “the relevant bargaining unit” in an organization employing 21 or more workers. The definition of what constitutes “the relevant bargaining unit” is left somewhat vague, in the interest of establishing voluntary agreements in each establishment. Employers have ten days to accept a written request submitted by a union regarding a proposed bargaining unit, or a further 20 days to negotiate it with the union. If the employer does not respond, the union can appeal to the Central Arbitration Committee (CAC) to appoint a three-person panel comprising employer and union representatives. If the CAC is satisfied that there is a majority of union members within the bargaining unit, there is a presumption that trade union recognition will be awarded automatically, although employers have the right to appeal. However, if the CAC is not satisfied that this is the case, it must arrange for a secret ballot of the relevant workers. If over 40 per cent of those eligible to vote are in favour of union recognition, the request will be approved. Once the union has been officially recognized, the parties have three months to agree a procedure for collective bargaining on pay, hours and holidays. If no acceptable agreement is reached, the CAC may impose a legally binding procedure involving the setting up of a joint negotiating body (JNB) to include employer and union representatives. This body’s role is to act as a forum for discussion and negotiations on pay, hours and benefits between union and employer. After an initial claim by the union and the employer’s responses, three meetings of the JNB may be called to seek agreement. If no agreement has been reached after three meetings, the parties may choose to consult the state conciliation services Acas to seek to resolve the dispute. Any resultant agreement should be put in writing and signed by both parties. The Trades Union Congress (TUC) annual report on the number and type of union recognitions shows a decline in trade union reorganization as a bargaining unit in recent years, although it does not provide sector-specific information. Between November 2004 and October 2005, there were 49 trade union recognitions, half of
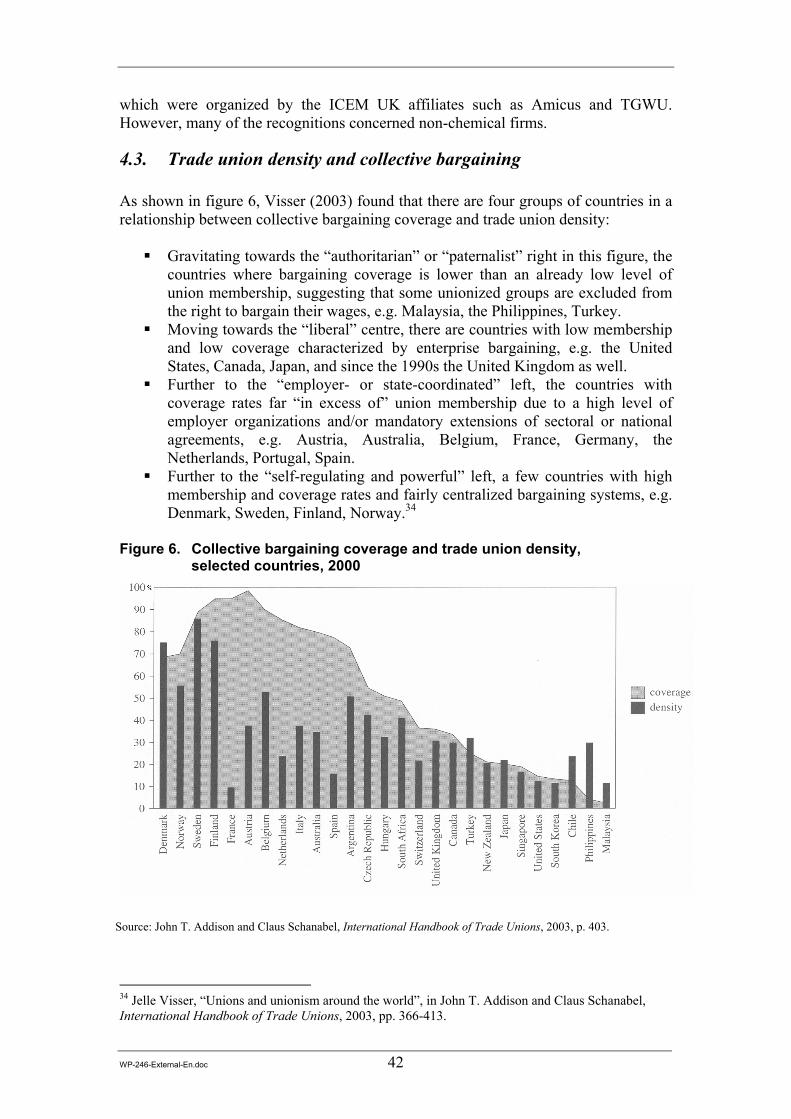
WP-246-External-En.doc 42
which were organized by the ICEM UK affiliates such as Amicus and TGWU. However, many of the recognitions concerned non-chemical firms.
4.3. Trade union density and collective bargaining As shown in figure 6, Visser (2003) found that there are four groups of countries in a relationship between collective bargaining coverage and trade union density:
Gravitating towards the “authoritarian” or “paternalist” right in this figure, the countries where bargaining coverage is lower than an already low level of union membership, suggesting that some unionized groups are excluded from the right to bargain their wages, e.g. Malaysia, the Philippines, Turkey.
Moving towards the “liberal” centre, there are countries with low membership and low coverage characterized by enterprise bargaining, e.g. the United States, Canada, Japan, and since the 1990s the United Kingdom as well.
Further to the “employer- or state-coordinated” left, the countries with coverage rates far “in excess of” union membership due to a high level of employer organizations and/or mandatory extensions of sectoral or national agreements, e.g. Austria, Australia, Belgium, France, Germany, the Netherlands, Portugal, Spain.
Further to the “self-regulating and powerful” left, a few countries with high membership and coverage rates and fairly centralized bargaining systems, e.g. Denmark, Sweden, Finland, Norway.34
Figure 6. Collective bargaining coverage and trade union density,
selected countries, 2000
34 Jelle Visser, “Unions and unionism around the world”, in John T. Addison and Claus Schanabel, International Handbook of Trade Unions, 2003, pp. 366-413.
Source: John T. Addison and Claus Schanabel, International Handbook of Trade Unions, 2003, p. 403.

WP-246-External-En.doc 43
Where trade unionization is on the decrease, the role of employers has been important in the conclusion of sectoral collective agreements. As shown in figure 7, sectoral agreements remain the cornerstone of industrial relations systems in Western European countries. The conclusion of collective agreements is highly dependent on the employers’ attitudes and motivations. In Germany, it is said that the metalworking employers’ organization, Gesamtmetall, is in favour of a complete overhaul of the collective bargaining system, while BAVC, the chemical employers’ organization, is keen to preserve the main format of sectoral bargaining, advocating a series of gradual changes and reforms. The German chemical industry is seen as a sector that seems able to strike rather innovative deals. This is because the industry contains a very diverse mix of employers, ranging from large multinationals which can afford to pay well above the collectively agreed minimum, to much smaller, domestic-oriented companies which may be struggling to pay the minimum agreed rates. Figure 7. Organization rate of employers in EU-15 and EU accession
countries, 2000
Source: Employment and Social Affairs, European Commission This chapter attempted to reveal the relationship between trade union density and social partners’ bargaining power in concluding collective agreements. As a clear trend, trade union membership has been decreasing in an overwhelming number of countries. It is impossible to give a reliable figure regarding the unionization rate in the chemical industry. Although it is still an assumption, some indirect evidence indicates that this rate is on the decline in many countries, the only exceptions being a number of small chemicals-producing countries. A recent study shows that there is a positive relationship between collective agreement coverage and trade union density. Besides these general trends, social partners’ familiarity with collective bargaining and their recognition of its contribution towards forming healthy industrial relations plays a pivotal role in collective bargaining.

WP-246-External-En.doc 44
5. Industrial disputes Industrial action is the most powerful dispute-resolving instrument. For example, in April 2005, Akzo Nobel’s employees in the Netherlands were threatening strike action following a bargaining deadlock. Employees at several establishments were prepared to carry out wildcat strikes. A meeting on 20 April 2005 brought together some 200 members of the FNV Bondgenoten, the CNV Bedrijvenbond, the VHP and De Unie. The breaking point in the negotiations concerned the company’s plan to make the pension fund independent.35 In the chemical industry in Europe there have been relatively few industrial disputes in recent years. The German chemical industry has seen no major industrial dispute since 1971. Similarly, the situation in Switzerland shows that the chemical industry is likely to confront fewer strikes than other sectors (see table 17). Table 17. Collective industrial disputes in Switzerland by sector and issue, 1990-99
SectorNo. of disputes
No. of firms affected
No. of workers involved
Total No. of lost working days
Textiles 2 2 141 5,991Printing 4 234 7,091 10,531Art goods 1 1 40 200Stone and earth 1 13 185 603Metalworking 2 2 382 1,589Engineering and vehicle construction 2 2 97 485Other trades 1 1 130 325Construction 5 125 808 1,131Trade 2 5 20 49Social services 3 3 158 190Chemicals 2 2 710 1,070Cleaning 1 1 15 30Public services 6 15 22,091 31,466Finance and insurance 1 4 560 980
Pay 15 147 23,450 33,605Collective agreements 7 249 7,226 13,774
Other (incl. trade union rights, recruitment, redundancy, restructuring) 11 14 1,752 7,261Total 33 410 32,428 54,640
Issue at stake
Source: Swiss Secretariat for Economic Affairs.
35 “Further collective bargaining”, EIRR 376, May 2005, p. 11.

WP-246-External-En.doc 45
In Switzerland, collective industrial disputes are relatively rare. This is a reflection of institutionalized cooperation between employers and workers in the country. Collective agreements in Switzerland generally include peace clauses. This was inspired by the 1937 peace accord in the engineering sector, and peace clauses were subsequently included in the chemicals sector and other sectoral collective agreements. Peace clauses commit trade unions and employers to the peaceful resolution of conflicts and have established a multi-stage conciliation process, with the possibility of compulsory arbitration. Employers see these clauses as a minimum bargaining requirement. This is attested by the low number of industrial disputes in the chemical industry in the country. During the 1990s, the chemical industry recorded only two disputes at two companies, involving 710 employees. This is less than in other sectors: in the printing sector, for example, there were four disputes involving 234 companies with over 7,000 employees, and in the construction industry five disputes, involving over 125 firms with more than 800 employees.

WP-246-External-En.doc 46
6. Teamworking
6.1. General considerations The term “teamworking” is generally defined as a situation where an individual worker performs multiple tasks to set rules and standards within a semi-autonomous group. In Germany, for example, this concept gained in prominence when the German industry encountered increased international competition. In 1996, the social partners in the German chemical industry created an accord easing the introduction of teamworking at company level. As production techniques and systems differ from one company to another, it was impossible to introduce an accord uniformly applying throughout the industry. The agreement thus provided a framework allowing each company or division within a company to develop its particular model. This has resulted in increasing companies’ flexibility to respond to product cycles linked to global competition, as they could have highly qualified workers to respond quickly to new tasks. Therefore, the agreement represented a framework document on the basis of which a company’s works council and management could conclude local agreements. Its main provisions are given in box 2. Box 2. Framework agreement on teamworking in Germany
For the definition of teamworking to be met, there must be an employment structure in which a group of workers collectively carry out pre-agreed functions, having independent responsibility for the task and having control over the results. This would be the case when the group has greater independence and responsibility beyond performing new tasks as a result of continuously changing production methods. Part of the functions and responsibilities of management would be integrated into the group, within the limitations allowed by producers, experience, legal requirements such as health and safety, and company conditions. The autonomy of the group itself would be dependent on differing production needs and the extent to which responsibilities could be transferred. The extent of a team’s autonomy would also depend on the degree to which workers were prepared to take greater responsibility and a more self-determining role.
The interests of the employee and the employer must be balanced equally. The advantage for employers is that they obtain flexible, low-cost work organization that is customer- and quality-oriented. In turn, employees have increased scope for participation, making the work and decision-making process more transparent. Teamworking requires qualified, independent and motivated workers who, through their ideas and knowledge of the job and production processes, have an input – as part of the notion of “continuous improvement”. This creates a bridge between increased competition and the need to humanize the workplace.
The role of management needs to be changed. Transferring tasks and responsibilities shortens the decision-making process and reduces hierarchical levels and coordination costs, but affects the links between the team and management and control over the team. Therefore, the

WP-246-External-En.doc 47
foreman would have a central role to play. The size of the group is dependent upon the qualifications and functions of
the workers, and limited to the need to maintain high levels of health and safety. Team size would be determined by the collective function to be performed – certain functions could still be performed by one individual.
The group elects a spokesperson from within the team to coordinate the group’s opinion and represent it in discussions with other teams and management. The particulars of the election process and function of the spokesperson can be decided at company level.
The group’s discussions are to take place regularly and during working hours in order to air criticism and opinions openly, taking into account the present functions and production of the team and the company’s requirements. The contents of the discussion will be voted upon at the end of the meeting and will establish the goals of the team.
Employees and employers should be given training to be able to perform new roles within the team.
There should be greater cooperation between the employer and the works council, in keeping with the view that modern forms of work organization, such as teamworking, require a socially responsible partnership.
Source: “Teamworking in chemicals and engineering”, EIRR 274, November 1996, pp. 21-23.
6.2. Quality Circles activities Boehringer Mannheim’s case in India shows that Quality Circles (QC) activities need the cooperation of the management at the worksites as well as that of the employees. The case in question led to the failure to introduce QC at an Indian pharmaceutical company because of strong opposition by local management and trade union. More tragically, the final outcome was closure of the plant due to harsh global competition. Nevertheless, the case demonstrates that where workers and trade union are sceptical about changing work organization, the plan can never be successful unless it enjoys full support from the management and trade unions at the workplace. A summary of the Boehringer Mannheim case is given below. Boehringer has a plant on the outskirts of Mumbai (formerly Bombay) and regional and zone offices spread across India. The company is unionized through a company-based trade union representing all 600 factory employees. The company and the trade union had a good, constructive relationship. In order to improve productivity and industrial relations, an expatriate managing director decided to introduce employee empowerment schemes. The widely shared managerial perception was that the problem lay neither with employees nor with the trade union, but with a trade union general secretary who epitomized the culture of adversity. The general secretary had created an effective barrier between labour and management, and the latter hoped that employee empowerment would redress this problem by helping others to grow. The most serious matter was the union’s opposition. The union had no interest at all in shop-floor empowerment. While agreeing that poor productivity could push the company into losses and put jobs in jeopardy, union leaders attributed every problem
WP-246-External-En.doc 48
to bad management. The union secretary claimed that the company would be in better health if only management had listened to him on a range of issues, from finance and marketing to corporate policy. As for small-group activity, his view was simply that a union was not necessary if workers could take their own decisions. The managing director was meanwhile toying with radical ideas. He wanted small groups made up of workers, supervisors, and middle managers to be not only empowered to take work-related decisions but also provided with the money with which to implement them. There was nothing in his proposals to threaten the union since the work groups were to leave negotiated issues well alone and concentrate on quality, productivity, safety, and efficient material usage. To reassure the leadership, management offered to create a second tier which would draw the union into a participative relationship over the very same issues. The leaders were unimpressed – it was to manage quality, productivity, and the like, they argued, that the company had appointed so many managers. The union did eventually budge from this position, but only after much persuasion. While many factors played a part, the argument that middle managers were more likely to perform in response to capillary pressure from below than hierarchical pressure from above seemed to have carried weight with some members of the union committee. They saw in work groups the opportunity to put shop-floor managers on the mat. With union opposition softened, a conference was called to hammer out the details for introducing QC. The conference was presented with a hybrid structure that combined the elements of HRM and participatory management, leaving collective bargaining intact. At the base of the new structure were to be scores of small groups called workstations, bringing together everyone in a section – whether worker, supervisor, or manager – to discuss quality, productivity and safety. These groups were empowered to take decisions without approval from any higher authority, but all decisions had to be unanimous. In addition, the workstations were themselves to elect a chairperson and secretary. Twenty per cent of every division’s budget was to be handed over to the workstations, to be spent on giving effect to these decisions, once again without the requirement of any external sanction. All this was much more than the work groups were being offered anywhere. The second tier was made up of six shop councils, once for each major area of activity, with the union and management nominating members in equal numbers. The councils were assigned 30 per cent of the division’s budget and asked to take up much the same issues as workstations, but at the higher level. The intention behind the creation of shop councils was to recognize the existence of the union and bring it within the ambit of cooperation. Together, the workstations and shop councils were deprived of one half of every division’s budget. The union saw little merit in all this. The union secretary argued that they were prepared to shift from adversity to cooperation if management would travel the entire distance and offer them parity representation on the Board of Directors. The managing director had indicated his willingness to create a third level which would enable union leaders to participate with himself and the vice-presidents in policy decisions, but formal membership of the board was a different matter in a country where participation at any level was a non-starter. Workstations, which were asked to meet for an hour during working hours every two weeks, began their work right away and settled down before long to serious discussions, even taking some decisions. Problems began to surface once the easy and
WP-246-External-En.doc 49
non-controversial issues had been run through. Meetings were lively, but contentious. Workers questioned managers on poor or wasteful manufacturing practices. Middle managers were hardly enthusiastic about shop-floor empowerment. Most middle managers were unsure of their powers, and did not quite know how far they could go in supporting a decision. Illustrative of this was a section chief who was blocking the suggestion for a hydraulic lift to decant heavy drums of chemicals because his vice-president thought it absurd for a labour-surplus company to invest in a labour-saving device. The section chief was being asked to determine democratically the very issues his superiors were treating hierarchically. A review six months on confirmed that senior managers were safely ensconced in enclaves of privilege, leaving those lower down to battle it out in workstations. Departmental heads, one level above section chiefs, were supposed to be on shop councils, discussing with union nominees the very same issues of quality, safety, and productivity, but not a single council had met in six months. While managers took no initiative, the union seemed similarly uninterested. Senior executives expected workstations and shop councils to enhance productivity and contribute to trust relations without themselves making any contribution to the process. Some 20 senior executives brought together to discuss these issues were asked what they would do if a workstation sought their approval for a decision. However, this process did not bear fruit, and the company’s serious financial difficulties made it impossible to continue implementing the empowerment processes.36
6.3. Outcomes of teamworking Introducing teamworking often entails some changes to the pay system. It leads to the introduction of gainsharing, where employees’ wage formulation is based on a company- or factory-wide scheme under which employees share in the financial gains made by the company as a result of its improved performance. This scheme is used to increase individual employees’ productivity. Gainsharing is a team-based pay system that seeks to provide an explicit link between business performance and team reward, with a view to enabling employees to be fully involved in achieving and exceeding targets and sharing in the financial gains. Gainsharing plans focus on the performance areas within the control of employees, and stress the need to improve such measures as added value, productivity, cost control, and sometimes product quality. The following case at BP gives an example of the introduction of gainsharing plans. At BP this move should be seen in the context of the major organizational change which the company began in the late 1980s, itself part of a wider company strategy aimed at improving business performance. By the early 1990s, for example, BPX had replaced its centralized management structure with a simpler “federated” arrangement, based on the organization’s 40 or so “assets.” The new company structure was aimed at providing greater management accountability and giving employees a clearer focus on business objectives. Under the company’s traditional reward strategy, employees received payments based on three elements:
36 E.A. Ramaswamy and F.B. Schiphorst, “Human resource management, trade unions and empowerment: two cases from India”, International Journal of Human Resource Management, 11;4, August 2000, pp. 664-680.

WP-246-External-En.doc 50
an annual base pay increase (linked broadly to the median market figure); a generic performance bonus, known as “performance opportunity pay”, paid
to the entire workforce at the end of each year based on the performance of the BP group as a whole; and
an annual “spot bonus” (an award recognizing good individual or team performance), payable from a fund equal to 1 per cent of the pay bill.
Gainsharing at BPX Europe was implemented for the first time in 1993. The initial programme operated on two levels:
the umbrella scheme covered 55 per cent of BPX Europe’s employees, operating under one set of company-wide performance targets;
the remaining 45 per cent of staff were covered by asset-tailored plans under which team rewards were linked to the performance of staff within a particular asset.
The terms of the company’s new reward strategy replaced the old individual performance bonus element of employees’ total remuneration package with a new term bonus (gainshare). BPX’s gainsharing programme linked payments to the completion of 1993 performance contracts, with specific rewards for exceeding the annual targets set out in the company’s business plan. These were defined as “stretch” targets – for achievement of exceptional performance. The awards ranged from 3 to 13 per cent and were paid as a percentage enhancement of employees’ basic salary. On completion of the 1993 gainsharing plan, the company identified a range of largely positive outcomes and feedback from employees. Employee feedback, in part, revealed that while the gainsharing rewards were seen as attractive, they might still be perceived as an alternative to the annual enhancement in pensionable basic pay. Using the experience gained from the 1993 programme, BPX Europe introduced a revised scheme in 1994, based on the following recommendations and objectives:
Simplifying and standardizing gainsharing plans; Involving employees in the development of plans; Encouraging more tailored plans and aligning gainsharing to asset objectives,
where possible; Making managers work at communicating a clear understanding of the
linkages affecting business performance; Increasing employee involvement and commitment through the use of
gainshare “focus groups” and regular monthly and quarterly reviews; and Reinforcing cost-reduction campaigns.
In line with the objectives, the 1994 programme sought to develop gainsharing as a reward for exceeding – rather than simply meeting – “the performance contract”, linking payments to “stretch” business targets (also known as “superordinate goals”). Under the new plan, employees were awarded a team bonus for “stretch performance beyond the business plan”. In other words, business plans focused on a number of key performance measures – production, cost and safety – with an additional element tied to the performance of BPX as a whole. The company identified a minimum “stretch”

WP-246-External-En.doc 51
standard for each performance target and where team performance exceeded this minimum target figure or “trigger”, employees received a team bonus or gainshare. Gainshare thus operates as one of three elements of the company’s reward strategy:
Base pay (broadly market median) – for delivery of the business plan; Team bonus (gainshare) – for performance beyond the plan; and Spot recognition – for exceptional performance or contribution of individuals
or teams.37 The chemical industry knows that teamworking could be an effective means of increasing productivity. However, it can also have adverse effects on the company and the employees if it is not adequately put in place. Misconceptions on teamworking seem to occur often because of miscommunication between the companies and workers and trade unions, and of mismanagement of information. Information should be adequate and given to workers and trade union in a timely fashion, namely before the new work organization is introduced. Studies suggest that teamworking often leads to the introduction of new wage and personnel management systems. This is because the success of teamworking is gauged by the achievements of the team as a whole. The proliferation of teamworking in the chemical industry, therefore, increased the popularity of wage systems closely relating to profitable gains of the particular units or departments in which workers are employed. In the next chapter we will examine how the chemical industry operates changes in its wage systems to meet the demands of this type of work organization.
37 “Gainsharing at BP Exploration”, EIRR 269, June 1996, pp. 24-28.
WP-246-External-En.doc 52
7. Wage system The wage system is one of the most frequently discussed industrial relations issues in the chemical industry because it is related to the industry’s competitiveness. Changes in wage systems appear to be closely linked to the demands for more flexible production and work organization systems and schemes. Many wage systems found in the chemical industry are intended to increase functional flexibility. Companies attempt to minimize hierarchies and empower the workforce in order to retain the competitive edge in quality product markets. Prevailing wage structures are designed to emphasize the link between pay and company performance rather than individual bonuses based on quantitative output. Chemical firms aim to make salaries competitive in the labour market, linked to the achievement of business objectives and intended to encourage and reward individual performance. In this chapter we will examine first how collective agreements govern the pay system in selected countries and, second, with the help of a few case studies, how the pay system has changed and what those changes reveal about the chemical company’s intent in operating them.
7.1. Pay system for salaried employees in the Finnish chemical industry According to the Collective Agreement for Salaried Employees in the Finnish Chemical Industry, effective between 16 February 2005 and 30 September 2007, the basic pay of a salaried employee comprises (1) an element related to duties and based on the job requirement grade and an individual element based on job performance, and (2) competence factors. In addition, a seniority-based bonus is paid to each salaried employee on the basis of his/her length of employment. Job requirement: the job-specific element of a salaried employee’s basic pay is decided on the basis of an evaluation system. Employees’ duties are measured on the basis of the evaluation, so that the job requirement and pay are systematically linked. An individual evaluation is based on the content of the duties performed and not on the employee performing those duties. Four factors are used in evaluating an employee’s job requirement:
1) The job characteristics factor is used to evaluate the requirement caused by the amount of independent judgement needed for the work. The information required for the judgement is extended and deepened not just by education but by experience. The job is regarded as being more demanding whenever: there is an increase in the number of situations involving judgement, said situations become increasingly different from each other, the time for making judgements becomes shorter and more pressing, there is an increase in the amount of extended specialist knowledge
needed to make decisions, the amount of regulations and systems by the authorities increases, work instructions become less detailed, and feedback is received more slowly and is more superficial.
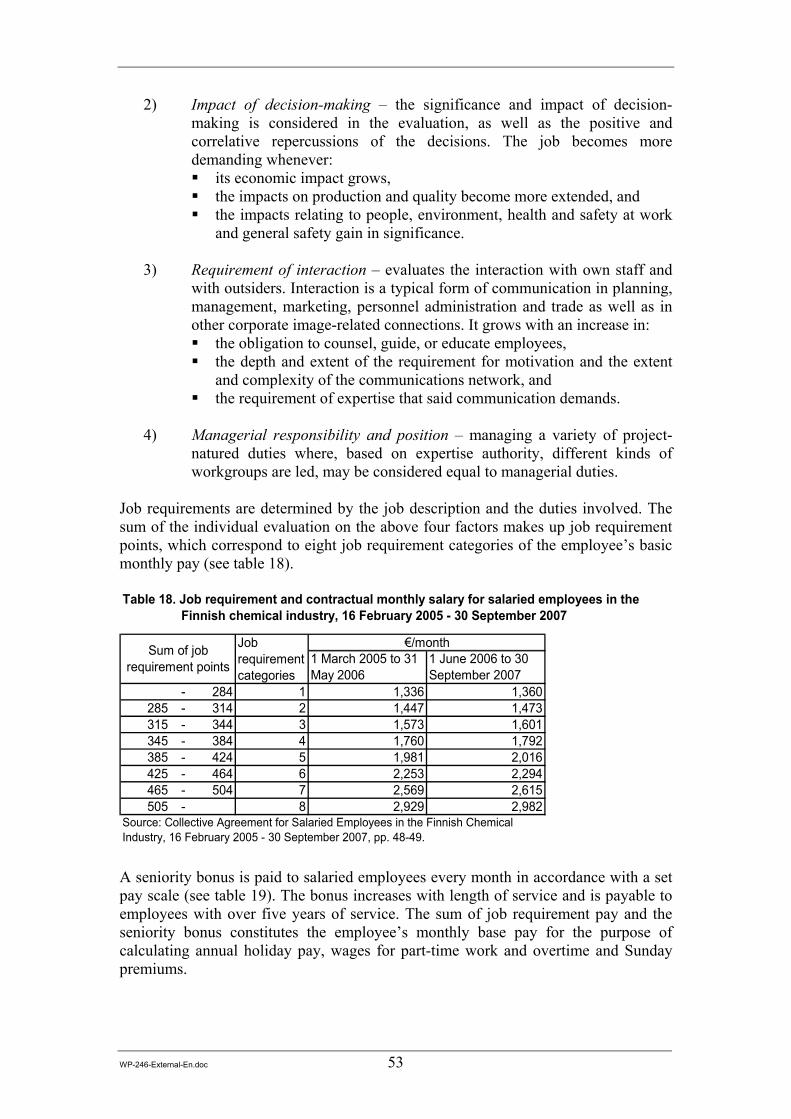
WP-246-External-En.doc 53
2) Impact of decision-making – the significance and impact of decision-making is considered in the evaluation, as well as the positive and correlative repercussions of the decisions. The job becomes more demanding whenever: its economic impact grows, the impacts on production and quality become more extended, and the impacts relating to people, environment, health and safety at work
and general safety gain in significance.
3) Requirement of interaction – evaluates the interaction with own staff and with outsiders. Interaction is a typical form of communication in planning, management, marketing, personnel administration and trade as well as in other corporate image-related connections. It grows with an increase in: the obligation to counsel, guide, or educate employees, the depth and extent of the requirement for motivation and the extent
and complexity of the communications network, and the requirement of expertise that said communication demands.
4) Managerial responsibility and position – managing a variety of project-
natured duties where, based on expertise authority, different kinds of workgroups are led, may be considered equal to managerial duties.
Job requirements are determined by the job description and the duties involved. The sum of the individual evaluation on the above four factors makes up job requirement points, which correspond to eight job requirement categories of the employee’s basic monthly pay (see table 18). Table 18. Job requirement and contractual monthly salary for salaried employees in the Finnish chemical industry, 16 February 2005 - 30 September 2007
1 March 2005 to 31 May 2006
1 June 2006 to 30 September 2007
- 284 1 1,336 1,360285 - 314 2 1,447 1,473315 - 344 3 1,573 1,601345 - 384 4 1,760 1,792385 - 424 5 1,981 2,016425 - 464 6 2,253 2,294465 - 504 7 2,569 2,615505 - 8 2,929 2,982
Source: Collective Agreement for Salaried Employees in the Finnish Chemical Industry, 16 February 2005 - 30 September 2007, pp. 48-49.
€/monthJob requirement categories
Sum of job requirement points
A seniority bonus is paid to salaried employees every month in accordance with a set pay scale (see table 19). The bonus increases with length of service and is payable to employees with over five years of service. The sum of job requirement pay and the seniority bonus constitutes the employee’s monthly base pay for the purpose of calculating annual holiday pay, wages for part-time work and overtime and Sunday premiums.
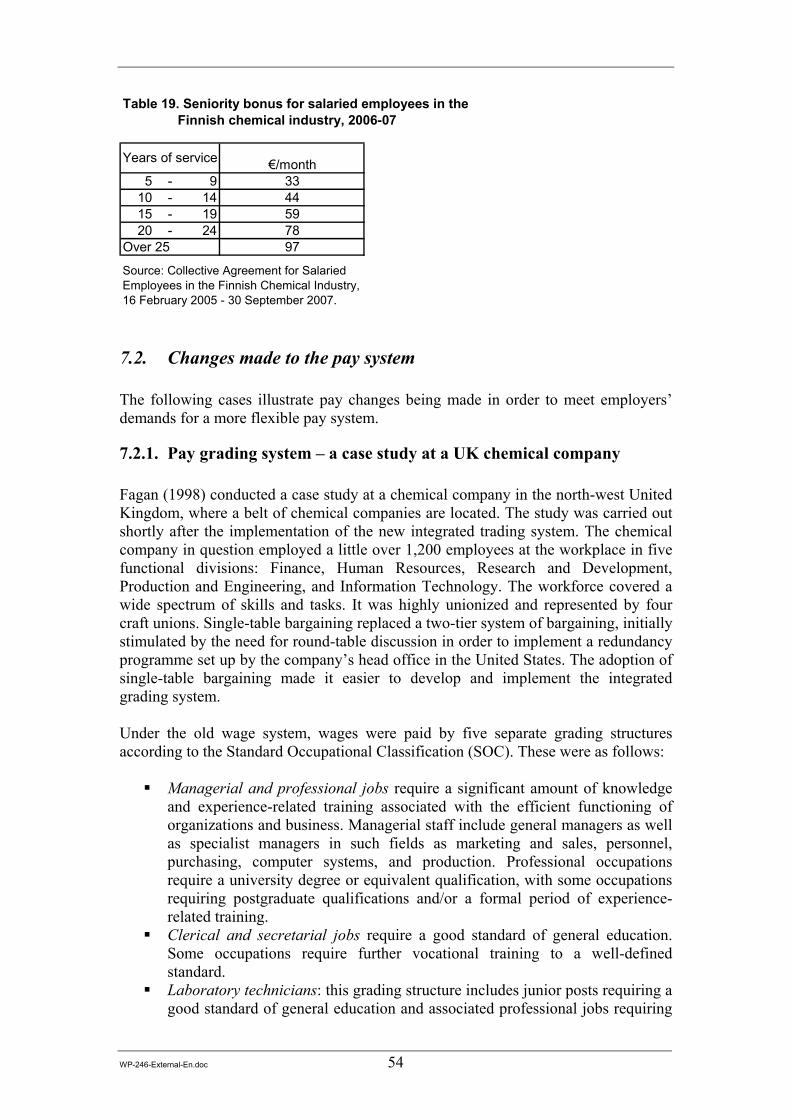
WP-246-External-En.doc 54
Table 19. Seniority bonus for salaried employees in the Finnish chemical industry, 2006-07
€/month5 - 9 33
10 - 14 4415 - 19 5920 - 24 78
97Over 25
Years of service
Source: Collective Agreement for Salaried Employees in the Finnish Chemical Industry, 16 February 2005 - 30 September 2007.
7.2. Changes made to the pay system The following cases illustrate pay changes being made in order to meet employers’ demands for a more flexible pay system.
7.2.1. Pay grading system – a case study at a UK chemical company Fagan (1998) conducted a case study at a chemical company in the north-west United Kingdom, where a belt of chemical companies are located. The study was carried out shortly after the implementation of the new integrated trading system. The chemical company in question employed a little over 1,200 employees at the workplace in five functional divisions: Finance, Human Resources, Research and Development, Production and Engineering, and Information Technology. The workforce covered a wide spectrum of skills and tasks. It was highly unionized and represented by four craft unions. Single-table bargaining replaced a two-tier system of bargaining, initially stimulated by the need for round-table discussion in order to implement a redundancy programme set up by the company’s head office in the United States. The adoption of single-table bargaining made it easier to develop and implement the integrated grading system. Under the old wage system, wages were paid by five separate grading structures according to the Standard Occupational Classification (SOC). These were as follows:
Managerial and professional jobs require a significant amount of knowledge and experience-related training associated with the efficient functioning of organizations and business. Managerial staff include general managers as well as specialist managers in such fields as marketing and sales, personnel, purchasing, computer systems, and production. Professional occupations require a university degree or equivalent qualification, with some occupations requiring postgraduate qualifications and/or a formal period of experience-related training.
Clerical and secretarial jobs require a good standard of general education. Some occupations require further vocational training to a well-defined standard.
Laboratory technicians: this grading structure includes junior posts requiring a good standard of general education and associated professional jobs requiring

WP-246-External-En.doc 55
a high-level vocational qualification, both of which involve some task-related training.
Craft workers (blue collar): craft jobs are differentiated from other manual jobs by a substantial period of formal work-based training, such as an apprenticeship.
Operatives and semi-skilled workers (blue collar): these jobs require the knowledge and experience necessary to operate industrial plants, vehicles and equipment, to assemble products and to carry out routine tests. Some jobs involve simple and routine tasks.
A problem inherent in the old wage system was that internal equity and fairness were not ensured. Each grading structure was associated with a separate salary structure, which was in turn associated with different systems of job evaluation and varying elements of performance-related pay. The unskilled and semi-skilled manual workers were graded using a factor-based job evaluation system. Craft grading, on the other hand, was based on formal qualifications gained through apprenticeships rather than on job content. However, the clerical and managerial grade systems were based on the Hay evaluation system. In these grades a system of performance-related pay was in operation but was not systematically applied. In some parts of the company it functioned virtually as an automatic 2-per cent incremental change, regardless of individual performance. The laboratory technician grading was based on a combined system, with a task-oriented assessment rewarded by regrading rather than by a performance pay supplement. As shown in figure 8, in the old wage structure there was a huge demarcation associated with narrowly defined jobs, combined with anomalies which resulted in promotions between grading structures being associated with a reduction in wages. Figure 8. Relative rates of pay in a UK chemical plant under the old grading
system, 1991 (excluding shift work allowances and overtime pay)
Source: Colette Fagan, “Payment Systems and Gender in the United Kingdom: Case Study of a Chemical Company,” Equal Pay in Europe? – Closing the Gender Wage Gap, ILO, 1998, p. 187.
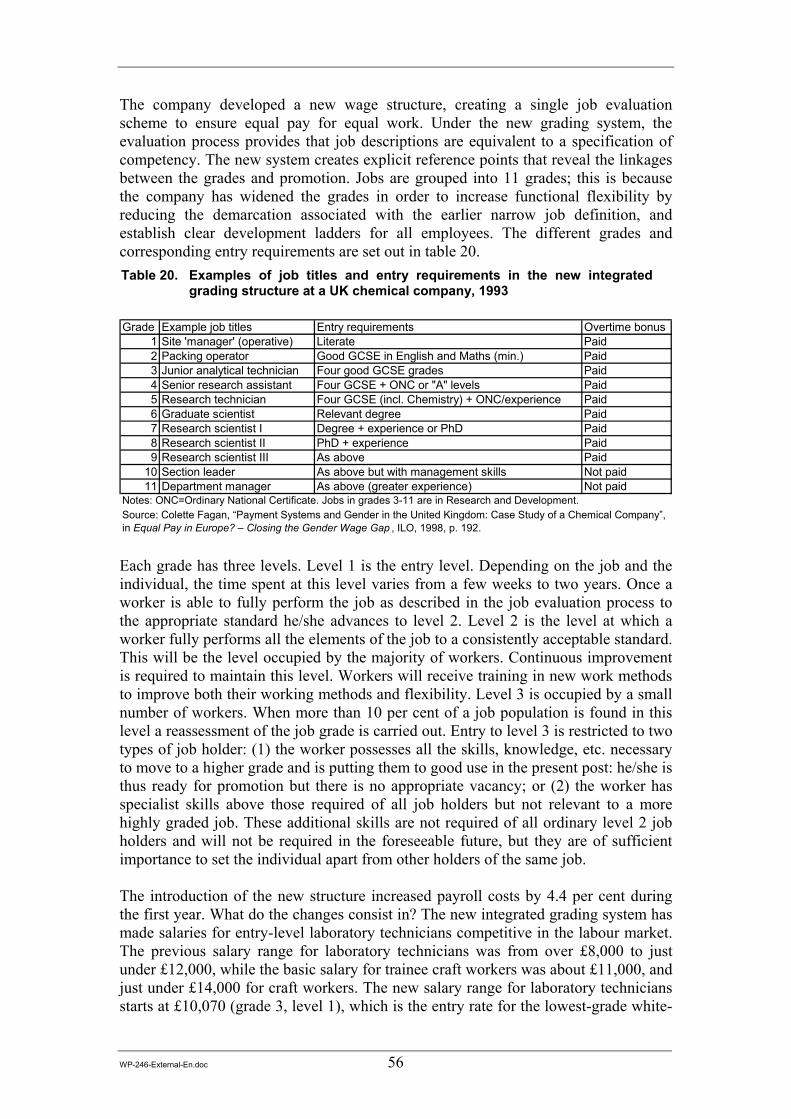
WP-246-External-En.doc 56
The company developed a new wage structure, creating a single job evaluation scheme to ensure equal pay for equal work. Under the new grading system, the evaluation process provides that job descriptions are equivalent to a specification of competency. The new system creates explicit reference points that reveal the linkages between the grades and promotion. Jobs are grouped into 11 grades; this is because the company has widened the grades in order to increase functional flexibility by reducing the demarcation associated with the earlier narrow job definition, and establish clear development ladders for all employees. The different grades and corresponding entry requirements are set out in table 20. Table 20. Examples of job titles and entry requirements in the new integrated grading structure at a UK chemical company, 1993
Grade Example job titles Entry requirements Overtime bonus1 Site 'manager' (operative) Literate Paid2 Packing operator Good GCSE in English and Maths (min.) Paid3 Junior analytical technician Four good GCSE grades Paid4 Senior research assistant Four GCSE + ONC or "A" levels Paid5 Research technician Four GCSE (incl. Chemistry) + ONC/experience Paid6 Graduate scientist Relevant degree Paid7 Research scientist I Degree + experience or PhD Paid8 Research scientist II PhD + experience Paid9 Research scientist III As above Paid
10 Section leader As above but with management skills Not paid11 Department manager As above (greater experience) Not paid
Notes: ONC=Ordinary National Certificate. Jobs in grades 3-11 are in Research and Development.Source: Colette Fagan, “Payment Systems and Gender in the United Kingdom: Case Study of a Chemical Company”, in Equal Pay in Europe? – Closing the Gender Wage Gap , ILO, 1998, p. 192. Each grade has three levels. Level 1 is the entry level. Depending on the job and the individual, the time spent at this level varies from a few weeks to two years. Once a worker is able to fully perform the job as described in the job evaluation process to the appropriate standard he/she advances to level 2. Level 2 is the level at which a worker fully performs all the elements of the job to a consistently acceptable standard. This will be the level occupied by the majority of workers. Continuous improvement is required to maintain this level. Workers will receive training in new work methods to improve both their working methods and flexibility. Level 3 is occupied by a small number of workers. When more than 10 per cent of a job population is found in this level a reassessment of the job grade is carried out. Entry to level 3 is restricted to two types of job holder: (1) the worker possesses all the skills, knowledge, etc. necessary to move to a higher grade and is putting them to good use in the present post: he/she is thus ready for promotion but there is no appropriate vacancy; or (2) the worker has specialist skills above those required of all job holders but not relevant to a more highly graded job. These additional skills are not required of all ordinary level 2 job holders and will not be required in the foreseeable future, but they are of sufficient importance to set the individual apart from other holders of the same job. The introduction of the new structure increased payroll costs by 4.4 per cent during the first year. What do the changes consist in? The new integrated grading system has made salaries for entry-level laboratory technicians competitive in the labour market. The previous salary range for laboratory technicians was from over £8,000 to just under £12,000, while the basic salary for trainee craft workers was about £11,000, and just under £14,000 for craft workers. The new salary range for laboratory technicians starts at £10,070 (grade 3, level 1), which is the entry rate for the lowest-grade white-
Table 20. Examples of job titles and entry requirements in the new integrated grading structure at a UK chemical company, 1993

WP-246-External-En.doc 57
collar employees such as junior analytical technicians, the standard rate being £10,600 (grade 3, level 2). In contrast, there was a smaller increase at the upper end of the salary range for laboratory technicians, with a salary of just over £12,000 in grade 5. Graduate laboratory workers and craft workers are in grade 6, on a standard salary of £14,300. As a result, laboratory technicians are better paid than in the past. The new system has also explicitly ranked the highest-level laboratory workers alongside other graduate professionals (grade 6) and reduced wage differentials between laboratory work grades and the more male-dominated craft grades. The new grading system has achieved a degree of internal equity. Whereas there used to be a greater number of grades for clerical jobs than for laboratory technicians, the new system has compressed the range for clerical workers. The grading of secretaries was standardized across departments as a result of integration. The new system has benefited those many clerical workers who were in the lowest grades under the old system. By putting clerical workers into grades 3 to 5, the integration explicitly ranked them alongside laboratory technicians and skilled production workers, but below the graduate and craft jobs in grade 6. Female laboratory technicians and clerical employees in the middle-level grades have benefited from the new system. The benefit for women in these middle-level graded jobs is in terms of wage increase and in some improvement in status through gains relative to the more male-dominated production jobs against which they have been ranked in the past. Overall, about 12 per cent of the total workforce received no wage increase. These groups of employees are concentrated in grades 2 and 3. Although women accounted for just over half the workforce in those two grades, most of the men in the same grades received only a small wage rise, particularly operatives. This was a result of the job evaluation scheme which removed the previous evaluative emphasis on factors connected with moving heavy weights, associated with male-dominated jobs (warehouse operatives being one example). Most women in production jobs were engaged in packing films, which did not involve moving heavy weights. In addition, overtime premiums were reduced and this has fed through into lower total salaries, particularly for men in these grades. In addition, during the transition to the new system salaries were capped in order to keep the maximum individual rise at 10 per cent. A total of 203 employees were concerned by this 10-per cent ceiling, 79 per cent (160 employees) of them men. This maximum pay rise was received by 21 per cent of men and 10 per cent of women. Most salaries capped at the 10-per cent rise were those of production managers/supervisors who had been re-graded from team leader positions because their job duties had expanded. These primary findings are set out in table 21.

WP-246-External-En.doc 58
Low
est
Hig
hest
Diff
eren
tial(%
)Lev
el 1
Leve
l 2Le
vel 3
Diff
eren
tial
leve
ls 1
-3(
%)
% o
f gra
de%
di
strib
utio
n of
'los
ers'
10
100
8,70
08,
700
n.a.
7,74
2.50
8,15
0.00
8,55
7.50
10.5
....
251
499,
000
10,5
0016
8,76
1.85
9,22
3.00
9,68
4.15
10.5
4415
355
459,
000
12,0
0033
10,0
70.0
010
,600
.00
11,1
30.0
010
.513
344
4357
9,50
017
,000
7910
,640
.00
11,2
00.0
011
,760
.00
10.5
66
538
628,
700
18,0
0010
711
,495
.00
12,1
00.0
012
,705
.00
10.5
44
622
7810
,500
17,5
0067
13,3
09.0
014
,300
.00
15,0
15.0
012
.86
77
2872
12,0
0022
,000
8315
,309
.00
16,5
50.0
017
,791
.00
16.2
1612
822
7816
,000
24,0
0050
17,2
80.0
019
,200
.00
21,1
20.0
022
.28
119
1288
17,5
00>
26,0
00>
5021
,285
.00
23,6
50.0
026
,015
.00
22.2
1712
10+
595
....
..26
,015
.00
28,6
16.5
031
,477
.15
21.0
....
11+
010
0..
....
31,4
77.1
534
,642
.87
38,1
07.1
621
.6..
..12
100
Not
es: n
.a.=
not a
pplic
able
. *Th
ese
figur
es a
re e
stim
ates
. +N
o da
ta fo
r gra
des
10 a
nd 1
1 w
ere
prov
ided
in th
e co
mpa
ny d
ocum
ent,
in p
art b
ecau
se th
e ne
w s
alar
y le
vels
had
not
bee
n ag
reed
at t
he ti
me.
In th
e se
cond
inte
rvie
w, t
he p
erso
nnel
man
ager
pro
vide
d th
e ag
reed
sal
ary
leve
ls fo
r the
se g
rade
s: g
rade
10
equa
l to
the
top
of g
rade
9, a
nd a
10-
per c
ent d
iffer
entia
l be
twee
n ea
ch le
vel i
n bo
th g
rade
s 10
and
11.
Est
imat
ed s
alar
y ra
nges
wer
e de
rived
usi
ng th
is in
form
atio
n an
d in
volv
ed m
akin
g th
e as
sum
ptio
n th
at g
rade
11
star
ts ro
ughl
y eq
ual t
o th
e to
p of
gra
de 1
0, fo
llow
ing
the
prac
tice
adop
ted
from
gra
de 5
upw
ards
in th
e st
ruct
ure.
++N
o da
ta w
ere
avai
labl
e fo
r gra
des
1, 1
0 an
d 11
, whi
ch a
ccou
nt fo
r ove
r 10
per c
ent o
f the
mal
e w
orkf
orce
and
less
than
1 p
er c
ent o
f fem
ale
wor
kers
.
Sour
ce: C
olet
te F
agan
, "Pa
ymen
t Sys
tem
s an
d G
ende
r in
the
Uni
ted
King
dom
: Cas
e St
udy
of a
Che
mic
al C
ompa
ny,"
in E
qual
Pay
in E
urop
e? -
Clo
sing
the
Gen
der W
age
Gap
, ILO
, 19
98, p
p.16
9-19
7.
New
sal
ary
leve
ls (i
n £)
Dis
tribu
tion
of 'l
oser
s'++
(th
ose
who
rece
ived
a
zero
pay
rise
in th
e tra
nsiti
on)
Tota
l 'lo
sers
' gra
des
2-9
Tabl
e 21
. Pre
-exi
stin
g an
d re
vise
d sa
lary
rang
es fo
r the
new
gra
ding
sys
tem
at a
UK
che
mic
al c
ompa
ny, 1
993
Pre-
exis
ting
sala
ry ra
nge
(in £
) (w
hen
post
s in
tegr
ated
into
new
sys
tem
*)
Mal
e sh
are
of
grad
e(%
)
Fem
ale
shar
e of
gr
ade(
%)
Gra
de
WP-246-External-En.doc 59
No wage system is perfect, nor can it address all the issues involved in attaining equity and fairness. The study stated the importance of the role of employer-employee relations for asserting internal equity and justice as a result of collective bargaining between trade unions and the company.38
7.2.2. Departure from qualification-based seniority pay system towards a job grading pay system Kao Corporation questioned the ability of a single unified company-wide pay system to meet a variety of employees’ demands on its wage system. In order to increase productivity, the company needed to change the pay system based on merit, closely linked to employees’ performance. A new system was thus introduced in 1999-2000. The old wage system was based on the individual’s job grades, strongly linked to seniority. Employees’ job grades were divided into three job categories. Under the old system, seniority elements used in deciding employees’ wage level accounted for about 40 per cent of basic pay. However, this was abolished in 1996. The seniority element was included in the allowance by individual’s job function. In 1988, the company changed the pay system for about 200 managerial employees from a seniority-based wage system to an annual system linked to individual performance. In 1996, the coverage of this yearly-based wage system was expanded to another 1,000 managerial employees. In addition, in 2000, the company introduced a bonus system linking pay to actual company performanceThe key policies that the company adopted for reforming the wage system were:
1) increasing the transparency of the pay system; 2) respecting the interests of individual employees; 3) making the wage level competitive against other competitors in the labour
market; 4) meeting the high return of investment; and 5) maintaining independence.
In order to realize these principles, the job function-based pay system was built on a balance of three Ps, which stand for Person (capability and competency), Position (job function) and Performance (pay). Figure 9 captures this concept.
38 Colette Fagan, "Payment Systems and Gender in the United Kingdom: Case Study of a Chemical Company", in Equal Pay in Europe? - Closing the Gender Wage Gap, ILO, 1998, pp. 169-197.
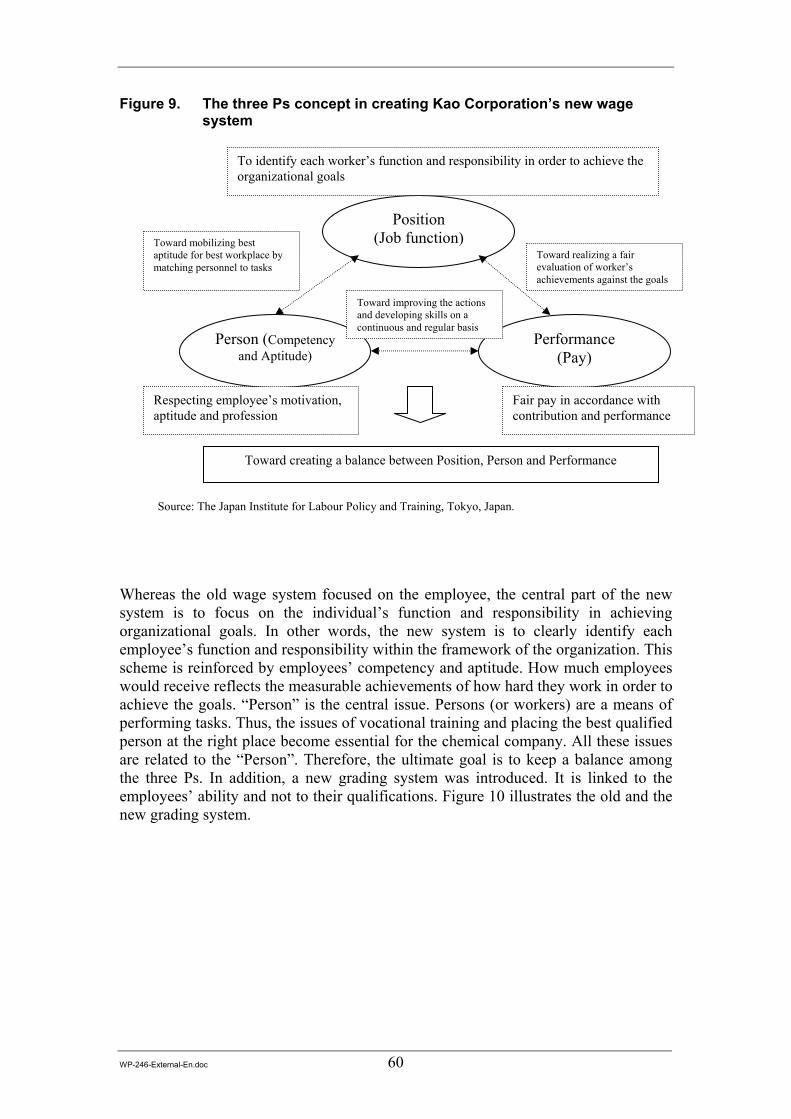
WP-246-External-En.doc 60
Figure 9. The three Ps concept in creating Kao Corporation’s new wage system
Whereas the old wage system focused on the employee, the central part of the new system is to focus on the individual’s function and responsibility in achieving organizational goals. In other words, the new system is to clearly identify each employee’s function and responsibility within the framework of the organization. This scheme is reinforced by employees’ competency and aptitude. How much employees would receive reflects the measurable achievements of how hard they work in order to achieve the goals. “Person” is the central issue. Persons (or workers) are a means of performing tasks. Thus, the issues of vocational training and placing the best qualified person at the right place become essential for the chemical company. All these issues are related to the “Person”. Therefore, the ultimate goal is to keep a balance among the three Ps. In addition, a new grading system was introduced. It is linked to the employees’ ability and not to their qualifications. Figure 10 illustrates the old and the new grading system.
Position (Job function)
Person (Competency and Aptitude)
Performance (Pay)
Toward creating a balance between Position, Person and Performance
Fair pay in accordance with contribution and performance
To identify each worker’s function and responsibility in order to achieve the organizational goals
Respecting employee’s motivation, aptitude and profession
Toward realizing a fair evaluation of worker’s achievements against the goals
Toward mobilizing best aptitude for best workplace by matching personnel to tasks
Toward improving the actions and developing skills on a continuous and regular basis
Source: The Japan Institute for Labour Policy and Training, Tokyo, Japan.

WP-246-External-En.doc 61
Figure 10. How Kao Corporation changed its grading system
Source: The Japan Institute for Labour Policy and Training, Tokyo, Japan. The differences between the two systems are discussed below. Managers: Under the old system, there were only two categories (E1 and E2) for managerial employees. By contrast, the new system divides managers into five grades, from P5 (top rank) to P1 (bottom rank), and job rank and grade by job function are cross-related. P5 is the highest rank that employees can attain: it includes department directors and principal directors at the head office. P4 is for general directors, P3 for line directors in the region or principal section chief at the head office, P2 for section chiefs, and P1 for any other manager ranked lower than section chiefs.
E2
E1
L2
L1
S2
S1
Important of job function
P1 P2
P3 P4
P5
Leader, Chief
Assistant
Worker
Field A Field B Field C
Work category
Clearly defined about the following: O Responsibility required to a job function O Actions required to a job function O Professional knowledge and skills
Suitable system: O Standard of evaluation O Level of remuneration O Type of employment
Old system New system
Company-wide jobs by qualification are abolished. “Work category system” based on “Field” and “Job function (responsibility)” is
introduced. ↓
14 fields, 52 work categories and 219 competency models
Old system

WP-246-External-En.doc 62
Employees: Under the old job function system, all employees had to belong to any one of job groups S1, S2, L1 or L2, from bottom to top. Each job group was further divided into two categories: category N, qualified for countrywide transfers, and category R, not qualified for transfer to worksites other than the one where the employee is presently on duty. Under the new system, all employees are categorized into one of 14 job fields, such as Field A, Field B, Field C. The definition of “field” is defined by each department. All jobs are first categorized as belonging to sales, production, research and development, marketing or administration. Under the broad grouping of work rules, “fields” are set up. Each job grade is divided into 14 fields. Within the various “fields” there are “work groups”. A work group comprises from two to five different jobs maximum. Each work group defines actions, professional knowledge and skills required to perform the job. The evaluation, remunerations and types of employment are determined in accordance with the relevant definitions. Under the 14 fields there are 52 work groups which define job functions. A job function is determined in accordance with the required competency for a job. For example, in the research and development field there are two work groups: the basic research work group and the development work group. There are 219 job function competencies within the company. How was the pay level decided in the new system? With the aid of outside consultants, the company conducted an internal survey to examine suitable wage levels. Each job group has three wage zones, the moderate wage level falling in the second, middle zone. Employees in this zone are regarded as accomplishing satisfactory work. The first zone (lower zone) is viewed as a satisfactory level for entry-level employees. If the employee’s evaluation falls in the third (upper) zone, he/she is regarded as having achieved a high level of evaluation. Figure 11. Pay structure by job function at Kao Corporation Source: JIL
3rd Zone
2nd Zone
1st Zone
3rd Zone
2nd Zone
1st Zone
Wage
Job responsibility
B work group
A work group
Refereed by:
Manager
Team leader
External evaluation by workers’ supervisor
Source: The Japan Institute for Labour Policy and Training, Tokyo, Japan

WP-246-External-En.doc 63
How can employees earn higher wages? There are two possible ways of increasing pay by job function. Workers can augment their earnings by improving their performance and as a result being promoted to a higher zone where pay is higher; the zone in which the employees are is a decisive factor for their wages, another element being each employee’s performance evaluation. An increase on the basis of performance evaluation is governed by the work group evaluation table which applies to all employees regardless of the zone in which they are placed (figure 12). Figure 12. Simulation of a possible pay increase by job function at Kao
Corporation in the new grading system
Source: The Japan Institute for Labour Policy and Training, Tokyo, Japan. Possible wage increase scenarios:
(1) Moving higher in the zone (an increase to the suitable level in accordance with the worker’s level of responsibility)
+ (2) An increase by the evaluation of performance (aims: to motivate
workers towards better performance and thus higher pay) Changes in the remuneration system: The remuneration system is based on the calendar year. The annual wage consists of monthly pay and of bonuses paid twice a year – in summer and at year’s end. The bonuses have three components: the first component, called basic bonus, is determined by the employee’s job function and his/her responsibilities within the relevant work group. The second component is determined by the employee’s performance. The norms for this evaluation are a combination of the employee’s contributions to his/her department and the level of competency at which he/she actually performed. The third component, called company performance bonus, is linked to the results of EVA. This bonus is payable in proportion to the actual profits made by the company or department (see figure 13).
3rd zone
2nd zone
1st zone
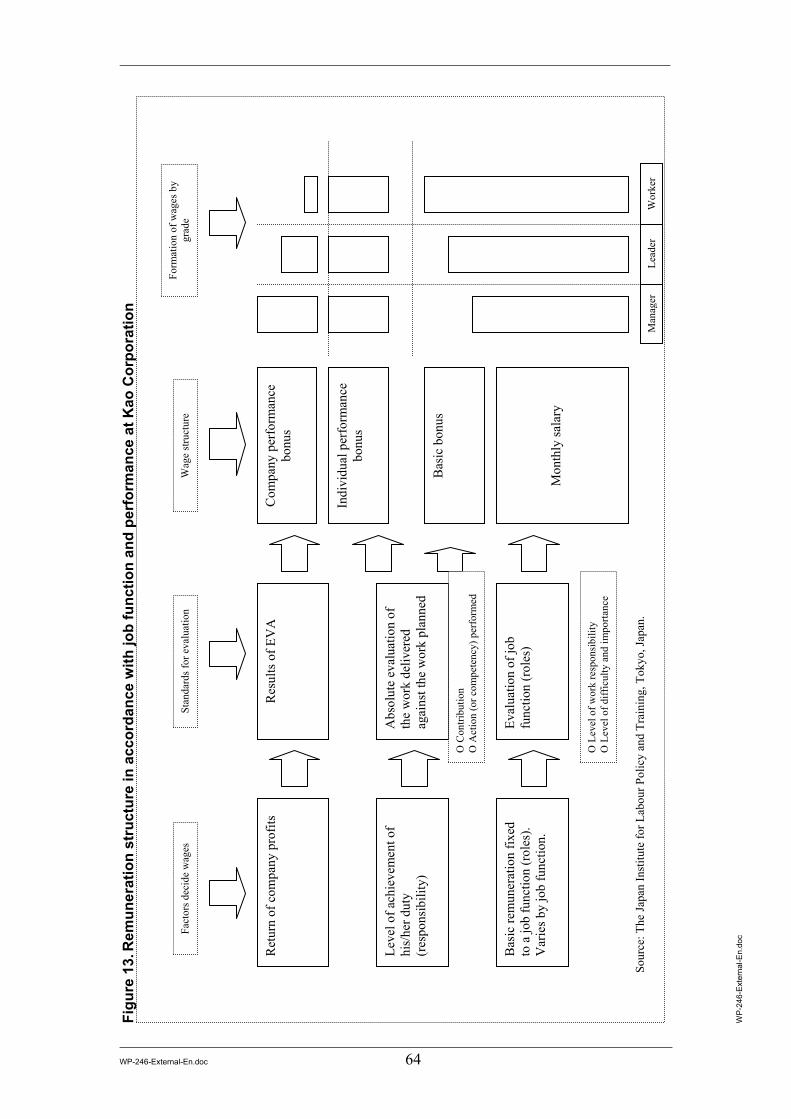
WP-
246-
Ext
erna
l-En.
doc
WP-246-External-En.doc 64
Figu
re 1
3. R
emun
erat
ion
stru
ctur
e in
acc
orda
nce
with
job
func
tion
and
perf
orm
ance
at K
ao C
orpo
ratio
n
Ret
urn
of c
ompa
ny p
rofit
s
Leve
l of a
chie
vem
ent o
f hi
s/he
r dut
y (r
espo
nsib
ility
)
Bas
ic re
mun
erat
ion
fixed
to
a jo
b fu
nctio
n (r
oles
). V
arie
s by
job
func
tion.
Res
ults
of E
VA
Abs
olut
e ev
alua
tion
of
the
wor
k de
liver
ed
agai
nst t
he w
ork
plan
ned
Eval
uatio
n of
job
func
tion
(rol
es)
Com
pany
per
form
ance
bo
nus
Indi
vidu
al p
erfo
rman
ce
bonu
s
Bas
ic b
onus
M
onth
ly sa
lary
Fact
ors d
ecid
e w
ages
St
anda
rds f
or e
valu
atio
n W
age
stru
ctur
e Fo
rmat
ion
of w
ages
by
grad
e
Man
ager
Lead
er
Wor
ker
O C
ontri
butio
n O
Act
ion
(or c
ompe
tenc
y) p
erfo
rmed
O L
evel
of w
ork
resp
onsi
bilit
y O
Lev
el o
f diff
icul
ty a
nd im
porta
nce
Sour
ce: T
he Ja
pan
Inst
itute
for L
abou
r Pol
icy
and
Trai
ning
, Tok
yo, J
apan
.
WP-246-External-En.doc 65
The second example, a case study of Kissei Pharmaceutical Co., Ltd. (“Kissei”), illustrates how a chemical company changed its pay system by modernizing the human resources management system to fit in with today’s business environment. Kissei was founded in 1946 in Japan. Its primary lines of business include the research and development of drugs and manufacturing and sales of pharmaceutical products. The total number of employees is 1,400: 1,178 male employees and 222 female employees. The employees’ average age is 35.4 years (36.6 years for male employees and 29.3 for female employees), and their average length of service 11.9 years (12.9 for male employees and 6.7 for female employees). Kissei’s pay system was based on employees’ qualification. However, the company decided to change it so as to update its personnel management system and company business environments. To increase its employees’ satisfaction and self-esteem and provide greater transparency, Kissei developed the following policy frameworks on wage reforms:
1) To improve the employees’ ability to perform the job, the company provides them with vocational education and training, which are the cornerstone of maintaining high productivity.
2) Instead of applying one uniform performance-based pay system for all employees, Kissei allows the flexibility of two co-existing pay systems: a performance-based pay system and a new grading system in accordance with the needs of individual employees and the company.
3) Because Kissei believes that multi-skilling enhances the flexibility of employees’ skills and strengthens their ability to adapt themselves to any foreseen and unforeseen changes at work, the new pay system will allow employees to develop their professional skills on a continuous basis.
4) To meet the employees’ diversified values and their expectations towards work, Kissei provides them with multiple choices in their career development, which enhances their motivation and self-esteem at work.
Following the review of the company’s organization in the light of new business strategies, personnel resources management was updated accordingly. The following description shows how Kissei changed its personnel resources management system. Each job group was categorized. For example, Shokushu 1 (job type 1) consisted of 50 jobs, Shokushu 2 (job type 2) of one job, and Shokushu 3 (job type 3) of five jobs. These job descriptions were assigned to workers based on ability and knowledge requirements. Unlike the general practices regarding pay systems in Japan, Kissei did not have two distinctions between Sogoshoku and Ippanshoku. However, Kissei’s Shokushu 1 is more or less similar to Sogoshoku at large, Shokushu 2 was semi-Sogoshoku and Shokushu 3 was Ippanshoku. The new human resources management system is designed to achieve the following three objectives. (1) Organization of job classifications for managerial employees In order to bolster the company’s organizational structure and strengthen the roles of managers, Kissei has introduced five managerial classifications: executive job group,
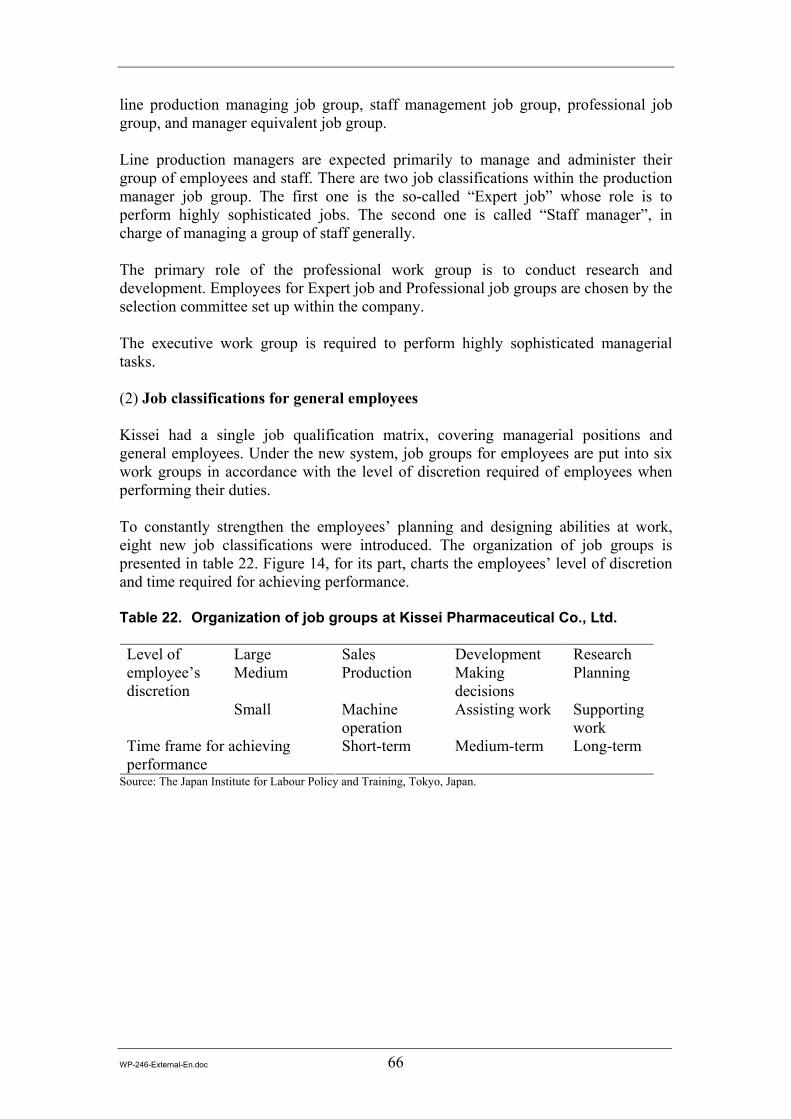
WP-246-External-En.doc 66
line production managing job group, staff management job group, professional job group, and manager equivalent job group. Line production managers are expected primarily to manage and administer their group of employees and staff. There are two job classifications within the production manager job group. The first one is the so-called “Expert job” whose role is to perform highly sophisticated jobs. The second one is called “Staff manager”, in charge of managing a group of staff generally. The primary role of the professional work group is to conduct research and development. Employees for Expert job and Professional job groups are chosen by the selection committee set up within the company. The executive work group is required to perform highly sophisticated managerial tasks. (2) Job classifications for general employees Kissei had a single job qualification matrix, covering managerial positions and general employees. Under the new system, job groups for employees are put into six work groups in accordance with the level of discretion required of employees when performing their duties. To constantly strengthen the employees’ planning and designing abilities at work, eight new job classifications were introduced. The organization of job groups is presented in table 22. Figure 14, for its part, charts the employees’ level of discretion and time required for achieving performance. Table 22. Organization of job groups at Kissei Pharmaceutical Co., Ltd.
Large Sales Development Research Medium Production Making
decisions Planning
Level of employee’s discretion
Small Machine operation
Assisting work Supporting work
Short-term Medium-term Long-term Time frame for achieving performance
Source: The Japan Institute for Labour Policy and Training, Tokyo, Japan.
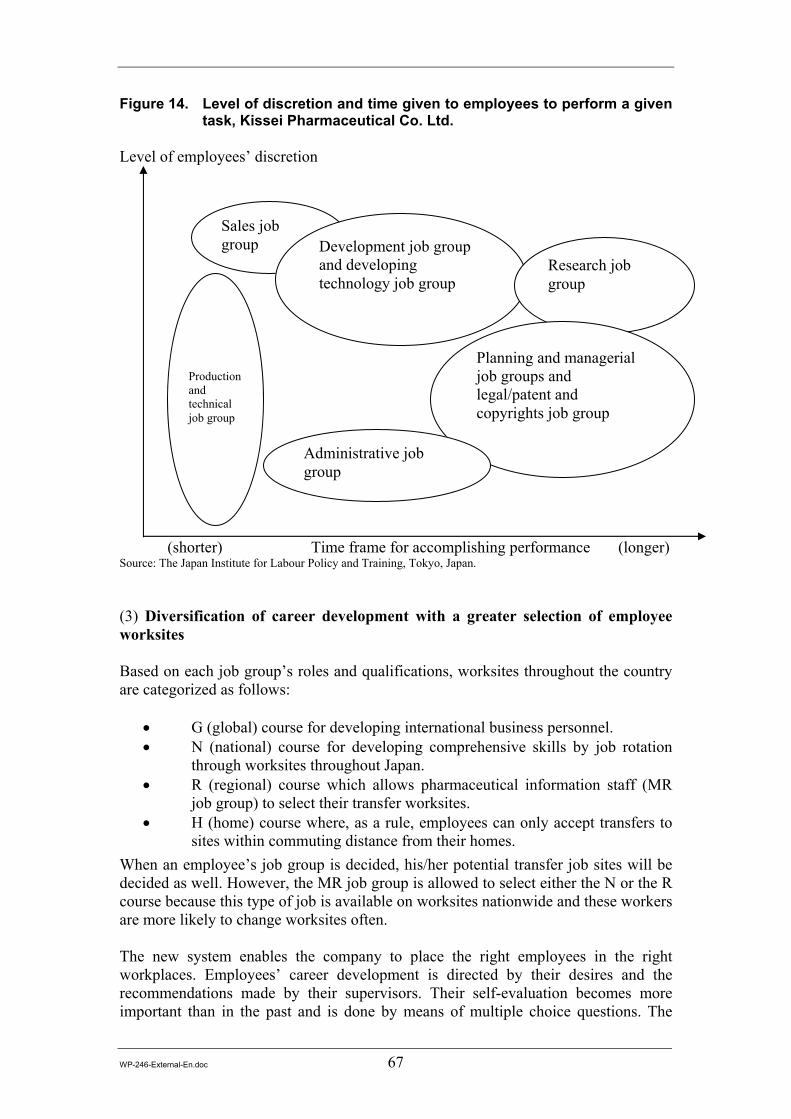
WP-246-External-En.doc 67
Figure 14. Level of discretion and time given to employees to perform a given task, Kissei Pharmaceutical Co. Ltd.
Level of employees’ discretion
(shorter) Time frame for accomplishing performance (longer) Source: The Japan Institute for Labour Policy and Training, Tokyo, Japan. (3) Diversification of career development with a greater selection of employee worksites Based on each job group’s roles and qualifications, worksites throughout the country are categorized as follows:
• G (global) course for developing international business personnel. • N (national) course for developing comprehensive skills by job rotation
through worksites throughout Japan. • R (regional) course which allows pharmaceutical information staff (MR
job group) to select their transfer worksites. • H (home) course where, as a rule, employees can only accept transfers to
sites within commuting distance from their homes. When an employee’s job group is decided, his/her potential transfer job sites will be decided as well. However, the MR job group is allowed to select either the N or the R course because this type of job is available on worksites nationwide and these workers are more likely to change worksites often. The new system enables the company to place the right employees in the right workplaces. Employees’ career development is directed by their desires and the recommendations made by their supervisors. Their self-evaluation becomes more important than in the past and is done by means of multiple choice questions. The
Sales job group Development job group
and developing technology job group
Research job group
Planning and managerial job groups and legal/patent and copyrights job group
Production and technical job group
Administrative job group
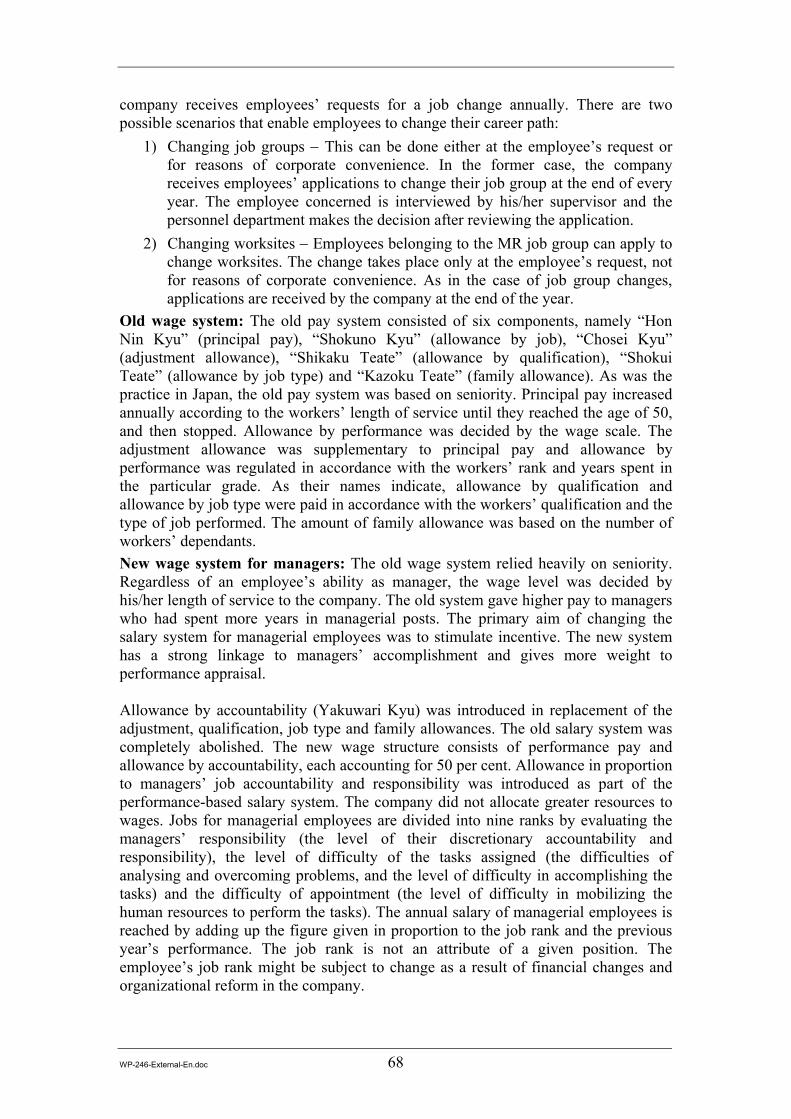
WP-246-External-En.doc 68
company receives employees’ requests for a job change annually. There are two possible scenarios that enable employees to change their career path:
1) Changing job groups − This can be done either at the employee’s request or for reasons of corporate convenience. In the former case, the company receives employees’ applications to change their job group at the end of every year. The employee concerned is interviewed by his/her supervisor and the personnel department makes the decision after reviewing the application.
2) Changing worksites − Employees belonging to the MR job group can apply to change worksites. The change takes place only at the employee’s request, not for reasons of corporate convenience. As in the case of job group changes, applications are received by the company at the end of the year.
Old wage system: The old pay system consisted of six components, namely “Hon Nin Kyu” (principal pay), “Shokuno Kyu” (allowance by job), “Chosei Kyu” (adjustment allowance), “Shikaku Teate” (allowance by qualification), “Shokui Teate” (allowance by job type) and “Kazoku Teate” (family allowance). As was the practice in Japan, the old pay system was based on seniority. Principal pay increased annually according to the workers’ length of service until they reached the age of 50, and then stopped. Allowance by performance was decided by the wage scale. The adjustment allowance was supplementary to principal pay and allowance by performance was regulated in accordance with the workers’ rank and years spent in the particular grade. As their names indicate, allowance by qualification and allowance by job type were paid in accordance with the workers’ qualification and the type of job performed. The amount of family allowance was based on the number of workers’ dependants. New wage system for managers: The old wage system relied heavily on seniority. Regardless of an employee’s ability as manager, the wage level was decided by his/her length of service to the company. The old system gave higher pay to managers who had spent more years in managerial posts. The primary aim of changing the salary system for managerial employees was to stimulate incentive. The new system has a strong linkage to managers’ accomplishment and gives more weight to performance appraisal. Allowance by accountability (Yakuwari Kyu) was introduced in replacement of the adjustment, qualification, job type and family allowances. The old salary system was completely abolished. The new wage structure consists of performance pay and allowance by accountability, each accounting for 50 per cent. Allowance in proportion to managers’ job accountability and responsibility was introduced as part of the performance-based salary system. The company did not allocate greater resources to wages. Jobs for managerial employees are divided into nine ranks by evaluating the managers’ responsibility (the level of their discretionary accountability and responsibility), the level of difficulty of the tasks assigned (the difficulties of analysing and overcoming problems, and the level of difficulty in accomplishing the tasks) and the difficulty of appointment (the level of difficulty in mobilizing the human resources to perform the tasks). The annual salary of managerial employees is reached by adding up the figure given in proportion to the job rank and the previous year’s performance. The job rank is not an attribute of a given position. The employee’s job rank might be subject to change as a result of financial changes and organizational reform in the company.
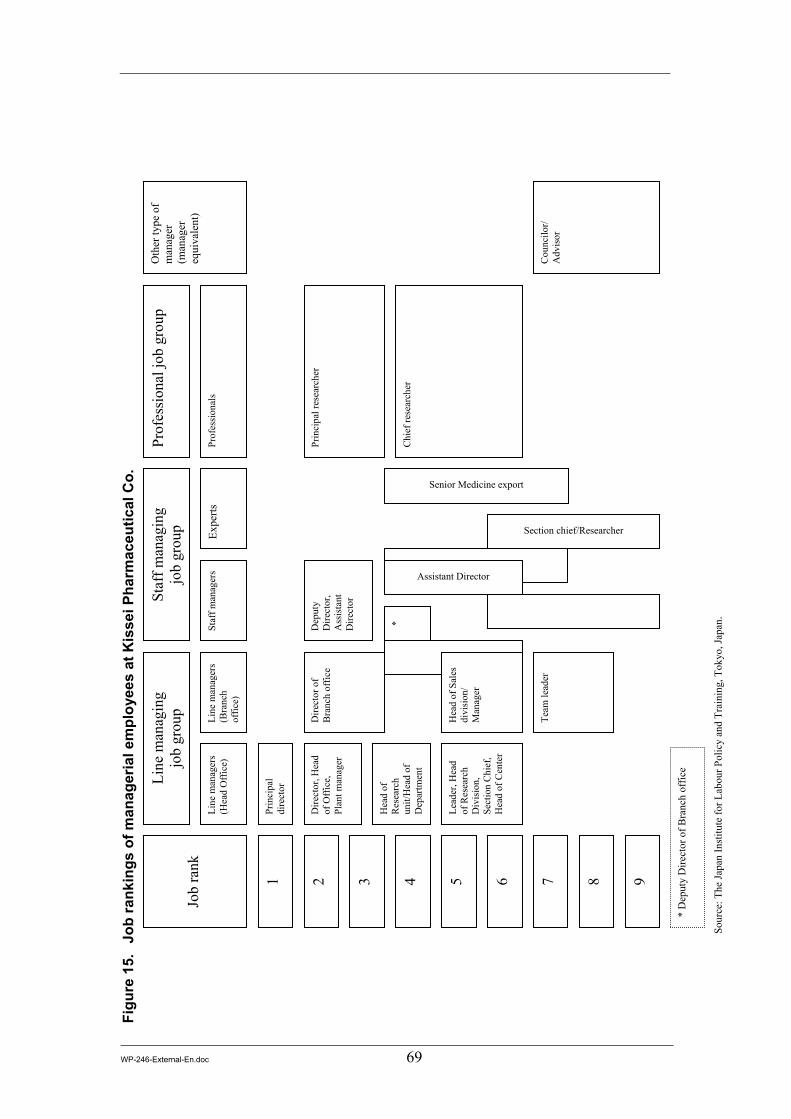
WP-246-External-En.doc 69
Line
man
agin
g
job
grou
p St
aff m
anag
ing
job
grou
p Pr
ofes
sion
al jo
b gr
oup
Line
man
ager
s (H
ead
Off
ice)
Li
ne m
anag
ers
(Bra
nch
offic
e)
Staf
f man
ager
s Ex
perts
Pr
ofes
sion
als
Jo
b ra
nk
Oth
er ty
pe o
f m
anag
er
(man
ager
eq
uiva
lent
)
1 2 3 4 5 6 7 8 9
Prin
cipa
l di
rect
or
Dire
ctor
, Hea
d of
Off
ice,
Pl
ant m
anag
er
Hea
d of
R
esea
rch
unit/
Hea
d of
D
epar
tmen
t
Lead
er, H
ead
of R
esea
rch
Div
isio
n,
Sect
ion
Chi
ef,
Hea
d of
Cen
ter
Dire
ctor
of
Bra
nch
offic
e
Hea
d of
Sal
es
divi
sion
/ M
anag
er
Team
lead
er
Dep
uty
Dire
ctor
, A
ssis
tant
D
irect
or
*
Prin
cipa
l res
earc
her
Chi
ef re
sear
cher
Cou
ncilo
r/ A
dvis
or
Senior Medicine export
Section chief/Researcher
Assistant Director
Sour
ce: T
he Ja
pan
Inst
itute
for L
abou
r Pol
icy
and
Trai
ning
, Tok
yo, J
apan
.
* D
eput
y D
irect
or o
f Bra
nch
offic
e
Figu
re 1
5.
Job
rank
ings
of m
anag
eria
l em
ploy
ees
at K
isse
i Pha
rmac
eutic
al C
o.

WP-246-External-En.doc 70
New wage system for employees
(i) Principal pay and allowance by performance: the former remains unchanged because it is aimed at maintaining the employees’ standard of living.
(ii) Allowance by job function (Yakuwari Kyu): set up in accordance with job group and grade. Allowance by job type (Shokui Teate) and family allowance remain.
(iii)Job group and wage level: by job group category, the new wage system offers employees a three-step advance structure based on ability and job function.
If under the new system the employees’ wages are set to be lower than those previously enjoyed, the earlier wage level is guaranteed for three years following the introduction of the new system. However, supplementary allowance is reduced by a third every year, meaning that no allowance is paid in the fourth year or thereafter. The major change lies in the fact that under the new system, workers’ ability and performance become the central factors in determining their wages. However, in order to protect their standard of living, the main portion of their wages is comprised of principal pay and allowance by performance. As the workers climb up the ladder of job rank in career development, the portion of allowance by performance increases. Kissei has adopted three labels for the wage components of the new system. Each allowance may be better explained by what the company expects in return. To pay the “allowance by performance” the company makes its expectations known by asking the employees “What can you do?” For the allowance by job function it tries to find out the employees’ present value for the company by asking “What have you been doing for the company?”, while for the annual lump-sum bonus, the question concerns past performance, “What have you done for the company?”
7.3. Performance appraisal Individual competencies are central issues in personal evaluation. In the case of salaried employees in Finland’s chemical industry, systematic actions in evaluating job descriptions, job requirements and individual competence and in assuring their continuity are a basic requirement for maintaining the evaluation system. For newly salaried employees in Finland the requirements of a new job are determined as soon as possible, and no later than three months after the employment relationship begins. On transfer of a salaried employee from one duty to another, the categorization conform to the new job is followed from the start of the next pay period. If the change affects the content of the job, the possible effect of the change in job requirement regarding categorization is verified as soon as possible. A pay rise possibly resulting from the change in categorization takes effect from the beginning of the pay period following the moment of transfer. The requirement categorization is revised regularly (at least once a year). A representative or representatives of the employees, or the workgroup possibly founded in the enterprise or plant for the purpose of job categorization are entitled to present their justified opinion regarding categorization, the functioning of the system and any problems that may have emerged. The workgroup has at least two members (one representative of the

WP-246-External-En.doc 71
employer and one representative of the employees), though the parties can agree to increase that number.
The individual elements are evaluated at least once a year, although employees and firms can decide otherwise, at company level. The job description on which the job requirement evaluation is based is revised in connection with the evaluation of individual competence. The evaluation of competence of a new employee is made within the first six months of employment. Until it is carried out, the employee’s salary is equal to at least the amount of the job requirement grade-based salary. If an employee is transferred to another duty, or if the content of his/her job changes so significantly that the requirement category changes, then the relation between the total individual job evaluation part of the salary and the competence-based part of the salary and the relation of the two to the category salary may change since the competence and performance factors are evaluated in regard to the prevailing duty. When an employee is transferred to more demanding duties, the possible upward impact of the transfer on his/her individual salary will be determined. However, in some cases the salary may remain unchanged.39 Unicharm Corporation provides another example of how a life science company uses individual competency in personnel evaluation. The primary lines of Unicharm Corporation’s business include the manufacture and sale of baby and child care products, feminine care products and adult incontinence care products. The company defines the term competency as “a specific characteristic of constantly and stably exercising thoughts and actions in order to achieve the high-valued results”. The ability must be exercised steadily, constantly and continuously, but it must also promptly and instantly meet any change of environment. The concept of competency differs from the traditional requirements of job descriptions, which were abstract and general descriptions. It contains more specific job descriptions and the required competency for each job is clearly and separately defined. In addition, the benchmark of the evaluation which is based on high-performance employees enables the company to quickly draw up concrete action policies to gain swift economic results (see table 23). Table 23. Comparison between the competency system (new) and the job function
and qualification system (old) Competency system Job function and qualification
system Subject of evaluation Focuses on ascertainable
thoughts and actions Also evaluates latent portions
Standard of evaluation Benchmark is on the high performers
Industry average
Constancy of work performance
Stable performance Expectation of performance
Results Quick return is anticipated Imbalance between evaluation and return
Value in the personnel market High Unknown Defining personnel type Possible Impossible Response to changing environments
Subject to change in accordance with the changing environments
Impossible to change
Source: The Japan Institute for Labour Policy and Training, Tokyo, Japan.
39 Collective Agreement for Salaried Employees in the Finnish Chemical Industry, 16 February 2005-30 September 2007, pp. 50-51.

WP-246-External-En.doc 72
Competency services are the basis of all activities in human resource management. Competency-based evaluation systems allow the company to identify the requirements for a particular job by specifying the abilities required of individual employees. This characteristic of competency-based evaluations has led to the implementation of an objective and transparent evaluation system. Unicharm also lists the following benefits from the competency-based evaluation system.
• Recruitment: recruitment by competency and speedy assignment of new recruits to appropriate departments.
• Education and training: to enhance employees’ self-esteem in line with job descriptions.
• Promotion: to decide promotions based on evaluating workers’ clearly specified ability against the job description.
• Assignment: to assign workers to the right workplace compared to other jobs. The competency evaluation system was introduced in the following manner: Building the new qualification system of the core employees by the application of competency evaluation The competency evaluation was first introduced in respect of core employees ranked between the ninth and 13th grades. The introduction of the system led to strict scrutiny of the employees’ promotion to managers. It also improved the efficiency of assigning the employees to positions such as top managers, professional employees, specialized employees, and managers. Overall, the system reinforces core employees in their work habits and increases cost efficiency and high return. How did the company create the competency model for high-performance workers? To do this, the company conducted hearings of all workers in all job types whose performance was ranked in the top 20 per cent. At the same time, questionnaires were sent to all core workers. The results of all the questionnaires were examined and compared in order to analyse the portfolios of all workers and ultimately create 27 factors of competency over 12 job types.
WP-246-External-En.doc 73
Figu
re 1
6. T
he 2
7 fa
ctor
s of
com
pete
ncy
at U
nich
arm
Cor
pora
tion
Sour
ce: T
he Ja
pan
Inst
itute
for L
abou
r Pol
icy
and
Trai
ning
, Tok
yo, J
apan
.
Abi
lity
of se
lf ad
apta
tion
Prof
essi
onal
kno
wle
dge/
Skill
s
Abi
lity
to c
ompr
ehen
d ot
hers
Abi
lity
to c
olle
ct n
eces
sary
info
rmat
ion
Abi
lity
to n
egot
iate
Abi
lity
to c
oord
inat
e
Abi
lity
to m
obili
ze p
erso
nnel
Em
ploy
ee tr
aini
ng
Abi
lity
to
com
preh
end
prob
lem
s
Abi
lity
to
form
ulat
e pr
oble
ms
Abi
lity
to
plan
re
solu
tion
Abi
lity
to
allo
cate
re
sour
ces
Abi
lity
to
carr
y ou
t the
ta
sks
Abi
lity
to
man
age
the
wor
k in
pr
ogre
ss
Cha
lleng
ing
spiri
t – W
illin
gnes
s to
wor
k
Lead
ersh
ip
Res
pons
ibili
ty
Con
scio
usne
ss o
f foc
usin
g on
wor
k
Con
side
ratio
n
Ethi
cs
Cor
e co
mpe
tenc
y to
ach
ieve
per
form
ance
Res
ults
Extro
vers
ion,
con
tinua
tion,
pos
itive
s, ex
pres
sion
, fle
xibi
lity
and
orig
inal
ity
*
Mind (consciousness)
Degree of core competency
Stro
nger
Stro
nger
Wea
ker
Wea
ker
Tim
e
Abi
lity
to b
uild
com
mun
icat
ions
Job skills (knowledge and ability)
WP-246-External-En.doc 74
The case of Toagosei Co. Ltd. is an example of an evaluation process that attempts to bring greater fairness to personnel appraisal. Founded in 1942, the company has four primary lines of business: commodity chemicals, acrylic products, specialty chemicals and plastics. The number of employees in the consolidated base was 2,735 in 2003. In 1998, Toagosei introduced a comprehensive personnel evaluation system comprising a result-oriented evaluation and a process-oriented one. It also brought in a new personnel evaluation system for deciding workers’ promotion. Result-oriented evaluation includes factors in line with MBO (Management by Objective) which is related to the workers’ personnel evaluation based on merit. The most distinguishing characteristic of the new system is that it abandoned seniority-based factors in the personnel evaluation. Under the old, seniority-based evaluation system, employees ranked on the same job received the same wage. However, the new system has made a variation on employees’ pay. Similarly, bonus allowance has been changed. Under the old system, bonus payments were also based on seniority although the bonus lump sum depended on the employees’ evaluation. In the new system, seniority-based evaluation is fully replaced by the merit system. The new personnel evaluation for the management is a comprehensive evaluation consisting of a result-oriented evaluation and a process-oriented one (see tables 24 and 25). An overview of a Personnel Evaluation and Support system is presented. Because it is critical for staff members to know what is expected of them and to know on what basis they are being evaluated, the formulated Components of Instructions (COI) are disseminated and reviewed with the staff. This process allows staff to know what is expected of them, teaches them how to be effective, and focuses on teaching and learning. COI represent the best thinking on what goes into any teaching/learning situation and include: (1) motivational components, (2) goal/objective-setting components, (3) instructional components, (4) monitoring of student performance, and (5) evaluation of student performance. An observation is completed based on the COI, and parameters set forth in the aspects of the job description are delineated by the evaluator as priority areas of emphasis within the context of the Superintendent’s Priorities. Through the Staff Development Programme each COI is addressed in great detail in small group sessions with staff members whose observations/evaluations indicate the area(s) in need of growth. The appendices include an Observation Form, an Evaluation Form, and a sample Competency-Based Staff Development Programme.

WP-246-External-En.doc 75
Table 24. Overview of personnel evaluation at Toagosei Co., Ltd.
Decisive adjusted evaluation Result-oriented evaluation
Process-oriented evaluation
Comprehensive evaluation Final result-
oriented evaluation
The first half- yearly comprehensive evaluation
Yearly final comprehensive evaluation
S (excellent) S (excellent) S (excellent) S (excellent) S (excellent) S (excellent) A (very good)
A (very good) A (very good) A (very good) A (very good) A (very good)
B (good) B (good) B (good) B (good) B (good) B (good) C (poor) C (poor) C (poor) C (poor) C (poor) C (poor) D (extremely poor)
D (extremely poor)
D (extremely poor)
D (extremely poor)
D (extremely poor)
D (extremely poor)
Ratio of each evaluation on the comprehensive evaluation
Result-oriented evaluation Process-oriented evaluation
SHUKAN (director) and higher 80 per cent 20 per cent SHUSA AND FUKU SHUSA (Section chief)
70 per cent 30 per cent
Table 25. Questions to be asked when conducting a result-oriented evaluation at
Toagosei Co., Ltd. Item Question Evaluation (only one
section) 1st evaluation: S, A, B, C or D
(1) The level of achieving the goals
Have the targets been achieved? Employers extract the data from the MBO sheet. For extreme cases, S and D will be awarded. S: Supreme achievement on performance results. D: Extremely poor achievement on performance results.
2nd evaluation: S, A, B, C or D 1st evaluation: S, A, B, C or D
(2) The level of achieving non-targeted work (i.e., routine work)
Has non-targeted work been performed in the desired quality and quantity? S: Fairly exceeded the expected quality and quantity on performance. A: Exceeded the expected quality and quantity on performance. B: Almost performed the expected quality and quantity on performance. C: Below the expected quality and quantity on performance. D: Fairly below the expected quality and quantity on performance.
2nd evaluation: S, A, B, C or D
1st evaluation: +, 0 or −
(3) Changes on environment
Were there any unforeseen and unpredictable environment changes? + = positive changes 0 = no changes − = negative changes
2nd evaluation: +, 0 or −
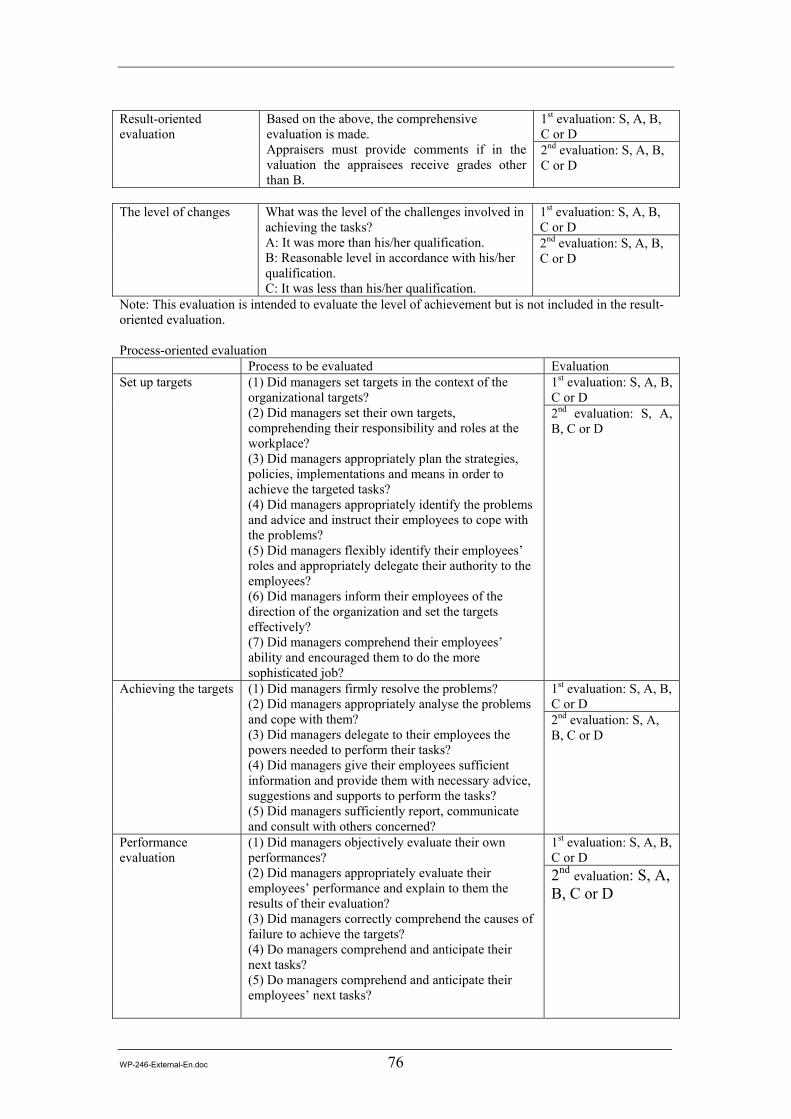
WP-246-External-En.doc 76
1st evaluation: S, A, B, C or D
Result-oriented evaluation
Based on the above, the comprehensive evaluation is made. Appraisers must provide comments if in the valuation the appraisees receive grades other than B.
2nd evaluation: S, A, B, C or D
1st evaluation: S, A, B, C or D
The level of changes What was the level of the challenges involved in achieving the tasks? A: It was more than his/her qualification. B: Reasonable level in accordance with his/her qualification. C: It was less than his/her qualification.
2nd evaluation: S, A, B, C or D
Note: This evaluation is intended to evaluate the level of achievement but is not included in the result-oriented evaluation. Process-oriented evaluation Process to be evaluated Evaluation
1st evaluation: S, A, B, C or D
Set up targets (1) Did managers set targets in the context of the organizational targets? (2) Did managers set their own targets, comprehending their responsibility and roles at the workplace? (3) Did managers appropriately plan the strategies, policies, implementations and means in order to achieve the targeted tasks? (4) Did managers appropriately identify the problems and advice and instruct their employees to cope with the problems? (5) Did managers flexibly identify their employees’ roles and appropriately delegate their authority to the employees? (6) Did managers inform their employees of the direction of the organization and set the targets effectively? (7) Did managers comprehend their employees’ ability and encouraged them to do the more sophisticated job?
2nd evaluation: S, A, B, C or D
1st evaluation: S, A, B, C or D
Achieving the targets (1) Did managers firmly resolve the problems? (2) Did managers appropriately analyse the problems and cope with them? (3) Did managers delegate to their employees the powers needed to perform their tasks? (4) Did managers give their employees sufficient information and provide them with necessary advice, suggestions and supports to perform the tasks? (5) Did managers sufficiently report, communicate and consult with others concerned?
2nd evaluation: S, A, B, C or D
1st evaluation: S, A, B, C or D
Performance evaluation
(1) Did managers objectively evaluate their own performances? (2) Did managers appropriately evaluate their employees’ performance and explain to them the results of their evaluation? (3) Did managers correctly comprehend the causes of failure to achieve the targets? (4) Do managers comprehend and anticipate their next tasks? (5) Do managers comprehend and anticipate their employees’ next tasks?
2nd evaluation: S, A, B, C or D

WP-246-External-En.doc 77
1st evaluation: S, A, B, C or D
Employee training (1) Do managers appropriately comprehend their employees’ ability and preference? (2) Do managers encourage their employees during job training (or at the workplace)? (3) Do managers customarily ask if the employees are encountering any problems and help resolve them? (4) Do managers communicate with their workers? (5) Do managers attempt to promote mutual understanding with their employees?
2nd evaluation: S, A, B, C or D
1st appraiser’s comments
1st evaluation: S, A, B, C or D
Process-oriented evaluation
Evaluation will be made considering all above factors. Whenever their evaluations are other than B, appraisers must provide comments.
2nd appraiser’s comments
2nd evaluation: S, A, B, C or D
The personnel evaluation is carried out twice a year, covering the period from January to June and from July to December respectively. The achievement target is set at the beginning of each period. An intermediate evaluation is held in the middle of the period to review achievements against the target and make adjustments necessary to meet the ultimate target. In addition, the evaluation of merit is conducted twice a year, at the same time as the evaluation of the Management by Objective. Result-oriented evaluation in the personnel evaluation is reflected in the lump-sum bonus. The comprehensive evaluation is reflected on the annual wages and the promotion. Records on the personnel evaluation and the Management by Objective are kept in the internal network system and can be seen by the employees’ managers and their immediate supervisors. Basic data of the Management by Objective Sheet, except the evaluation, are open to all employees. Result-oriented evaluation Result-oriented evaluation is conducted in line with the Management by Objective evaluation and is based on three factors: (1) the level of target achievement, (2) the level of performance in excess of the original target, and (3) changes in work organization. The three factors are briefly described below. Result-oriented evaluation consists of five grade evaluations: S (excellent), A (good), B (acceptable), C (poor) and D (extremely poor). Figure 17 illustrates how the evaluation takes place.
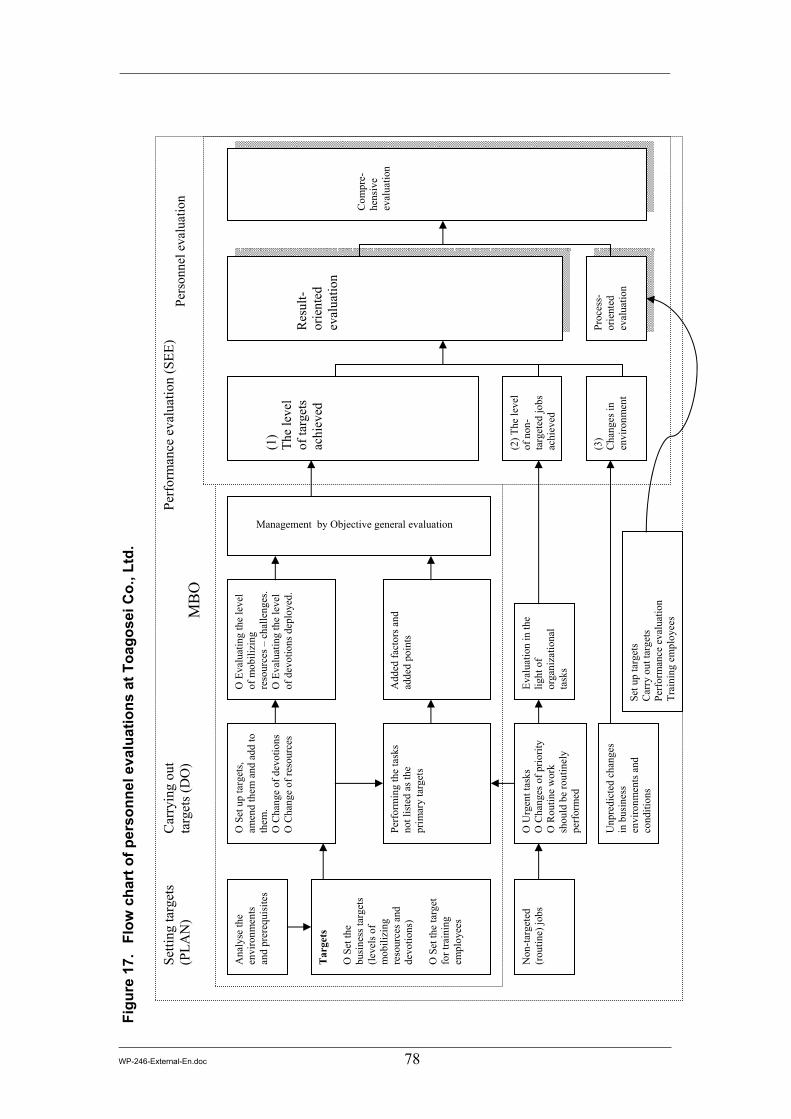
WP-246-External-En.doc 78
Figu
re 1
7.
Flow
cha
rt o
f per
sonn
el e
valu
atio
ns a
t Toa
gose
i Co.
, Ltd
.
Ana
lyse
the
envi
ronm
ents
an
d pr
ereq
uisi
tes
Tar
gets
O
Set
the
busi
ness
targ
ets
(leve
ls o
f m
obili
zing
re
sour
ces a
nd
devo
tions
) O
Set
the
targ
et
for t
rain
ing
empl
oyee
s
O S
et u
p ta
rget
s, am
end
them
and
add
to
them
. O
Cha
nge
of d
evot
ions
O
Cha
nge
of re
sour
ces
O E
valu
atin
g th
e le
vel
of m
obili
zing
re
sour
ces –
cha
lleng
es.
O E
valu
atin
g th
e le
vel
of d
evot
ions
dep
loye
d.
(1)
The
leve
l of
targ
ets
achi
eved
Res
ult-
orie
nted
ev
alua
tion
Com
pre-
he
nsiv
e ev
alua
tion
Perf
orm
ing
the
task
s no
t lis
ted
as th
e pr
imar
y ta
rget
s
Add
ed fa
ctor
s and
ad
ded
poin
ts
Setti
ng ta
rget
s (P
LAN
) C
arry
ing
out
targ
ets (
DO
) Pe
rfor
man
ce e
valu
atio
n (S
EE)
Management by Objective general evaluation N
on-ta
rget
ed
(rou
tine)
jobs
Set u
p ta
rget
s C
arry
out
targ
ets
Perf
orm
ance
eva
luat
ion
Trai
ning
em
ploy
ees
Unp
redi
cted
cha
nges
in
bus
ines
s en
viro
nmen
ts a
nd
cond
ition
s
Eval
uatio
n in
the
light
of
orga
niza
tiona
l ta
sks
(2) T
he le
vel
of n
on-
targ
eted
jobs
ac
hiev
ed
(3)
Cha
nges
in
envi
ronm
ent
Proc
ess-
orie
nted
ev
alua
tion
O U
rgen
t tas
ks
O C
hang
es o
f prio
rity
O R
outin
e w
ork
shou
ld b
e ro
utin
ely
perf
orm
ed
MB
O
Pers
onne
l eva
luat
ion
WP-246-External-En.doc 79
The level of target achievement looks at whether a managerial employee has attained the target which he/she agrees to achieve every six months. This is based on the performance evaluation of the Management by Objective evaluation, which is conducted through a five-degree evaluation. The results of the Management by Objective evaluation are converted to a three-level evaluation: A, B and C. Within the “A” evaluation, extremely good performance is converted to S. Poor performance within the “C” evaluation is converted to “D”. The level of performance is where the employee is asked whether he/she has generally performed the tasks as he/she should have, in terms of quantity and quality. The evaluation is conducted in the same way as for the first factor. Changes in work organization are taken into consideration as a factor outside the employee’s control. If they are to the employee’s disadvantage, then value 1 is added. If the contrary is true, value 1 is deducted. The appraisal is first performed by the employee’s supervisor; this is called the first evaluation. The secondary evaluation is performed by the director of the department. Before proceeding to the secondary evaluation, evaluators of the first and secondary evaluation meet to discuss their findings. In principle, the secondary evaluation is decided with the agreement of the first evaluator. Process-oriented evaluation The aims of process-oriented evaluation are to evaluate actions taken by employees at the stages of (1) setting up a target, (2) performing the goals, (3) employees’ evaluations and (4) employees’ training. First, the first appraiser makes the initial evaluation, going over each step of the manager’s work and evaluating each process of his/her work. The secondary evaluation is then made of the manager’s steps and process of handling tasks. The two appraisers should consult before the secondary evaluation is made. The points to be evaluated are as follows: (1) To evaluate the manager’s target-setting ability, the appraisers should ask:
(i) whether the targets were set by identifying them in close relation with the organizational goals;
(ii) whether the manager set the targets taking due account of his/her role; (iii) whether the manager planned appropriate strategies, policies,
implementation, mobilization and planning; (iv) whether the manager gives clear instructions to the employees on their
job responsibility and job function, effectively instructs them on the daily target and accurately understands their ability and preference.
(2) To evaluate the manager’s performance of the goals, the appraiser should ask whether he/she:
(i) set the goals of his/her workplace in the light of the organizational goals;

WP-246-External-En.doc 80
(ii) understood his/her responsibility and role at the workplace and set up goals in that context;
(iii) appropriately drew up strategies, policies, implementation, measures and plans in order to achieve the goals.
(3) To evaluate the manager’s ability to perform the tasks, the appraiser should address his/her:
(i) attitude to tackling difficulties; (ii) ability to render appropriate decisions; (iii) ability to delegate authority to the employees; (iv) ability to advise and guide the employees; (v) ability to report and communicate. (4) To evaluate the manager’s appraisal ability, the appraiser should address his/her:
(i) subjective evaluation of his/her performance; (ii) ability to appropriately appraise his/her employees; (iii) ability to analyse unachieved targets and assignments;
(iv) ability to apprehend his/her tasks; (v) ability to apprehend his/her employees’ tasks. (5) To evaluate the manager’s ability to provide his/her employees with training, the appraiser should address his/her ability to: (i) apprehend the employees’ ability and preference; (ii) perform on-the-job training (OJT); (iii) encourage and advise the employees; (iv) listen to his/her employees.
7.4. Salary system for managerial employees Looking at recent pay systems for managerial employees can help to understand how the pay system for production workers could be changed. In 1996, Asahi Kasei Corporation restructured its human resources management system for lower- and middle-class managerial employees. The new system is called VISION. Managers’ salary is determined by two factors: a manager’s performance-based or ability-based factor, and a factor linked to the company’s profits. The company has been reducing the importance of seniority-related factors and giving more weight to the individual’s performance. Moreover, it decided to subsequently abolish the seniority scheme on managers’ salary, and managers’ bonuses are closely linked to the achievements of their departments. Asahi Kasei Corporation launched its personnel management reform in 1996. The slogans of the new system are “management by department” “all employees must be professionals”, “performance achievement-based and capacity-based”, and “openness and impartiality”. The new system consists of four core factors: personnel assignment, personnel evaluation system, wages and conditions system, and capacity building.
WP-246-External-En.doc 81
Furthermore, as part of the new personnel system in June 1999 the company systematized the system (“VISION”) for about 2,800 managers who are directors and section chiefs. VISION is a comprehensive programme comprising the job grade system, salary and bonus system, retirement allowance, personnel appraisal system (“WHAT”), promotion of professionals who can generate monies, strengthening the personnel relations at the related companies and others. VISION’s conceptual frameworks consist of the following:
• To reinforce the divisional management, increase the responsibility of the department and its dependent units, and promote the independence of divisional management;
• To disseminate the performance-based principle within the company; to review the wages, bonuses and retirement allowance in the light of that principle;
• To identify the responsibility and roles of the organizations to meet the changes, to simplify the organization and job ranks;
• To increase the linkage between workers’ actual performance and the fair return of their efforts to wages, while at the same time improving their pay in accordance with the company performance.
In the light of the concepts set out above, the company has reformed the managers’ personnel system with emphasis on reducing job grades and introducing a variable pay system using the performance and personnel appraisal system. The aims of these reforms are to encourage managers’ self-motivation and strengthen their capacity to lead the workers.
The following is an overview of VISION: (1) Job rank – manager’s rank Organization and job organization (organization of work) have been simplified (the Japanese call it “flatization”) in order to increase the flexibility of using manpower and at the same time increasing the managers’ ability. Under the old system, managers’ jobs were divided into five ranks – F1, F2, G, H1 and H2, from the lowest to the highest. The new system has simplified job rankings by reducing the number of ranks to three. These are EPs (Executive Professionals), equivalent to the director of department, LPs (Leading Professionals), generally equivalent to the rank of director, and APs (Advanced Professionals), who are section chiefs. Seniority and years of service are excluded from the factors taken into account in considering promotion to a higher rank. A manager’s capacity is the primary factor in determining his/her promotion, regardless of years of service to the company. The promotion process has been simplified by shortening the time requirement for promotion to LPs and EPs. Under the new system, the required length of service in the lower rank before promotion to LPs has been cut by three years, and that for promotion to EPs by two. In total, under the new system five years less are needed for promotion from APs to EPs. Whereas under the old system the average age for

WP-246-External-En.doc 82
promotion to department director was around 50, the new system has brought it down to 45 years of age. This leads to the expansion of opportunities for workers to be promoted to managers. (2) Pay system The pay system in VISION relies on the principle of high performance and high pay. The company has introduced a number of reforms in the field of remuneration. In accordance with new job ranks, the wage structure for each job rank has been changed as follows:
• In the case of EPs, the performance pay of the old system was replaced by the annual salary system based on performance evaluation. The annual salary consists of (1) principal pay (fixed amount) and (2) annual salary based on the performance evaluation.
• In the case of LPs, the principal pay (fixed amount) was abolished, the performance pay remaining as the sole wage structure.
• APs’ wage structure has remained unchanged. Their wage consists of principal pay (40 per cent) and performance pay (60 per cent).
The wage adjustment system has been gradually abolished and the automatic wage increase reviewed. Under the old wage system, the salary for workers over 55 years of age was reduced by 20 per cent from their salary at age 54. The practice was abolished in 2005. Directors and Section Chiefs turning 55 will receive the adjustment in pay and in 2005 their salary was not reduced. The automatic wage increases which are a part of seniority-based wages are under review. The amount is gradually being reduced to one half and the practice will then be abolished. In concrete terms, LPs and APs (directors and section chiefs) under 49 years of age receive the full amount (100 per cent) of the automatic wage increase, those between 50 and 54 years old see their automatic wage increase cut by half, while for all those over 55 years old the automatic wage increase is abolished. Automatic wage increases for EPs have been abolished completely. Allowances: The company has also reviewed the various allowances. It abolished the “regional allowance” and “housing allowance” for the old “G” job rank. Allowances available under the new system are “Allowance for living apart from the family”, “Cold areas fuel supplementary allowance”, “Commuting allowance” and “Dispatched working allowance”. Allowances that were abolished were included in the principal pay to keep the old wage standard. New allowance standards for EPs, for example, are set at the old H2 level and for APs at the old F level. (3) Bonus allowance The VISION bonus system aims to expand the wage range by paying more to those who perform well work and to enhance the return to wages in proportion to the departmental performance. Its main features can be summarized as follows:
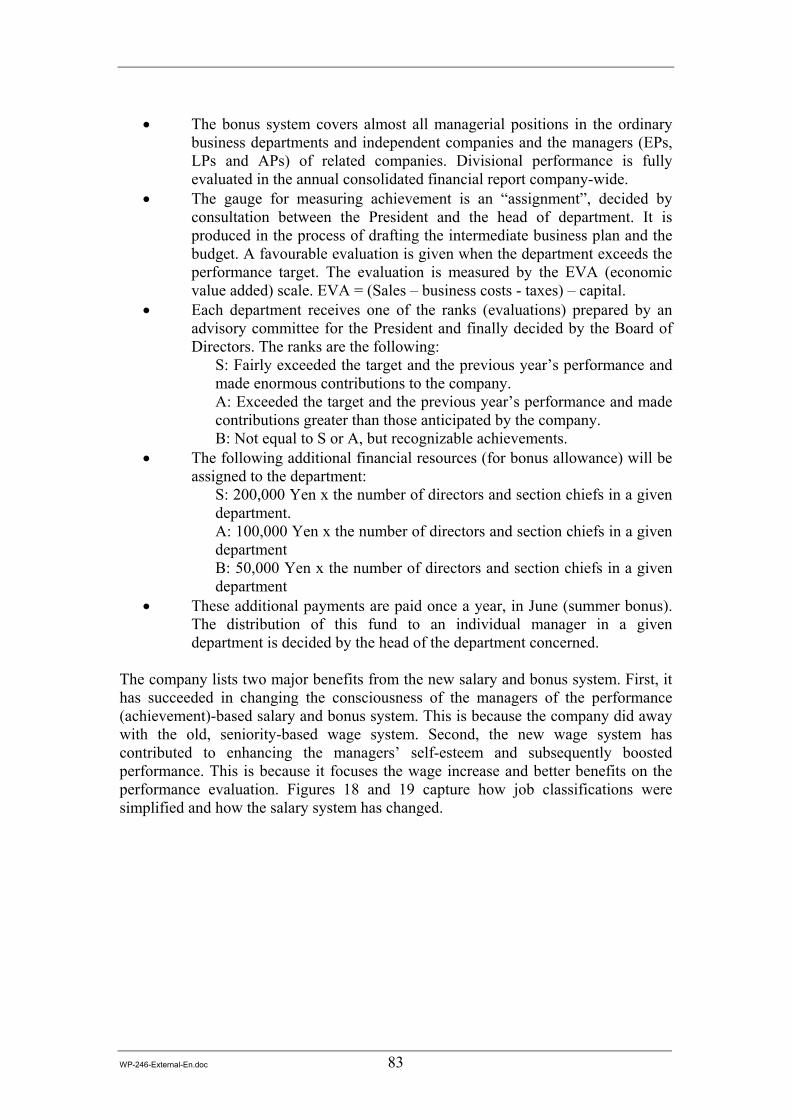
WP-246-External-En.doc 83
• The bonus system covers almost all managerial positions in the ordinary
business departments and independent companies and the managers (EPs, LPs and APs) of related companies. Divisional performance is fully evaluated in the annual consolidated financial report company-wide.
• The gauge for measuring achievement is an “assignment”, decided by consultation between the President and the head of department. It is produced in the process of drafting the intermediate business plan and the budget. A favourable evaluation is given when the department exceeds the performance target. The evaluation is measured by the EVA (economic value added) scale. EVA = (Sales – business costs - taxes) – capital.
• Each department receives one of the ranks (evaluations) prepared by an advisory committee for the President and finally decided by the Board of Directors. The ranks are the following:
S: Fairly exceeded the target and the previous year’s performance and made enormous contributions to the company. A: Exceeded the target and the previous year’s performance and made contributions greater than those anticipated by the company. B: Not equal to S or A, but recognizable achievements. • The following additional financial resources (for bonus allowance) will be
assigned to the department: S: 200,000 Yen x the number of directors and section chiefs in a given department. A: 100,000 Yen x the number of directors and section chiefs in a given department B: 50,000 Yen x the number of directors and section chiefs in a given department
• These additional payments are paid once a year, in June (summer bonus). The distribution of this fund to an individual manager in a given department is decided by the head of the department concerned.
The company lists two major benefits from the new salary and bonus system. First, it has succeeded in changing the consciousness of the managers of the performance (achievement)-based salary and bonus system. This is because the company did away with the old, seniority-based wage system. Second, the new wage system has contributed to enhancing the managers’ self-esteem and subsequently boosted performance. This is because it focuses the wage increase and better benefits on the performance evaluation. Figures 18 and 19 capture how job classifications were simplified and how the salary system has changed.
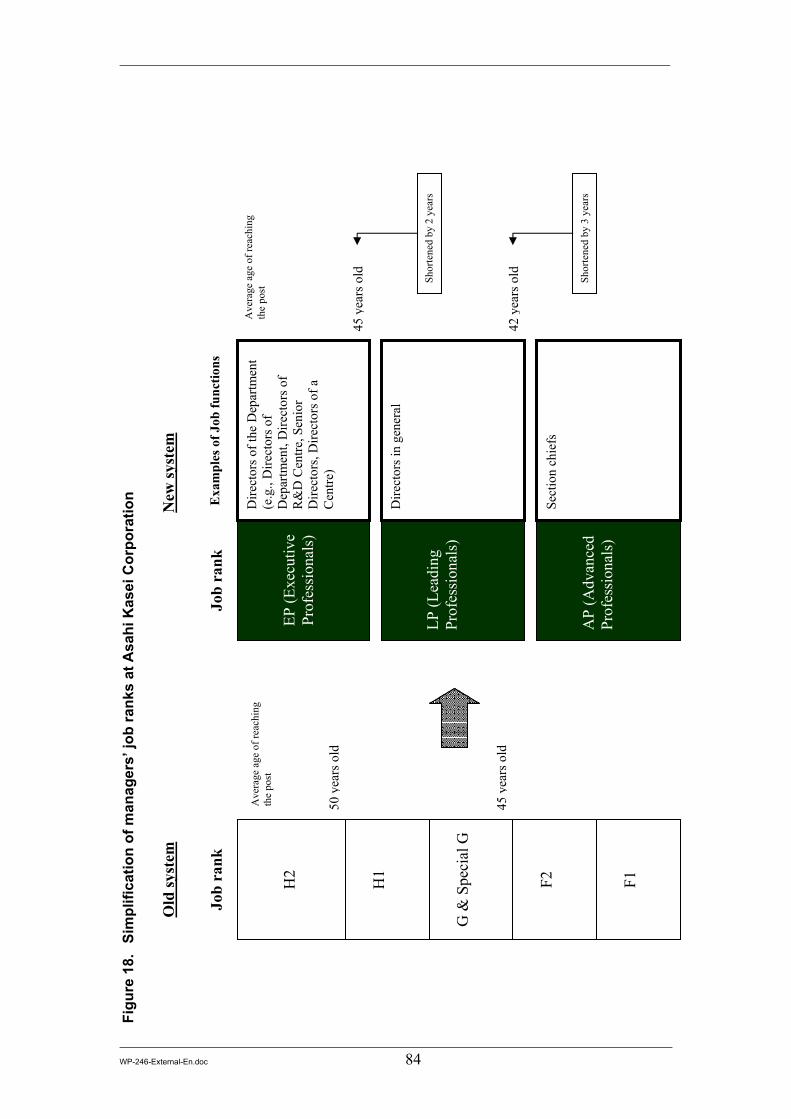
WP-246-External-En.doc 84
Figu
re 1
8.
Sim
plifi
catio
n of
man
ager
s’ jo
b ra
nks
at A
sahi
Kas
ei C
orpo
ratio
n
H2 H1
G &
Spe
cial
G
F2 F1
AP
(Adv
ance
d Pr
ofes
sion
als)
LP (L
eadi
ng
Prof
essi
onal
s)
EP
(Exe
cutiv
e Pr
ofes
sion
als)
Dire
ctor
s of t
he D
epar
tmen
t (e
.g.,
Dire
ctor
s of
Dep
artm
ent,
Dire
ctor
s of
R&
D C
entre
, Sen
ior
Dire
ctor
s, D
irect
ors o
f a
Cen
tre)
Dire
ctor
s in
gene
ral
Sect
ion
chie
fs
Old
syst
em
New
syst
em
Job
rank
Jo
b ra
nk
Exa
mpl
es o
f Job
func
tions
Ave
rage
age
of r
each
ing
the
post
Ave
rage
age
of r
each
ing
the
post
50 y
ears
old
45 y
ears
old
45 y
ears
old
42 y
ears
old
Shor
tene
d by
2 y
ears
Shor
tene
d by
3 y
ears
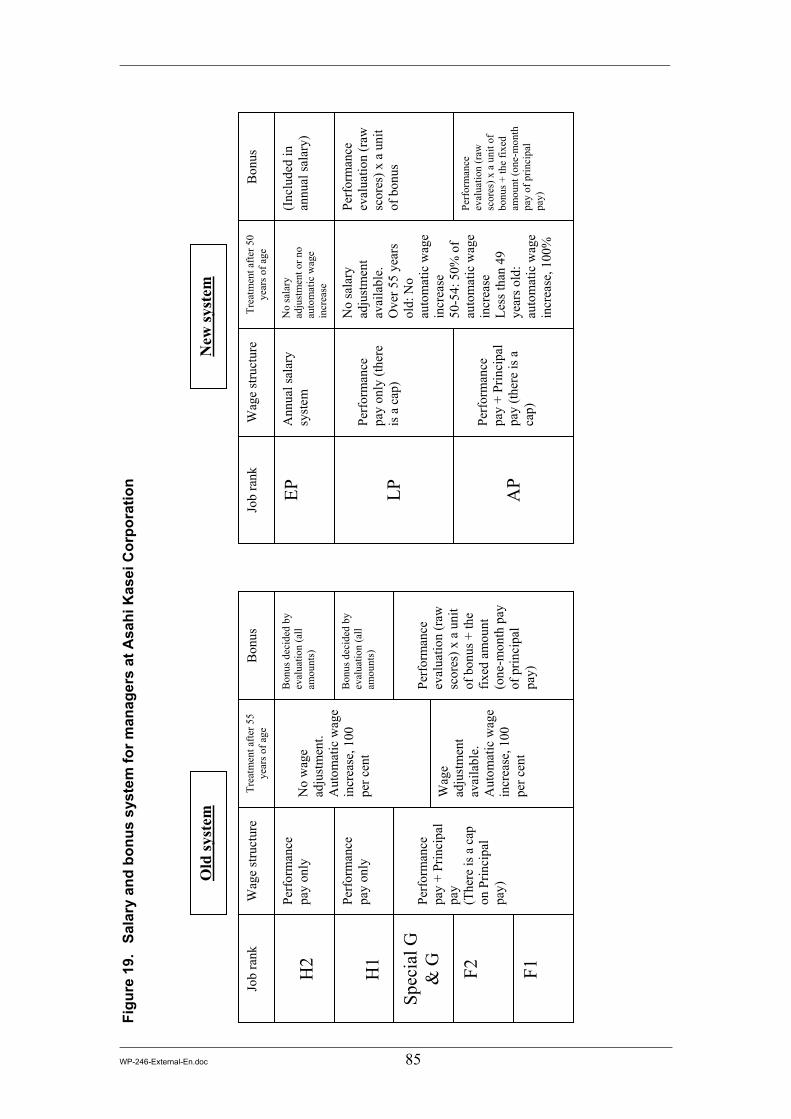
WP-246-External-En.doc 85
Figu
re 1
9.
Sala
ry a
nd b
onus
sys
tem
for m
anag
ers
at A
sahi
Kas
ei C
orpo
ratio
n
Job
rank
H2 H1
Spec
ial G
&
G
F2
F1
Wag
e st
ruct
ure
Perf
orm
ance
pa
y on
ly
Perf
orm
ance
pa
y on
ly
Perf
orm
ance
pa
y +
Prin
cipa
l pa
y (T
here
is a
cap
on
Prin
cipa
l pa
y)
Trea
tmen
t afte
r 55
year
s of a
ge
No
wag
e ad
just
men
t.
Aut
omat
ic w
age
incr
ease
, 100
pe
r cen
t
Wag
e ad
just
men
t av
aila
ble.
A
utom
atic
wag
e in
crea
se, 1
00
per c
ent
Bon
us
Bon
us d
ecid
ed b
y ev
alua
tion
(all
amou
nts)
Bon
us d
ecid
ed b
y ev
alua
tion
(all
amou
nts)
Perf
orm
ance
ev
alua
tion
(raw
sc
ores
) x a
uni
t of
bon
us +
the
fixed
am
ount
(o
ne-m
onth
pay
of
prin
cipa
l pa
y)
Job
rank
EP LP A
P
Wag
e st
ruct
ure
Ann
ual s
alar
y sy
stem
Perf
orm
ance
pa
y on
ly (t
here
is
a c
ap)
Perf
orm
ance
pa
y +
Prin
cipa
l pa
y (th
ere
is a
ca
p)
Trea
tmen
t afte
r 50
year
s of a
ge
No
sala
ry
adju
stm
ent o
r no
auto
mat
ic w
age
incr
ease
No
sala
ry
adju
stm
ent
avai
labl
e.
Ove
r 55
year
s ol
d: N
o au
tom
atic
wag
e in
crea
se
50-5
4: 5
0% o
f au
tom
atic
wag
e in
crea
se
Less
than
49
year
s old
: au
tom
atic
wag
e in
crea
se, 1
00%
Bon
us
(Inc
lude
d in
an
nual
sala
ry)
Perf
orm
ance
ev
alua
tion
(raw
sc
ores
) x a
uni
t of
bon
us
Perf
orm
ance
ev
alua
tion
(raw
sc
ores
) x a
uni
t of
bonu
s + th
e fix
ed
amou
nt (o
ne-m
onth
pa
y of
prin
cipa
l pa
y)
Old
syst
em
New
syst
em

WP-246-External-En.doc 86
When changing their pay systems, chemical companies attempt to meet multiple objectives. Case studies indicate that at first they attempt to make their pay system more equitable. Aiming for equity for all does not mean, however, ensuring a higher wage for all. Instead, chemical companies aim to redistribute limited pay resources to make their salaries attractive in the labour market; they must therefore focus on a specific group of workers and offer pay levels that are more attractive than the competitors’ in order to hire these workers or strengthen their loyalty. Some chemical firms try to achieve this in the name of increasing internal equity. To this end, they have devised numerous pay systems. Some firms have strengthened the ties of pay rises to the company’s economic gain while others have tried to gauge individual employees’ contributions and translate their achievements into individual economic rewards. Still others have tried to mix old and new pay practices. But none of these tasks is easy. Gainsharing or performance-based pay systems are not new to managers, but they are becoming more common among regular employees and production workers because they have significant implications for productivity. Chemical companies have increased transparency in the remuneration system and personal appraisal mechanisms as one package of new personnel management systems. Openness and transparency in pay systems have often had the beneficial effect of enhancing employees’ self-esteem and motivation. Some difficulties always arise in sustaining fairness and equity when there are links between a new pay system and personal appraisal practices because all appraisal factors are not necessarily easy to consider in a fair and just manner. Case studies indicate that pay systems and personnel management systems are constantly changing because there is a pressing need for chemical companies to find the best balance between enhancing workers’ motivation and reducing costs.

WP-246-External-En.doc 87
Country Minimum Medium MaximumAlbania 75 90 100Austria 1,268 1,762 2,105Bosnia and Herzegovina 165 188 285Brazil 115 145 478Bulgaria 110 170 220Croatia 200 424 1,000Denmark 1,480 1,998 2,190Germany 1,554 2,205 2,356Ghana 0.79 1.50 5.00India 31 73 168Nepal 28 30 33Norway 2,093 2,200 2,330Philippines 120 132 163Poland 471 942 1,507Romania 113 272 332Russian Federation 127 745 n.a.Slovakia 217 239 327Slovenia 277 429 832Spain 1,425 1,761 3,334Sweden 1,230 1,815 2,936Switzerland 2,385 3,621 5,176Thailand 133 333 1,333United Kingdom 1,312 2,172 3,064United States 1,280 2,400 3,840Uzbekistan 24 76 213
Table 26 Average monthly wages among unionizedproduction workers in the chemical industry,selected countries, 2000 (in US$)
Note: Data for Albania, Denmark, Romania and the United Kingdom areprovided by Chemical Independent Trade Union of Albania, KAD, Fed."Ptrom" and GMB, respectively.Source: “ICEM World Conference on the Chemical Industries, 26-28November 2001, Bangkok, Thailand,” The International Federation ofChemical, Energy, Mine and General Workers’ Unions (ICEM), 2001.
8. Remuneration
8.1. Pay level in general Table 26 lists contract-based average monthly wages – minimum, medium and maximum – among unionized chemical industry production workers in selected countries for the year 2000. It reveals that there is a difference in pay by country due to seniority in accordance with the level of workers’ skills. Based on the data provided in table 26, figure 20 shows wage disparities among unionized production workers by country. These figures demonstrate that for workers in some Asian countries internal equity is still far off while their European counterparts, particularly in the Nordic countries, have nearly achieved it. (See also Appendix 2. Evolution of real wages per employee in industrial chemical sector in US$ and national currency, selected countries, non-adjusted, 1990-2002).
Table 26. Average monthly wages among unionized production workers in the chemical industry, selected countries, 2000 (in US$)
Note : Data for Albania, Denmark, Romania and the United KIngdom are provided by Chemical Independent Trade Union of Albania, KAD, Fed. “Ptrom” and GMB, respectively Source: “ICEM World Conference on the Chemical Industries, 26-28 November 2001, Bangkok, Thailand”. The International Federation of Chemical Energy, Mine and General Workers’ Unios (ICEM),2001.

WP-246-External-En.doc 88
Figu
re 2
0. W
age
disp
arity
am
ong
unio
nize
d pr
oduc
tion
wor
kers
in
the
chem
ical
indu
strie
s, 2
000
0
100
200
300
400
500
600
700
800
900
1000 Tha
iland Uzb
ekist
anGha
naInd
iaCroa
tiaBraz
ilPola
ndSlov
enia
United
Stat
esRom
ania
Sweden
Spain
United
King
dom Switz
erlan
d Bulgari
a
Bosnia
and H
erzeg
ovina
Austria
German
y
Slovak
Rep
ublic Den
mark Philipp
ines
Albania
Nepal
Norway
Sour
ce: I
nter
natio
nal F
eder
atio
n of
Che
mic
al, E
nerg
y, M
ine
and
Gen
eral
Wor
kers
' Uni
ons
(ICEM
): IC
EM W
orld
Con
fere
nce
on
the
Che
mic
al In
dust
ries,
26-
28 N
ovem
ber 2
001,
Ban
gkok
, Tha
iland
.
Percentage

WP-246-External-En.doc 89
8.2. Salaries for chemists As shown in figure 21, chemists’ pay reveals a seniority-based salary practice. Salaries of employees with M.S. degrees are generally higher than those of managerial white-collar employees, while chemists with PhDs receive salaries twice as high as chemists with M.S. degrees.
Figure 21. Median salary for chemists with years lapse since degree earned, United States
0.0
50.0
100.0
150.0
200.0
250.0
300.0
2-4 5-9 10-14 15-19 20-24 25-29 30-34 35-39
Note: Data are as of 1 March 2002.Source: American Chemical Society (ACS) and Chemical & Engineering News, August 5, 2002
$ thousands
Ph.D
M.S.
B.S.
8.3. Wage differences by gender Gender-related wage differences exist in the chemical industry and are indeed prevalent throughout the manufacturing industries. Table 27, for example – showing the average monthly wages by gender and by industry in 2004 and 2005 in Norway – reveals that a gender wage gap, although it has been diminishing, still exists. In 2005, female workers in the Norwegian basic chemical industry received NOK 1,086 per month less than their male counterparts.
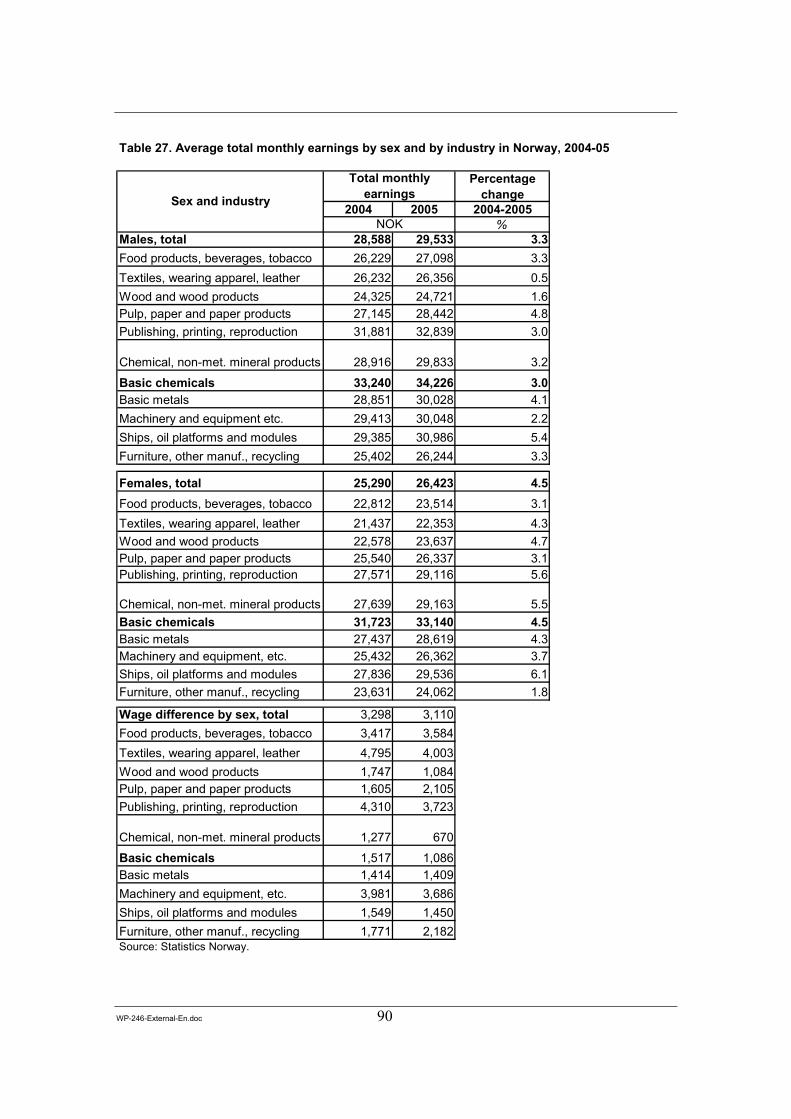
WP-246-External-En.doc 90
Table 27. Average total monthly earnings by sex and by industry in Norway, 2004-05
Percentage change
2004 2005 2004-2005%
Males, total 28,588 29,533 3.3Food products, beverages, tobacco 26,229 27,098 3.3Textiles, wearing apparel, leather 26,232 26,356 0.5Wood and wood products 24,325 24,721 1.6Pulp, paper and paper products 27,145 28,442 4.8Publishing, printing, reproduction 31,881 32,839 3.0
Chemical, non-met. mineral products 28,916 29,833 3.2
Basic chemicals 33,240 34,226 3.0Basic metals 28,851 30,028 4.1Machinery and equipment etc. 29,413 30,048 2.2Ships, oil platforms and modules 29,385 30,986 5.4Furniture, other manuf., recycling 25,402 26,244 3.3
Females, total 25,290 26,423 4.5Food products, beverages, tobacco 22,812 23,514 3.1Textiles, wearing apparel, leather 21,437 22,353 4.3Wood and wood products 22,578 23,637 4.7Pulp, paper and paper products 25,540 26,337 3.1Publishing, printing, reproduction 27,571 29,116 5.6
Chemical, non-met. mineral products 27,639 29,163 5.5Basic chemicals 31,723 33,140 4.5Basic metals 27,437 28,619 4.3Machinery and equipment, etc. 25,432 26,362 3.7Ships, oil platforms and modules 27,836 29,536 6.1Furniture, other manuf., recycling 23,631 24,062 1.8
Wage difference by sex, total 3,298 3,110Food products, beverages, tobacco 3,417 3,584Textiles, wearing apparel, leather 4,795 4,003Wood and wood products 1,747 1,084Pulp, paper and paper products 1,605 2,105Publishing, printing, reproduction 4,310 3,723
Chemical, non-met. mineral products 1,277 670
Basic chemicals 1,517 1,086Basic metals 1,414 1,409Machinery and equipment, etc. 3,981 3,686Ships, oil platforms and modules 1,549 1,450Furniture, other manuf., recycling 1,771 2,182Source: Statistics Norway.
Total monthly earnings
NOK
Sex and industry

WP-246-External-En.doc 91
8.4. Harmonization of wages in the German chemical industry Harmonization between pay rates in eastern and western Germany has been ongoing since the unification of Germany in 1990. In 1991 average pay in the east was about 60 per cent of that in the west. By the end of 2003, it had reached 93.5 per cent. Flexibility in negotiations appears to have slowed down the process of harmonizing agreed rates in eastern and western Germany. Table 28 shows that as at 31 December 1997, pay harmonization was achieved in such sectors as iron and steel, Saxony’s engineering sector, as well as the printing sector, private banking and cleaning sector in Berlin. In the chemical industry, however, pay in eastern Germany was still 83.8 per cent of that in the western part of the country. Although this gap has narrowed over time in the chemical industry, which has no set harmonization process, pay levels in eastern Germany rose from 87.5 per cent of western levels to 90 per cent by 1 October 2003. Full harmonization is due to be phased in by 2009. The process has been also delayed in other sectors such as the paper industry, the roofing industry, and the temporary employment agency sector.40 Table 28. Pay harmonization between eastern and western Germany as at 31 December 1997
IndustryEastern rates as a % of western rates
Iron and steel 100.0Engineering, Saxony 100.0Printing 100.0Private banking 100.0Cleaning, Berlin 100.0Paper processing, Saxony-Anhalt, Thüringen, Saxony 99.2Private insurance 98.0Wholesale, Saxony-Anhalt* 94.5Retail, Brandenburg, Saxony-Anhalt, Thüringen, Saxony 94.0Construction, excluding East Berlin 93.8Wood and synthetics processing, Saxony+ 90.3Confectionery 85.8Public services 85.0Automotive, Thüringen* 84.1Deutsche Bahn AG (German Railways) 84.0Chemicals** 83.8Brown coal and gas 81.8Energy and energy provision 81.6Textiles* 77.5Hotels and catering, Saxony 76.3Private transport, Saxony* 69.7Agriculture, Mecklenburg-Vorpommern* 68.2Clothing* 66.2
**Starter rates.Notes: *Pay only. +Remuneration, based on pay in Bavaria.
Source: WSI-Tarifarchiv.
40 “Collective bargaining in 2003”, EIRR 364, May 2004, pp. 25-29.

WP-246-External-En.doc 92
8.5. Measures aimed at redressing inequalities The following sections discuss some case studies focusing on measures aimed at redressing above-mentioned inequalities and at promoting gender equality in the chemical industry.
8.5.1. Family-friendly policies The USW and PACE International have undertaken to produce a collective bargaining manual targeting issues of importance to working families. The manual contains information on each topic along with sample language to submit for bargaining, as well as suggestions on the need to retain certain components to make the language strong and avoiding language that would weaken the goals set. It is clearly coded by specific topic areas and provides both the initial language to get one’s foot in the door on certain issues as well as more advanced language for future rounds of bargaining that can improve the benefits of the issue being addressed.41 At Asahi Kasei Corp., ranked ninth in the “consideration of childcare” category in the 2006 Survey on Firms Offering a Comfortable Working Environment, between January and June 2006 over a hundred male employees took childcare leave. Seeking possible measures to increase male participation in its child-rearing leave programme, Asahi Kasei arranged a series of labour-management meetings under the title “The New Papa Project” over two months starting in May 2005. The participants found that the main obstacles to male workers taking childcare leave were: (i) lack of a strong, pressing need; (ii) stoppage of wages during leave; and (iii) difficulty in asking superiors to authorize leave. They also stated that the meetings served as a good opportunity for them to reverse their own way of thinking: they now believe that they must create a workplace atmosphere in which all workers can take leave when they need to.42 A case at Roche shows an example of harmonizing equality opportunities and diversity policies to meet the interests of employees and company alike. Roche’s latest corporate principles, adopted in 2003, state at the outset that the company’s success “depends on the talent and performance of dedicated employees”. In order to optimize this success, the principles call on all employees to respect each other’s rights and dignity, and they express the company’s commitment to developing people’s talents and promoting equality and diversity. The company has restated its employment policy, which is designed to establish a uniform minimum standard to be applied by all Roche companies and employees. It includes topics such as recruitment, the promotion and development of talent, diversity, the prohibition of discrimination, and the non-toleration of harassment. The company has had an equal opportunity representative since 1992. Initially, the post holder’s duties mainly related to dealing with gender issues. Situated outside the company’s line-
41 International Metalworkers’ Federation, Reports of Affiliates, 2005, p. 136. 42 The Japan Labor Flash No. 68, (Email Journal), 1 September 2006.

WP-246-External-En.doc 93
management structure in order to ensure impartiality, the post holder reports directly to the head of human resources (internal management level B), who in turn reports directly to a member of the company management board (Konzernleitung) (management level A). However, the post holder is now also part of a seven-person human resources management team created in 2002. The company operates a recruitment system that does not include quotas (e.g. to increase the number of women in the workforce). Instead, it seeks to employ the right person for the job. A range of family-friendly measures are in place, making Roche a sought-after employer for people with families. They can be summarized as follows:
The company-subsidized childcare scheme started out with a few places at a local nursery in Basel, where the company is located, and now provides care for 100 children. Since 1996, Roche has had its own facilities for 44 children, and a further 56 children benefit from a system where the company “purchases” places at other establishments on behalf of its employees.
The company operates a system of pre-maternity leave talks – carried out according to strict guidelines – between the employee and her line manager to establish individual solutions to any issues arising. Employees are entitled to four months’ maternity leave on full pay.
Leave conditions enabling parents to take care of sick children have been improved recently. Whereas previously there was an annual maximum of three days’ paid leave that could be taken for this purpose, it is now three days each time a child is unwell, on production of a doctor’s certificate. If the amount of time taken off seems to be becoming excessive, discussions are held between the employee and the line manager to try to find alternative solutions.
The availability of flexible working models for employees whose work allows it. This ranges from 80 per cent home-working to working part time (the range of part-time work contracts in operation spans between 20 per cent and 95 per cent; one of the most popular part-time home-working arrangements is for 20 per cent of working time to be spent at home); and annualized working time (Jahresarbeitszeit) which is standard for all but shift employees.
Roche’s initiatives aimed at promoting equality include the following:
The company’s equal opportunities department has worked on a concept for “women and leadership”; the first step of this initiative, a “women and leadership network”, came into being in October 2003.
Roche has also developed a mentoring programme which does not focus on women as such but allows for gender-specific mentoring, whereby a junior female manager, for example, has the opportunity to be mentored by a senior female manager.
Also aimed at female managerial staff, introduction of a series of seminars at which women managers have the opportunity to discuss a range of pertinent issues, such as leadership and leadership strategies.
WP-246-External-En.doc 94
There was also a one-off, four-week practical course for assistants and laboratory workers returning to work after a break to start a family.
In addition, as part of company policy to provide employees with access to advice and support, the equal opportunities department offers an advice and counselling service by appointment. The discussions can cover a wide range of issues, from advice on personal problems, advice on drug and alcohol addiction to problems of abuse of authority and equal opportunity. All advisory services are bound to observe confidentiality. The department may also be called upon to mediate in work-related situations. Most of the employees coming for advice to the equal opportunities representative have been women. As for the company’s medical service, besides purely medical problems it also deals with socio-medical issues such as stress, psychological harassment and conflicts at the workplace.43
8.5.2. Training as an instrument for promoting opportunities Provisions on training are a common feature of collective agreements. The 1998 German sectoral agreement, for example, pushed for a higher number of training places in the chemical industry. In western Germany the number of training places rose by over 20 per cent since 1995. Both IG BCE and BAVC were keen to agree a clause increasing the number of training places as they were against the introduction of any statutory measures forcing companies to take on trainees. The agreement allowing long-term unemployed people and new trainees to be taken on at 90 per cent and 95 per cent of agreed rates respectively was extended in 1998.44
8.5.2.1. Time account The German collective agreement allows the trade union and the company to decide how vocational education and training (VET) will be organized. Workers need to be given the opportunity and adequate time must be provided for that purpose. The agreement also includes contingencies for restructuring. The German chemical collective agreement has introduced a “time account” for the purpose of VET. Time accounts are used for contingencies such as plant closures and corporate restructuring, and funds for them are collected from workers’ overtime pay or supplementary allowances. Tax and social security contributions on this payment are exempted. In companies with a long-standing time account system, such resources can be used for higher education. Key features of VET programmes in the collective agreement between BAVC and IG BCE in the German chemical industry include:
widening the definitions of competences and skills needed for work so VET programmes can operate flexibly at the company level to meet current and future needs in accordance with a company’s circumstances;
43 “Policies on diversity and equal opportunities at Roche”, EIRR 355, August 2003, pp. 22-25. 44 “14-month deal in chemicals”, EIRR 293, June 1998, p. 17.
WP-246-External-En.doc 95
introducing a cost-sharing arrangement between workers and management on VET programmes in limited circumstances;
expanding the use of outside VET consulting services and specialized VET institutions when VET programmes are needed immediately;
introducing time account rules for organizing VET to avoid further costs to chemical companies.45
8.5.2.2. Training in restructuring In mid-1997, BASF announced Agreement 2000 (Vereinbarung 2000) as part of a general strategy to reinforce the Ludwingshafen site as its main plant in terms of production and research and development. The company pledged to invest some DEM 2 billion a year in the site and to start negotiations with the works council. Negotiations opened in autumn 1997 and an agreement was reached on 30 October, running from 31 October 1997 to the end of 2000. BASF’s Agreement 2000 makes a commitment to take on a minimum of 800 trainees a year until 31 December 2000 and to subsequently employ in some capacity – either on a full- or a part-time basis – all trainees who successfully complete their apprenticeships. In order to offer as much employment opportunity and work experience as possible to qualified trainees, the agreement contains a commitment to maximize the proportion of part-time working amongst the workforce at the Ludwingshafen site. Some inequalities in wage levels are easily recognizable, for example those based on educational background, gender or region. The chemical industry, however, provides remedial measures to redress problems regarding equal pay. This drive is strongly connected to gender equality and equal opportunities for all. One such comprehensive measure is family-friendly policies. These policies are not only aimed at achieving equality by gender but are also a means of respecting workers’ rights and dignity as well as the company’s commitment to recognizing their talents. The policies need to include numerous assistance programmes for employees, with a dedicated group of specialists to address their problems and provide them with help and advice. Similarly, education and training could mitigate surplus manpower problems by providing the workers concerned with alternative employment and better pay.
45 Steffen A. Rogalski, “Vocational education and training in the chemical industry in Germany and the United Kingdom”, Working Paper No. 242, ILO, 2006.
WP-246-External-En.doc 96
9. Cross-continent organizing campaigns by chemical trade unions
9.1. The ICEM’s campaigns for chemical multinationals In recent years there has been an upsurge in efforts by trade unions to set up worldwide councils and networks within multinationals, or to organize campaigns that involve the creation of ongoing links between unions in various countries. These are unilateral initiatives by trade unions to promote dialogue between employers and employees to resolve disputes arising between the parties concerned. Some examples of such initiatives in the chemical industry are briefly described in box 3.
Box 3. The ICEM’s multinational corporate network in the chemical industry
Bridgestone. In 1996, the ICEM launched the first corporate campaign in support of US workers “permanently replaced” by Bridgestone. A network was established, both electronic and in person, which continues to circulate information worldwide among Bridgestone workers and unions that negotiate with the company. In August 2000, the network for “mutual defence and advancement” was formalized at a meeting of 75 union representatives from nine countries. Continental. A particularly extensive campaign was organized in the United States around a strike by 1,450 workers at the General Tire plant of the German-based tyre maker Continental in Charlotte, North Carolina. The workers started their strike in September 1998 over a pay dispute and were subsequently “permanently replaced” by management and thus effectively locked out and dismissed. A European solidarity tour was organized in 1999, taking Charlotte workers and representatives of their union to meet union representatives and workers in Belgium, the Czech Republic, France, Germany, Slovakia, Turkey and the United Kingdom. A global cyber-campaign was launched by the ICEM. In addition, a week of action was held in June 1999, including a solidarity strike by Continental workers in South Africa, a “consumer awareness” campaign in the United States, and protests at German consulates and embassies in a number of countries. In the end, an agreement was reached at the Charlotte plant in September 1999. Goodyear. In 1999, ICEM-affiliated trade unions from 16 countries (Brazil, Canada, Chile, Colombia, France, Germany, Guatemala, Japan, Malaysia, Morocco, Slovenia, South Africa, Turkey, the United Kingdom, the United States and Venezuela) organizing in Goodyear formed a global network of unions for their mutual defence and advancement. In 2001, the network launched a worldwide newsletter aimed at helping to coordinate union information and action within Goodyear on all continents. It also launched a

WP-246-External-En.doc 97
campaign against alleged anti-union practices and sackings in the company’s Guatemalan operations. DuPont. In March 2006, ICEM-affiliated trade unions from eight countries (Austria, Belgium, Brazil, Denmark, France, Germany, the Netherlands and the United States) launched a global DuPont trade union network aimed at establishing efficient cooperation and practical international solidarity between the different trade unions that represent DuPont’s workforce in their respective countries. Its main ambitions are the exchange of information and company strategies, useful for collective bargaining, as well as the planning of joint action where necessary. Source: www.icem.org
Brown and Chang (2004) examined the use of vertical and horizontal campaign strategies of the Paper, Allied-Industrial, Chemical and Energy Workers’ International Union (PACE), which is part of the United Steelworkers (USW), against Imerys Groupe in France. They argued that trade unions, particularly in the United States, take two-way campaign strategies to effectively operate their corporate campaigns – vertical and horizontal conflict escalations. Vertically, unions appeal to stockholders and financial stakeholders, attacking the public image of the corporation and its associates, and exploiting the vulnerability within the hierarchy of the corporate power structure. In other words, unions try to seize the moral high ground during labour disputes. In contrast, horizontal conflict escalation involves coalition building, appeals to regulatory agencies, and consumer action. Trade unions attempt to expand the scope of the immediate company target of a labour dispute horizontally by seeking the support of individuals and organizations that may not have an apparent self-interest in the resolution of the dispute. Examples of horizontal conflict escalation are unions’ alliances with other members of the labour movement, churches, social and political activists, and other special interest groups. The case illustrates American and European chemical trade unions’ drives to organize on multiple levels simultaneously so as to escalate the conflict on all fronts. PACE and its international organization, the ICEM, effectively allied vertical conflict escalation at the international level. The issue at stake was trade union representation. The PACE campaign began in May 1999. The new company (Imerys), headquartered in Paris, employed 10,000 people, 48 per cent of whom worked in North America. The effects of the merger played out in two adjoining companies in Sylacauga, Alabama. Both companies (the smaller Georgia Marble, owned by Imetal, and English China Clays – ECC) mine and process paper-grade ground-calcium carbonate, which is used to prevent newsprint smearing. United Paperworkers International Union (now USW) represented the employees at Georgia Marble, while ECC was not unionized. In June 1999, the new company withdrew recognition of the trade union and implemented new terms and conditions of employment, arguing that the union no longer held a majority after the merger.

WP-246-External-En.doc 98
The unique nature of this campaign, coordinated by the ICEM, consists in a combined commitment of horizontal and vertical conflict escalation on an international scale. The vertical conflict escalation began in the summer of 1999 when four trade unions in Europe – UK’s Transit and General Workers’ Union (T&G), Belgium’s Fédération Générale du Travail, and France’s CFDT and Force Ouvrière (FO), intervened in the PACE campaign to organize Imerys’s Sylacauga plant, working against employer anti-union tactics and for coordinated, centralized bargaining and firm guarantees of workers’ right to strike and engage in concerted activity. The ICEM and PACE devised a comprehensive plan to inform Imerys’s European employees of the company’s “union-busting” activities in the United States. Imerys was controlled by two holding companies, Pargesa Holding, S.A., largely held by Belgium’s Frere family, and Groupe Bruxelles Lambert, S.A., controlled by Montreal’s Desmarais family. The ICEM and PACE brought pressure on Baron Frere. Paul Lootens, General Secretary of the Belgian National Confederation of Trade Unions (FGTB) confronted Frere at a board of directors meeting for Belgium’s largest bank holding company. Frere claimed no knowledge of the Alabama union dispute but promised to investigate. The FGTB’s intervention was all the more noteworthy for the fact that they had no direct self-interest in the conflict; they did not represent any Imerys employees. The union’s next drive was to publicize in Europe the company’s behaviour in the United States. The press took an immediate interest in Imerys’s organizing campaign in Sylacauga. France’s Le Figaro, for example, described Imerys’s behaviour as the double-talk of multinationals. In Belgium, De Financial Economische detailed Imerys’s anti-union behaviour in the United States and Baron Frere’s major holding in the company. In the United Kingdom, a series of articles in the Cornish Guardian condemned the company’s behaviour in the United States. The Boston Globe criticized the company as well. The ICEM and PACE’s escalation of vertical conflict focused on protest activities at Imerys’s shareholders’ meeting. Outside, shareholders were met by a demonstration; flyers, posters, and speakers described the company’s unethical behaviour in the United States. The French national newspaper, Libération, observed that for the first time a French company saw its shareholders meeting turned into a “platform for international trade union demands”. They added that “a shudder went through the investor ranks with the effect that France has now been reached by ‘socially responsible investment or ethical investment’”.46 In December 1999, PACE purchased 200 shares, a sufficient number to place their Paris liaison on the meeting agenda. An ICEM representative also participated in the shareholders’ meeting representing 4,000 Imerys shares held by Walden Asset Management, a socially conscious investment company in Boston. The questioning of Imerys’s CEO about the company’s conduct took up the second half of the meeting. In the end, the CEO promised to cease the campaign against the union in Alabama. Within days of the meeting, the CEO removed the plant manager at its Sylacauga plant.
46 Libération, 10 May 2000.
WP-246-External-En.doc 99
Finally, by a vote of 205 to 181 PACE won the right to represent Imerys’s 400 employees. Some seven months after the election, the union signed a three-year collective bargaining agreement, with modest improvements in benefits and an annual 3 per cent increase in wages. Trade unions evaluated that the success of the campaign was due to a consolidated effort of all parties involved in utilizing horizontal and vertical conflict escalation. The “grass roots” campaign against Imerys in the United Kingdom, France, Belgium, and the United States had a more immediate and permanent effect. Information meetings, pickets, buttons, rank-and-file trade union mobilization, and the innovative use of the internet proved effective in connecting rank-and-file and local union leaders at plant level. In addition, PACE involved government bodies such as the US Department of Justice and NLRB. PACE and ICEM’s campaign at the international level worked. They confronted Imerys’s management at the Paris shareholders’ meetings, a first in France, resulting in uniformly negative press for the company. In addition, they innovatively used communication technology coupled with its multilingual staff in Europe. Brown and Chang (2004) add that the momentum of success was due to the characteristics of workers. In Sylacauga, shortly after the plant manager was removed the anti-union campaign diminished in intensity. There was almost no militancy among the workers, and they had few allies in the local community. Imerys needed nothing from the employees or from PACE and was not susceptible to economic or political overtures or leverage. The authors conclude that the actions against a strategic part of Imerys globally would likely have been insufficient to secure a union win. The careful escalation of pressure, vertically and horizontally, made the difference in the organizing drive in Alabama.47
9.2. Transnational bargaining – An EU approach The EU has been exploring the possibility of expanding the application of collective bargaining to a company operating throughout the EU. It is considering expanding collective bargaining from the realm of the EWC to cross-EU level. In its Social Agenda 2005-2010, published in February 2005, the European Commission included in the list of employment-related proposals and initiatives an optional European framework for transnational collective bargaining. It argued that such a framework at either company level or sector level could help companies and sectors to handle challenges dealing with issues such as work organization, employment, working conditions and training. Furthermore, this would give the social partners a basis for increasing their capacity to act at transnational level and provide an innovative tool to adapt to changing circumstances, together with furnishing cost-effective transnational responses. Table 29 lists transnational framework agreements in the chemical industry in force in 2006. These instruments play a significant role in promoting negotiations between companies and employees concerned because there is no general legal framework for transnational collective bargaining that would clarify the procedure, the negotiating agents, and the conditions for making the agreements binding. For example, the EWCs lack formal 47 Edwin L. Brown and Tracy F.H. Chang, “PACE International Union vs. Imerys Groupe: An Organizing Campaign Case Study”, Labor Studies Journal, Vol. 29, No. 1 (Spring 2004), pp. 21-41.
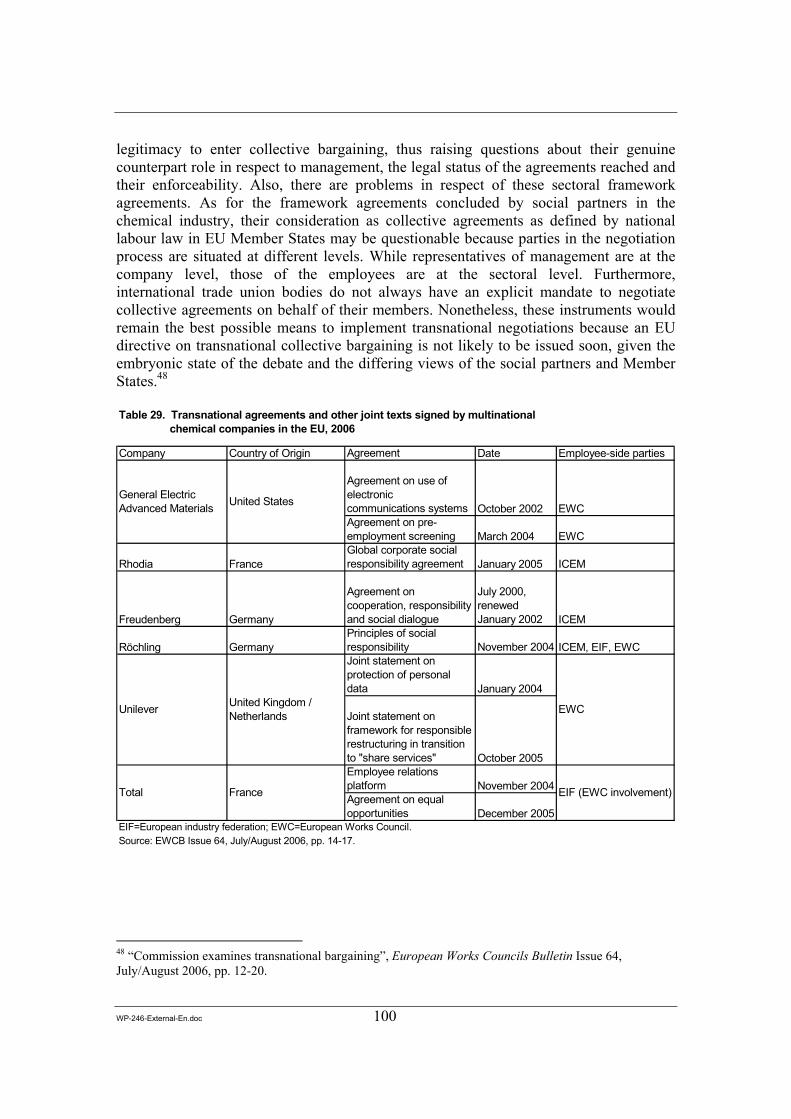
WP-246-External-En.doc 100
legitimacy to enter collective bargaining, thus raising questions about their genuine counterpart role in respect to management, the legal status of the agreements reached and their enforceability. Also, there are problems in respect of these sectoral framework agreements. As for the framework agreements concluded by social partners in the chemical industry, their consideration as collective agreements as defined by national labour law in EU Member States may be questionable because parties in the negotiation process are situated at different levels. While representatives of management are at the company level, those of the employees are at the sectoral level. Furthermore, international trade union bodies do not always have an explicit mandate to negotiate collective agreements on behalf of their members. Nonetheless, these instruments would remain the best possible means to implement transnational negotiations because an EU directive on transnational collective bargaining is not likely to be issued soon, given the embryonic state of the debate and the differing views of the social partners and Member States.48 Table 29. Transnational agreements and other joint texts signed by multinational chemical companies in the EU, 2006
Company Country of Origin Agreement Date Employee-side parties
Agreement on use of electronic communications systems October 2002 EWCAgreement on pre-employment screening March 2004 EWC
Rhodia FranceGlobal corporate social responsibility agreement January 2005 ICEM
Freudenberg Germany
Agreement on cooperation, responsibility and social dialogue
July 2000, renewed January 2002 ICEM
Röchling GermanyPrinciples of social responsibility November 2004 ICEM, EIF, EWCJoint statement on protection of personal data January 2004
Joint statement on framework for responsible restructuring in transition to "share services" October 2005Employee relations platform November 2004Agreement on equal opportunities December 2005
Total France
EIF=European industry federation; EWC=European Works Council.Source: EWCB Issue 64, July/August 2006, pp. 14-17.
EIF (EWC involvement)
Unilever United Kingdom / Netherlands EWC
United StatesGeneral Electric Advanced Materials
48 “Commission examines transnational bargaining”, European Works Councils Bulletin Issue 64, July/August 2006, pp. 12-20.
WP-246-External-En.doc 101
The ICEM’s multinational corporate-based workers’ networks demonstrate that they can play highly significant roles in leading the parties in conflict to come to a constructive agreement. This is because trade unions have developed a consolidated international solidarity network, ensuring full participation of the global trade unions concerned in using the means of horizontal and vertical conflict escalation. Chemical workers’ trade union multinational networks will continue to play an important role because industrial conflicts are likely to occur where there are no global framework agreements or gentlemen’s accords. Recent trends in the European Union suggest that the chemical industry will continue to be in the forefront of expanding collective bargaining coverage from the national to transnational agreements where there is no initiative or framework of a Europe-wide collective agreement covering particular companies operating in the European Union.
WP-246-External-En.doc 102
10. Conclusion Negotiations in the chemical industry vary from one country to another, the most common forms being sectoral negotiations and company or plant level negotiations. Sectoral negotiations are still dominant in the European countries in particular. In these countries, pay and conditions of work in the industrial sector are decided through sectoral negotiations which may take place either at central or regional level, depending on the country. One of the characteristics of negotiations in the chemical industry is that the industry's role in the overall national negotiations has been increasing. With the great majority of employees covered by collective bargaining, the metalworking industry has traditionally setting the pattern in sectoral negotiations, a pattern followed by other industries, including the chemical industry. In Germany and Belgium, however, the chemical industry has come to play the pivotal role as a pattern setter in overall sectoral negotiations. What is the significance of sectoral negotiations? They can bring benefits to the chemical companies and their employees alike. As a benefit for employers, sectoral negotiations contribute to preserving industrial peace, and this has enormous cost-saving effects for companies. Where negotiations take place at sectoral level, individual chemical firms are likely to be affected only marginally by disputes over wages and conditions of work. In addition, when companies negotiate individually, they cannot count on the solidarity of other employers. A benefit for employees is that sectoral negotiations are an effective means of developing standards for wages and working conditions throughout the industry. Sectoral negotiations help those who are employed in small and medium-sized chemicals firms to harmonize their wages and working conditions with those – usually more favourable – that prevail in large chemical firms. In addition, minimum pay is negotiated by means of legally binding collective agreements at the sectoral level. Company-level negotiations bring about flexibility at that particular level, but this has resulted in wage drift. Large chemical firms in the Netherlands and Switzerland decide their pay increases at company level. In Switzerland, past negotiations used to be split into two elements – a purchasing-power increase and a real-term rise. More recently, pay has been negotiated as a single issue while an automatic annual pay increase, negotiated as part of a long-term deal, is becoming rare. Pay bargaining is increasingly characterized by the inclusion of flexible, performance-related arrangements. As a result, wage differences between workers have grown and the wage gap between them is likely to widen. What developments have there been in sectoral collective bargaining over the past few decades? One distinguishing feature is its greater decentralization. Although no data address this issue exclusively in respect of the chemical industry, reliable figures indicate that the coverage of sectoral negotiations has been decreasing overall in the manufacturing sector. The chemical industry is not an exception. The general trend is for sectoral negotiations to move towards the company level – in other words, decentralization. Sectoral collective bargaining coverage in the manufacturing sector in western Germany, including the chemical industry, fell from 61.4 per cent in 1995 to 49.0
WP-246-External-En.doc 103
per cent in 2000, although the number of workers covered by the sectoral collective agreement remained relatively high, standing at more than 70 per cent of manufacturing workers in 2000. Small and medium-sized companies have been deviating from sectoral negotiations over time, primarily on account of tightening financial situations. Case studies in Finland make evident the changing nature of issues covered by sectoral agreements. Two identical studies conducted in 1992 and 1998 demonstrate that changes in social partners’ needs towards negotiations govern the choice of subjects put on the negotiating table. Regardless of changes in the financial environments over time, however, one important item remains unchanged on the bargaining agenda, and that is wages. Even during a relatively limited time a period of six years, the changes in the economic environment were reflected in the negotiations. In the early 1990s, economic stagnation in Finland caused serious socio-labour problems in the country. During those years, therefore, bargaining issues focused on lay-offs, holiday pay and wage drift because trade unions were committed to coping with unemployment and securing employment. These negotiations were heavily centralized. By contrast, the 1998 negotiations saw greater decentralization, although centralized sectoral bargaining remained important in deciding wages and some essential conditions of work. A proliferation of company-level bargaining is undeniable. In Finland, 90 per cent of the establishments studied had in place a local agreement on at least one issue. On average there were 13 contracts per establishment, and the larger the number of employees the greater was the number of such agreements. In contrast, in 1998 the most popular issues in company-level bargaining were related to working time: most common were the issues concerning flexi time (52 per cent), the length of breaks (46 per cent), and the standard length of daily (40 per cent) and weekly working time (35 per cent). Similarly, throughout the 1980s and the 1990s the chemical industry in Western Europe explored the possibility of shortening the weekly working time. Negotiations on working time resulted in redefining the nature of sectoral bargaining. This can be seen in negotiations at Akzo Nobel in the Netherlands and in the German chemical industry. In 1997, Akzo Nobel concluded an agreement on introducing flexible working time arrangements, reducing the weekly working time to 36 hours. The German chemical industry first attempted to introduce flexibility in working time arrangements in 1994, when it introduced a scheme allowing company-specific variations from the 37.5 hours per week norm to be negotiated at company level. The scheme, known as a “working time corridor”, enabled management and workers to reduce the weekly working time within the company down to 35 hours in proportion to a cut in wages, or to increase it to 40 hours without payment of an overtime premium. In 1998 the reference period – the period during which companies could arrange flexible working time – was extended to 36 months. As a result, in exchange for a shorter working week, chemical trade unions seem to make a concession regarding employers’ demands for greater flexibility in working time arrangements. Subsequently, greater flexibility in negotiations opened the door to more deviations from the sectoral agreements. Opening clauses allow companies that find themselves in difficult economic circumstances to postpone payment of all or part of the
WP-246-External-En.doc 104
collectively agreed increase in return for a guarantee that no redundancies will be made during the life of these opening clauses. In 1997, the German chemical industry introduced a pay flexibility agreement allowing companies to pay up to 10 per cent below agreed rates at company level provided that this was linked to job security and increased competitiveness measures. These opening clauses are accepted in the chemical industry in Austria, Italy and Germany. The growing flexibility in sectoral negotiations is not limited to the chemical industry; it is the overwhelming trend in many other industries. Similar developments can be observed with the introduction of new legislation leading to greater decentralization of negotiations in return for shorter working time. In France, public policy is promoting company-level negotiations where the government gives financial incentives to firms for negotiating working-time reductions with their employees. French labour laws not only resulted in institutionalizing the decentralization of bargaining but they also adopted the minority trade union principle, under which an agreement was valid even if it was signed by one trade union representative only. This gave rise to difficult cases where an agreement could be in force even though it had not been signed by the majority of the trade union representing employees in a specific company or sector. The laws resulted in jeopardizing the unions’ initiatives on concluding sectoral agreements. Another example is the United States, where labour laws restrict negotiations to a bargaining unit within a company, requiring that they be carried out only between the management and the workers concerned at the bargaining unit. Levels of trade union density directly affect the levels of collective bargaining in the chemical industry. The overall unionization rate has been declining in countries such as Australia, Austria, Italy, the Republic of Korea, Japan, Norway, the United Kingdom, and, the United States, whereas in Belgium, Denmark, Finland, Spain, and Sweden, for example, it is on the rise. The exact unionization rate in the global chemical industry is unknown. Some information is available, however, and although fragmented it suggests that the unionization rate in the chemical industry might have decreased in recent years. One of the primary reasons for the drop in trade union membership is the reduction of overall employment in the industry. The number of employees in industrial chemicals alone fell from some 8.8 million in 1995 to about eight million in 1999. It is estimated that the overall chemical industry lost over one million employees in just four years. The second reason is that changes in the industries' structure led to a loss of skilled workers in the chemical industry. Trade union density and collective bargaining show some correlation, but the findings are inconclusive. Instead, the levels of collective bargaining coverage are dependent on the employers. The higher the rate of employers' organizations the more probable it is that collective agreements are signed between the employers and employees concerned. More importantly, the employers’ attitudes towards bargaining are significant. In comparison with the metal-making sector, the employers in the chemical industry are more favourable to sectoral negotiations. The German chemical industry employers’ organization, for example, reached agreements with workers with relatively little conflict. Probably because they represent a wide range of interests, from large to smaller chemical firms, they take a realistic and pragmatic approach to dealing with their

WP-246-External-En.doc 105
counterparts (trade unions). The chemical industry had made use of the collective agreement as a positive way of maintaining industrial peace by including a peace agreement provision in the agreement, for example. As a result, the chemical industry experiences fewer industrial disputes. How do changes in work organization affect chemical workers’ pay structures? The introduction of teamworking with multiskilling, accompanied by changes in work organization, has triggered the introduction of a new pay system and wage structures in the chemical industry. In 1996, the German chemical industry concluded an accord making it easier for employers and employees to introduce teamworking at company level. The accord has further decentralized negotiations on new technologies and work organization. It was stated that the primary reason for allowing variations by company was that production techniques and systems differed from one company to another; it was thus impossible to have an agreement that would apply across the industry. Therefore, the accord provided a framework allowing each company, or division within a company, to develop its particular model. The companies’ efforts to increase flexibility resulted in greater profitability. Wage systems adopted in the chemical industry are designed to increase functional flexibility. Teamworking minimizes hierarchies and empowers the workforce in order to sustain a competitive edge in quality product markets. Therefore, individual performance is tightly connected with the group’s overall performance. The introduction of teamworking has resulted in the implementation of gainsharing – performance pay closely linked to the achievements of the group in teamworking. In gainsharing, employees’ wage formulation is based on company- or factory-wide schemes. Instead of being based on employee's qualifications alone, individual wages are decided by the achievements of the group to which the employee belongs. Chemical employees’ wages are relatively high because firms pay salaries that are competitive in the labour market in order to recruit and retain a highly qualified workforce. The pay system for salaried employees in the Finnish chemical industry shows how competitiveness is accommodated in the system. White-collar salaries are decided mainly by the individual's capacity to perform his/her duties. Even though the fixed element of determining the salary remains, the proportions have become nominal. An amount of only €33 per month is paid as a seniority-based bonus to those whose seniority ranges between five and nine years. Seniority bonus for white-collar employees with over 25 years of service is €97 per month, i.e. a difference of only €56. The salaries are determined by multiple elements such as duties, job grade and an individual element based on job performance and competence. There is no room for non-measurable elements other than individual performance. Their salary system is connected to clear and unambiguous factors firmly relating to purely personal performance.

WP-246-External-En.doc 106
Similarly, the pay system for production workers has changed drastically in the past decade. The ILO has conducted a comparative study on pay systems in several industries, including the chemical industry. Although the study examined relatively short-term pay system changes in a UK chemical company, it shows how internal equity and fairness can be enhanced while meeting employers’ demands for increased functional flexibility. In the old system, wages were based on a non-uniform evaluation system which lacked common grounds for evaluation. In the new wage structure, a single job evaluation scheme was created to secure equal pay for equal work. Evaluation processes ensure that job descriptions reflect the specification of workers’ competencies. The new system created explicit reference points which make clear the linkages between personal evaluations and fluid promotion. The change to a competency-based pay system increased the company’s labour costs by about 5 per cent, but this increase is nominal when viewed against the numerous benefits arising out of the new system. The new grading system not only improved internal equity but also made the salaries of entry-level laboratory technicians competitive in the labour market. In addition, the new wage system benefited those many clerical employees who were in the lowest grades in the old system, many of them female employees. Female laboratory technical and clerical employees in the middle-level grades also benefited. This is because the company intended to attain internal equity as a result of collective bargaining with the craft trade unions concerned. A number of recent cases demonstrate that more and more pay systems in the chemical industry are following the case of the above-mentioned UK chemical firm. The primary issue is how the limited resources for wages are distributed by employees in a company. These issues are the main concerns of employers and of workers and trade unions. The first recent trend is that the annualization of wages has become the norm. Workers’ basic pay is decided on a yearly basis; this used to be the norm for managers but it now also applies to employees. Additional parts of workers’ pay are decided by the gains or profits of the unit or department to which they belong. Performance-based pay or gainsharing is linked to measurable elements such as the employee's personal competencies and attitudes and actual performance achieved. Even though the worker’s qualifications remain important to some degree, bonuses are linked much more closely to the company’s financial results. Appraisal and evaluation have come to play a much more important role than in the past. Openness, transparency, and standardized systems have been introduced companywide to assess individual workers’ achievements on a clear scale of evaluation. What are fair wage levels? The answer is the decent wage. As in the manufacturing industry, equal pay between men and women still seems to be a long way off in the chemical industry. Similarly, chemical workers’ wages still differ by region even within a single country. Like other industries, in order to improve gender equality the chemical industry is promoting family-friendly policies such as running childcare centres or providing family crisis leave for employees in case of their children's illness. Such
WP-246-External-En.doc 107
policies help companies to retain talented employees. Collective bargaining plays a crucial role in this respect. Particularly for the chemical industry as a globalized business, a global horizontal partnership could make the difference where industrial relations are concerned. The ICEM has developed several multinational company networks to incite chemical workers working in the same multinational company to share information among themselves for the purpose of promoting freedom of association and assisting national trade union organizations to achieve better settlements at their national collective bargaining. In 1996, the ICEM launched the global corporate campaign in support of US workers “permanently replaced” by Bridgestone. A network was established, both electronic and in person, which continues to circulate information worldwide among Bridgestone workers and unions that negotiate with the company. Under the Continental corporate network, an extensive campaign was organized in the United States around a strike by 1,450 workers at the General Tire plant of the German-based tyre maker Continental in North Carolina. The workers started their strike in September 1998 over a pay dispute and were subsequently “permanently replaced” by management and thus effectively locked out and dismissed. A European solidarity tour was organized in 1999, taking Charlotte workers and representatives of their union to meet union representatives and workers in Belgium, the Czech Republic, France, Germany, Slovakia, Turkey and the United Kingdom. In the end, an agreement was reached at the Charlotte plant in September 1999. Most recently, DuPont. In March 2006, ICEM-affiliated trade unions from eight countries (Austria, Belgium, Brazil, Denmark, France, Germany, the Netherlands and the United States) launched a global DuPont trade union network aimed at establishing efficient cooperation and practical international solidarity between the different trade unions that represent DuPont’s workforce in their respective countries. Its main ambitions are the exchange of information and company strategies, useful for collective bargaining, as well as the planning of joint action where necessary. In conclusion, case studies demonstrate that the chemical industry is a showcase of best practices of industrial relations, although there are a few bad examples as well. Conditions and circumstances differ from one company to another and from one country to another. Although there is no best model of collective bargaining, sectoral and company negotiations have advantages and disadvantages. Decentralization of collective bargaining has recently become an overwhelming trend in the chemical industry. A shift from centralized or regional sectoral bargaining to the company or plant level has occurred because of the need to achieve increased flexibility at the company level to accommodate workers’ and employers’ needs. Sectoral bargaining and company-level bargaining remain equally important. Case studies show that the importance of sectoral negotiations remains unchanged: they still play the predominant role in deciding the industrial framework on pay levels and conditions of work, a role that company bargaining alone cannot play across the whole industry. By contrast, sectoral bargaining can not negotiate about the financial and business issues of a particular chemical company. Clearly, the two types of negotiations need to complement each other. Some

WP-246-External-En.doc 108
data indicate that the unionization rate in the chemical industry has been decreasing in recent years. To protect the interests and improve the conditions of work of those who are outside the unionized workforce, sectoral bargaining and sectoral collective agreements remain vital. Collective bargaining plays a central role in industrial relations. Promoting collective bargaining in the chemical industry is the first step towards realizing the Decent Work Agenda in the chemical industry.
WP-246-External-En.doc 109
11. Bibliography Ashish Arora, et al. (1998). Chemicals and Long-term Economic Growth – Insights from the Chemical Industry, Chemical Heritage Foundation. Richard N. Block (2003). Bargaining for Competitiveness – Law, Research, and Case Studies, UpJohn Institute, pp. 15-16. Jean-Yves Boulin (2000). “Trade unions in France: how to challenge the trend towards de-unionisation?”, in Trade Unions in Europe – facing challenges and searching for solutions, ETUI, pp. 215-248. Edwin L. Brown and Tracy F.H. Chang, “PACE International Union vs. Imerys Groupe: An Organizing Campaign Case Study”, Labor Studies Journal, Vol. 29, No. 1 (Spring 2004), pp. 21-41. Colette Fagan, (1998). “Payment Systems and Gender in the United Kingdom: Case Study of a Chemical Company,” in Equal Pay in Europe? - Closing the Gender Wage Gap, ILO, pp. 169-197. ILO Report for discussion at the Best Practices in Work-Flexibility Schemes and their Impact on the Quality of Working Live in the Chemical Industries, Geneva, 2003, TMWFCI/2003 and the Note on the Proceedings, TMWFCI/2003/11. Faustino Miquélez Lobo (2000). “The modernisation of trade unions in Spain”, in Jeremy Waddington and Reiner Hoffmann, Trade Unions in Europe – facing challenges and searching for solutions, ETUI, pp. 499-527. Nick Parsons (2005). French Industrial Relations in the New World Economy, Routledge, pp. 113-132. E.A. Ramaswamy and F.B. Schiphorst, “Human resource management, trade unions and empowerment: two cases from India”, International Journal of Human Resource Management, 11;4, August 2000, pp. 664-680. Steffen A. Rogalski (2006). “Vocational education and training in the chemical industry in Germany and the United Kingdom”, Working Paper No. 242, ILO. Peter H. Spitz, (2003). The Chemical Industry at the Millennium – Maturity, Restructuring, and Globalization, Chemical Heritage Foundation. Jelle Visser (2003). “Unions and unionism around the world”, in John T. Addison and Claus Schanabel, International Handbook of Trade Unions, 2003, pp. 366-413.

WP-246-External-En.doc 110
“Changes in national collective bargaining systems since 1990”, the European Industrial Relations Observatory Online (EIRO), 2005 (www.eiro.eurofound.ie). “Commission examines transnational bargaining”, European Works Councils Bulletin Issue 64, July/August 2006, pp. 12-20.
International Metalworkers’ Federation, Reports of Affiliates, 2005, p. 136. The Japan Labor Flash No. 68 (Email Journal), 1 September 2006. Collective Agreement for Salaried Employees in the Finnish Chemical Industry, 16 February 2005-30 September 2007, pp. 50-51. Libération, 10 May 2000. European Industrial Relations Review (EIRR): “Agreement in chemicals”, EIRR 389, June 2006, p. 9. “Chemicals sector agreement”, EIRR 377, June 2005, p. 4. “Further collective bargaining”, EIRR 376, May 2005, p. 11. “New agreement in chemicals”, EIRR 370, November 2004, pp. 22-24. “Collective bargaining in 2003”, EIRR 364, May 2004, pp. 25-29. “Policies on diversity and equal opportunities at Roche”, EIRR 355, August 2003, pp. 22-25. “Collective bargaining in 2002”, EIRR 352, May 2003, pp. 27-30. “Further decline of sectoral bargaining coverage”, EIRR 337, February 2002, pp. 20-23. “What future for centralized pay moderation?”, EIRR 322, November 2000, pp. 19-21. “Collective bargaining in 1999”, EIRR 316, May 2000, p. 28. “1998 collective bargaining round-up”, EIRR 310, November 1999, pp. 27-30. “BASF deal secures jobs and promotes training”, EIRR 303, April 1999, pp. 19-21. “Deals in chemicals and petrochemicals,” EIRR 302, March 1999, pp. 3-4. “Decline of sectoral bargaining coverage”, EIRR 302, March 1999, pp. 16-18.
WP-246-External-En.doc 111
“Bargaining analysis reveals rising pay trend”, EIRR 298, November 1998, p. 21. “Collective bargaining in 1997”, EIRR 295, August 1998, pp. 17-21. “14-month deal in chemicals”, EIRR 293, June 1998, pp. 17-18. “Akzo Nobel introduces flexible working”, EIRR 285, October 1997, pp. 22-23. “Flexibility, change and the future of sectoral bargaining”, EIRR 285, October 1997, pp. 24-27. “Collective bargaining in 1996”, EIRR 282, July 1997, pp. 27-30. Gainsharing at BP Exploration,” EIRR 269, June 1996, pp. 24-28. “Bargaining round-up”, EIRR 249, October 1994, p. 6.
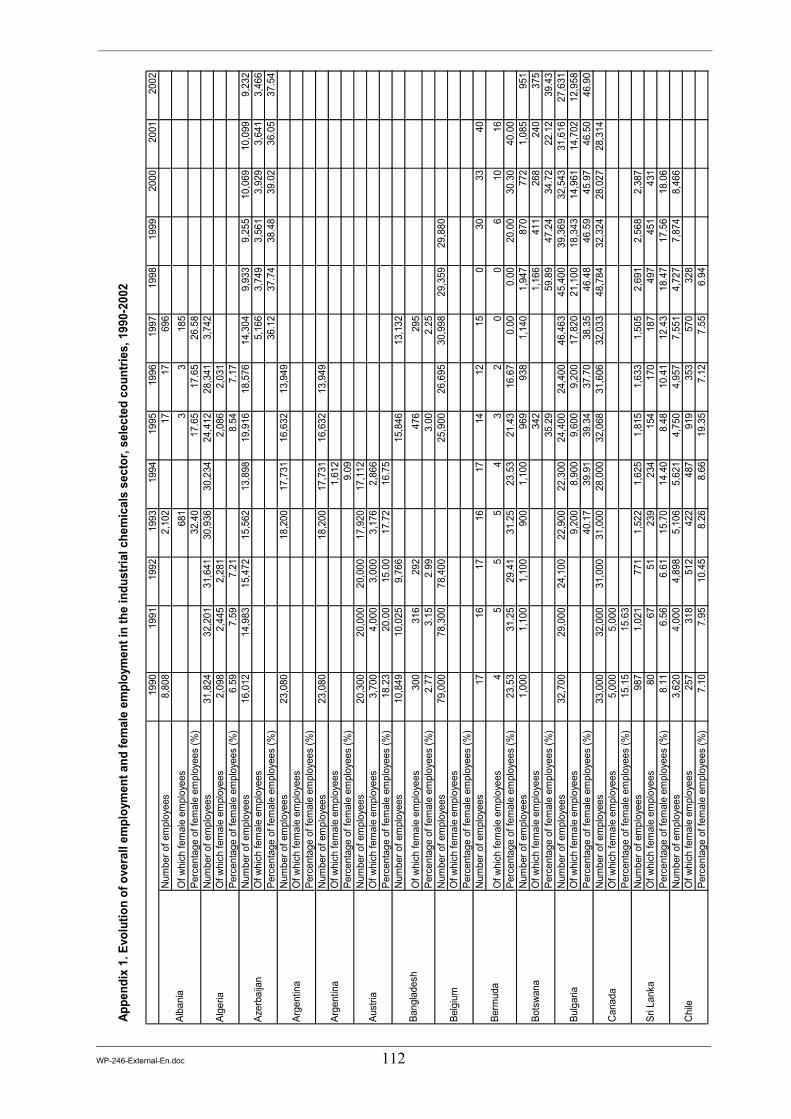
WP-246-External-En.doc 112
19
9019
9119
9219
9319
9419
9519
9619
9719
9819
9920
0020
0120
02N
umbe
r of e
mpl
oyee
s8,
808
2,10
217
1769
6O
f whi
ch fe
mal
e em
ploy
ees
681
33
185
Perc
enta
ge o
f fem
ale
empl
oyee
s (%
)32
.40
17.6
517
.65
26.5
8N
umbe
r of e
mpl
oyee
s31
,824
32,2
0131
,641
30,9
3630
,234
24,4
1228
,341
3,74
2O
f whi
ch fe
mal
e em
ploy
ees
2,09
82,
445
2,28
12,
086
2,03
1Pe
rcen
tage
of f
emal
e em
ploy
ees
(%)
6.59
7.59
7.21
8.54
7.17
Num
ber o
f em
ploy
ees
16,0
1214
,983
15,4
7215
,562
13,8
9819
,916
18,5
7614
,304
9,93
39,
255
10,0
6910
,099
9,23
2O
f whi
ch fe
mal
e em
ploy
ees
5,16
63,
749
3,56
13,
929
3,64
13,
466
Perc
enta
ge o
f fem
ale
empl
oyee
s (%
)36
.12
37.7
438
.48
39.0
236
.05
37.5
4N
umbe
r of e
mpl
oyee
s23
,080
18,2
0017
,731
16,6
3213
,949
Of w
hich
fem
ale
empl
oyee
sPe
rcen
tage
of f
emal
e em
ploy
ees
(%)
Num
ber o
f em
ploy
ees
23,0
8018
,200
17,7
3116
,632
13,9
49O
f whi
ch fe
mal
e em
ploy
ees
1,61
2Pe
rcen
tage
of f
emal
e em
ploy
ees
(%)
9.09
Num
ber o
f em
ploy
ees
20,3
0020
,000
20,0
0017
,920
17,1
12O
f whi
ch fe
mal
e em
ploy
ees
3,70
04,
000
3,00
03,
176
2,86
6Pe
rcen
tage
of f
emal
e em
ploy
ees
(%)
18.2
320
.00
15.0
017
.72
16.7
5N
umbe
r of e
mpl
oyee
s10
,849
10,0
259,
766
15,8
4613
,132
Of w
hich
fem
ale
empl
oyee
s30
031
629
247
629
5Pe
rcen
tage
of f
emal
e em
ploy
ees
(%)
2.77
3.15
2.99
3.00
2.25
Num
ber o
f em
ploy
ees
79,0
0078
,300
78,4
0025
,900
26,6
9530
,998
29,3
5929
,880
Of w
hich
fem
ale
empl
oyee
sPe
rcen
tage
of f
emal
e em
ploy
ees
(%)
Num
ber o
f em
ploy
ees
1716
1716
1714
1215
030
3340
Of w
hich
fem
ale
empl
oyee
s4
55
54
32
00
610
16Pe
rcen
tage
of f
emal
e em
ploy
ees
(%)
23.5
331
.25
29.4
131
.25
23.5
321
.43
16.6
70.
000.
0020
.00
30.3
040
.00
Num
ber o
f em
ploy
ees
1,00
01,
100
1,10
090
01,
100
969
938
1,14
01,
947
870
772
1,08
595
1O
f whi
ch fe
mal
e em
ploy
ees
342
1,16
641
126
824
037
5Pe
rcen
tage
of f
emal
e em
ploy
ees
(%)
35.2
959
.89
47.2
434
.72
22.1
239
.43
Num
ber o
f em
ploy
ees
32,7
0029
,000
24,1
0022
,900
22,3
0024
,400
24,4
0046
,463
45,4
0039
,369
32,5
4331
,616
27,6
31O
f whi
ch fe
mal
e em
ploy
ees
9,20
08,
900
9,60
09,
200
17,8
2021
,100
18,3
4314
,961
14,7
0212
,958
Perc
enta
ge o
f fem
ale
empl
oyee
s (%
)40
.17
39.9
139
.34
37.7
038
.35
46.4
846
.59
45.9
746
.50
46.9
0N
umbe
r of e
mpl
oyee
s33
,000
32,0
0031
,000
31,0
0028
,000
32,0
6831
,606
32,0
3348
,784
32,3
2428
,027
28,3
14O
f whi
ch fe
mal
e em
ploy
ees
5,00
05,
000
Perc
enta
ge o
f fem
ale
empl
oyee
s (%
)15
.15
15.6
3N
umbe
r of e
mpl
oyee
s98
71,
021
771
1,52
21,
625
1,81
51,
633
1,50
52,
691
2,56
82,
387
Of w
hich
fem
ale
empl
oyee
s80
6751
239
234
154
170
187
497
451
431
Perc
enta
ge o
f fem
ale
empl
oyee
s (%
)8.
116.
566.
6115
.70
14.4
08.
4810
.41
12.4
318
.47
17.5
618
.06
Num
ber o
f em
ploy
ees
3,62
04,
000
4,89
85,
106
5,62
14,
750
4,95
77,
551
4,72
77,
874
8,46
6O
f whi
ch fe
mal
e em
ploy
ees
257
318
512
422
487
919
353
570
328
Perc
enta
ge o
f fem
ale
empl
oyee
s (%
)7.
107.
9510
.45
8.26
8.66
19.3
57.
127.
556.
94
Azer
baija
n
Arge
ntin
a
Alba
nia
Alge
ria
Arge
ntin
a
Aust
ria
Bang
lade
sh
Berm
uda
Belg
ium
Bots
wan
a
Bulg
aria
Can
ada
Sri L
anka
Chi
le
Appe
ndix
1. E
volu
tion
of o
vera
ll em
ploy
men
t and
fem
ale
empl
oym
ent i
n th
e in
dust
rial c
hem
ical
s se
ctor
, sel
ecte
d co
untri
es, 1
990-
2002
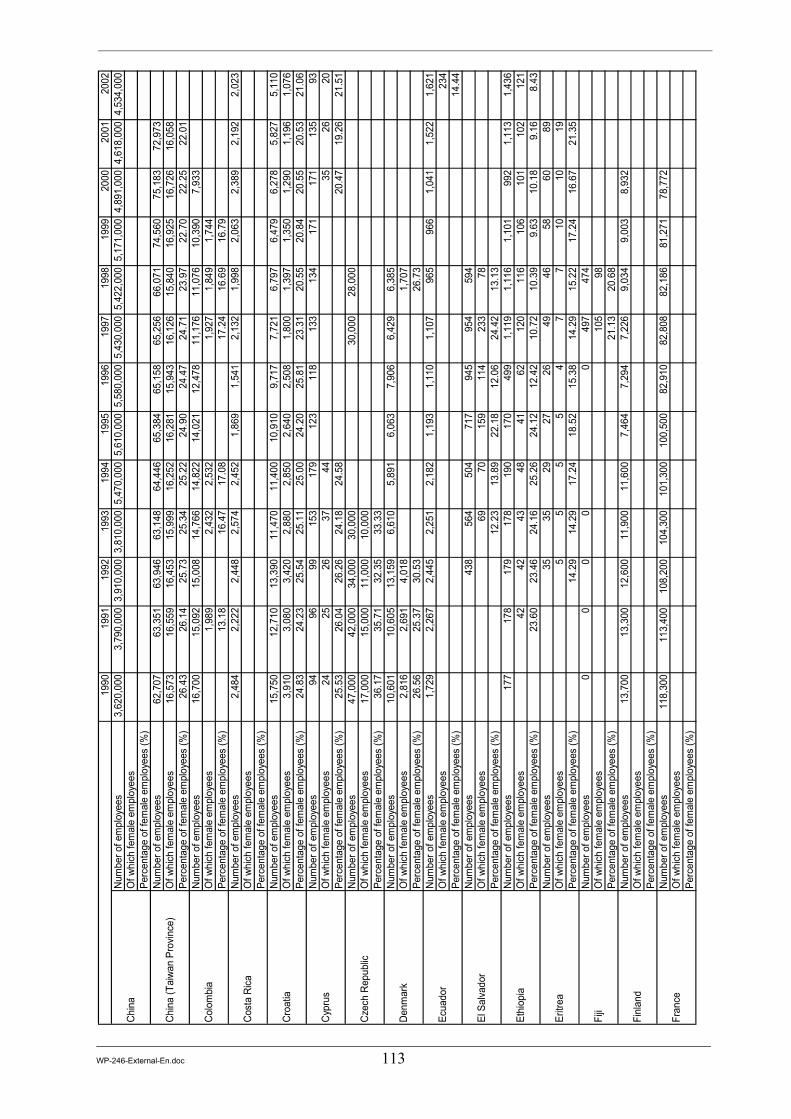
WP-246-External-En.doc 113
1990
1991
1992
1993
1994
1995
1996
1997
1998
1999
2000
2001
2002
Num
ber o
f em
ploy
ees
3,62
0,00
03,
790,
000
3,91
0,00
03,
810,
000
5,47
0,00
05,
610,
000
5,58
0,00
05,
430,
000
5,42
2,00
05,
171,
000
4,89
1,00
04,
618,
000
4,53
4,00
0O
f whi
ch fe
mal
e em
ploy
ees
Perc
enta
ge o
f fem
ale
empl
oyee
s (%
)Nu
mbe
r of e
mpl
oyee
s62
,707
63,3
5163
,946
63,1
4864
,446
65,3
8465
,158
65,2
5666
,071
74,5
6075
,183
72,9
73O
f whi
ch fe
mal
e em
ploy
ees
16,5
7316
,559
16,4
5315
,999
16,2
5216
,281
15,9
4316
,126
15,8
4016
,925
16,7
2616
,058
Perc
enta
ge o
f fem
ale
empl
oyee
s (%
)26
.43
26.1
425
.73
25.3
425
.22
24.9
024
.47
24.7
123
.97
22.7
022
.25
22.0
1Nu
mbe
r of e
mpl
oyee
s16
,700
15,0
9215
,008
14,7
6614
,822
14,0
2112
,478
11,1
7611
,076
10,3
907,
933
Of w
hich
fem
ale
empl
oyee
s1,
989
2,43
22,
532
1,92
71,
849
1,74
4Pe
rcen
tage
of f
emal
e em
ploy
ees
(%)
13.1
816
.47
17.0
817
.24
16.6
916
.79
Num
ber o
f em
ploy
ees
2,48
42,
222
2,44
82,
574
2,45
21,
869
1,54
12,
132
1,99
82,
063
2,38
92,
192
2,02
3O
f whi
ch fe
mal
e em
ploy
ees
Perc
enta
ge o
f fem
ale
empl
oyee
s (%
)Nu
mbe
r of e
mpl
oyee
s15
,750
12,7
1013
,390
11,4
7011
,400
10,9
109,
717
7,72
16,
797
6,47
96,
278
5,82
75,
110
Of w
hich
fem
ale
empl
oyee
s3,
910
3,08
03,
420
2,88
02,
850
2,64
02,
508
1,80
01,
397
1,35
01,
290
1,19
61,
076
Perc
enta
ge o
f fem
ale
empl
oyee
s (%
)24
.83
24.2
325
.54
25.1
125
.00
24.2
025
.81
23.3
120
.55
20.8
420
.55
20.5
321
.06
Num
ber o
f em
ploy
ees
9496
9915
317
912
311
813
313
417
117
113
593
Of w
hich
fem
ale
empl
oyee
s24
2526
3744
3526
20Pe
rcen
tage
of f
emal
e em
ploy
ees
(%)
25.5
326
.04
26.2
624
.18
24.5
820
.47
19.2
621
.51
Num
ber o
f em
ploy
ees
47,0
0042
,000
34,0
0030
,000
30,0
0028
,000
Of w
hich
fem
ale
empl
oyee
s17
,000
15,0
0011
,000
10,0
00Pe
rcen
tage
of f
emal
e em
ploy
ees
(%)
36.1
735
.71
32.3
533
.33
Num
ber o
f em
ploy
ees
10,6
0110
,605
13,1
596,
610
5,89
16,
063
7,90
66,
429
6,38
5O
f whi
ch fe
mal
e em
ploy
ees
2,81
62,
691
4,01
81,
707
Perc
enta
ge o
f fem
ale
empl
oyee
s (%
)26
.56
25.3
730
.53
26.7
3Nu
mbe
r of e
mpl
oyee
s1,
729
2,26
72,
445
2,25
12,
182
1,19
31,
110
1,10
796
596
61,
041
1,52
21,
621
Of w
hich
fem
ale
empl
oyee
s23
4Pe
rcen
tage
of f
emal
e em
ploy
ees
(%)
14.4
4Nu
mbe
r of e
mpl
oyee
s43
856
450
471
794
595
459
4O
f whi
ch fe
mal
e em
ploy
ees
6970
159
114
233
78Pe
rcen
tage
of f
emal
e em
ploy
ees
(%)
12.2
313
.89
22.1
812
.06
24.4
213
.13
Num
ber o
f em
ploy
ees
177
178
179
178
190
170
499
1,11
91,
116
1,10
199
21,
113
1,43
6O
f whi
ch fe
mal
e em
ploy
ees
4242
4348
4162
120
116
106
101
102
121
Perc
enta
ge o
f fem
ale
empl
oyee
s (%
)23
.60
23.4
624
.16
25.2
624
.12
12.4
210
.72
10.3
99.
6310
.18
9.16
8.43
Num
ber o
f em
ploy
ees
3535
2927
2649
4658
6089
Of w
hich
fem
ale
empl
oyee
s5
55
54
77
1010
19Pe
rcen
tage
of f
emal
e em
ploy
ees
(%)
14.2
914
.29
17.2
418
.52
15.3
814
.29
15.2
217
.24
16.6
721
.35
Num
ber o
f em
ploy
ees
00
00
049
747
4O
f whi
ch fe
mal
e em
ploy
ees
105
98Pe
rcen
tage
of f
emal
e em
ploy
ees
(%)
21.1
320
.68
Num
ber o
f em
ploy
ees
13,7
0013
,300
12,6
0011
,900
11,6
007,
464
7,29
47,
226
9,03
49,
003
8,93
2O
f whi
ch fe
mal
e em
ploy
ees
Perc
enta
ge o
f fem
ale
empl
oyee
s (%
)Nu
mbe
r of e
mpl
oyee
s11
8,30
011
3,40
010
8,20
010
4,30
010
1,30
010
0,50
082
,910
82,8
0882
,186
81,2
7178
,772
Of w
hich
fem
ale
empl
oyee
sPe
rcen
tage
of f
emal
e em
ploy
ees
(%)
Eritr
ea
Fiji
Finl
and
Fran
ce
Denm
ark
Ecua
dor
El S
alva
dor
Ethi
opia
Cost
a Ri
ca
Croa
tia
Cypr
us
Czec
h Re
publ
ic
Chin
a
Chin
a (T
aiwa
n Pr
ovin
ce)
Colo
mbi
a

WP-246-External-En.doc 114
19
9019
9119
9219
9319
9419
9519
9619
9719
9819
9920
0020
0120
02N
umbe
r of e
mpl
oyee
s20
418
721
515
524
1O
f whi
ch fe
mal
e em
ploy
ees
Perc
enta
ge o
f fem
ale
empl
oyee
s (%
)N
umbe
r of e
mpl
oyee
s34
5,82
331
3,74
828
7,43
627
7,07
826
7,89
525
2,30
623
9,40
223
4,43
423
2,95
4O
f whi
ch fe
mal
e em
ploy
ees
Perc
enta
ge o
f fem
ale
empl
oyee
s (%
)N
umbe
r of e
mpl
oyee
s51
252
654
1O
f whi
ch fe
mal
e em
ploy
ees
35Pe
rcen
tage
of f
emal
e em
ploy
ees
(%)
6.84
Num
ber o
f em
ploy
ees
6,39
95,
881
4,94
120
,598
20,1
4619
,226
18,8
5418
,146
17,8
15O
f whi
ch fe
mal
e em
ploy
ees
Perc
enta
ge o
f fem
ale
empl
oyee
s (%
)N
umbe
r of e
mpl
oyee
s75
466
875
285
093
285
698
0O
f whi
ch fe
mal
e em
ploy
ees
Perc
enta
ge o
f fem
ale
empl
oyee
s (%
)N
umbe
r of e
mpl
oyee
s45
242
343
147
251
752
8O
f whi
ch fe
mal
e em
ploy
ees
Perc
enta
ge o
f fem
ale
empl
oyee
s (%
)N
umbe
r of e
mpl
oyee
s2,
500
2,00
02,
000
2,10
01,
900
1,60
01,
500
1,40
01,
700
1,60
01,
700
1,60
01,
200
Of w
hich
fem
ale
empl
oyee
sPe
rcen
tage
of f
emal
e em
ploy
ees
(%)
Num
ber o
f em
ploy
ees
37,0
0033
,000
29,0
0023
,000
21,3
0144
,647
42,2
2440
,854
16,6
4816
,208
14,6
19O
f whi
ch fe
mal
e em
ploy
ees
14,0
009,
000
9,00
07,
448
6,98
17,
279
Perc
enta
ge o
f fem
ale
empl
oyee
s (%
)37
.84
31.0
339
.13
34.9
715
.64
17.2
4N
umbe
r of e
mpl
oyee
s25
924
824
623
421
719
718
5O
f whi
ch fe
mal
e em
ploy
ees
Perc
enta
ge o
f fem
ale
empl
oyee
s (%
)N
umbe
r of e
mpl
oyee
s22
4,08
421
9,30
825
1,03
223
9,59
826
6,94
830
4,34
729
3,00
934
5,52
327
9,81
030
8,75
931
2,77
829
1,15
5O
f whi
ch fe
mal
e em
ploy
ees
1,85
72,
103
1,87
12,
354
3,46
71,
717
2,57
32,
623
2,47
2Pe
rcen
tage
of f
emal
e em
ploy
ees
(%)
0.78
0.79
0.61
0.80
1.00
0.61
0.83
0.84
0.85
Num
ber o
f em
ploy
ees
50,2
6950
,445
53,9
9860
,112
62,9
5670
,376
70,0
15...
125,
287
81,6
3880
,759
108,
265
67,5
60O
f whi
ch fe
mal
e em
ploy
ees
11,9
4012
,579
13,3
0812
,684
...29
,428
14,1
1812
,758
26,7
9414
,655
Perc
enta
ge o
f fem
ale
empl
oyee
s (%
)19
.86
19.9
818
.91
18.1
223
.49
17.2
915
.80
24.7
521
.69
Num
ber o
f em
ploy
ees
15,2
0010
,731
11,8
8711
,301
21,9
8522
,310
24,6
7325
,402
26,8
2627
,341
26,6
5527
,798
Of w
hich
fem
ale
empl
oyee
s26
632
236
660
465
077
590
890
489
590
41,
299
Perc
enta
ge o
f fem
ale
empl
oyee
s (%
)2.
482.
713.
242.
752.
913.
143.
573.
373.
273.
394.
67N
umbe
r of e
mpl
oyee
s4,
000
4,20
04,
353
4,45
94,
608
4,99
45,
259
5,88
26,
302
6,76
68,
363
Of w
hich
fem
ale
empl
oyee
s1,
200
1,30
0Pe
rcen
tage
of f
emal
e em
ploy
ees
(%)
30.0
030
.95
Num
ber o
f em
ploy
ees
7,90
07,
800
7,80
08,
100
8,20
022
,800
23,5
0023
,600
23,7
0023
,500
23,3
0023
,100
Of w
hich
fem
ale
empl
oyee
s7,
800
Perc
enta
ge o
f fem
ale
empl
oyee
s (%
)33
.05
Num
ber o
f em
ploy
ees
86,6
2185
,091
79,6
9577
,463
71,2
7166
,861
68,1
9868
,137
67,1
0763
,626
62,6
58O
f whi
ch fe
mal
e em
ploy
ees
9,18
08,
121
7,03
46,
913
8,52
29,
209
9,69
79,
399
9,16
4Pe
rcen
tage
of f
emal
e em
ploy
ees
(%)
10.7
910
.19
9.08
9.70
12.7
513
.50
14.2
314
.01
14.4
0N
umbe
r of e
mpl
oyee
s2,
390
2,14
82,
918
2,83
9O
f whi
ch fe
mal
e em
ploy
ees
133
179
193
244
275
Perc
enta
ge o
f fem
ale
empl
oyee
s (%
)7.
498.
998.
369.
69
Irela
nd
Isra
el
Italy
Cot
e d'
Ivoi
re
Icel
and
Indi
a
Indo
nesi
a
Iran,
(Isl
amic
Rep
ublic
of)
Gua
tem
ala
Hon
dura
s
Chi
na (H
ong
Kon
g S
AR)
Hun
gary
Gab
on
Ger
man
y
Gha
na
Gre
ece
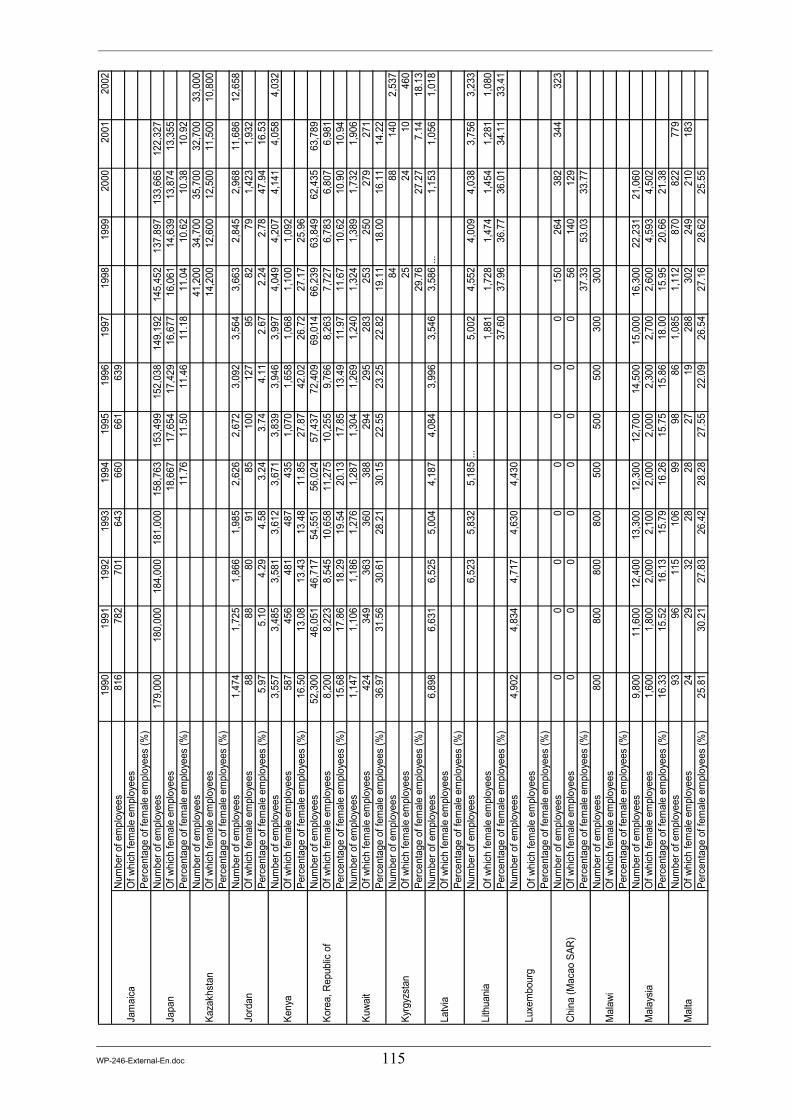
WP-246-External-En.doc 115
1990
1991
1992
1993
1994
1995
1996
1997
1998
1999
2000
2001
2002
Num
ber o
f em
ploy
ees
816
782
701
643
660
661
639
Of w
hich
fem
ale
empl
oyee
sPe
rcen
tage
of f
emal
e em
ploy
ees
(%)
Num
ber o
f em
ploy
ees
179,
000
180,
000
184,
000
181,
000
158,
763
153,
499
152,
038
149,
192
145,
452
137,
897
133,
665
122,
327
Of w
hich
fem
ale
empl
oyee
s18
,667
17,6
5417
,429
16,6
7716
,061
14,6
3913
,874
13,3
55Pe
rcen
tage
of f
emal
e em
ploy
ees
(%)
11.7
611
.50
11.4
611
.18
11.0
410
.62
10.3
810
.92
Num
ber o
f em
ploy
ees
41,2
0034
,700
35,7
0032
,700
33,0
00O
f whi
ch fe
mal
e em
ploy
ees
14,2
0012
,600
12,5
0011
,500
10,8
00Pe
rcen
tage
of f
emal
e em
ploy
ees
(%)
Num
ber o
f em
ploy
ees
1,47
41,
725
1,86
61,
985
2,62
62,
672
3,09
23,
564
3,66
32,
845
2,96
811
,686
12,6
58O
f whi
ch fe
mal
e em
ploy
ees
8888
8091
8510
012
795
8279
1,42
31,
932
Perc
enta
ge o
f fem
ale
empl
oyee
s (%
)5.
975.
104.
294.
583.
243.
744.
112.
672.
242.
7847
.94
16.5
3Nu
mbe
r of e
mpl
oyee
s3,
557
3,48
53,
581
3,61
23,
671
3,83
93,
946
3,99
74,
049
4,20
74,
141
4,05
84,
032
Of w
hich
fem
ale
empl
oyee
s58
745
648
148
743
51,
070
1,65
81,
068
1,10
01,
092
Perc
enta
ge o
f fem
ale
empl
oyee
s (%
)16
.50
13.0
813
.43
13.4
811
.85
27.8
742
.02
26.7
227
.17
25.9
6Nu
mbe
r of e
mpl
oyee
s52
,300
46,0
5146
,717
54,5
5156
,024
57,4
3772
,409
69,0
1466
,239
63,8
4962
,435
63,7
89O
f whi
ch fe
mal
e em
ploy
ees
8,20
08,
223
8,54
510
,658
11,2
7510
,255
9,76
68,
263
7,72
76,
783
6,80
76,
981
Perc
enta
ge o
f fem
ale
empl
oyee
s (%
)15
.68
17.8
618
.29
19.5
420
.13
17.8
513
.49
11.9
711
.67
10.6
210
.90
10.9
4Nu
mbe
r of e
mpl
oyee
s1,
147
1,10
61,
186
1,27
61,
287
1,30
41,
269
1,24
01,
324
1,38
91,
732
1,90
6O
f whi
ch fe
mal
e em
ploy
ees
424
349
363
360
388
294
295
283
253
250
279
271
Perc
enta
ge o
f fem
ale
empl
oyee
s (%
)36
.97
31.5
630
.61
28.2
130
.15
22.5
523
.25
22.8
219
.11
18.0
016
.11
14.2
2Nu
mbe
r of e
mpl
oyee
s84
8814
02,
537
Of w
hich
fem
ale
empl
oyee
s25
2410
460
Perc
enta
ge o
f fem
ale
empl
oyee
s (%
)29
.76
27.2
77.
1418
.13
Num
ber o
f em
ploy
ees
6,89
86,
631
6,52
55,
004
4,18
74,
084
3,99
63,
546
3,58
6...
1,15
31,
056
1,01
8O
f whi
ch fe
mal
e em
ploy
ees
Perc
enta
ge o
f fem
ale
empl
oyee
s (%
)Nu
mbe
r of e
mpl
oyee
s6,
523
5,83
25,
185
...5,
002
4,55
24,
009
4,03
83,
756
3,23
3O
f whi
ch fe
mal
e em
ploy
ees
1,88
11,
728
1,47
41,
454
1,28
11,
080
Perc
enta
ge o
f fem
ale
empl
oyee
s (%
)37
.60
37.9
636
.77
36.0
134
.11
33.4
1Nu
mbe
r of e
mpl
oyee
s4,
902
4,83
44,
717
4,63
04,
430
Of w
hich
fem
ale
empl
oyee
sPe
rcen
tage
of f
emal
e em
ploy
ees
(%)
Num
ber o
f em
ploy
ees
00
00
00
00
150
264
382
344
323
Of w
hich
fem
ale
empl
oyee
s0
00
00
00
056
140
129
Perc
enta
ge o
f fem
ale
empl
oyee
s (%
)37
.33
53.0
333
.77
Num
ber o
f em
ploy
ees
800
800
800
800
500
500
500
300
300
Of w
hich
fem
ale
empl
oyee
sPe
rcen
tage
of f
emal
e em
ploy
ees
(%)
Num
ber o
f em
ploy
ees
9,80
011
,600
12,4
0013
,300
12,3
0012
,700
14,5
0015
,000
16,3
0022
,231
21,0
60O
f whi
ch fe
mal
e em
ploy
ees
1,60
01,
800
2,00
02,
100
2,00
02,
000
2,30
02,
700
2,60
04,
593
4,50
2Pe
rcen
tage
of f
emal
e em
ploy
ees
(%)
16.3
315
.52
16.1
315
.79
16.2
615
.75
15.8
618
.00
15.9
520
.66
21.3
8Nu
mbe
r of e
mpl
oyee
s93
9611
510
699
9886
1,08
51,
112
870
822
779
Of w
hich
fem
ale
empl
oyee
s24
2932
2828
2719
288
302
249
210
183
Perc
enta
ge o
f fem
ale
empl
oyee
s (%
)25
.81
30.2
127
.83
26.4
228
.28
27.5
522
.09
26.5
427
.16
28.6
225
.55
Mal
awi
Mal
aysia
Mal
ta
Latv
ia
Lith
uani
a
Luxe
mbo
urg
Chin
a (M
acao
SAR
)
Keny
a
Kore
a, R
epub
lic o
f
Kuwa
it
Kyrg
yzst
an
Jam
aica
Japa
n
Kaza
khst
an
Jord
an
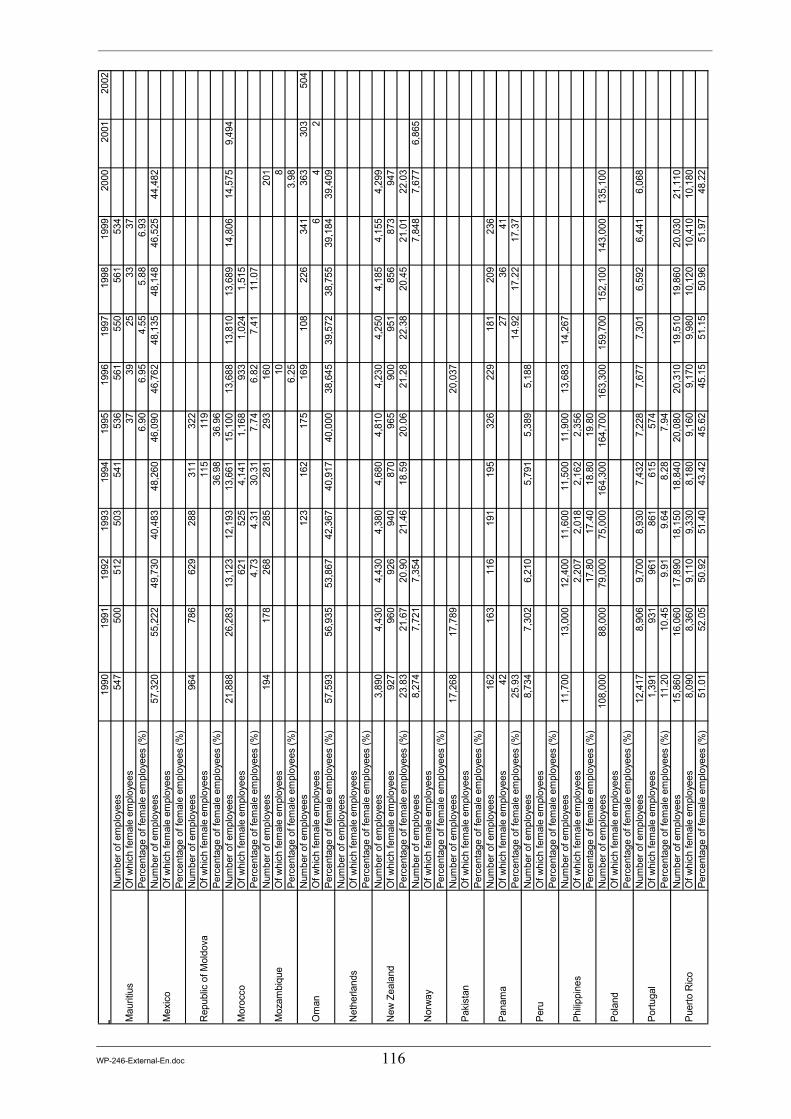
WP-246-External-En.doc 116
-
1990
1991
1992
1993
1994
1995
1996
1997
1998
1999
2000
2001
2002
Num
ber o
f em
ploy
ees
547
500
512
503
541
536
561
550
561
534
Of w
hich
fem
ale
empl
oyee
s37
3925
3337
Perc
enta
ge o
f fem
ale
empl
oyee
s (%
)6.
906.
954.
555.
886.
93N
umbe
r of e
mpl
oyee
s57
,320
55,2
2249
,730
40,4
8348
,260
46,0
9046
,762
48,1
3548
,148
46,5
2544
,482
Of w
hich
fem
ale
empl
oyee
sPe
rcen
tage
of f
emal
e em
ploy
ees
(%)
Num
ber o
f em
ploy
ees
964
786
629
288
311
322
Of w
hich
fem
ale
empl
oyee
s11
511
9Pe
rcen
tage
of f
emal
e em
ploy
ees
(%)
36.9
836
.96
Num
ber o
f em
ploy
ees
21,8
8826
,283
13,1
2312
,193
13,6
6115
,100
13,6
8813
,810
13,6
8914
,806
14,5
759,
494
Of w
hich
fem
ale
empl
oyee
s62
152
54,
141
1,16
893
31,
024
1,51
5Pe
rcen
tage
of f
emal
e em
ploy
ees
(%)
4.73
4.31
30.3
17.
746.
827.
4111
.07
Num
ber o
f em
ploy
ees
194
178
268
285
281
293
160
201
Of w
hich
fem
ale
empl
oyee
s10
8Pe
rcen
tage
of f
emal
e em
ploy
ees
(%)
6.25
3.98
Num
ber o
f em
ploy
ees
123
162
175
169
108
226
341
363
303
504
Of w
hich
fem
ale
empl
oyee
s6
42
Perc
enta
ge o
f fem
ale
empl
oyee
s (%
)57
,593
56,9
3553
,867
42,3
6740
,917
40,0
0038
,645
39,5
7238
,755
39,1
8439
,409
Num
ber o
f em
ploy
ees
Of w
hich
fem
ale
empl
oyee
sPe
rcen
tage
of f
emal
e em
ploy
ees
(%)
Num
ber o
f em
ploy
ees
3,89
04,
430
4,43
04,
380
4,68
04,
810
4,23
04,
250
4,18
54,
155
4,29
9O
f whi
ch fe
mal
e em
ploy
ees
927
960
926
940
870
965
900
951
856
873
947
Perc
enta
ge o
f fem
ale
empl
oyee
s (%
)23
.83
21.6
720
.90
21.4
618
.59
20.0
621
.28
22.3
820
.45
21.0
122
.03
Num
ber o
f em
ploy
ees
8,27
47,
721
7,35
47,
848
7,67
76,
865
Of w
hich
fem
ale
empl
oyee
sPe
rcen
tage
of f
emal
e em
ploy
ees
(%)
Num
ber o
f em
ploy
ees
17,2
6817
,789
20,0
37O
f whi
ch fe
mal
e em
ploy
ees
Perc
enta
ge o
f fem
ale
empl
oyee
s (%
)N
umbe
r of e
mpl
oyee
s16
216
311
619
119
532
622
918
120
923
6O
f whi
ch fe
mal
e em
ploy
ees
4227
3641
Perc
enta
ge o
f fem
ale
empl
oyee
s (%
)25
.93
14.9
217
.22
17.3
7N
umbe
r of e
mpl
oyee
s8,
734
7,30
26,
210
5,79
15,
389
5,18
8O
f whi
ch fe
mal
e em
ploy
ees
Perc
enta
ge o
f fem
ale
empl
oyee
s (%
)N
umbe
r of e
mpl
oyee
s11
,700
13,0
0012
,400
11,6
0011
,500
11,9
0013
,683
14,2
67O
f whi
ch fe
mal
e em
ploy
ees
2,20
72,
018
2,16
22,
356
Perc
enta
ge o
f fem
ale
empl
oyee
s (%
)17
.80
17.4
018
.80
19.8
0N
umbe
r of e
mpl
oyee
s10
8,00
088
,000
79,0
0075
,000
164,
300
164,
700
163,
300
159,
700
152,
100
143,
000
135,
100
Of w
hich
fem
ale
empl
oyee
sPe
rcen
tage
of f
emal
e em
ploy
ees
(%)
Num
ber o
f em
ploy
ees
12,4
178,
906
9,70
08,
930
7,43
27,
228
7,67
77,
301
6,59
26,
441
6,06
8O
f whi
ch fe
mal
e em
ploy
ees
1,39
193
196
186
161
557
4Pe
rcen
tage
of f
emal
e em
ploy
ees
(%)
11.2
010
.45
9.91
9.64
8.28
7.94
Num
ber o
f em
ploy
ees
15,8
6016
,060
17,8
9018
,150
18,8
4020
,080
20,3
1019
,510
19,8
6020
,030
21,1
10O
f whi
ch fe
mal
e em
ploy
ees
8,09
08,
360
9,11
09,
330
8,18
09,
160
9,17
09,
980
10,1
2010
,410
10,1
80Pe
rcen
tage
of f
emal
e em
ploy
ees
(%)
51.0
152
.05
50.9
251
.40
43.4
245
.62
45.1
551
.15
50.9
651
.97
48.2
2
Pola
nd
Portu
gal
Puer
to R
ico
Paki
stan
Pana
ma
Peru
Philip
pine
s
Om
an
Net
herla
nds
New
Zea
land
Nor
way
Mex
ico
Rep
ublic
of M
oldo
va
Mor
occo
Moz
ambi
que
Mau
ritiu
s
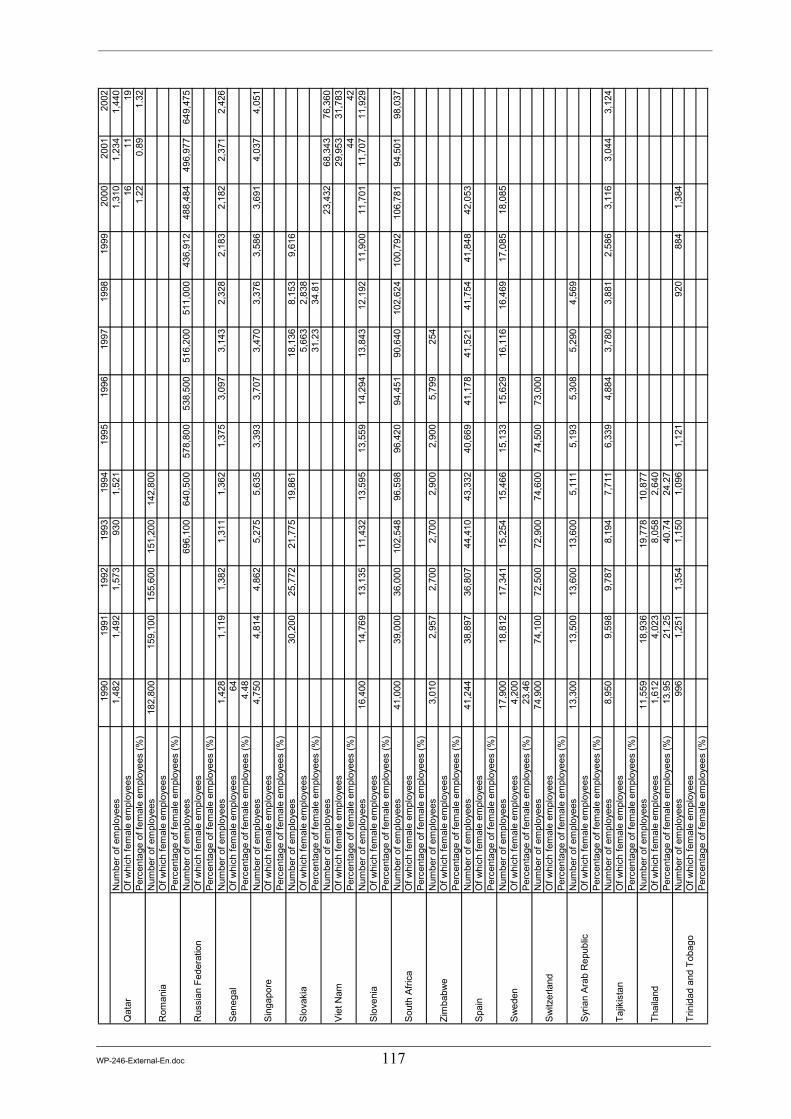
WP-246-External-En.doc 117
19
9019
9119
9219
9319
9419
9519
9619
9719
9819
9920
0020
0120
02N
umbe
r of e
mpl
oyee
s1,
482
1,49
21,
573
930
1,52
11,
310
1,23
41,
440
Of w
hich
fem
ale
empl
oyee
s16
1119
Perc
enta
ge o
f fem
ale
empl
oyee
s (%
)1.
220.
891.
32N
umbe
r of e
mpl
oyee
s18
2,80
015
9,10
015
5,60
015
1,20
014
2,80
0O
f whi
ch fe
mal
e em
ploy
ees
Perc
enta
ge o
f fem
ale
empl
oyee
s (%
)N
umbe
r of e
mpl
oyee
s69
6,10
064
0,50
057
8,80
053
8,50
051
6,20
051
1,00
043
6,91
248
8,48
449
6,97
764
9,47
5O
f whi
ch fe
mal
e em
ploy
ees
Perc
enta
ge o
f fem
ale
empl
oyee
s (%
)N
umbe
r of e
mpl
oyee
s1,
428
1,11
91,
382
1,31
11,
362
1,37
53,
097
3,14
32,
328
2,18
32,
182
2,37
12,
426
Of w
hich
fem
ale
empl
oyee
s64
Perc
enta
ge o
f fem
ale
empl
oyee
s (%
)4.
48N
umbe
r of e
mpl
oyee
s4,
750
4,81
44,
862
5,27
55,
635
3,39
33,
707
3,47
03,
376
3,58
63,
691
4,03
74,
051
Of w
hich
fem
ale
empl
oyee
sPe
rcen
tage
of f
emal
e em
ploy
ees
(%)
Num
ber o
f em
ploy
ees
30,2
0025
,772
21,7
7519
,861
18,1
368,
153
9,61
6O
f whi
ch fe
mal
e em
ploy
ees
5,66
32,
838
Perc
enta
ge o
f fem
ale
empl
oyee
s (%
)31
.23
34.8
1N
umbe
r of e
mpl
oyee
s23
,432
68,3
4376
,360
Of w
hich
fem
ale
empl
oyee
s29
,953
31,7
83Pe
rcen
tage
of f
emal
e em
ploy
ees
(%)
4442
Num
ber o
f em
ploy
ees
16,4
0014
,769
13,1
3511
,432
13,5
9513
,559
14,2
9413
,843
12,1
9211
,900
11,7
0111
,707
11,9
29O
f whi
ch fe
mal
e em
ploy
ees
Perc
enta
ge o
f fem
ale
empl
oyee
s (%
)N
umbe
r of e
mpl
oyee
s41
,000
39,0
0036
,000
102,
548
96,5
9896
,420
94,4
5190
,640
102,
624
100,
792
106,
781
94,5
0198
,037
Of w
hich
fem
ale
empl
oyee
sPe
rcen
tage
of f
emal
e em
ploy
ees
(%)
Num
ber o
f em
ploy
ees
3,01
02,
957
2,70
02,
700
2,90
02,
900
5,79
925
4O
f whi
ch fe
mal
e em
ploy
ees
Perc
enta
ge o
f fem
ale
empl
oyee
s (%
)N
umbe
r of e
mpl
oyee
s41
,244
38,8
9736
,807
44,4
1043
,332
40,6
6941
,178
41,5
2141
,754
41,8
4842
,053
Of w
hich
fem
ale
empl
oyee
sPe
rcen
tage
of f
emal
e em
ploy
ees
(%)
Num
ber o
f em
ploy
ees
17,9
0018
,812
17,3
4115
,254
15,4
6615
,133
15,6
2916
,116
16,4
6917
,085
18,0
85O
f whi
ch fe
mal
e em
ploy
ees
4,20
0Pe
rcen
tage
of f
emal
e em
ploy
ees
(%)
23.4
6N
umbe
r of e
mpl
oyee
s74
,900
74,1
0072
,500
72,9
0074
,600
74,5
0073
,000
Of w
hich
fem
ale
empl
oyee
sPe
rcen
tage
of f
emal
e em
ploy
ees
(%)
Num
ber o
f em
ploy
ees
13,3
0013
,500
13,6
0013
,600
5,11
15,
193
5,30
85,
290
4,56
9O
f whi
ch fe
mal
e em
ploy
ees
Perc
enta
ge o
f fem
ale
empl
oyee
s (%
)N
umbe
r of e
mpl
oyee
s8,
950
9,59
89,
787
8,19
47,
711
6,33
94,
884
3,78
03,
881
2,58
63,
116
3,04
43,
124
Of w
hich
fem
ale
empl
oyee
sPe
rcen
tage
of f
emal
e em
ploy
ees
(%)
Num
ber o
f em
ploy
ees
11,5
5918
,936
19,7
7810
,877
Of w
hich
fem
ale
empl
oyee
s1,
612
4,02
38,
058
2,64
0Pe
rcen
tage
of f
emal
e em
ploy
ees
(%)
13.9
521
.25
40.7
424
.27
Num
ber o
f em
ploy
ees
996
1,25
11,
354
1,15
01,
096
1,12
192
088
41,
384
Of w
hich
fem
ale
empl
oyee
sPe
rcen
tage
of f
emal
e em
ploy
ees
(%)
Syr
ian
Arab
Rep
ublic
Tajik
ista
n
Thai
land
Trin
idad
and
Tob
ago
Zim
babw
e
Spa
in
Sw
eden
Sw
itzer
land
Slo
vaki
a
Vie
t Nam
Slo
veni
a
Sou
th A
frica
Rom
ania
Rus
sian
Fed
erat
ion
Sen
egal
Sin
gapo
re
Qat
ar
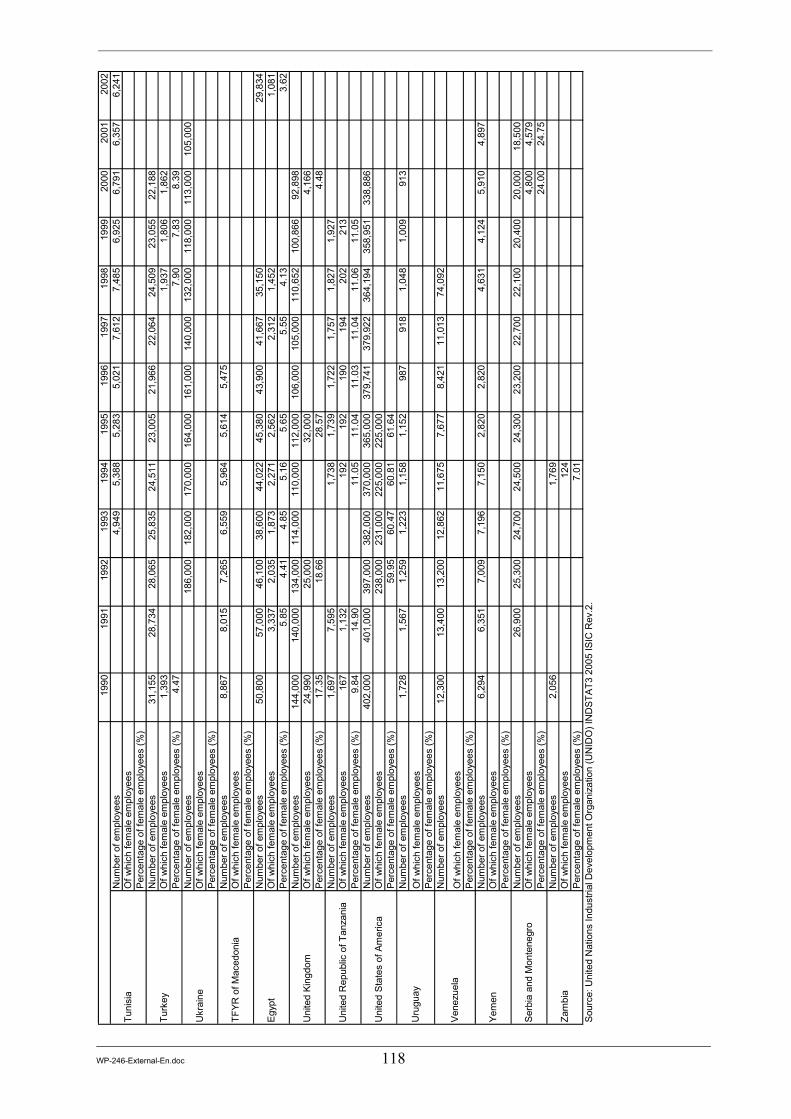
WP-246-External-En.doc 118
1990
1991
1992
1993
1994
1995
1996
1997
1998
1999
2000
2001
2002
Num
ber o
f em
ploy
ees
4,94
95,
388
5,28
35,
021
7,61
27,
485
6,92
56,
791
6,35
76,
241
Of w
hich
fem
ale
empl
oyee
sPe
rcen
tage
of f
emal
e em
ploy
ees
(%)
Num
ber o
f em
ploy
ees
31,1
5528
,734
28,0
6525
,835
24,5
1123
,005
21,9
6622
,064
24,5
0923
,055
22,1
88O
f whi
ch fe
mal
e em
ploy
ees
1,39
31,
937
1,80
61,
862
Perc
enta
ge o
f fem
ale
empl
oyee
s (%
)4.
477.
907.
838.
39N
umbe
r of e
mpl
oyee
s18
6,00
018
2,00
017
0,00
016
4,00
016
1,00
014
0,00
013
2,00
011
8,00
011
3,00
010
5,00
0O
f whi
ch fe
mal
e em
ploy
ees
Perc
enta
ge o
f fem
ale
empl
oyee
s (%
)N
umbe
r of e
mpl
oyee
s8,
867
8,01
57,
265
6,55
95,
964
5,61
45,
475
Of w
hich
fem
ale
empl
oyee
sPe
rcen
tage
of f
emal
e em
ploy
ees
(%)
Num
ber o
f em
ploy
ees
50,8
0057
,000
46,1
0038
,600
44,0
2245
,380
43,9
0041
,667
35,1
5029
,834
Of w
hich
fem
ale
empl
oyee
s3,
337
2,03
51,
873
2,27
12,
562
2,31
21,
452
1,08
1Pe
rcen
tage
of f
emal
e em
ploy
ees
(%)
5.85
4.41
4.85
5.16
5.65
5.55
4.13
3.62
Num
ber o
f em
ploy
ees
144,
000
140,
000
134,
000
114,
000
110,
000
112,
000
106,
000
105,
000
110,
652
100,
866
92,8
98O
f whi
ch fe
mal
e em
ploy
ees
24,9
9025
,000
32,0
004,
166
Per
cent
age
of fe
mal
e em
ploy
ees
(%)
17.3
518
.66
28.5
74.
48N
umbe
r of e
mpl
oyee
s1,
697
7,59
51,
738
1,73
91,
722
1,75
71,
827
1,92
7O
f whi
ch fe
mal
e em
ploy
ees
167
1,13
219
219
219
019
420
221
3Pe
rcen
tage
of f
emal
e em
ploy
ees
(%)
9.84
14.9
011
.05
11.0
411
.03
11.0
411
.06
11.0
5N
umbe
r of e
mpl
oyee
s40
2,00
040
1,00
039
7,00
038
2,00
037
0,00
036
5,00
037
9,74
137
9,92
236
4,19
435
8,95
133
8,88
6O
f whi
ch fe
mal
e em
ploy
ees
238,
000
231,
000
225,
000
225,
000
Perc
enta
ge o
f fem
ale
empl
oyee
s (%
)59
.95
60.4
760
.81
61.6
4N
umbe
r of e
mpl
oyee
s1,
728
1,56
71,
259
1,22
31,
158
1,15
298
791
81,
048
1,00
991
3O
f whi
ch fe
mal
e em
ploy
ees
Perc
enta
ge o
f fem
ale
empl
oyee
s (%
)N
umbe
r of e
mpl
oyee
s12
,300
13,4
0013
,200
12,8
6211
,675
7,67
78,
421
11,0
1374
,092
Of w
hich
fem
ale
empl
oyee
sPe
rcen
tage
of f
emal
e em
ploy
ees
(%)
Num
ber o
f em
ploy
ees
6,29
46,
351
7,00
97,
196
7,15
02,
820
2,82
04,
631
4,12
45,
910
4,89
7O
f whi
ch fe
mal
e em
ploy
ees
Perc
enta
ge o
f fem
ale
empl
oyee
s (%
)N
umbe
r of e
mpl
oyee
s26
,900
25,3
0024
,700
24,5
0024
,300
23,2
0022
,700
22,1
0020
,400
20,0
0018
,500
Of w
hich
fem
ale
empl
oyee
s4,
800
4,57
9Pe
rcen
tage
of f
emal
e em
ploy
ees
(%)
24.0
024
.75
Num
ber o
f em
ploy
ees
2,05
61,
769
Of w
hich
fem
ale
empl
oyee
s12
4Pe
rcen
tage
of f
emal
e em
ploy
ees
(%)
7.01
Sou
rce:
Uni
ted
Nat
ions
Indu
stria
l Dev
elop
men
t Org
aniz
atio
n (U
NID
O) I
ND
STAT
3 20
05 IS
IC R
ev.2
.
Zam
bia
Uru
guay
Vene
zuel
a
Yem
en
Ser
bia
and
Mon
tene
gro
Egyp
t
Uni
ted
King
dom
Uni
ted
Rep
ublic
of T
anza
nia
Uni
ted
Stat
es o
f Am
eric
a
Tuni
sia
Turk
ey
Ukr
aine
TFYR
of M
aced
onia

WP-246-External-En.doc 119
Ap
pend
ix 2.
Evolu
tion o
f rea
l wag
es pe
r emp
loyee
in in
dustr
ial ch
emica
l sec
tor i
n US
dolla
rs an
d nati
onal
curre
ncy,
selec
ted co
untri
es, n
on-ad
justed
, 199
0-200
2
1990
1991
1992
1993
1994
1995
1996
1997
1998
1999
2000
2001
2002
US$
Amou
nt7,3
94.84
4,360
.794,8
81.92
5,224
.693,9
80.34
4,021
.343,2
28.20
7,062
.12Ind
ex10
0.00
58.97
66.02
70.65
53.83
54.38
43.65
95.50
Natio
nal c
urren
cyAm
ount
66,23
9.32
80,55
6.50
106,6
02.19
121,9
72.46
139,5
44.88
191,6
68.03
176,7
40.41
407,5
36.08
Index
100.0
012
1.61
160.9
318
4.14
210.6
728
9.36
266.8
261
5.25
US$
Amou
nt1,6
12.12
1,744
.7497
.2835
5.80
127.5
949
8.56
486.0
152
3.49
687.8
873
1.50
824.3
8Ind
ex10
0.00
108.2
36.0
322
.077.9
130
.9330
.1532
.4742
.6745
.3751
.14Na
tiona
l curr
ency
Amou
nt26
7.61
530.4
05,2
72.82
35,57
1.58
200,3
48.40
1,986
,926.7
31,8
80,37
8.54
2,156
,888.1
73,0
77,66
4.12
3,406
,277.8
54,0
07,14
9.05
Index
100.0
019
8.20
1,970
.3213
,292.2
374
,865.3
174
2,466
.0670
2,651
.6080
5,976
.511,1
50,04
8.02
1,272
,842.9
61,4
97,37
3.87
US$
Amou
nt14
,987.5
012
,765.1
014
,179.5
514
,853.5
513
,843.5
012
,745.0
614
,752.5
215
,214.6
8Ind
ex10
0.00
85.17
94.61
99.11
92.37
85.04
98.43
101.5
2Na
tiona
l curr
ency
Amou
nt29
,975.0
025
,530.2
028
,359.1
129
,707.1
127
,687.0
125
,490.1
229
,505.0
430
,429.3
7Ind
ex10
0.00
85.17
94.61
99.11
92.37
85.04
98.43
101.5
2US
$Am
ount
30,95
7.41
32,34
9.41
36,27
4.65
54,21
2.77
54,36
5.45
46,51
9.72
46,60
9.20
45,45
7.03
Index
100.0
010
4.50
117.1
817
5.12
175.6
115
0.27
150.5
614
6.84
Natio
nal c
urren
cyAm
ount
25,64
5.37
27,38
4.16
28,90
9.63
39,61
8.15
41,72
6.35
41,25
4.24
41,93
9.85
42,66
7.34
Index
100.0
010
6.78
112.7
315
4.48
162.7
116
0.86
163.5
416
6.37
US$
Amou
nt1,8
84.10
2,019
.892,1
95.47
2,401
.522,3
66.83
2,541
.303,3
27.80
3,708
.394,3
94.11
4,549
.114,2
71.79
Index
100.0
010
7.21
116.5
312
7.46
125.6
213
4.88
176.6
319
6.83
233.2
224
1.45
226.7
3Na
tiona
l curr
ency
Amou
nt5,9
77.59
7,232
.438,5
63.49
10,24
2.67
10,93
5.98
12,19
9.10
16,88
7.28
19,48
4.85
24,21
2.12
26,44
1.30
26,41
4.82
Index
100.0
012
0.99
143.2
617
1.35
182.9
520
4.08
282.5
132
5.96
405.0
544
2.34
441.9
0US
$Am
ount
5,989
.596,2
36.35
4,639
.175,0
92.56
4,095
.763,4
59.99
3,512
.4944
7.40
279.2
925
2.46
216.0
3Ind
ex10
0.00
104.1
277
.4585
.0268
.3857
.7758
.647.4
74.6
64.2
13.6
1Na
tiona
l curr
ency
Amou
nt12
,636.3
615
,111.1
112
,454.5
514
,117.6
513
,615.1
412
,631.5
814
,843.3
52,0
68.97
1,424
.871,4
74.65
1,366
.98Ind
ex10
0.00
119.5
898
.5611
1.72
107.7
599
.9611
7.47
16.37
11.28
11.67
10.82
US$
Amou
nt2,1
69.86
758.3
21,3
97.97
1,793
.141,4
49.66
2,064
.892,0
22.76
1,683
.881,8
67.48
1,875
.901,7
94.58
1,827
.232,0
21.56
Index
100.0
034
.9564
.4382
.6466
.8195
.1693
.2277
.6086
.0686
.4582
.7184
.2193
.17Na
tiona
l curr
ency
Amou
nt4.7
513
.4932
.6349
.4878
.4813
8.70
359.8
32,8
32.09
3,287
.443,4
44.87
3,810
.383,9
91.97
4,198
.73Ind
ex10
0.00
283.8
668
6.66
1,041
.251,6
51.44
2,918
.807,5
72.12
59,59
8.05
69,18
0.42
72,49
3.20
80,18
5.04
84,00
6.37
88,35
7.26
US$
Amou
nt40
,230.2
040
,967.6
939
,924.9
337
,382.3
238
,940.4
038
,235.1
139
,909.5
940
,115.4
124
,381.7
637
,815.2
439
,279.1
736
,922.6
5Ind
ex10
0.00
101.8
399
.2492
.9296
.7995
.0499
.2099
.7160
.6194
.0097
.6491
.78Na
tiona
l curr
ency
Amou
nt46
,939.3
946
,937.5
048
,258.0
648
,225.8
153
,178.5
752
,475.4
054
,415.5
255
,544.5
936
,169.3
656
,183.2
458
,333.8
957
,184.3
3Ind
ex10
0.00
100.0
010
2.81
102.7
411
3.29
111.7
911
5.93
118.3
377
.0611
9.69
124.2
712
1.83
US$
Amou
nt91
0.42
1,305
.531,4
03.86
1,257
.061,4
63.37
1,333
.551,4
01.87
1,425
.131,7
07.70
1,454
.871,4
20.81
Index
100.0
014
3.40
154.2
013
8.07
160.7
414
6.48
153.9
815
6.54
187.5
715
9.80
156.0
6Na
tiona
l curr
ency
Amou
nt36
,474.1
654
,011.7
561
,530.4
860
,743.7
672
,312.6
268
,346.5
677
,483.1
684
,075.0
811
0,061
.3210
2,765
.5810
9,409
.72Ind
ex10
0.00
148.0
816
8.70
166.5
419
8.26
187.3
821
2.43
230.5
130
1.75
281.7
529
9.96
US$
Amou
nt8,3
91.40
9,620
.1210
,065.3
310
,904.3
512
,017.8
815
,064.6
914
,852.6
614
,593.0
517
,903.4
913
,541.6
014
,108.7
3Ind
ex10
0.00
114.6
411
9.95
129.9
514
3.22
179.5
317
7.00
173.9
021
3.36
161.3
716
8.13
Natio
nal c
urren
cyAm
ount
2,558
,563.5
43,3
59,50
0.00
3,649
,448.7
54,4
07,16
8.04
5,049
,635.3
05,9
77,26
3.16
6,123
,260.0
46,1
18,79
2.21
8,240
,744.6
66,8
89,65
5.83
7,612
,889.2
0Ind
ex10
0.00
131.3
014
2.64
172.2
519
7.36
233.6
223
9.32
239.1
532
2.08
269.2
829
7.55
US$
Amou
nt14
,687.9
916
,560.1
418
,751.0
718
,283.0
918
,801.2
321
,240.8
122
,237.0
221
,210.4
1Ind
ex10
0.00
112.7
512
7.66
124.4
812
8.00
144.6
115
1.40
144.4
1Na
tiona
l curr
ency
Amou
nt39
5,004
.0744
4,060
.0847
1,852
.0348
2,436
.0249
7,424
.0456
2,583
.9761
0,583
.9760
8,802
.26Ind
ex10
0.00
112.4
211
9.45
122.1
312
5.93
142.4
215
4.58
154.1
3
Algeri
a
Azerb
aijan
Barba
dos
Belgi
um
Boliv
ia
Botsw
ana
Bulga
ria
Cana
da
Sri L
anka
Chile
China
(Taiw
an P
rovinc
e)
Appe
ndix
2. Ev
olut
ion
of re
al wa
ges p
er em
ploy
ee in
indu
stria
l che
mica
l sec
tor i
n US
dol
lars a
nd n
atio
nal c
urre
ncy,
selec
ted
coun
tries
, non
-adj
uste
d, 19
90-2
002

WP-246-External-En.doc 120
19
9019
9119
9219
9319
9419
9519
9619
9719
9819
9920
0020
0120
02US
$Am
ount
4,10
3.26
4,14
9.29
4,62
6.73
5,07
7.86
6,76
7.61
7,37
7.83
8,00
8.96
9,24
4.77
8,00
3.75
7,84
5.88
6,89
6.86
Inde
x10
0.00
101.
1211
2.76
123.
7516
4.93
179.
8019
5.19
225.
3019
5.06
191.
2116
8.08
Natio
nal c
urre
ncy
Amou
nt2,
060,
898.
202,
626,
689.
643,
512,
993.
074,
382,
520.
665,
717,
520.
586,
734,
679.
418,
302,
804.
9410
,547
,915
.18
11,4
13,6
69.1
913
,779
,162
.66
14,3
99,9
49.5
8In
dex
100.
0012
7.45
170.
4621
2.65
277.
4332
6.78
402.
8751
1.81
553.
8266
8.60
698.
72US
$Am
ount
4,07
4.81
3,83
5.81
4,23
7.95
4,44
3.06
4,58
5.59
5,34
1.84
5,30
1.92
6,75
4.41
6,14
0.87
6,21
9.94
7,15
2.95
7,21
9.92
7,15
6.88
Inde
x10
0.00
94.1
310
4.00
109.
0411
2.54
131.
0913
0.11
165.
7615
0.70
152.
6417
5.54
177.
1817
5.64
Natio
nal c
urre
ncy
Amou
nt37
3,16
8.28
469,
625.
5657
0,02
9.41
631,
678.
3272
0,24
4.70
960,
083.
471,
101,
149.
901,
571,
054.
411,
579,
609.
611,
776,
942.
322,
204,
445.
792,
374,
423.
362,
575,
167.
57In
dex
100.
0012
5.85
152.
7516
9.27
193.
0125
7.28
295.
0842
1.00
423.
3047
6.18
590.
7463
6.29
690.
08US
$Am
ount
6,83
6.73
4,97
3.12
1,54
8.53
1,76
1.05
2,92
7.89
4,20
1.18
5,51
2.17
17,6
67.3
730
,379
.48
30,2
95.0
628
,585
.32
31,2
11.7
637
,118
.49
Inde
x10
0.00
72.7
422
.65
25.7
642
.83
61.4
580
.63
258.
4244
4.36
443.
1241
8.11
456.
5354
2.93
Natio
nal c
urre
ncy
Amou
nt76
.57
119.
3540
8.81
6,30
0.00
17,5
55.9
621
,972
.04
29,9
52.0
410
7,78
3.71
193,
283.
0721
5,47
1.83
236,
588.
0926
0,30
5.47
292,
072.
41In
dex
100.
0015
5.87
533.
908,
227.
6122
,927
.57
28,6
94.8
339
,116
.47
140,
762.
3025
2,42
1.91
281,
399.
7830
8,97
6.98
339,
951.
1838
1,43
7.85
US$
Amou
nt11
,100
.91
11,7
75.2
414
,312
.89
11,4
45.0
212
,860
.07
18,1
13.9
716
,319
.94
14,4
70.0
015
,968
.02
15,8
65.3
015
,258
.58
17,0
35.3
619
,386
.74
Inde
x10
0.00
106.
0712
8.93
103.
1011
5.85
163.
1814
7.01
130.
3514
3.84
142.
9213
7.45
153.
4617
4.64
Natio
nal c
urre
ncy
Amou
nt5,
085.
115,
468.
756,
434.
345,
692.
816,
329.
618,
195.
127,
610.
177,
436.
098,
268.
668,
614.
049,
497.
0810
,955
.56
11,8
38.7
1In
dex
100.
0010
7.54
126.
5311
1.95
124.
4716
1.16
149.
6614
6.23
162.
6116
9.40
186.
7621
5.44
232.
81US
$Am
ount
34,6
31.5
534
,598
.93
40,2
62.1
539
,548
.43
40,9
39.4
248
,429
.12
50,4
31.5
945
,030
.54
45,4
36.7
0In
dex
100.
0099
.91
116.
2611
4.20
118.
2113
9.84
145.
6213
0.03
131.
20Na
tiona
l cur
renc
yAm
ount
214,
319.
4022
1,31
0.70
243,
027.
5925
6,42
9.65
260,
397.
2227
1,31
7.83
292,
436.
1229
7,40
2.40
304,
463.
59In
dex
100.
0010
3.26
113.
4011
9.65
121.
5012
6.60
136.
4513
8.77
142.
06US
$Am
ount
4,39
4.17
3,99
5.62
4,11
9.68
4,69
8.26
2,48
7.24
4,06
2.84
4,59
3.95
4,55
1.43
5,15
4.93
3,57
2.44
Inde
x10
0.00
90.9
393
.75
106.
9256
.60
92.4
610
4.55
103.
5811
7.31
81.3
0Na
tiona
l cur
renc
yAm
ount
4,39
4.17
3,99
5.62
4,11
9.68
4,69
8.26
2,48
7.24
4,06
2.84
4,59
3.95
4,55
1.43
5,15
4.93
3,57
2.44
Inde
x10
0.00
90.9
393
.75
106.
9256
.60
92.4
610
4.55
103.
5811
7.31
81.3
0US
$Am
ount
1,81
5.01
2,01
6.50
1,54
0.92
1,06
0.67
1,10
5.60
1,04
2.11
950.
3188
3.22
836.
0077
4.21
652.
0371
7.50
811.
65In
dex
100.
0011
1.10
84.9
058
.44
60.9
157
.42
52.3
648
.66
46.0
642
.66
35.9
239
.53
44.7
2Na
tiona
l cur
renc
yAm
ount
3,75
7.06
4,17
4.16
4,31
8.44
5,30
3.37
6,04
2.11
6,41
7.65
6,03
6.07
5,92
5.83
5,94
8.92
6,14
8.96
5,35
7.86
6,06
8.28
6,95
4.04
Inde
x10
0.00
111.
1011
4.94
141.
1616
0.82
170.
8216
0.66
157.
7315
8.34
163.
6614
2.61
161.
5218
5.09
US$
Amou
nt2,
169.
461,
392.
971,
601.
141,
099.
561,
173.
621,
271.
551,
225.
461,
692.
341,
431.
2774
0.46
Inde
x10
0.00
64.2
173
.80
50.6
854
.10
58.6
156
.49
78.0
165
.97
34.1
3Na
tiona
l cur
renc
yAm
ount
6,08
5.71
6,97
1.43
8,75
8.62
6,77
7.78
7,46
1.54
8,69
3.88
9,02
1.74
13,7
97.0
313
,775
.98
8,37
4.20
Inde
x10
0.00
114.
5514
3.92
111.
3712
2.61
142.
8614
8.24
226.
7122
6.37
137.
60US
$Am
ount
32,7
91.7
632
,142
.78
30,2
65.2
924
,557
.10
27,9
85.2
038
,988
.47
38,4
84.2
036
,033
.46
35,1
35.2
134
,880
.21
31,6
66.4
8In
dex
100.
0098
.02
92.3
074
.89
85.3
411
8.90
117.
3610
9.89
107.
1510
6.37
96.5
7Na
tiona
l cur
renc
yAm
ount
21,0
87.3
021
,861
.88
22,8
01.5
123
,592
.94
24,5
85.8
628
,633
.95
29,7
32.1
231
,462
.11
31,5
79.8
132
,739
.61
34,3
70.8
0In
dex
100.
0010
3.67
108.
1311
1.88
116.
5913
5.79
141.
0014
9.20
149.
7615
5.26
162.
99US
$Am
ount
44,7
45.5
745
,928
.78
44,1
20.7
742
,470
.81
38,0
87.9
137
,942
.10
37,0
37.7
332
,881
.13
Inde
x10
0.00
102.
6498
.60
94.9
285
.12
84.8
082
.77
73.4
8Na
tiona
l cur
renc
yAm
ount
37,1
44.4
639
,505
.00
35,6
07.1
333
,121
.12
33,8
90.5
434
,124
.22
34,7
64.7
335
,689
.18
Inde
x10
0.00
106.
3695
.86
89.1
791
.24
91.8
793
.59
96.0
8US
$Am
ount
43,3
17.3
042
,869
.69
45,1
69.9
054
,443
.73
53,4
30.6
949
,363
.01
49,7
68.0
147
,954
.17
42,7
55.0
1In
dex
100.
0098
.97
104.
2812
5.69
123.
3511
3.96
114.
8911
0.70
98.7
0Na
tiona
l cur
renc
yAm
ount
34,5
87.0
936
,238
.99
37,4
78.3
339
,893
.53
41,1
08.3
443
,765
.78
44,7
76.5
345
,011
.22
46,4
06.2
9In
dex
100.
0010
4.78
108.
3611
5.34
118.
8512
6.54
129.
4613
0.14
134.
17US
$Am
ount
20,5
71.3
821
,283
.46
22,5
67.7
716
,663
.30
17,8
75.9
321
,271
.17
22,3
30.0
820
,641
.92
19,7
67.8
8In
dex
100.
0010
3.46
109.
7081
.00
86.9
010
3.40
108.
5510
0.34
96.0
9Na
tiona
l cur
renc
yAm
ount
9,56
9.62
11,3
84.4
612
,624
.97
11,2
10.7
512
,727
.09
14,4
61.4
615
,774
.37
16,5
41.2
817
,144
.48
Inde
x10
0.00
118.
9613
1.93
117.
1513
2.99
151.
1216
4.84
172.
8517
9.16
US$
Amou
nt1,
089.
461,
375.
511,
157.
2198
7.62
1,50
8.15
1,29
1.49
1,45
6.03
Inde
x10
0.00
126.
2610
6.22
90.6
513
8.43
118.
5413
3.65
Natio
nal c
urre
ncy
Amou
nt5,
478.
787,
112.
286,
521.
285,
680.
008,
762.
887,
833.
259,
310.
81In
dex
100.
0012
9.81
119.
0310
3.67
159.
9414
2.97
169.
94
Colom
bia
Costa
Rica
Croa
tia
Cypr
us
Denm
ark
Ecua
dor
Ethio
pia
Eritr
ea
Finla
nd
Fran
ce
Germ
any
Gree
ce
Guat
emala
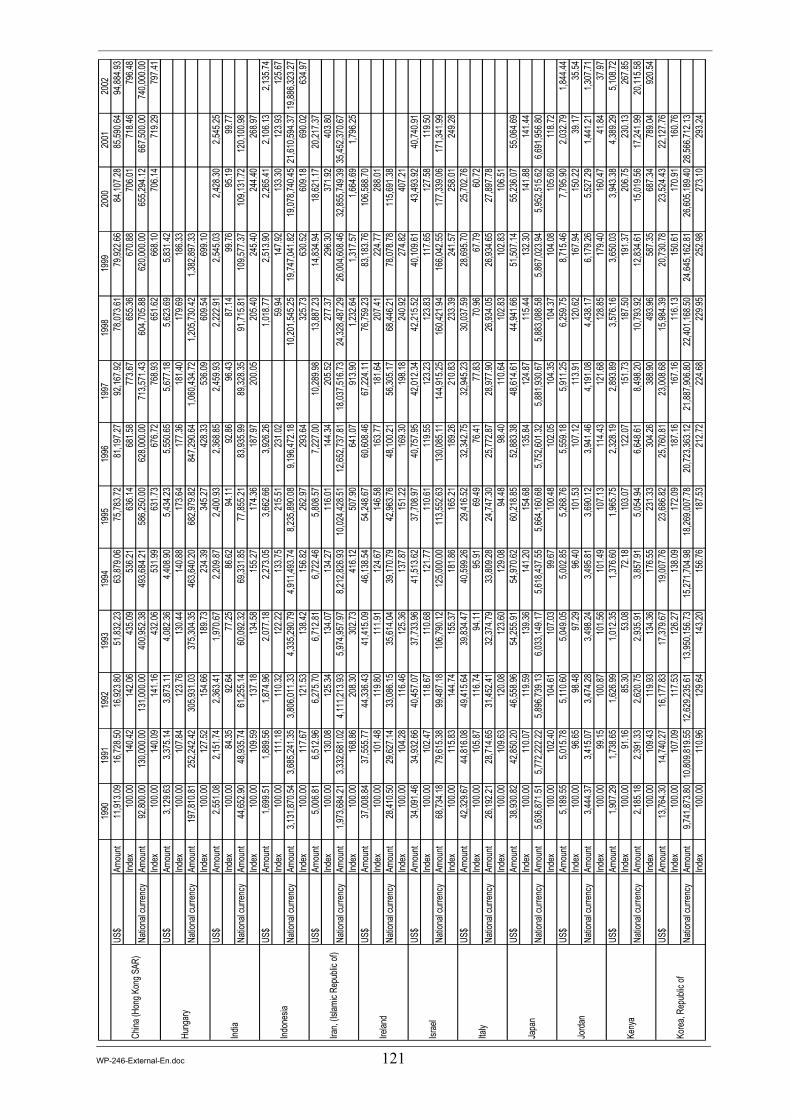
WP-246-External-En.doc 121
1990
1991
1992
1993
1994
1995
1996
1997
1998
1999
2000
2001
2002
US$
Amou
nt11
,913.0
916
,728.5
016
,923.8
051
,832.2
363
,879.0
675
,783.7
281
,197.2
792
,167.9
278
,073.6
179
,922.6
684
,107.2
885
,590.6
494
,884.9
3Ind
ex10
0.00
140.4
214
2.06
435.0
953
6.21
636.1
468
1.58
773.6
765
5.36
670.8
870
6.01
718.4
679
6.48
Natio
nal c
urre
ncy
Amou
nt92
,800.0
013
0,000
.0013
1,000
.0040
0,952
.3849
3,684
.2158
6,250
.0062
8,000
.0071
3,571
.4360
4,705
.8862
0,000
.0065
5,294
.1266
7,500
.0074
0,000
.00Ind
ex10
0.00
140.0
914
1.16
432.0
653
1.99
631.7
367
6.72
768.9
365
1.62
668.1
070
6.14
719.2
979
7.41
US$
Amou
nt3,1
29.63
3,375
.143,8
73.11
4,082
.364,4
08.90
5,434
.235,5
50.65
5,677
.185,6
23.69
5,831
.42Ind
ex10
0.00
107.8
412
3.76
130.4
414
0.88
173.6
417
7.36
181.4
017
9.69
186.3
3Na
tiona
l cur
renc
yAm
ount
197,8
10.81
252,2
42.42
305,9
31.03
375,3
04.35
463,6
40.20
682,9
79.82
847,2
90.64
1,060
,434.7
21,2
05,73
0.42
1,382
,897.3
3Ind
ex10
0.00
127.5
215
4.66
189.7
323
4.39
345.2
742
8.33
536.0
960
9.54
699.1
0US
$Am
ount
2,551
.082,1
51.74
2,363
.411,9
70.67
2,209
.872,4
00.93
2,368
.852,4
59.93
2,222
.912,5
45.03
2,428
.302,5
45.25
Index
100.0
084
.3592
.6477
.2586
.6294
.1192
.8696
.4387
.1499
.7695
.1999
.77Na
tiona
l cur
renc
yAm
ount
44,65
2.90
48,93
5.74
61,25
5.14
60,09
2.32
69,33
1.85
77,85
5.21
83,93
5.99
89,32
8.35
91,71
5.81
109,5
77.37
109,1
31.72
120,1
00.98
Index
100.0
010
9.59
137.1
813
4.58
155.2
717
4.36
187.9
720
0.05
205.4
024
5.40
244.4
026
8.97
US$
Amou
nt1,6
99.51
1,889
.561,8
74.96
2,077
.182,2
73.05
3,662
.663,9
26.26
1,018
.772,5
13.90
2,265
.412,1
06.13
2,135
.74Ind
ex10
0.00
111.1
811
0.32
122.2
213
3.75
215.5
123
1.02
59.94
147.9
213
3.30
123.9
312
5.67
Natio
nal c
urre
ncy
Amou
nt3,1
31,87
0.54
3,685
,241.3
53,8
06,01
1.33
4,335
,290.7
94,9
11,49
3.74
8,235
,890.0
89,1
96,47
2.18
10,20
1,545
.2519
,747,0
41.82
19,07
8,740
.4521
,610,5
94.37
19,88
6,323
.27Ind
ex10
0.00
117.6
712
1.53
138.4
215
6.82
262.9
729
3.64
325.7
363
0.52
609.1
869
0.02
634.9
7US
$Am
ount
5,006
.816,5
12.96
6,275
.706,7
12.81
6,722
.465,8
08.57
7,227
.0010
,289.9
813
,887.2
314
,834.9
418
,621.1
720
,217.3
7Ind
ex10
0.00
130.0
812
5.34
134.0
713
4.27
116.0
114
4.34
205.5
227
7.37
296.3
037
1.92
403.8
0Na
tiona
l cur
renc
yAm
ount
1,973
,684.2
13,3
32,68
1.02
4,111
,213.9
35,9
74,95
7.97
8,212
,826.9
310
,024,4
28.51
12,65
2,737
.8118
,037,5
16.73
24,32
8,487
.2926
,004,6
08.46
32,85
5,749
.3935
,452,3
70.67
Index
100.0
016
8.86
208.3
030
2.73
416.1
250
7.90
641.0
791
3.90
1,232
.641,3
17.57
1,664
.691,7
96.25
US$
Amou
nt37
,008.8
437
,555.7
744
,336.4
341
,415.0
946
,138.5
454
,248.6
760
,608.4
667
,224.1
176
,759.2
383
,183.7
610
6,588
.70Ind
ex10
0.00
101.4
811
9.80
111.9
112
4.67
146.5
816
3.77
181.6
420
7.41
224.7
728
8.01
Natio
nal c
urre
ncy
Amou
nt28
,410.5
029
,627.1
433
,086.1
535
,614.0
439
,170.7
942
,963.7
648
,100.2
156
,305.1
768
,446.2
178
,078.7
811
5,691
.38Ind
ex10
0.00
104.2
811
6.46
125.3
613
7.87
151.2
216
9.30
198.1
824
0.92
274.8
240
7.21
US$
Amou
nt34
,091.4
634
,932.6
640
,457.0
737
,733.9
641
,513.6
237
,708.9
740
,757.9
542
,012.3
442
,215.5
240
,109.6
143
,493.9
240
,740.9
1Ind
ex10
0.00
102.4
711
8.67
110.6
812
1.77
110.6
111
9.55
123.2
312
3.83
117.6
512
7.58
119.5
0Na
tiona
l cur
renc
yAm
ount
68,73
4.18
79,61
5.38
99,48
7.18
106,7
90.12
125,0
00.00
113,5
52.63
130,0
85.11
144,9
15.25
160,4
21.94
166,0
42.55
177,3
39.06
171,3
41.99
Index
100.0
011
5.83
144.7
415
5.37
181.8
616
5.21
189.2
621
0.83
233.3
924
1.57
258.0
124
9.28
US$
Amou
nt42
,329.6
744
,816.0
849
,415.6
439
,834.4
740
,599.2
629
,416.5
232
,342.7
532
,945.2
330
,037.5
928
,695.7
025
,702.7
6Ind
ex10
0.00
105.8
711
6.74
94.11
95.91
69.49
76.41
77.83
70.96
67.79
60.72
Natio
nal c
urre
ncy
Amou
nt26
,192.2
128
,714.6
531
,452.4
132
,374.7
933
,809.2
824
,747.3
025
,772.8
728
,977.9
026
,934.0
526
,934.6
527
,897.7
8Ind
ex10
0.00
109.6
312
0.08
123.6
012
9.08
94.48
98.40
110.6
410
2.83
102.8
310
6.51
US$
Amou
nt38
,930.8
242
,850.2
046
,558.9
654
,255.9
154
,970.6
260
,218.8
552
,883.3
848
,614.6
144
,941.6
651
,507.1
455
,236.0
755
,064.6
9Ind
ex10
0.00
110.0
711
9.59
139.3
614
1.20
154.6
813
5.84
124.8
711
5.44
132.3
014
1.88
141.4
4Na
tiona
l cur
renc
yAm
ount
5,636
,871.5
15,7
72,22
2.22
5,896
,739.1
36,0
33,14
9.17
5,618
,437.5
55,6
64,16
0.68
5,752
,601.3
25,8
81,93
0.67
5,883
,088.5
85,8
67,02
3.94
5,952
,515.6
26,6
91,95
6.80
Index
100.0
010
2.40
104.6
110
7.03
99.67
100.4
810
2.05
104.3
510
4.37
104.0
810
5.60
118.7
2US
$Am
ount
5,189
.555,0
15.78
5,110
.605,0
49.05
5,002
.855,2
68.76
5,559
.185,9
11.25
6,259
.758,7
15.46
7,795
.902,0
32.79
1,844
.44Ind
ex10
0.00
96.65
98.48
97.29
96.40
101.5
310
7.12
113.9
112
0.62
167.9
415
0.22
39.17
35.54
Natio
nal c
urre
ncy
Amou
nt3,4
44.37
3,415
.073,4
74.28
3,498
.243,4
95.81
3,690
.123,9
41.46
4,191
.084,4
38.17
6,179
.265,5
27.29
1,441
.211,3
07.71
Index
100.0
099
.1510
0.87
101.5
610
1.49
107.1
311
4.43
121.6
812
8.85
179.4
016
0.47
41.84
37.97
US$
Amou
nt1,9
07.29
1,738
.651,6
26.99
1,012
.351,3
76.60
1,965
.752,3
28.19
2,893
.893,5
76.16
3,650
.033,9
43.38
4,389
.295,1
08.72
Index
100.0
091
.1685
.3053
.0872
.1810
3.07
122.0
715
1.73
187.5
019
1.37
206.7
523
0.13
267.8
5Na
tiona
l cur
renc
yAm
ount
2,185
.182,3
91.33
2,620
.752,9
35.91
3,857
.915,0
54.94
6,648
.618,4
98.20
10,79
3.92
12,83
4.61
15,01
9.56
17,24
1.99
20,11
5.58
Index
100.0
010
9.43
119.9
313
4.36
176.5
523
1.33
304.2
638
8.90
493.9
658
7.35
687.3
478
9.04
920.5
4US
$Am
ount
13,76
4.30
14,74
0.27
16,17
7.83
17,37
9.67
19,00
7.76
23,68
6.82
25,76
0.81
23,00
8.68
15,98
4.39
20,73
0.78
23,52
4.43
22,12
7.76
Index
100.0
010
7.09
117.5
312
6.27
138.0
917
2.09
187.1
616
7.16
116.1
315
0.61
170.9
116
0.76
Natio
nal c
urre
ncy
Amou
nt9,7
41,87
3.80
10,80
9,819
.5512
,629,2
35.61
13,95
0,156
.7315
,271,7
04.98
18,26
9,007
.7820
,723,3
63.12
21,88
7,906
.8022
,401,1
68.50
24,64
5,162
.8126
,605,1
89.40
28,56
6,712
.13Ind
ex10
0.00
110.9
612
9.64
143.2
015
6.76
187.5
321
2.72
224.6
822
9.95
252.9
827
3.10
293.2
4
China
(Hon
g Kon
g SAR
)
Hung
ary
India
Indon
esia
Iran,
(Islam
ic Re
publi
c of)
Irelan
d
Israe
l
Italy
Japa
n
Jord
an
Keny
a
Kore
a, Re
publi
c of
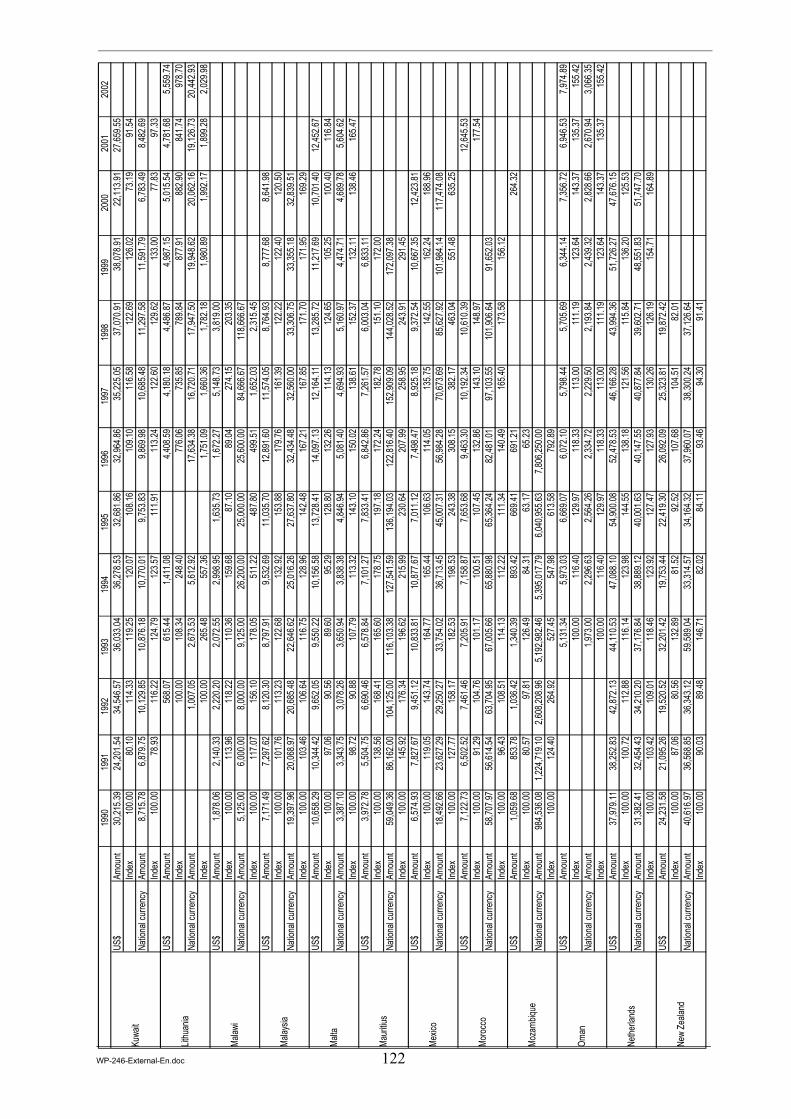
WP-246-External-En.doc 122
1990
1991
1992
1993
1994
1995
1996
1997
1998
1999
2000
2001
2002
US$
Amou
nt30
,215.3
924
,201.5
434
,546.5
736
,033.0
436
,278.5
332
,681.8
632
,964.8
635
,225.0
537
,070.9
138
,078.9
122
,113.9
127
,659.5
5Ind
ex10
0.00
80.10
114.3
311
9.25
120.0
710
8.16
109.1
011
6.58
122.6
912
6.02
73.19
91.54
Natio
nal c
urre
ncy
Amou
nt8,7
15.78
6,879
.7510
,129.8
510
,876.1
810
,770.0
19,7
53.83
9,869
.9810
,685.4
811
,297.5
811
,591.7
96,7
83.49
8,482
.69Ind
ex10
0.00
78.93
116.2
212
4.79
123.5
711
1.91
113.2
412
2.60
129.6
213
3.00
77.83
97.33
US$
Amou
nt56
8.07
615.4
41,4
11.08
4,408
.594,1
80.18
4,486
.874,9
87.15
5,015
.544,7
81.68
5,559
.74Ind
ex10
0.00
108.3
424
8.40
776.0
673
5.85
789.8
487
7.91
882.9
084
1.74
978.7
0Na
tiona
l cur
renc
yAm
ount
1,007
.052,6
73.53
5,612
.9217
,634.3
816
,720.7
117
,947.5
019
,948.6
220
,062.1
619
,126.7
320
,442.9
3Ind
ex10
0.00
265.4
855
7.36
1,751
.091,6
60.36
1,782
.181,9
80.89
1,992
.171,8
99.28
2,029
.98US
$Am
ount
1,878
.062,1
40.33
2,220
.202,0
72.55
2,998
.951,6
35.73
1,672
.275,1
48.73
3,819
.00Ind
ex10
0.00
113.9
611
8.22
110.3
615
9.68
87.10
89.04
274.1
520
3.35
Natio
nal c
urre
ncy
Amou
nt5,1
25.00
6,000
.008,0
00.00
9,125
.0026
,200.0
025
,000.0
025
,600.0
084
,666.6
711
8,666
.67Ind
ex10
0.00
117.0
715
6.10
178.0
551
1.22
487.8
049
9.51
1,652
.032,3
15.45
US$
Amou
nt7,1
71.49
7,297
.628,1
20.30
8,797
.919,5
32.69
11,03
5.70
12,89
1.60
11,57
4.05
8,764
.938,7
77.68
8,641
.98Ind
ex10
0.00
101.7
611
3.23
122.6
813
2.92
153.8
817
9.76
161.3
912
2.22
122.4
012
0.50
Natio
nal c
urre
ncy
Amou
nt19
,397.9
620
,068.9
720
,685.4
822
,646.6
225
,016.2
627
,637.8
032
,434.4
832
,560.0
033
,306.7
533
,355.1
832
,839.5
1Ind
ex10
0.00
103.4
610
6.64
116.7
512
8.96
142.4
816
7.21
167.8
517
1.70
171.9
516
9.29
US$
Amou
nt10
,658.2
910
,344.4
29,6
52.05
9,550
.2210
,156.5
813
,728.4
114
,097.1
312
,164.1
113
,285.7
211
,217.6
910
,701.4
012
,452.6
7Ind
ex10
0.00
97.06
90.56
89.60
95.29
128.8
013
2.26
114.1
312
4.65
105.2
510
0.40
116.8
4Na
tiona
l cur
renc
yAm
ount
3,387
.103,3
43.75
3,078
.263,6
50.94
3,838
.384,8
46.94
5,081
.404,6
94.93
5,160
.974,4
74.71
4,689
.785,6
04.62
Index
100.0
098
.7290
.8810
7.79
113.3
214
3.10
150.0
213
8.61
152.3
713
2.11
138.4
616
5.47
US$
Amou
nt3,9
72.78
5,504
.756,6
90.46
6,578
.847,1
01.27
7,833
.416,8
42.86
7,261
.576,0
03.04
6,833
.11Ind
ex10
0.00
138.5
616
8.41
165.6
017
8.75
197.1
817
2.24
182.7
815
1.10
172.0
0Na
tiona
l cur
renc
yAm
ount
59,04
9.36
86,16
2.00
104,1
25.00
116,1
03.38
127,5
41.59
136,1
94.03
122,8
16.40
152,9
09.09
144,0
28.52
172,0
97.38
Index
100.0
014
5.92
176.3
419
6.62
215.9
923
0.64
207.9
925
8.95
243.9
129
1.45
US$
Amou
nt6,5
74.93
7,827
.679,4
51.12
10,83
3.81
10,87
7.67
7,011
.127,4
98.47
8,925
.189,3
72.54
10,66
7.35
12,42
3.81
Index
100.0
011
9.05
143.7
416
4.77
165.4
410
6.63
114.0
513
5.75
142.5
516
2.24
188.9
6Na
tiona
l cur
renc
yAm
ount
18,49
2.66
23,62
7.29
29,25
0.27
33,75
4.02
36,71
3.45
45,00
7.31
56,98
4.28
70,67
3.69
85,62
7.92
101,9
84.14
117,4
74.08
Index
100.0
012
7.77
158.1
718
2.53
198.5
324
3.38
308.1
538
2.17
463.0
455
1.48
635.2
5US
$Am
ount
7,122
.736,5
02.52
7,461
.467,2
05.91
7,158
.877,6
53.68
9,463
.3010
,192.3
410
,610.3
912
,645.5
3Ind
ex10
0.00
91.29
104.7
610
1.17
100.5
110
7.45
132.8
614
3.10
148.9
717
7.54
Natio
nal c
urre
ncy
Amou
nt58
,707.9
756
,614.5
463
,704.9
567
,005.6
665
,880.9
865
,364.2
482
,481.0
197
,103.5
510
1,906
.6491
,652.0
3Ind
ex10
0.00
96.43
108.5
111
4.13
112.2
211
1.34
140.4
916
5.40
173.5
815
6.12
US$
Amou
nt1,0
59.68
853.7
81,0
36.42
1,340
.3989
3.42
669.4
169
1.21
264.3
2Ind
ex10
0.00
80.57
97.81
126.4
984
.3163
.1765
.23Na
tiona
l cur
renc
yAm
ount
984,5
36.08
1,224
,719.1
02,6
08,20
8.96
5,192
,982.4
65,3
95,01
7.79
6,040
,955.6
37,8
06,25
0.00
Index
100.0
012
4.40
264.9
252
7.45
547.9
861
3.58
792.8
9US
$Am
ount
5,131
.345,9
73.03
6,669
.076,0
72.10
5,798
.445,7
05.69
6,344
.147,3
56.72
6,946
.537,9
74.89
Index
100.0
011
6.40
129.9
711
8.33
113.0
011
1.19
123.6
414
3.37
135.3
715
5.42
Natio
nal c
urre
ncy
Amou
nt1,9
73.00
2,296
.632,5
64.26
2,334
.722,2
29.50
2,193
.842,4
39.32
2,828
.662,6
70.94
3,066
.35Ind
ex10
0.00
116.4
012
9.97
118.3
311
3.00
111.1
912
3.64
143.3
713
5.37
155.4
2US
$Am
ount
37,97
9.11
38,25
2.83
42,87
2.13
44,11
0.53
47,08
8.10
54,90
0.08
52,47
8.53
46,16
6.28
43,99
4.36
51,72
6.27
47,67
6.15
Index
100.0
010
0.72
112.8
811
6.14
123.9
814
4.55
138.1
812
1.56
115.8
413
6.20
125.5
3Na
tiona
l cur
renc
yAm
ount
31,38
2.41
32,45
4.43
34,21
0.20
37,17
6.84
38,88
9.12
40,00
1.63
40,14
7.55
40,87
7.84
39,60
2.71
48,55
1.83
51,74
7.70
Index
100.0
010
3.42
109.0
111
8.46
123.9
212
7.47
127.9
313
0.26
126.1
915
4.71
164.8
9US
$Am
ount
24,23
1.58
21,09
5.26
19,52
0.52
32,20
1.42
19,75
3.44
22,41
9.30
26,09
2.09
25,32
3.81
19,87
2.42
Index
100.0
087
.0680
.5613
2.89
81.52
92.52
107.6
810
4.51
82.01
Natio
nal c
urre
ncy
Amou
nt40
,616.9
736
,568.8
536
,343.1
259
,589.0
433
,314.5
734
,164.3
237
,960.0
738
,300.2
437
,126.6
4Ind
ex10
0.00
90.03
89.48
146.7
182
.0284
.1193
.4694
.3091
.41
Kuwa
it
Lithu
ania
Malaw
i
Malay
sia
Malta
Maur
itius
Mexic
o
Moro
cco
Moza
mbiqu
e
Oman
Nethe
rland
s
New
Zeala
nd
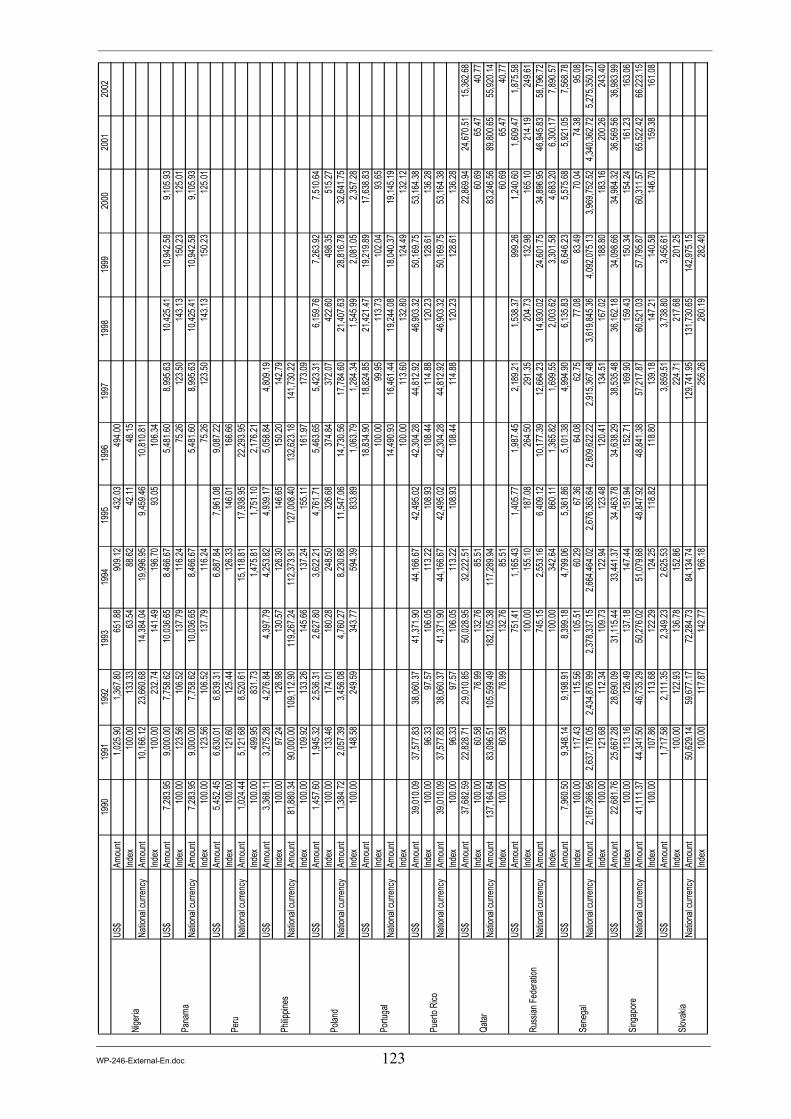
WP-246-External-En.doc 123
19
9019
9119
9219
9319
9419
9519
9619
9719
9819
9920
0020
0120
02US
$Am
ount
1,025
.901,3
67.80
651.8
890
9.12
432.0
349
4.00
Index
100.0
013
3.33
63.54
88.62
42.11
48.15
Natio
nal c
urre
ncy
Amou
nt10
,166.1
223
,660.6
814
,384.0
419
,996.9
59,4
59.46
10,81
0.81
Index
100.0
023
2.74
141.4
919
6.70
93.05
106.3
4US
$Am
ount
7,283
.959,0
00.00
7,758
.6210
,036.6
58,4
66.67
5,481
.608,9
95.63
10,42
5.41
10,94
2.58
9,105
.93Ind
ex10
0.00
123.5
610
6.52
137.7
911
6.24
75.26
123.5
014
3.13
150.2
312
5.01
Natio
nal c
urre
ncy
Amou
nt7,2
83.95
9,000
.007,7
58.62
10,03
6.65
8,466
.675,4
81.60
8,995
.6310
,425.4
110
,942.5
89,1
05.93
Index
100.0
012
3.56
106.5
213
7.79
116.2
475
.2612
3.50
143.1
315
0.23
125.0
1US
$Am
ount
5,452
.456,6
30.01
6,839
.316,8
87.84
7,961
.089,0
87.22
Index
100.0
012
1.60
125.4
412
6.33
146.0
116
6.66
Natio
nal c
urre
ncy
Amou
nt1,0
24.44
5,121
.688,5
20.61
15,11
8.81
17,93
8.95
22,29
3.95
Index
100.0
049
9.95
831.7
31,4
75.81
1,751
.102,1
76.21
US$
Amou
nt3,3
68.11
3,275
.284,2
76.84
4,397
.794,2
53.82
4,939
.175,0
58.84
4,809
.19Ind
ex10
0.00
97.24
126.9
813
0.57
126.3
014
6.65
150.2
014
2.79
Natio
nal c
urre
ncy
Amou
nt81
,880.3
490
,000.0
010
9,112
.9011
9,267
.2411
2,373
.9112
7,008
.4013
2,623
.1814
1,730
.22Ind
ex10
0.00
109.9
213
3.26
145.6
613
7.24
155.1
116
1.97
173.0
9US
$Am
ount
1,457
.601,9
45.32
2,536
.312,6
27.80
3,622
.214,7
61.71
5,463
.655,4
23.31
6,159
.767,2
63.92
7,510
.64Ind
ex10
0.00
133.4
617
4.01
180.2
824
8.50
326.6
837
4.84
372.0
742
2.60
498.3
551
5.27
Natio
nal c
urre
ncy
Amou
nt1,3
84.72
2,057
.393,4
56.08
4,760
.278,2
30.68
11,54
7.06
14,73
0.56
17,78
4.60
21,40
7.63
28,81
6.78
32,64
1.75
Index
100.0
014
8.58
249.5
934
3.77
594.3
983
3.89
1,063
.791,2
84.34
1,545
.992,0
81.05
2,357
.28US
$Am
ount
18,83
4.90
18,82
4.85
21,42
1.47
19,21
9.89
17,63
8.83
Index
100.0
099
.9511
3.73
102.0
493
.65Na
tiona
l cur
renc
yAm
ount
14,49
0.93
16,46
1.44
19,24
4.08
18,04
0.37
19,14
5.19
Index
100.0
011
3.60
132.8
012
4.49
132.1
2US
$Am
ount
39,01
0.09
37,57
7.83
38,06
0.37
41,37
1.90
44,16
6.67
42,49
5.02
42,30
4.28
44,81
2.92
46,90
3.32
50,16
9.75
53,16
4.38
Index
100.0
096
.3397
.5710
6.05
113.2
210
8.93
108.4
411
4.88
120.2
312
8.61
136.2
8Na
tiona
l cur
renc
yAm
ount
39,01
0.09
37,57
7.83
38,06
0.37
41,37
1.90
44,16
6.67
42,49
5.02
42,30
4.28
44,81
2.92
46,90
3.32
50,16
9.75
53,16
4.38
Index
100.0
096
.3397
.5710
6.05
113.2
210
8.93
108.4
411
4.88
120.2
312
8.61
136.2
8US
$Am
ount
37,68
2.59
22,82
8.71
29,01
0.85
50,02
8.95
32,22
2.51
22,86
9.94
24,67
0.51
15,36
2.68
Index
100.0
060
.5876
.9913
2.76
85.51
60.69
65.47
40.77
Natio
nal c
urre
ncy
Amou
nt13
7,164
.6483
,096.5
110
5,599
.4918
2,105
.3811
7,289
.9483
,246.5
689
,800.6
555
,920.1
4Ind
ex10
0.00
60.58
76.99
132.7
685
.5160
.6965
.4740
.77US
$Am
ount
751.4
11,1
65.43
1,405
.771,9
87.45
2,189
.211,5
38.37
999.2
61,2
40.60
1,609
.471,8
75.58
Index
100.0
015
5.10
187.0
826
4.50
291.3
520
4.73
132.9
816
5.10
214.1
924
9.61
Natio
nal c
urre
ncy
Amou
nt74
5.15
2,553
.166,4
09.12
10,17
7.39
12,66
4.23
14,93
0.02
24,60
1.75
34,89
6.95
46,94
5.83
58,79
6.72
Index
100.0
034
2.64
860.1
11,3
65.82
1,699
.552,0
03.62
3,301
.584,6
83.20
6,300
.177,8
90.57
US$
Amou
nt7,9
60.50
9,348
.149,1
98.91
8,399
.184,7
99.06
5,361
.865,1
01.38
4,994
.906,1
35.83
6,646
.235,5
75.68
5,921
.057,5
68.78
Index
100.0
011
7.43
115.5
610
5.51
60.29
67.36
64.08
62.75
77.08
83.49
70.04
74.38
95.08
Natio
nal c
urre
ncy
Amou
nt2,1
67,36
6.95
2,637
,176.0
52,4
34,87
6.99
2,378
,337.1
52,6
64,46
4.02
2,676
,363.6
42,6
09,62
2.22
2,915
,367.4
83,6
19,84
5.36
4,092
,075.1
33,9
69,75
2.52
4,340
,362.7
25,2
75,35
0.37
Index
100.0
012
1.68
112.3
410
9.73
122.9
412
3.48
120.4
113
4.51
167.0
218
8.80
183.1
620
0.26
243.4
0US
$Am
ount
22,68
1.76
25,66
7.28
28,69
0.09
31,11
5.44
33,44
1.37
34,46
3.78
34,63
8.29
38,53
5.48
36,16
2.18
34,09
8.66
34,98
4.32
36,56
9.56
36,98
3.99
Index
100.0
011
3.16
126.4
913
7.18
147.4
415
1.94
152.7
116
9.90
159.4
315
0.34
154.2
416
1.23
163.0
6Na
tiona
l cur
renc
yAm
ount
41,11
1.37
44,34
1.50
46,73
5.29
50,27
6.02
51,07
9.68
48,84
7.92
48,84
1.38
57,21
7.87
60,52
1.03
57,79
5.87
60,31
1.57
65,52
2.42
66,22
3.15
Index
100.0
010
7.86
113.6
812
2.29
124.2
511
8.82
118.8
013
9.18
147.2
114
0.58
146.7
015
9.38
161.0
8US
$Am
ount
1,717
.582,1
11.35
2,349
.232,6
25.53
3,859
.513,7
38.80
3,456
.61Ind
ex10
0.00
122.9
313
6.78
152.8
622
4.71
217.6
820
1.25
Natio
nal c
urre
ncy
Amou
nt50
,629.1
459
,677.1
772
,284.7
384
,134.7
412
9,741
.9513
1,730
.6514
2,975
.15Ind
ex10
0.00
117.8
714
2.77
166.1
825
6.26
260.1
928
2.40
Nige
ria
Pana
ma
Peru
Philip
pines
Polan
d
Portu
gal
Puer
to Ri
co
Slova
kia
Qatar
Russ
ian F
eder
ation
Sene
gal
Singa
pore

WP-246-External-En.doc 124
1990
1991
1992
1993
1994
1995
1996
1997
1998
1999
2000
2001
2002
US$
Amou
nt13
,231.6
810
,962.7
011
,012.4
110
,744.7
812
,217.0
615
,224.1
615
,115.5
620
,254.5
914
,657.5
713
,856.8
212
,962.4
313
,692.0
815
,130.9
3Ind
ex10
0.00
82.85
83.23
81.20
92.33
115.0
611
4.24
153.0
811
0.78
104.7
297
.9710
3.48
114.3
5Na
tiona
l curr
ency
Amou
nt14
9,756
.1030
2,254
.7289
5,165
.591,2
16,75
9.97
1,573
,666.7
91,8
04,33
6.60
2,046
,103.2
63,2
34,41
4.51
2,435
,121.3
92,5
18,73
9.50
2,886
,163.5
83,3
23,73
7.93
3,635
,174.7
8Ind
ex10
0.00
201.8
359
7.75
812.4
91,0
50.82
1,204
.851,3
66.29
2,159
.791,6
26.06
1,681
.891,9
27.24
2,219
.432,4
27.40
US$
Amou
nt12
,905.3
413
,910.1
614
,921.2
513
,303.5
213
,606.4
814
,713.5
013
,680.5
214
,309.1
213
,037.7
811
,868.0
011
,922.2
111
,403.7
99,5
44.32
Index
100.0
010
7.79
115.6
210
3.09
105.4
311
4.01
106.0
111
0.88
101.0
391
.9692
.3888
.3673
.96Na
tiona
l curr
ency
Amou
nt33
,390.2
438
,410.2
642
,555.5
643
,472.4
348
,313.8
953
,367.0
458
,817.3
665
,935.8
572
,076.5
272
,507.3
182
,738.0
998
,177.2
810
0,603
.83Ind
ex10
0.00
115.0
312
7.45
130.2
014
4.69
159.8
317
6.15
197.4
721
5.86
217.1
524
7.79
294.0
330
1.30
US$
Amou
nt7,6
72.53
5,581
.424,9
54.28
5,124
.414,6
36.31
5,694
.487,5
01.98
Index
100.0
072
.7564
.5766
.7960
.4374
.2297
.78Na
tiona
l curr
ency
Amou
nt18
,810.9
620
,212.3
825
,259.2
633
,222.2
237
,793.1
049
,344.8
375
,037.7
7Ind
ex10
0.00
107.4
513
4.28
176.6
120
0.91
262.3
239
8.90
US$
Amou
nt26
,634.0
328
,547.7
131
,528.6
128
,880.0
629
,518.4
732
,406.1
735
,113.6
930
,250.2
431
,320.7
730
,725.9
826
,663.3
6Ind
ex10
0.00
107.1
911
8.38
108.4
311
0.83
121.6
713
1.84
113.5
811
7.60
115.3
610
0.11
Natio
nal c
urren
cyAm
ount
16,31
6.97
17,82
8.73
19,39
9.87
22,08
8.85
23,76
5.44
24,28
5.06
26,73
0.44
26,61
9.18
28,12
2.36
28,84
0.33
28,94
0.41
Index
100.0
010
9.26
118.8
913
5.37
145.6
514
8.83
163.8
216
3.14
172.3
517
6.75
177.3
6US
$Am
ount
28,39
1.73
30,38
3.67
33,21
1.43
26,40
6.37
27,96
6.46
30,71
6.13
33,30
2.10
29,80
9.71
28,86
7.67
28,36
1.81
26,49
8.27
Index
100.0
010
7.02
116.9
893
.0198
.5010
8.19
117.3
010
4.99
101.6
899
.8993
.33Na
tiona
l curr
ency
Amou
nt16
8,044
.6918
3,744
.3119
3,417
.7420
5,532
.1221
5,788
.3721
9,106
.4622
3,322
.5422
7,593
.8222
9,494
.2623
4,337
.4924
2,783
.52Ind
ex10
0.00
109.3
411
5.10
122.3
112
8.41
130.3
913
2.89
135.4
413
6.57
139.4
514
4.48
US$
Amou
nt5,5
12.67
5,919
.337,3
95.52
3,242
.5010
,649.9
811
,819.9
29,4
99.47
10,25
5.94
13,86
3.16
Index
100.0
010
7.38
134.1
558
.8219
3.19
214.4
117
2.32
186.0
425
1.48
Natio
nal c
urren
cyAm
ount
61,87
9.70
66,44
4.44
83,01
4.71
36,39
7.06
119,5
46.08
132,6
78.61
106,6
31.50
115,1
22.87
155,6
13.92
Index
100.0
010
7.38
134.1
558
.8219
3.19
214.4
117
2.32
186.0
425
1.48
US$
Amou
nt22
,111.9
816
,683.1
217
,203.9
315
,193.9
514
,829.7
115
,253.1
332
,686.4
832
,613.6
121
,814.6
2Ind
ex10
0.00
75.45
77.80
68.71
67.07
68.98
147.8
214
7.49
98.66
Natio
nal c
urren
cyAm
ount
93,97
5.90
70,90
3.28
73,11
6.69
81,30
4.35
87,86
4.96
90,72
2.57
205,8
69.57
205,4
29.86
137,4
27.75
Index
100.0
075
.4577
.8086
.5293
.5096
.5421
9.07
218.6
014
6.24
US$
Amou
nt9,2
73.26
8,428
.4510
,107.2
811
,294.1
66,8
77.97
6,922
.197,7
78.86
7,434
.248,1
89.48
Index
100.0
090
.8910
8.99
121.7
974
.1774
.6583
.8880
.1788
.31Na
tiona
l curr
ency
Amou
nt9,3
07.94
8,525
.809,5
58.96
10,99
3.83
7,606
.417,8
82.43
9,227
.4410
,189.9
611
,782.2
9Ind
ex10
0.00
91.60
102.7
011
8.11
81.72
84.69
99.14
109.4
812
6.58
US$
Amou
nt10
,544.8
113
,097.1
913
,812.0
918
,630.1
611
,677.7
512
,585.0
212
,485.6
013
,055.8
912
,304.9
313
,650.1
615
,135.7
0Ind
ex10
0.00
124.2
113
0.98
176.6
811
0.74
119.3
511
8.41
123.8
111
6.69
129.4
514
3.54
Natio
nal c
urren
cyAm
ount
27,50
7,623
.1754
,639,1
03.50
94,92
2,501
.3420
4,644
,861.6
234
5,763
,126.7
657
6,961
,530.1
01,0
16,38
8,964
.761,9
82,73
2,052
.213,2
08,19
0,052
.635,7
16,45
6,300
.159,4
63,11
0,690
.46Ind
ex10
0.00
198.6
334
5.08
743.9
61,2
56.97
2,097
.463,6
94.94
7,207
.9411
,662.9
120
,781.3
534
,401.7
8
Swed
en
Slove
nia
South
Afric
a
Zimba
bwe
Spain
Syria
n Arab
Rep
ublic
Trini
dad a
nd To
bago
Tunis
ia
Turke
y
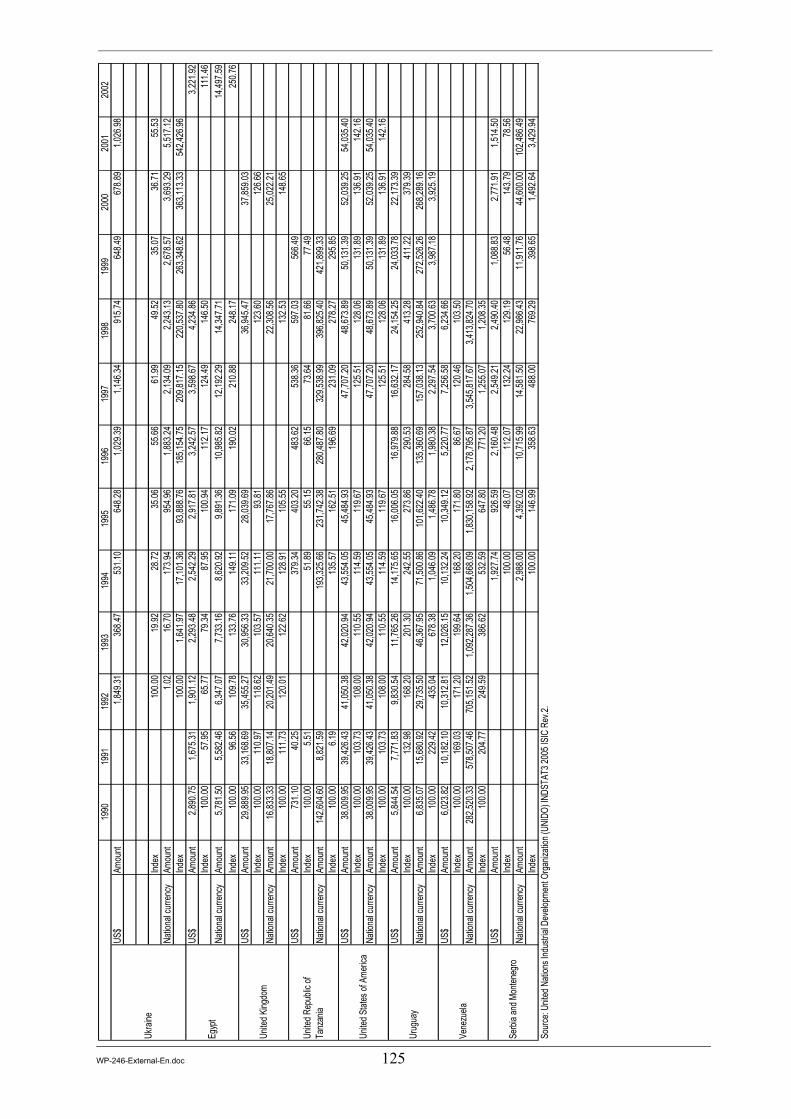
WP-246-External-En.doc 125
19
9019
9119
9219
9319
9419
9519
9619
9719
9819
9920
0020
0120
02US
$Am
ount
1,849
.3136
8.47
531.1
064
8.28
1,029
.391,1
46.34
915.7
464
8.49
678.8
91,0
26.98
Index
100.0
019
.9228
.7235
.0655
.6661
.9949
.5235
.0736
.7155
.53Na
tiona
l curr
ency
Amou
nt1.0
216
.7017
3.94
954.9
61,8
83.24
2,134
.092,2
43.13
2,678
.573,6
93.29
5,517
.12Ind
ex10
0.00
1,641
.9717
,101.3
693
,888.7
618
5,154
.7520
9,817
.1522
0,537
.8026
3,348
.6236
3,113
.3354
2,426
.96US
$Am
ount
2,890
.751,6
75.31
1,901
.122,2
93.48
2,542
.292,9
17.81
3,242
.573,5
98.67
4,234
.863,2
21.92
Index
100.0
057
.9565
.7779
.3487
.9510
0.94
112.1
712
4.49
146.5
011
1.46
Natio
nal c
urren
cyAm
ount
5,781
.505,5
82.46
6,347
.077,7
33.16
8,620
.929,8
91.36
10,98
5.82
12,19
2.29
14,34
7.71
14,49
7.59
Index
100.0
096
.5610
9.78
133.7
614
9.11
171.0
919
0.02
210.8
824
8.17
250.7
6US
$Am
ount
29,88
9.95
33,16
8.69
35,45
5.27
30,95
6.33
33,20
9.52
28,03
9.69
36,94
5.47
37,85
9.03
Index
100.0
011
0.97
118.6
210
3.57
111.1
193
.8112
3.60
126.6
6Na
tiona
l curr
ency
Amou
nt16
,833.3
318
,807.1
420
,201.4
920
,640.3
521
,700.0
017
,767.8
622
,308.5
625
,022.2
1Ind
ex10
0.00
111.7
312
0.01
122.6
212
8.91
105.5
513
2.53
148.6
5US
$Am
ount
731.1
040
.2537
9.34
403.2
048
3.62
538.3
659
7.03
566.4
9Ind
ex10
0.00
5.51
51.89
55.15
66.15
73.64
81.66
77.49
Natio
nal c
urren
cyAm
ount
142,6
04.60
8,821
.5919
3,325
.6623
1,742
.3828
0,487
.8032
9,538
.9939
6,825
.4042
1,899
.33Ind
ex10
0.00
6.19
135.5
716
2.51
196.6
923
1.09
278.2
729
5.85
US$
Amou
nt38
,009.9
539
,426.4
341
,050.3
842
,020.9
443
,554.0
545
,484.9
347
,707.2
048
,673.8
950
,131.3
952
,039.2
554
,035.4
0Ind
ex10
0.00
103.7
310
8.00
110.5
511
4.59
119.6
712
5.51
128.0
613
1.89
136.9
114
2.16
Natio
nal c
urren
cyAm
ount
38,00
9.95
39,42
6.43
41,05
0.38
42,02
0.94
43,55
4.05
45,48
4.93
47,70
7.20
48,67
3.89
50,13
1.39
52,03
9.25
54,03
5.40
Index
100.0
010
3.73
108.0
011
0.55
114.5
911
9.67
125.5
112
8.06
131.8
913
6.91
142.1
6US
$Am
ount
5,844
.547,7
71.83
9,830
.5411
,765.2
614
,175.6
516
,006.0
516
,979.8
816
,632.1
724
,154.2
524
,033.7
822
,173.3
9Ind
ex10
0.00
132.9
816
8.20
201.3
024
2.55
273.8
629
0.53
284.5
841
3.28
411.2
237
9.39
Natio
nal c
urren
cyAm
ount
6,835
.0715
,680.9
229
,735.5
046
,367.9
571
,500.8
610
1,622
.4013
5,360
.6915
7,038
.1325
2,940
.8427
2,526
.2626
8,289
.16Ind
ex10
0.00
229.4
243
5.04
678.3
81,0
46.09
1,486
.781,9
80.38
2,297
.543,7
00.63
3,987
.183,9
25.19
US$
Amou
nt6,0
23.82
10,18
2.10
10,31
2.81
12,02
6.15
10,13
2.24
10,34
9.12
5,220
.777,2
56.58
6,234
.66Ind
ex10
0.00
169.0
317
1.20
199.6
416
8.20
171.8
086
.6712
0.46
103.5
0Na
tiona
l curr
ency
Amou
nt28
2,520
.3357
8,507
.4670
5,151
.521,0
92,28
7.36
1,504
,668.0
91,8
30,15
8.92
2,178
,795.8
73,5
45,81
7.67
3,413
,824.7
0Ind
ex10
0.00
204.7
724
9.59
386.6
253
2.59
647.8
077
1.20
1,255
.071,2
08.35
US$
Amou
nt1,9
27.74
926.5
92,1
60.48
2,549
.212,4
90.40
1,088
.832,7
71.91
1,514
.50Ind
ex10
0.00
48.07
112.0
713
2.24
129.1
956
.4814
3.79
78.56
Natio
nal c
urren
cyAm
ount
2,988
.004,3
92.02
10,71
5.99
14,58
1.50
22,98
6.43
11,91
1.76
44,60
0.00
102,4
86.49
Index
100.0
014
6.99
358.6
348
8.00
769.2
939
8.65
1,492
.643,4
29.94
Serbi
a and
Mon
teneg
ro
Unite
d King
dom
Unite
d Rep
ublic
of
Tanz
ania
Ukra
ine
Egyp
t
Urug
uay
Unite
d Stat
es of
Ame
rica
Vene
zuela
Sour
ce: U
nited
Nati
ons I
ndus
trial D
evelo
pmen
t Org
aniza
tion (
UNID
O) IN
DSTA
T3 20
05 IS
IC R
ev.2.

WP-246-External-En.doc 126
Sectoral working papers 1 Year Reference
The Warp and the Web Organized production and unorganized producers in the informal food-processing industry: Case studies of bakeries, savouries’ establishments and fish processing in the city of Mumbai (Bombay) (Ritu Dewan)
2000 WP.156
Employment and poverty in Sri Lanka: Long-term perspectives (Vali Jamal)
2000 WP.157
Recruitment of educational personnel (Wouter Brandt and Rita Rymenans)
2000 WP.158
L’industrie du textile-habillement au Maroc: Les besoins des chefs d’entreprise et les conditions de travail des femmes dans les PME (Riad Meddeb)
2000 WP.159
L’évolution de la condition des personnels enseignants de l’enseignement supérieur (Thierry Chevaillier)
2000 WP.160
The changing conditions of higher education teaching personnel (Thierry Chevaillier)
2000 WP.161
Working time arrangements in the Australian mining industry: Trends and implications with particular reference to occupational health and safety (Kathryn Heiler, Richard Pickersgill, Chris Briggs)
2000 WP.162
Public participation in forestry in Europe and North America: Report of the Team of Specialists on Participation in Forestry
2000 WP.163
Decentralization and privatization in municipal services: The case of health services (Stephen Bach)
2000 WP.164
Social dialogue in postal services in Asia and the Pacific: Final report of the ILO-UPU Joint Regional Seminar, Bangkok, 23-26 May 2000 (Edited by John Myers)
2000 WP.165
Democratic regulation: A guide to the control of privatized public services through social dialogue (G. Palast, J. Oppenheim, T. McGregor)
2000 WP.166
Worker safety in the shipbreaking industries: An issues paper (Sectoral Activities Department and InFocus Programme on Safety and Health at Work and the Environment)
2001 WP.167
Safety and health in small-scale surface mines – A handbook (Manfred Walle and Norman Jennings)
2001 WP.168
1 Working Papers Nos. 1-155 are not included on this list for reasons of space, but may be requested from the Sectoral Activities Branch (SECTOR), Social Dialogue, Labour Law, Labour Administration and Social Activities Department, Social Dialogue Sector, International Labour Office (ILO).
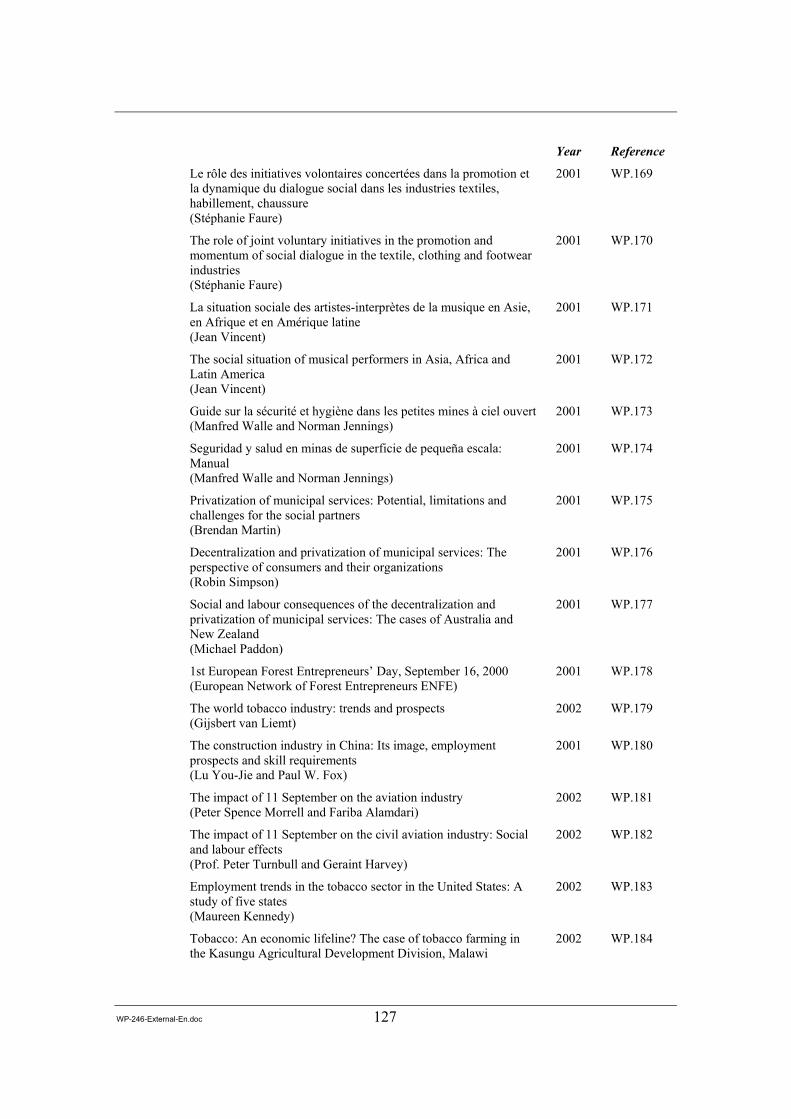
WP-246-External-En.doc 127
Year Reference
Le rôle des initiatives volontaires concertées dans la promotion et la dynamique du dialogue social dans les industries textiles, habillement, chaussure (Stéphanie Faure)
2001 WP.169
The role of joint voluntary initiatives in the promotion and momentum of social dialogue in the textile, clothing and footwear industries (Stéphanie Faure)
2001 WP.170
La situation sociale des artistes-interprètes de la musique en Asie, en Afrique et en Amérique latine (Jean Vincent)
2001 WP.171
The social situation of musical performers in Asia, Africa and Latin America (Jean Vincent)
2001 WP.172
Guide sur la sécurité et hygiène dans les petites mines à ciel ouvert (Manfred Walle and Norman Jennings)
2001 WP.173
Seguridad y salud en minas de superficie de pequeña escala: Manual (Manfred Walle and Norman Jennings)
2001 WP.174
Privatization of municipal services: Potential, limitations and challenges for the social partners (Brendan Martin)
2001 WP.175
Decentralization and privatization of municipal services: The perspective of consumers and their organizations (Robin Simpson)
2001 WP.176
Social and labour consequences of the decentralization and privatization of municipal services: The cases of Australia and New Zealand (Michael Paddon)
2001 WP.177
1st European Forest Entrepreneurs’ Day, September 16, 2000 (European Network of Forest Entrepreneurs ENFE)
2001 WP.178
The world tobacco industry: trends and prospects (Gijsbert van Liemt)
2002 WP.179
The construction industry in China: Its image, employment prospects and skill requirements (Lu You-Jie and Paul W. Fox)
2001 WP.180
The impact of 11 September on the aviation industry (Peter Spence Morrell and Fariba Alamdari)
2002 WP.181
The impact of 11 September on the civil aviation industry: Social and labour effects (Prof. Peter Turnbull and Geraint Harvey)
2002 WP.182
Employment trends in the tobacco sector in the United States: A study of five states (Maureen Kennedy)
2002 WP.183
Tobacco: An economic lifeline? The case of tobacco farming in the Kasungu Agricultural Development Division, Malawi
2002 WP.184

WP-246-External-En.doc 128
Year Reference
(Michael Mwasikakata)
A study of the tobacco sector in selected provinces of Cambodia and China (Yongqing He, Yuko Maeda, Yunling Zhang)
2002 WP.185
Child performers working in the entertainment industry: An analysis of the problems faced (Katherine Sand)
2003 WP.186
Informal labour in the construction industry in Nepal (Kishore K. Jha)
2002 WP.187
The construction labour force in South Africa: A study of informal labour in the Western Cape (Jane English and Georg Mbuthia)
2002 WP.188
Social dialogue in health services – Case studies in Brazil, Canada, Chile, United Kingdom (Jane Lethbridge)
2002 WP.189
Teachers and new ICT in teaching and learning modes of introduction and implementation impact implications for teachers (Chris Duke)
2002 WP.190
Best practice in social dialogue in public service reform: A case study of the Norwegian Agency for Development Co-operation (NORAD) (Torunn Olsen)
2002 WP.191
Best practice in social dialogue in public service emergency services in South Africa (Bobby Mgijima)
2003 WP.192
Case studies in social dialogue in the public emergency services – Argentina (Laura El Halli Obeid and Liliana Beatriz Weisenberg)
2003 WP.193
Employment trends in the tobacco sector: Selected provinces of Bulgaria and Turkey (Roska Ivanovna Petkova and Nurettin Yildirak)
2003 WP.194
How to prevent accidents on small construction sites (Illustrated by Rita Walle)
2003 WP.195
Sectoral trends: A survey (Katherine A. Hagen)
2003 WP.196
The impact of the restructuring of civil aviation on employment and social practices (Bert Essenberg)
2003 WP.197
Raising awareness of forests and forestry. Report of the FAO/ECE/ILO Team of Specialists on Participation in Forestry and the FAO/ECE Forest Communicators Network
2003 WP.198
Teaching and the use of ICT in Hungary (Eva Tót)
2003 WP.199
Violence and stress at work in the postal sector 2003 WP.200

WP-246-External-En.doc 129
Year Reference
(Sabir I. Giga, Helge Hoel and Cary L. Cooper)
Violence and stress at work in the performing arts and in journalism (Sabir I. Giga, Helge Hoel and Cary L. Cooper)
2003 WP.201
Making ends meet: Bidi workers in India today. A study of four states
2003 WP.202
Civil aviation: The worst crisis ever? (Bert Essenberg)
2003 WP.203
Informal labour in the construction industry in Kenya: A case study of Nairobi (Winnie V. Mitullah and Isabella Njeri Wachira)
2003 WP.204
Violence and stress at work in the transport sector (Bert Essenberg)
2003 WP.205
The impact of Severe Acute Respiratory Syndrome (SARS) on health personnel (Christiane Wiskow)
2003 WP.206
How we work and live. Forest workers talk about themselves (Bernt Strehlke)
2003 WP.207
Workplace violence in service industries with implications for the education sector: Issues, solutions and resources (Richard Verdugo and Anamaria Vere)
2003 WP.208
International migration of health workers: Labour and social issues (Stephen Bach)
2003 WP.209
Violence and stress at work in financial services (Sabir I. Giga, Helge Hoel and Cary L. Cooper)
2003 WP.210
Violence and stress in hotels, catering and tourism sector (Helge Hoel and Ståle Einarsen)
2003 WP.211
Employment and human resources in the tourist industry in Asia and the Pacific (Travel Research International, London)
2003 WP.212
Democracy and public-private partnerships (Jerrold Oppenheim and Theo MacGregor)
2003 WP.213
Social dialogue in the public emergency services in a changing environment (Bulgaria) (Pavlina Popova)
2003 WP.214
Training of machine operators for mechanized wood harvesting. A study carried out under the EU-funded ERGOWOOD project (Bernt Strehlke and Kristin Warngren)
2004 WP.215
Social dialogue in public emergency services: A case study in Kenya (Leopold P. Mureithi)
2004 WP.216
Public emergency services: Social dialogue in a changing environment: A study on Japan (Minawa Ebisui)
2004 WP.217

WP-246-External-En.doc 130
Year Reference
Academic tenure and its functional equivalent in post secondary education (Donald C. Savage)
2004 WP.218
Study of the Kerala Construction Labour Welfare Fund (R.P. Nair)
2004 WP.219
The Joint FAO/ECE/ILO Committee: Fifty years of international cooperation in forestry (T.J. Peck and E.G. Richards)
2004 WP.220
La permanence et son équivalent fonctionnel dans l’enseignement postsecondaire (Donald C. Savage)
2004 WP.221
Academic employment structures in higher education: The Argentine case and the academic profession in Latin America (Garcia de Fanelli)
2004 WP.222
An introduction to labour statistics in tourism (Dirk Belau)
2004 WP.223
Labour implications of the textiles and clothing quota phase-out (Hildegunn Kyvik Nordas)
2005 WP.224
Baseline study of labour practices on large construction sites in Tanzania (coordinated by the National Construction Council, Dar es Salaam)
2005 WP.225
Informal construction workers in Dar es Salaam, Tanzania (Arthur Jason)
2005 WP.226
Prospects for micro, small and medium enterprises in the food and drink industries in Guyana (Abdul Rahim Forde)
2005 WP.227
Alimentation et boisson au Burkina Faso: au delà de la survie (Dié Martin Sow)
2005 WP.228
Social dialogue in education in Latin America: A regional survey (Marcela Gajardo and Francisca Gómez)
2005 WP.229
Good industrial relations in the oil industry in the United Kingdom (Dr. Chris Forde, Dr. Rob MacKenzie, Dr. Mark Stuart, Dr. Rob Perrett)
2005 WP.230
The future of civil aviation in Africa: Restructuring and social dialogue (Bert Essenberg)
2005 WP.231
The issues of fatigue and working time in the road transport sector 2005 WP.232
Privatization of energy in the Argentine Republic 2005 WP.233
Social dialogue in the health sector: Case study Ghana (Dr. Delanyo Y. Dovlo)
2005 WP.234
Social dialogue in the health sector: Case study Bulgaria (Dr. L. Tomev, Dr. N. Daskalova, Ms. T. Mihailova)
2005 WP.235
Migration of health workers: Country case study Philippines (Institute of Health and Policy and Development Studies, Manila)
2005 WP.236
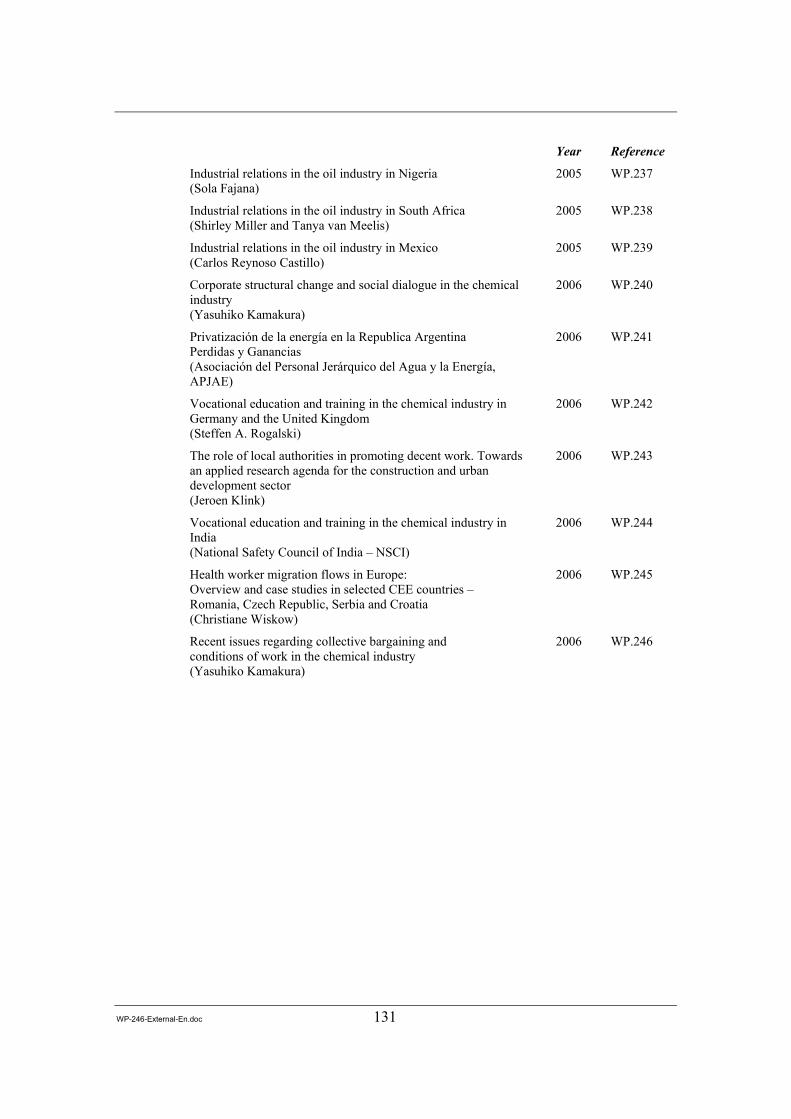
WP-246-External-En.doc 131
Year Reference
Industrial relations in the oil industry in Nigeria (Sola Fajana)
2005 WP.237
Industrial relations in the oil industry in South Africa (Shirley Miller and Tanya van Meelis)
2005 WP.238
Industrial relations in the oil industry in Mexico (Carlos Reynoso Castillo)
2005 WP.239
Corporate structural change and social dialogue in the chemical industry (Yasuhiko Kamakura)
2006 WP.240
Privatización de la energía en la Republica Argentina Perdidas y Ganancias (Asociación del Personal Jerárquico del Agua y la Energía, APJAE)
2006 WP.241
Vocational education and training in the chemical industry in Germany and the United Kingdom (Steffen A. Rogalski)
2006 WP.242
The role of local authorities in promoting decent work. Towards an applied research agenda for the construction and urban development sector (Jeroen Klink)
2006 WP.243
Vocational education and training in the chemical industry in India (National Safety Council of India – NSCI)
2006 WP.244
Health worker migration flows in Europe: Overview and case studies in selected CEE countries – Romania, Czech Republic, Serbia and Croatia (Christiane Wiskow)
2006 WP.245
Recent issues regarding collective bargaining and conditions of work in the chemical industry (Yasuhiko Kamakura)
2006 WP.246
Top Related