


Languages
Pages
Legal


Recent Developments
in CPTEC/INPE Systems
14th Workshop on meteorological operational systems:
From Research to Operational Products
ECMWF – Reading - UK
[email protected] Centro de Previsão de Tempo e Estudos Climáticos – CPTEC
Instituto Nacional de Pesquisas Espaciais - INPE

Outline
A brief (very quick) description of CPTEC
Some Products and Services
Internal Organization
Research and development to Operations Process
Important question:
New developments, products and services... Are they being
effective ?
Work on progress: management based on indicators.
... from “to have” to “how good it is ?”
How are we going ?
Examples of indicators:
Met Data, Models, SMS for control,

The CPTEC/INPE
Center for Weather Forecast and Climate Analysis (CPTEC)
Part of the National Institute for Space Research (INPE)
Center for Research and Operations in Numerical Weather and Climatic Prediction
Began at Cachoeira Paulista in 1994

Some CPTEC´s products:
Weather Forecasts
Seasonal Forecasts
Meteorological Monitoring and warnings
Provide information for Brazilian news networks
Satellite imagery and products
Several Global and Regional Numerical Products
distributed freely

Numerical Models:
• Global Weather Forecast model (COLA/CPTEC)
• Regional models for South America:
• 15 Km to 5 km resolution + Ensemble 40 Km
• Air-Quality Model South America: BRAMS
• Coupled model (Global-MOM4)
• Sea waves model (WWATCH)
• Ocean model (MOM4)
• Global and Regional Ensembles for NWP
• ...

2010: CRAY XT6
1272 nodes, with
30528 cores
Peak: 244 Tflops
Effective: 16,6
Tflops
Disks SATA: 3,84
Petabytes (PB)
System with 8.000
tapes LTO4: 6 PB

AVISO DE TEMPO SEVERO (23/05/2005)
Nos dias 24/05 (terça-feira) e 25/05 (quarta-feira) áreas de instabilidade em altos
e médios níveis da atmosfera em combinação com a chegada de uma frente fria... p
rovocarão chuvas fortes com possibilidade de queda de granizo e acumulados sign
ificativos em algumas localidades dos estados de PR e SP.
AVISO DE TEMPO SEVERO (25/05/2005)
No decorrer do dia de hoje 25/05 (quarta-feira), áreas de instabilidade provocada
s pela passagem de uma frente fria provocarão chuvas fortes com trovoadas, possi
bilidade de queda de granizo e acumulados significativos em algumas localidades
do nordeste e norte do Estado de SP, no RJ (incluindo a capital)...
Chuva estimada por
satélite 25/05/2005
São Paulo –113mm
São José dos Campos –76mm

www.cptec.inpe.br
Página do CPTEC - Média Diária
0
5000
10000
15000
20000
25000
30000
35000
40000
45000
50000
jun
/04
jul/0
4
ag
o/0
4
set/
04
ou
t/0
4
no
v/0
4
de
z/0
4
jan
/05
fev/
05
ma
r/0
5
ab
r/0
5
ma
i/05
Mês/Ano
Nú
m.A
ce
ss
os
Servidor Principal Servidor Tempo Servidor Satélite
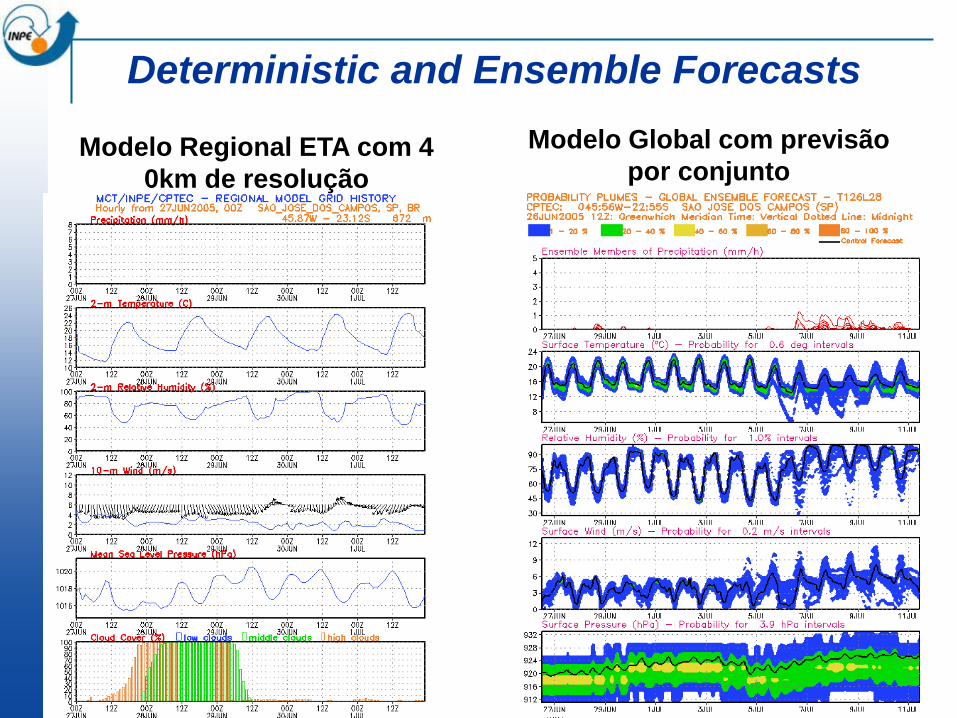
Deterministic and Ensemble Forecasts
Modelo Regional ETA com 4
0km de resolução
Modelo Global com previsão
por conjunto


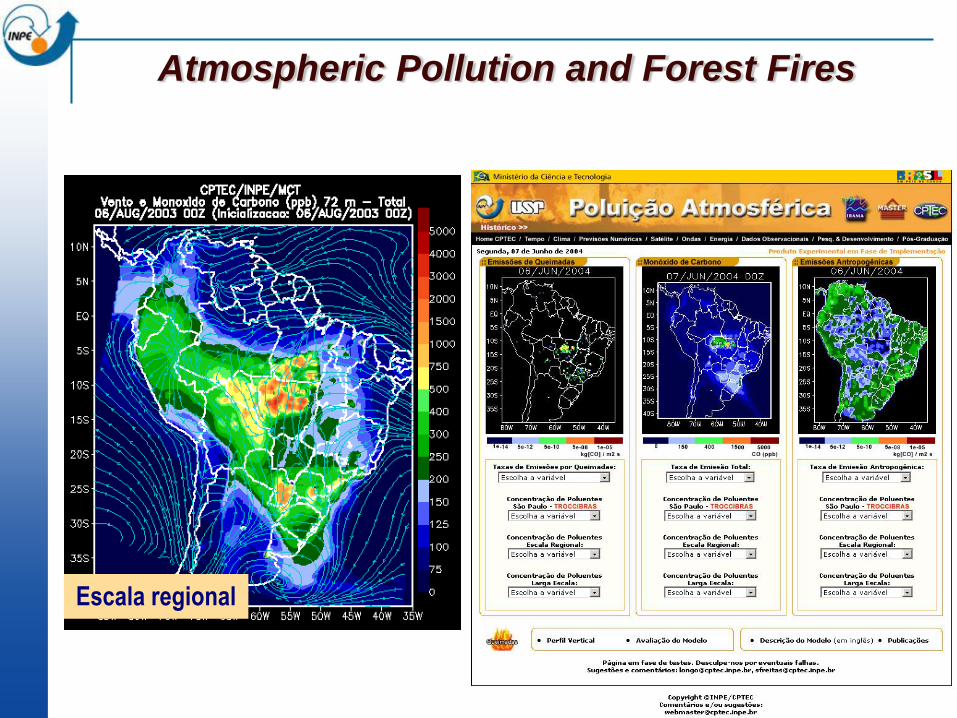
Atmospheric Pollution and Forest Fires
Escala regional


Seasonal Numerical Prediction

Satellite Products...


WMO´s Global Data-Processing and
Forecasting System
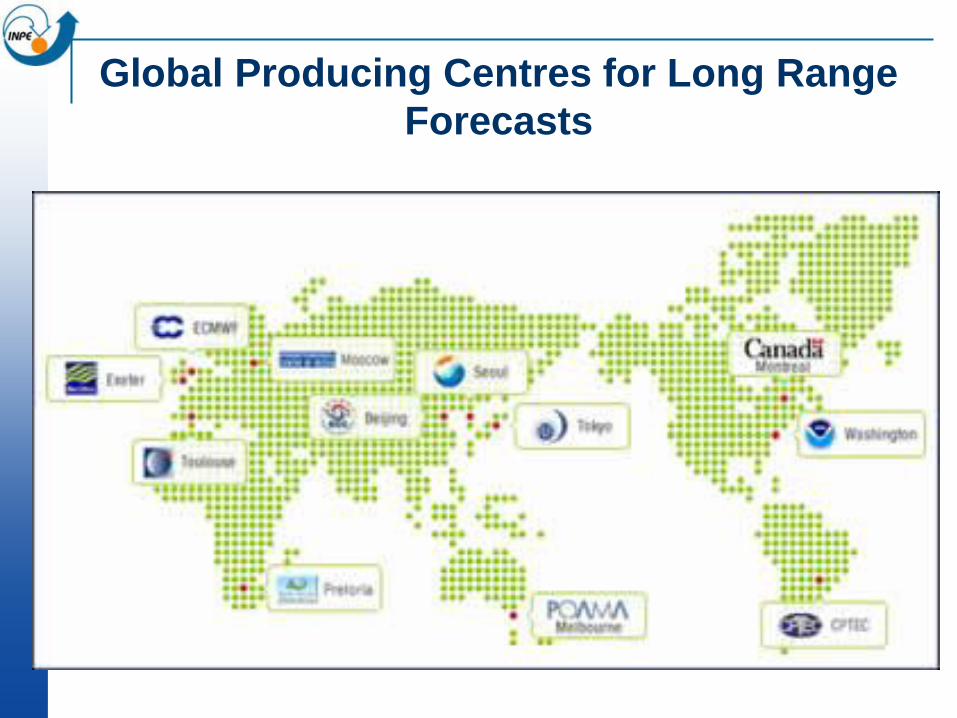
Global Producing Centres for Long Range
Forecasts

TIGGE Archive Centers and Data Providers
IDD/LDM
Internet Data Distribution / Local Data Manager
Commodity internet application to send and receive data
JMA
BoM
Archive Centre
Current Data Provider
NCAR NCEP
CMC
UKMO
ECMWF MeteoFranc
e KMA
CMA
CPTEC
IDD/LDM
HTTP
FTP

CPTEC/INPE at Cachoeira Paulista

Expansion of Facilities
Doubling office area... For January 2014

New Front view... Not finished yet.
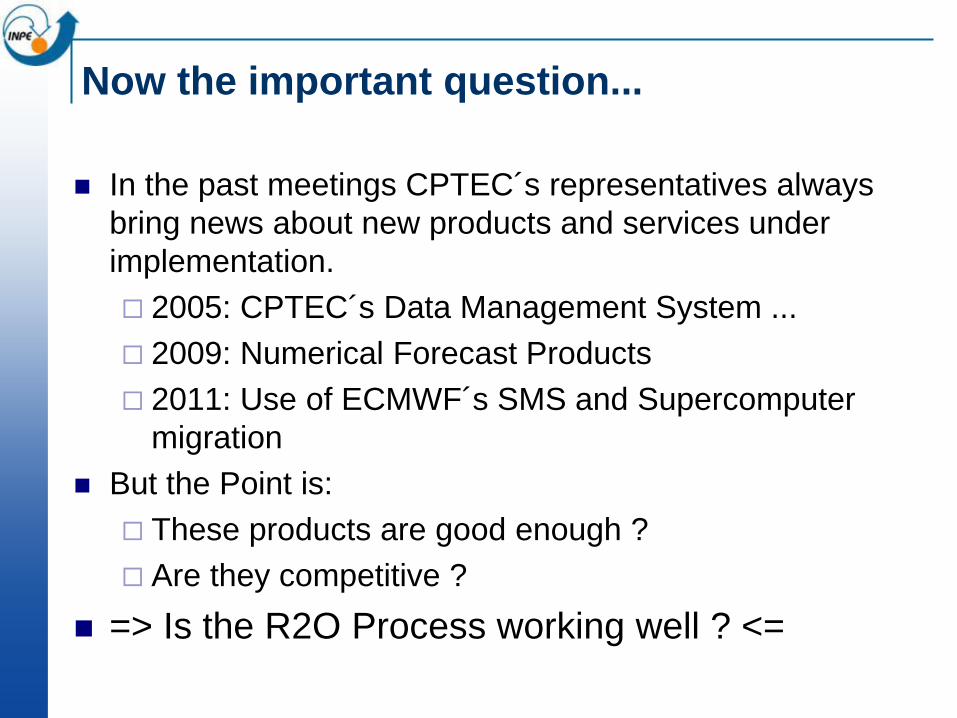
Now the important question...
In the past meetings CPTEC´s representatives always
bring news about new products and services under
implementation.
2005: CPTEC´s Data Management System ...
2009: Numerical Forecast Products
2011: Use of ECMWF´s SMS and Supercomputer
migration
But the Point is:
These products are good enough ?
Are they competitive ?
=> Is the R2O Process working well ? <=

Initiative to improve production and R2O...
Internal Organization (it affects the R2O process...)
How is the R2O process now ?
Can it be changed ?
The Improvement Strategy:
Quantitative performance indicators + External references
Where we are ? - Where we want to go ? - Are we improving
over time ?
It is a cultural change in progress now…
From “to have the products” to “how good are they”
Some indicators on place, some on development
Experience and conclusions ... So far.
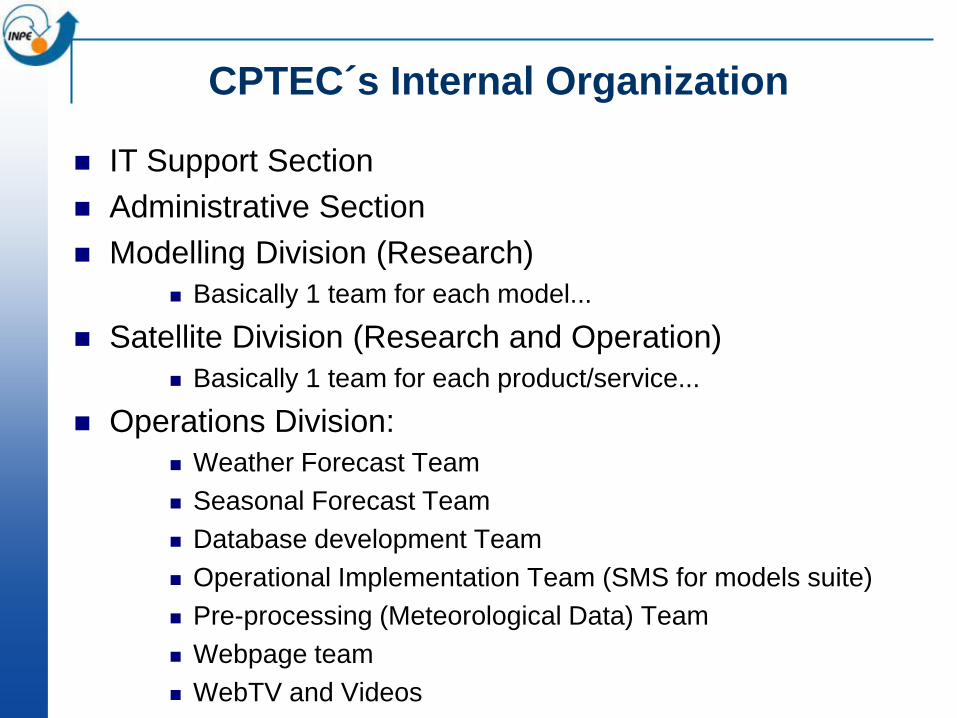
CPTEC´s Internal Organization
IT Support Section
Administrative Section
Modelling Division (Research)
Basically 1 team for each model...
Satellite Division (Research and Operation)
Basically 1 team for each product/service...
Operations Division:
Weather Forecast Team
Seasonal Forecast Team
Database development Team
Operational Implementation Team (SMS for models suite)
Pre-processing (Meteorological Data) Team
Webpage team
WebTV and Videos

Research to Operation Process...
Where we are ? Present status...
Development is made on the 3 divisions:
To bring and install systems and solutions from other centers
To adapt these systems for local needs
To develop local solutions (home-made solutions)
Operational implementation is done at Op. Division, who
develops all scripts and verification processes for
production
Everything is very informal ...
Testing is made by own developers, some times is not
enough...
Problem finding and solving process is very informal,
made “on demand”
No tracking or numbers or time spent ...

It is not the ideal,... Can it be changed ?
Continuous innovation is needed !
Optimization of resources and clear goals are critical for
the success…
=> R2O must be well focused !
>>> In CPTEC structure, R&D people have a lot of
freedom..
A cultural change in the R2O process this affect all the
organization, including: high-ranking researchers and
experienced developers..
It is very difficult to “Break” the culture of R&D people..
Personnel resistance is capital for any major change …
... No resources to create a “QC Team” ...

Creating some movement...
R&D people have a lot of freedom (and resistance to
changes), so they need to be convinced …
Proposal under implementation:
Performance indicators
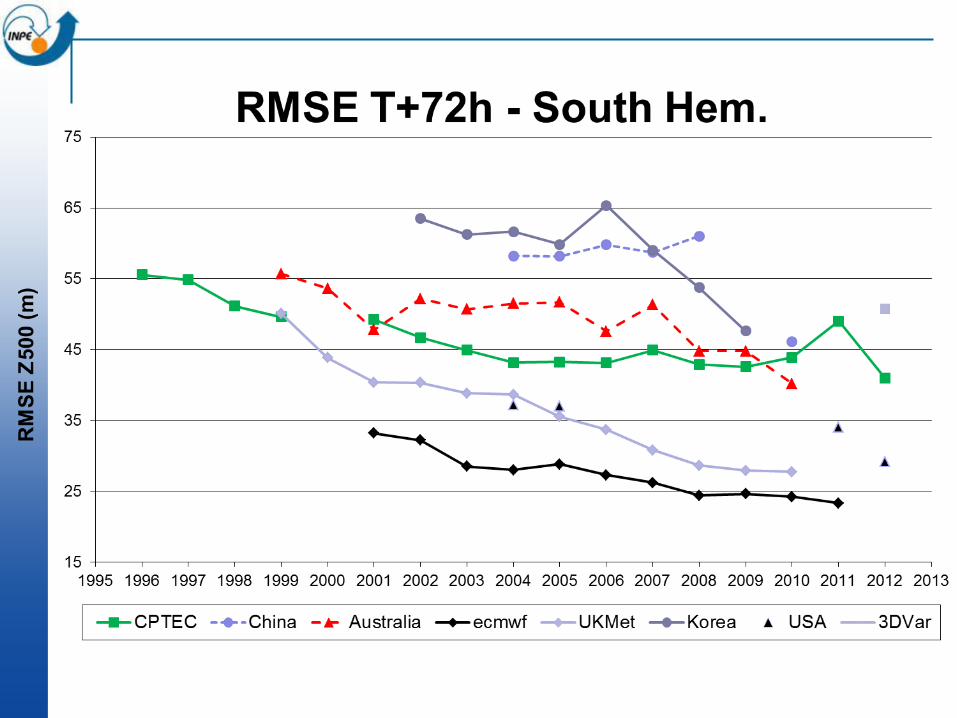
Comparison with external benchmarks
We got some help from TIGGE project participation..
First time that CPTEC´s products were used and compared with
international products…
Slow process… started in 2010. With some MBA training
at INPE
Already created an internal impact…
Researchers are paying more attention to “external benchmarks”
A cultural change is happening..

Theory behind: Technological Capability
Latecomers
Tech
Frontier
Acummulation of Capability

Example of indicator: Met. Data

Examples of indicator: Met. Data II

More indicators and controls under
development
Are the products
available at the right
time ?
Is the performance
improving over the time
?
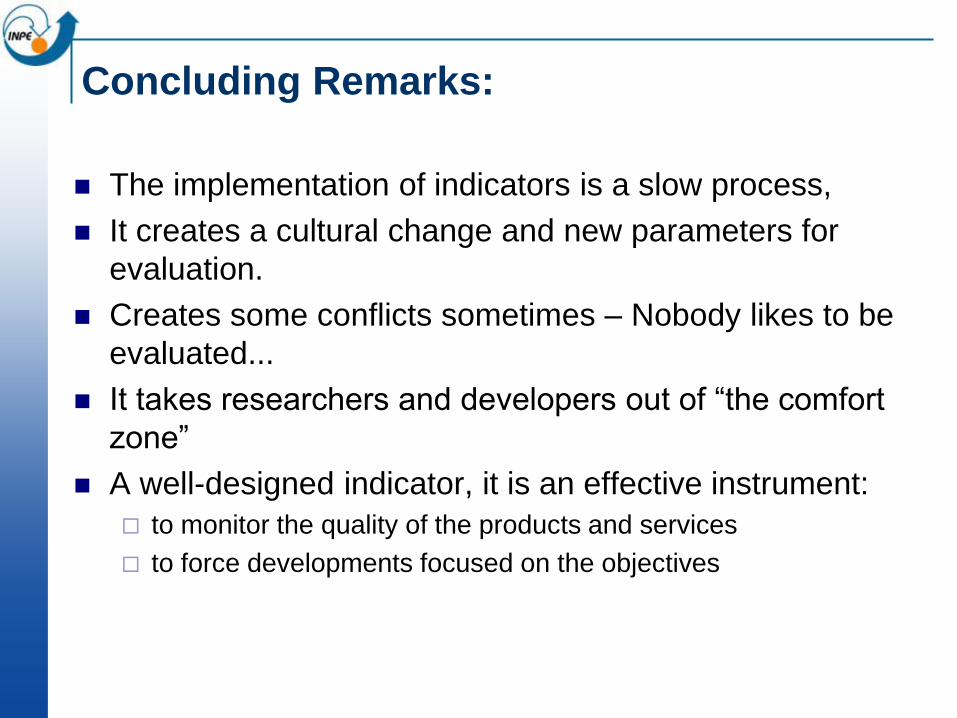
Concluding Remarks:
The implementation of indicators is a slow process,
It creates a cultural change and new parameters for
evaluation.
Creates some conflicts sometimes – Nobody likes to be
evaluated...
It takes researchers and developers out of “the comfort
zone”
A well-designed indicator, it is an effective instrument:
to monitor the quality of the products and services
to force developments focused on the objectives
Top Related