


Languages
Pages
Legal


WIP - Wissenschaftliches Institut für
Presseforschung und Medienberatung GbR
Essener Str. 28, 51145 Köln, Germany Tel. +49 (0)2203-695283
http://presseforschung.de Fax. +49 (0)2203-695238
Readership Survey
2013 - Final Report -

WIP TIPA Survey 2013 p. 3
1. Skeleton Data in the Survey - Method 4 - 11
2. Personal Information on the Readers 12 - 26
3. Photographic Practice 27 - 36
4. Reading Behaviour 38 - 41
5. Attitudes to the Magazines 42 - 52
6. Attitudes to the Magazine-Websites 53 - 54
7. Buying Behaviour and Attention to Advertisements 55 - 60
Contents
WIP TIPA Survey 2013 p. 4
1. Skeleton Data - Preliminary Remark
The intention of the survey was to collect valid data from the whole spectrum
of readers of the TIPA-magazines.
A basic questionnaire was used for the purpose of comparability and to
incorporate the results.
For 20 magazines an online-survey with identical questionnaire was
published on http://presseforschung.de.

WIP TIPA Survey 2013 p. 5
1. Skeleton Data - Synopsis
Coordinated readership survey with self-administered
questionnaires. Parallel online-survey for 20 magazines.
Duration: October 29nd 2012 – February 08th 2013
Participants: 23 magazines from 14 countries
Total returns N = 8 564
Analysed returns: Na = 7 904
Returns by mail: 26.8 %
Returns by fax: 5.5 %
Returns online: 67.7 %
Implementation of the survey - concept, recording, analysis:
WIP Wissenschaftliches Institut für Presseforschung und Medienberatung,
Cologne

WIP TIPA Survey 2013 p. 6
1. Skeleton Data - Method I
Returns
The returns for each magazine were recorded separately.
There was a large degree of fluctuation, with the smallest feedback
consisting of 101 questionnaires and the largest consisting of 1 014. The
analysed returns ranged from 100 to 851.
On average, each magazine achieved a return rate of 344 questionnaires.

WIP TIPA Survey 2013 p. 7
1. Skeleton Data - Method II
Presentation of the Results
The initial focus was always on the overall results which flowed into the results
for all magazines. Where appropriate, WIP also differentiated between the
magazines by region:
• Central Europe Great Britain, France, Netherlands, Germany, Poland
• Southern Europe Spain, Italy, Greece, Hungary
• Northern America
USA, Canada
• Other Countries
South Africa, Australia, China

WIP TIPA Survey 2013 p. 8
1. Skeleton Data -
The Magazines

WIP TIPA Survey 2013 p. 9
1. Skeleton Data - Magazines by Regions
Central Europe 5 Countries
10 Magazines
Southern Europe 4 Countries
8 Magazines PL D GB
F
NL
GR
I E
HU

WIP TIPA Survey 2013 p. 10
1. Skeleton Data - Magazines by Regions
Northern America 2 Countries
2 Magazines
USA
CANADA

WIP TIPA Survey 2013 p. 11
1. Skeleton Data - Magazines by Regions
Other Countries 3 Countries
3 Magazines
China Australia
South Afrika
WIP TIPA Survey 2013 p. 12
2. Personal Information -
Overall Results
Initial comment: In the surveys the readers often left questions unanswered. The results with the
personal information are presented without these missing data and extrapolated to 100%.
• The readers of the TIPA-magazines are predominantly male. Only nearly
every fifth reader is female.
• The average reader is 46.1 years old. On average, the women are clearly
younger than the men (40 to 47 years). 59 percent of the readers are
younger than 50 years of age.
• 48 percent of readers reported a net monthly household income of 2 500
Euros or more. 27 Percent of households have an income of under 1 500
Euros.

WIP TIPA Survey 2013 p. 13
2. Personal Information - Sex
Male 80.8 % Female 19.2 %
Overall

WIP TIPA Survey 2013 p. 14
2. Personal Information –
Readership by Gender in Each Region
Central Europe
Male 83.4 percent
Female 16.6 percent
Southern Europe
Male 77.1 percent
Female 22.9 percent
Northern America
Male 82.5 percent
Female 17.5 percent
Other Countries
Male 81.0 percent
Female 19.0 percent

WIP TIPA Survey 2013 p. 15
2. Personal Information - Average Age
Average Age Overall
Total 46.1 years
Male 47.5 years
Female 39.7 years

WIP TIPA Survey 2013 p. 16
2. Personal Information -
Average Age by Region
Average Age
Central Europe
Total 46.8 years
Male 48.0 years
Female 39.5 years
Average Age
Southern Europe
Total 41.8 years
Male 43.5 years
Female 36.1 years
Average Age
Northern America
Total 57.2 years
Male 58.9 years
Female 50.7 years
Average Age
Other Countries
Total 47.8 years
Male 49.0 years
Female 42.8 years

WIP TIPA Survey 2013 p. 17
2. Personal Information - Age Distribution
59 percent of the readers are younger than 50 years of age

WIP TIPA Survey 2013 p. 18
2. Personal Information -
Age Distribution by Region
Southern
Europe
Northern
America
Other
Countries
Central
Europe

WIP TIPA Survey 2013 p. 19
2. Personal Information - Status
Overall
single 22.7 percent
live with a partner 68.4 percent
have under-age children 23.9 percent
retired 14.1 percent

WIP TIPA Survey 2013 p. 20
2. Personal Information -
Status by Region
Central Europe
single 21.5 %
live with a partner 72.2 %
have under-age children 24.0 %
retired 13.2 %
Southern Europe
single 25.6 %
live with a partner 63.0 %
have under-age children 27.1 %
retired 9.6 %
Northern America
single 17.0 %
live with a partner 70.0 %
have under-age children 12.5 %
retired 33.5 %
Other Countries
single 17.0 %
live with a partner 70.0 %
have under-age children 12.5 %
retired 33.5 %

WIP TIPA Survey 2013 p. 21
Nearly two out of of three readers live in a city
2. Personal Information – city, town?

WIP TIPA Survey 2013 p. 22
Central Europe Southern Europe
Northern America Other Countries
2. Personal Information – city, town?
WIP TIPA Survey 2013 p. 23
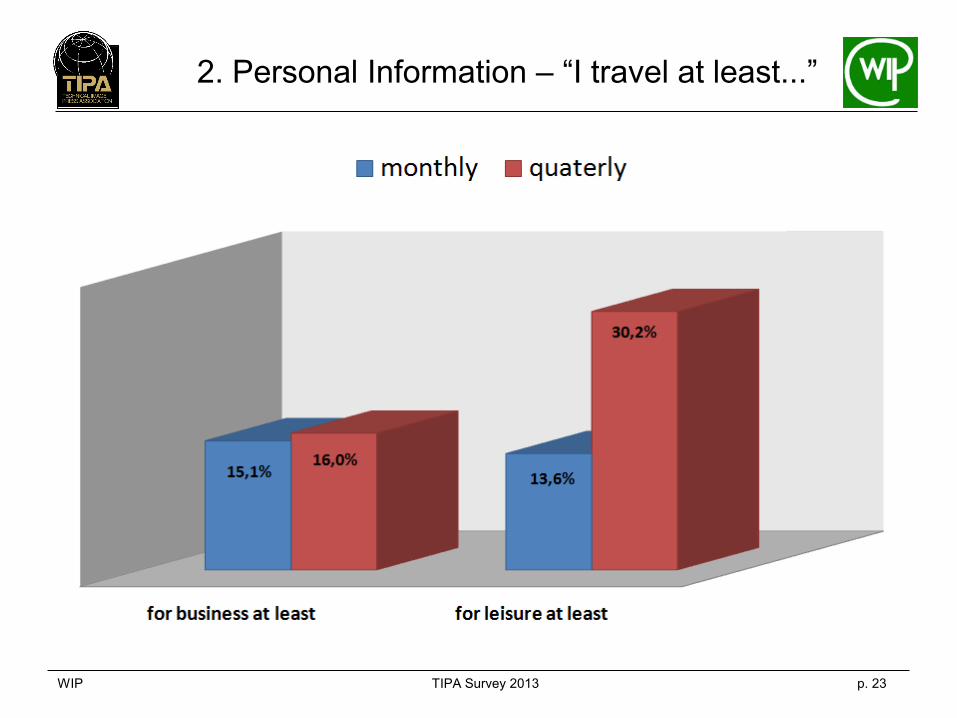
2. Personal Information – “I travel at least...”

WIP TIPA Survey 2013 p. 24
2. Personal Information –
Income Consumers
48 % of the households have an income above 2 500 Euros (n/a: 8.1 %)
Net monthly household income 2013 in Euros

WIP TIPA Survey 2013 p. 25
2. Personal Information -
Income Consumers by Regions I
Central
Europe
(n/a: 5.1%)
Southern
Europe
(n/a: 11.9%)

WIP TIPA Survey 2013 p. 26
2. Personal Information -
Income Consumers by Regions II
Northern
America
(n/a: 11 %)
Other
Countries
(n/a: 3,7%)

WIP TIPA Survey 2013 p. 27
3. Photography Practice:
Overall Results
• 61 per cent of the respondents in the survey take photos privately.
• 64 per cent of the readers generate their pictures often in a RAW file format.
• The average reader takes 879 photographs a month. Around 49 photo-
graphs he prints out himself. Monthly he orders around 54 prints from a
shop.
• Every second reader creates printed photobooks. Each of these readers in
average creates per year 5.3 printed photobooks.
• 30 per cent of the readers often use their personal website to present
photographs. Likewise 29 per cent often use facebook.
• 60 per cent of the readers often use the camera funcition M-mode, every
second reader uses the Av-mode function of his camera.
• Readers of TIPA-magazines are multiplier. 54 per cent regularly advice
others on the purchase of photographic equipment.

WIP TIPA Survey 2013 p. 28
3. Photography Practice: “I take photos...”
The majority of readers take photos privately.
WIP TIPA Survey 2013 p. 29
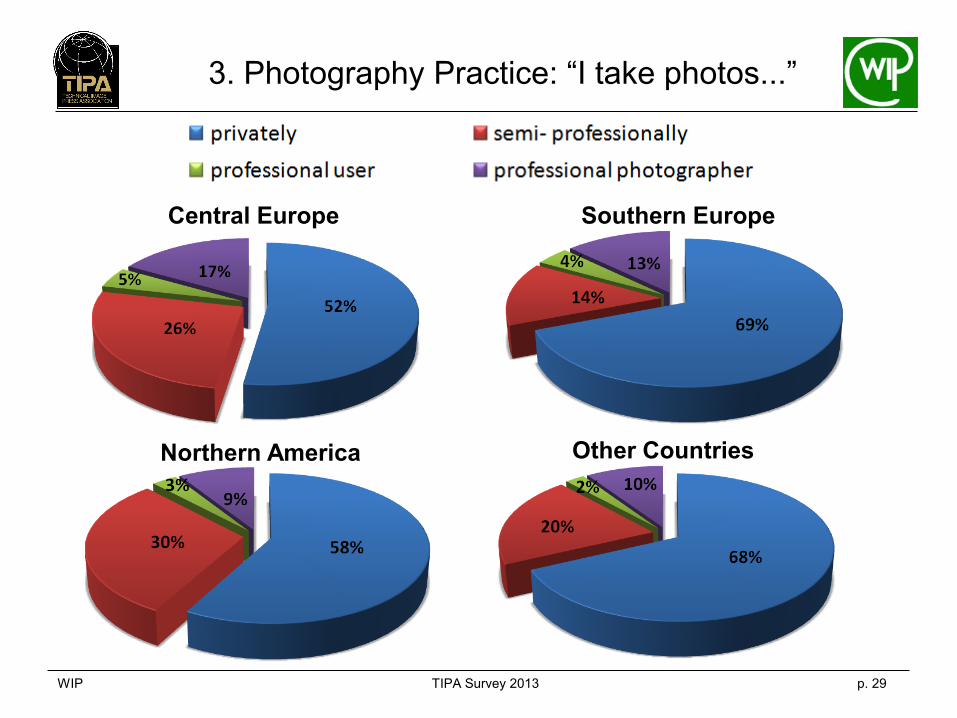
3. Photography Practice: “I take photos...”
Central Europe Southern Europe
Northern America Other Countries

WIP TIPA Survey 2013 p. 30
3. Photography Practice:
“My photos are generated in ...”
Note: More than one answer was possible

WIP TIPA Survey 2013 p. 31
3. Photography Practice:
“My photos are generated ...”
Note: More than one answer was possible
WIP TIPA Survey 2013 p. 32
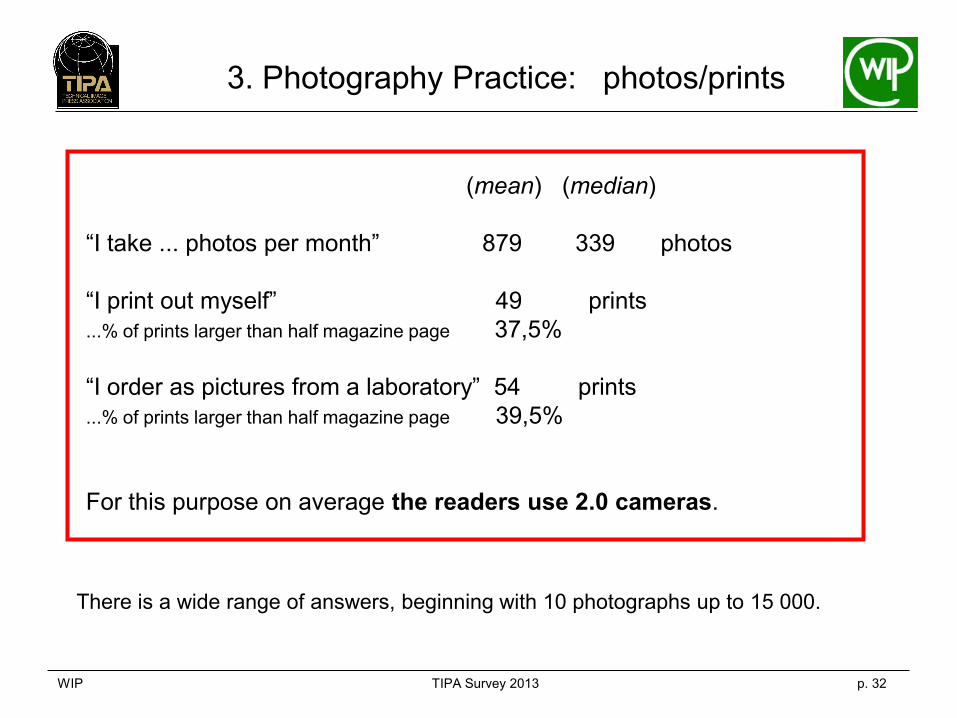
3. Photography Practice: photos/prints
(mean) (median)
“I take ... photos per month” 879 339 photos
“I print out myself” 49 prints
...% of prints larger than half magazine page 37,5%
“I order as pictures from a laboratory” 54 prints
...% of prints larger than half magazine page 39,5%
For this purpose on average the readers use 2.0 cameras.
There is a wide range of answers, beginning with 10 photographs up to 15 000.

WIP TIPA Survey 2013 p. 33
3. Photography Practice:
“Per year I create ... printed photo-books”
„Yes!“
Mean / Base: persons who create one or more photo-books
books
per
year

WIP TIPA Survey 2013 p. 34
3. Photography Practice:
“To present my photographs, I use...”
Note: More than one answer was possible

WIP TIPA Survey 2013 p. 35
3. Photography Practice:
“I use the following camera functions”
Note: More than one answer was possible
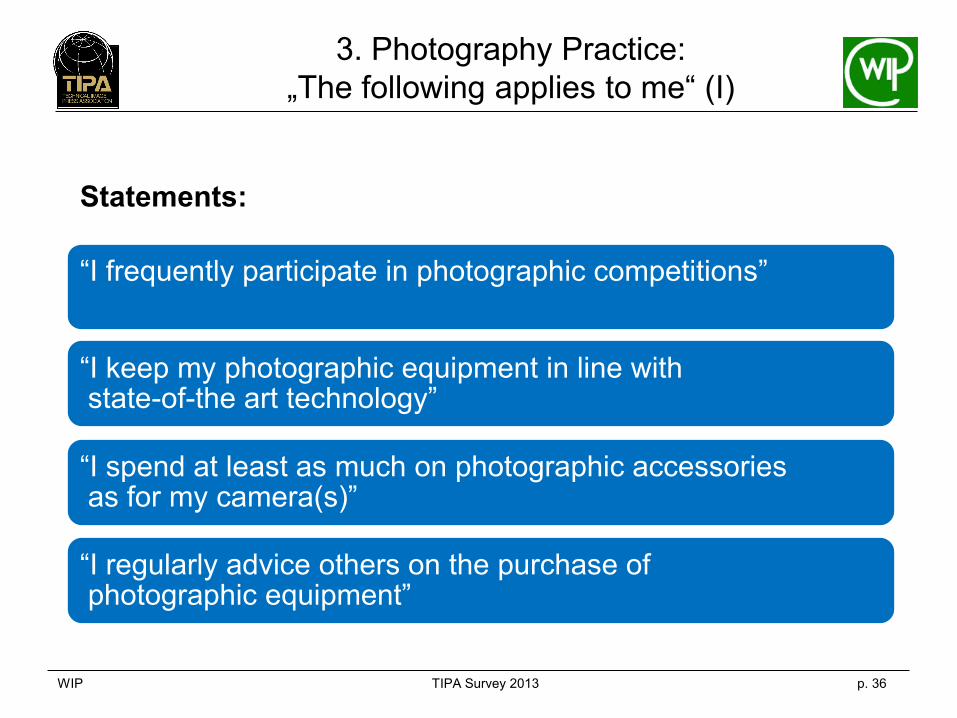
WIP TIPA Survey 2013 p. 36
3. Photography Practice:
„The following applies to me“ (I)
Statements:
“I frequently participate in photographic competitions”
“I keep my photographic equipment in line with state-of-the art technology”
“I spend at least as much on photographic accessories as for my camera(s)”
“I regularly advice others on the purchase of photographic equipment”

WIP TIPA Survey 2013 p. 37
3. Photography Practice:
“The following applies to me” (II)
Readers as multipliers

WIP TIPA Survey 2013 p. 38
4. Reading Behaviour -
Overall Results
• 42.3 per cent of the respondents in the survey were subscribers,
41.4 per cent were single copy buyers.
• The readers pick up their photo magazine an average of 6.2 times and
read it for a total of 84 minutes. (Due to the difference in periodic variation, no distinctions were made by region.)
• Overall, all TIPA titles show an average probability of 84.3 per cent
page exposure. This means that advertising customers can be fairly
certain that their own advertisements will not be skipped over.
• The majority of readers take every issue. Referred to all titles, every
single issue on a statistical average reaches almost 60.3 per cent of
the readers from the maximum readership.
• On average, every copy of a magazine is read by 2.4 people.

WIP TIPA Survey 2013 p. 39
4. Reading Behaviour:
Magazine Purchases

WIP TIPA Survey 2013 p. 40
4. Reading Behaviour:
“Of any one issue I normally read...”
Probability of page exposure: 84.3 % (70 % - 94 %)

WIP TIPA Survey 2013 p. 41
4. Reading Behaviour:
• Minimum mean: 43 min.
• Maximum mean: 127 min.
Reading time: 84.0 minutes
• Minimum mean: 3.0
• Maximum mean: 8.3
Frequency of utilisation per copy: 6.2
• Minimum mean: 1.6
• Maximum mean: 5.7 Readers per copy: 2.4
• First time reader: 8,8 % Readers of any issue:
60.3 %

WIP TIPA Survey 2013 p. 42
5. Attitudes to the Magazines:
Overall Results
• Overall, the TIPA readers have a positive opinion of their photo magazine.
Every second respondent agrees with all provided statements.
• 94 per cent of the readers classify their magazine as an “important
magazine”, another 94 per cent as “reliable and competent”.
• Seen objectively, photo magazines are the most important sources of
information for the readers. Fully 94 per cent of respondents say they
regularly obtain information from this source.
• 55.5 per cent of respondents say they rely on photo magazines the most. A
further 10 per cent did not give any details on the source they trust the
most.

WIP TIPA Survey 2013 p. 43
5. Attitudes to the Magazines: ratings
reliable and competent 93.9 %
important magazine 93.6 %
inspiring magazine 85.1 %
tips for buying cameras 84.1 %
high level of practical use 83.9 %
I would miss it 82.1 %
makes market transparent 69.7 %
tips for selecting accessories 47.7 %
I rate the magazine as follows: (completely true / true)
WIP TIPA Survey 2013 p. 44
5. Attitudes to the Magazines:
information sources
• After photo magazines, the internet is the second most important source of
information, being used by 89.8 per cent of readers.
• The readers’ specialist retailer and trade fairs follow.
• Only every fifth reader uses multi-topic magazines or computer magazines
to obtain information about photographic equipment.

WIP TIPA Survey 2013 p. 45
5. Attitudes to the Magazines:
Information sources by region
“I regularly obtain information...”
(in %) Total Europe
Central Southern
photo magazines 94.0 96.0 89.5
internet 89.8 93.0 87.1
my specialist retailer 25.5 25.5 22.9
trade fairs 24.8 27.6 21.9
multi-topic magazines 22.8 17.9 27.4
company brochures 22.6 23.6 21.9
computer magazines 21.0 19.9 19.3

WIP TIPA Survey 2013 p. 46
5. Attitudes to the Magazines:
Information sources by region
“I regularly obtain information...”
(in %) Total Northern Other
America Countries
photo magazines 94.0 98.5 96.7
internet 89.8 90.0 86.3
my specialist retailer 25.5 35.0 26.1
trade fairs 24.8 20.0 26.0
multi-topic magazines 22.8 23.0 27.2
company brochures 22.6 24.5 19.9
computer magazines 21.0 27.0 25.3

WIP TIPA Survey 2013 p. 47
5. Attitudes to the Magazines:
“I trust most in ...”
• The readers rely mostly on the photo magazines. 55.5 per cent of
respondents said they trust in this source of information the most.
• The internet, very important as a source of information, enjoys a high level
of confidence for 22 per cent of readers. The dealers follow in third place
with 6 per cent of responses.
• 10 per cent of readers did not give an unambiguous answer.
• The ratings of credibility for computer magazines or multi-topic magazines
are very poor (<2 %).

WIP TIPA Survey 2013 p. 48
5. Attitudes to the Magazines:
“I trust most in ...”

WIP TIPA Survey 2013 p. 49
5. Attitudes to the Magazines:
“I trust most in ...” (in %) Total Europe
Central Southern
photo magazines 55.5 58.7 47.1
internet 22.0 23.1 23.7
my specialist dealer 6.1 6.4 5.4
trade fairs 2.5 2.6 2.7
computer magazines 1.8 1.4 2.5
multi-topic magazines 1.6 1.2 2.6
company brochures 1.1 1.3 1.0
n/a 9.5 5.4 15.0

WIP TIPA Survey 2013 p. 50
5. Attitudes to the Magazines:
“I trust most in ...” (in %) Total Northern Other
America Countries
photo magazines 55.5 60.0 54.1
internet 22.0 20.1 15.3
my specialist dealer 6.1 9.3 5.3
trade fairs 2.5 2.5 1.3
computer magazines 1.8 1.9 1.0
multi-topic magazines 1.6 1.0 1.0
company brochures 1.1 1.0 1.0
n/a 9.5 4.4 11.0

WIP TIPA Survey 2013 p. 51
5. Attitudes to the Magazines:
“An epaper version...”
* ... with special features at extra charge

WIP TIPA Survey 2013 p. 52
5. Attitudes to the Magazines:
“An epaper version...” applies fully / applies
Central
Europe Southern
Europe
Northern
America Other
Countries

WIP TIPA Survey 2013 p. 53
6. Attitudes to the Magazine websites:
overall results
• 20 of 23 magazines put questions for their own websites. The following
results refer to them.
• Four out of five readers have already visited the Website of their photo
magazine or use it regularly.
• 50 per cent visit the Website of their magazine at least once a month.
• The Websites of the photo magazines are primarily used
- to keep up-to-date in matters concerning photography
- to look up test reports and photos of tested products
- to find out about dates: events, exhibitions, competitions

WIP TIPA Survey 2013 p. 54
6. Attitudes to the Magazine websites:
reasons for use - all readers
“I visit the magazine-website...”
(several times a month / once a month, all readers):
to keep up-to-date in matters concerning photography 47.9 %
to look up test reports and photos of tested products 42.0 %
to find out about dates (events, exhibitions, etc.) 34.1 %
to use other services (glossary, archive, gallery etc.) 26.2 %
to read the classified ads [only sites with ads] 20.1 %
to exchange views in the forum [only sites with forum] 12.5 %
to buy something in the shop [only sites with shop] 9.2 %
Note: More than one answer was possible

WIP TIPA Survey 2013 p. 55
7. Buying Behaviour and Attention to
Advertisements: Overall Results
• Interchangeable lenses are in future the readers' top priority in purchasing
intentions, followed by accessories.
Digital SLR cameras follow in third place, photo/graphics software in
fourth place.
• 79 per cent of the TIPA readers say that they always or often read
advertisements.
• Nearly four out of five readers also find that advertisements have
informational value.
• More than every second reader (55.2 %) was prompted by an
advertisement into buying a photography-related article.

WIP TIPA Survey 2013 p. 56
7. Buying Behaviour:
“I intend to buy...”
Interchangeable lenses
66.4 %
Accessories
59.1 %
Digital SLR photo camera
48.6 %
Photo/graphics software
32 %
Studio lighting
22.9 %
Tripod
20.6 %
Photo printer
15.9 %
Digital Compact-System camera
10.8 %
Digital compact camera 9.7 %
Scanner
8.2 %
Color Management
System 8.1 %
Projector
4.9 %
Digital Medium Format System
4.3 %

WIP TIPA Survey 2013 p. 57
7. Attention to Advertisements:
• 26 per cent of the TIPA readers say they “always” read advertisements, a
further 53 per cent say they “often” do so.
• Nearly every second reader agrees (“applies”) with the statement that
advertisements have informational value. A further 30 per cent confirm this
with “applies fully”.
• 69 per cent of the TIPA-readers agree that advertisements in the
magazines “have previously prompted me to gather further information”.
• Nevertheless, some 55 per cent were prompted by an advertisement into
buying a photography-related article.

WIP TIPA Survey 2013 p. 58
7. Attention to Advertisements:
„I read the advertisements... “
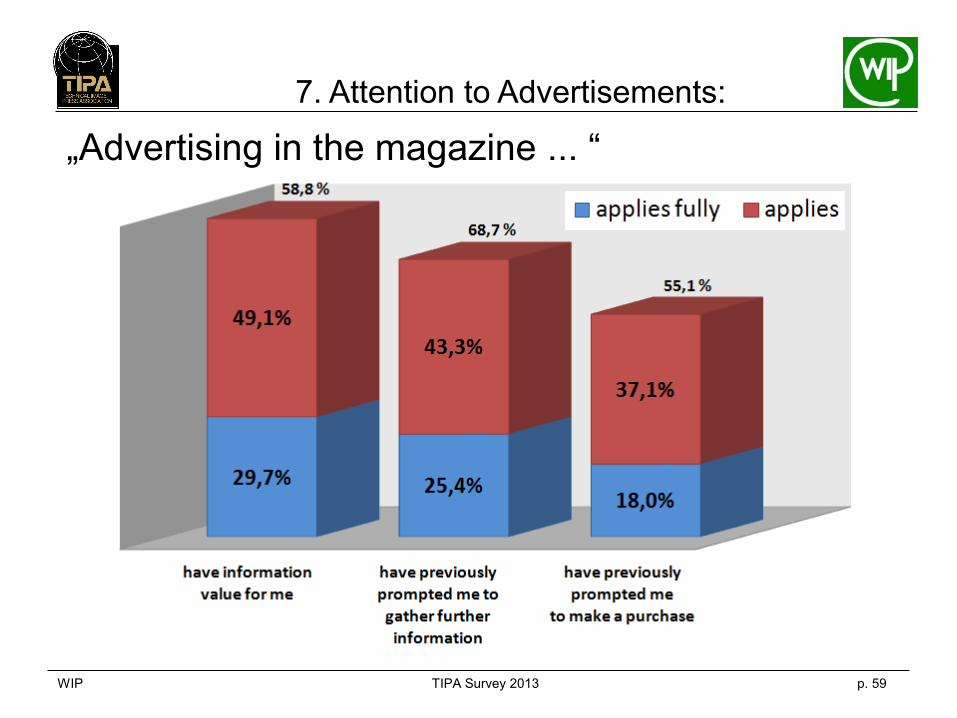
WIP TIPA Survey 2013 p. 59
7. Attention to Advertisements:
„Advertising in the magazine ... “
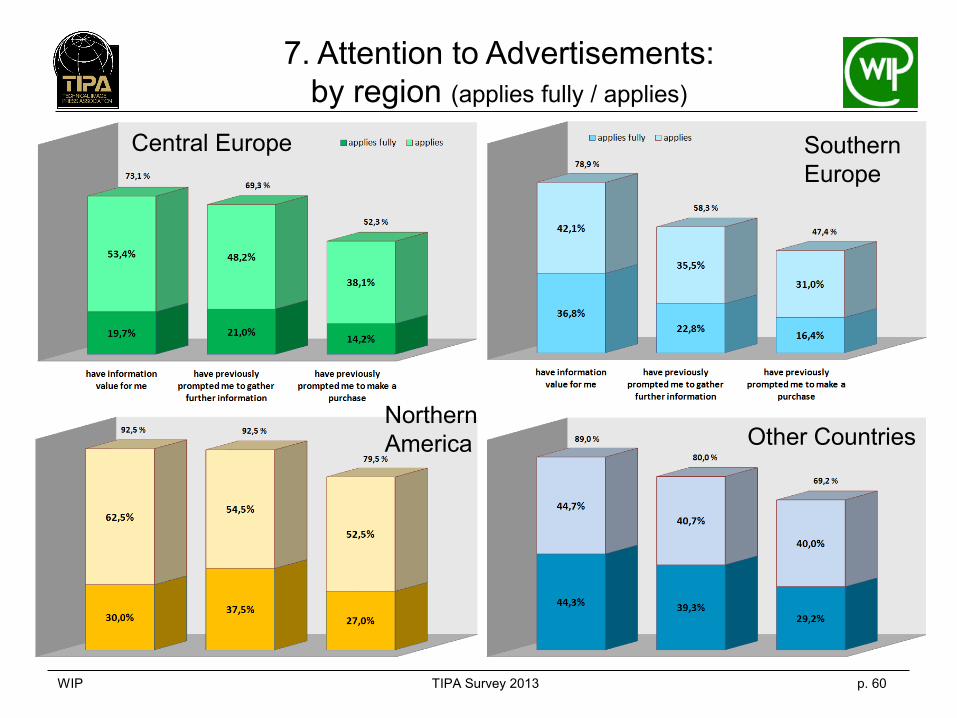
WIP TIPA Survey 2013 p. 60
Central Europe Southern
Europe
Northern
America Other Countries
7. Attention to Advertisements:
by region (applies fully / applies)

WIP TIPA Survey 2013 p. 61
Cologne, 11 April 2013
Wissenschaftliches Institut für Presseforschung
und Medienberatung
Dr. Margit Dorn
Prof. Dr. habil. Andreas Vogel
Tel. +49 (0) 2203-695283
Fax +49 (0) 2203-695238
Top Related