


Languages
Pages
Legal


Copyright © 2017 The Nielsen Company
RADIO (RE)DISCOVEREDA BRAND MANAGER’S GUIDE TO RADIO FOR USE BY NIELSEN CLIENTS ONLY
2Copyright © 2017 The Nielsen Company
WELCOMELet’s give credit where it’s due. Radio is remarkably resilient. When Nielsen added Audio to the media it measures, radio’s reach surpassed all other media, surprising a few people in the process. Despite the countless media and entertainment options available today, AM/FM radio continues to be the top weekly reach medium. No kidding.
Marketers and brand managers are rediscovering radio. It’s a mass medium that can deliver targetability and message frequency.
Radio listeners tune in when and where it counts. Listening in the car is a strength of AM/FM radio, and it gives advertisers the opportunity to deliver their messages just before the point of purchase. In addition, radio ads boost memorability for the same TV advertising and are deemed more trustworthy than online ads.
Radio is connected to the community. Hispanic and African-Americans are radio fans who consistently listen to more AM/FM radio than other demographics. This tendency provides savvy marketers an effective avenue to reach these important consumers.
Broadcast radio also provides advertisers with effective digital opportunities to complement and extend its large over-the-air audience. AM/FM streaming audio, HD radio, NextRadio, and radio’s social media sites provide advertisers with new ways to connect to the passionate radio audience. Radio data is now feeding seamlessly into programmatic solutions and the Nielsen Marketing Cloud.
Accountability is more than a buzzword. Advertisers increasingly insist on it and radio delivers. Nielsen provides independent measurement, and our audio data is now powering high-caliber analytics in a variety of new ways such as marketing mix modeling, return on ad spend, and cross-media incremental reach. Tools that go way beyond traditional audience metrics are helping advertisers do more than just quantify their CPMs. New capabilities enable a much deeper understanding of HOW and WHY radio advertising works.
We hope that this Brand Manager’s Guide to Radio helps you re-discover audio’s powerful reach and unique connection to consumers in the communities where they live, shop and buy.
BRAD KELLY,MANAGING DIRECTORNIELSEN AUDIO
3Copyright © 2017 The Nielsen Company
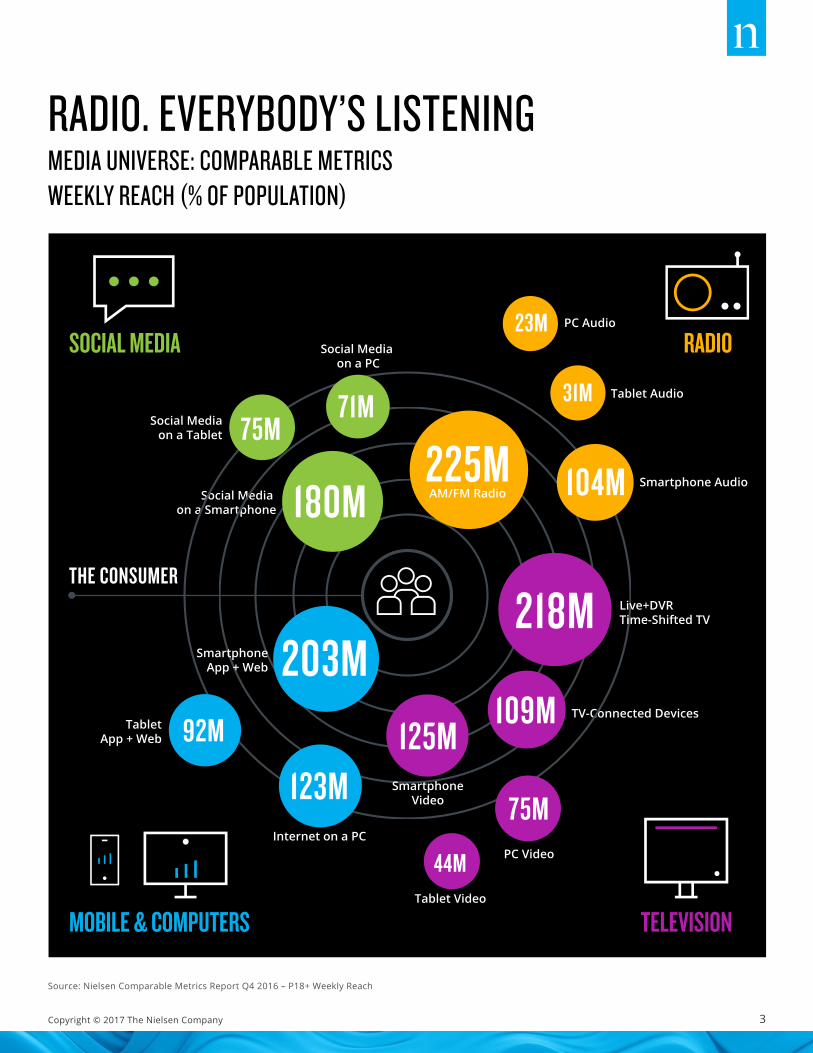
RADIO. EVERYBODY’S LISTENINGMEDIA UNIVERSE: COMPARABLE METRICS WEEKLY REACH (% OF POPULATION)
Source: Nielsen Comparable Metrics Report Q4 2016 – P18+ Weekly Reach
Social Media on a PC
Social Media on a Smartphone
Social Mediaon a Tablet
PC Audio
Tablet Audio
Smartphone Audio
PC Video
RADIO
TELEVISIONMOBILE & COMPUTERS
SOCIAL MEDIA
TV-Connected Devices
THE CONSUMER
225MAM/FM Radio
23M
31M
104M
Live+DVRTime-Shifted TV218M
SmartphoneVideo
125M109M
75M
Tablet Video
44MInternet on a PC
123M
TabletApp + Web 92M
SmartphoneApp + Web 203M
180M
71M75M

4Copyright © 2017 The Nielsen Company
RADIO IS THE TOP REACH MEDIUMWEEKLY REACH (% OF POPULATION)
Source: Nielsen Comparable Metrics Report Q4 2016 / TV Connected Devices = DVD, Game Console, Mulitmedia Device, VCR
When advertisers think of reach, TV and Internet are usually top of mind but Nielsen’s data shows that Radio has the greatest reach of all electronic media. This chart from the Comparable Metrics Report shows that 93% of adults 18+ listen to radio each week, followed by TV at 89% and Smartphone at 83%. When advertisers want to cast a wide net with their message, radio should be an essential part of the media mix.
TV
93%
95%92%
92%RADIO
TV-CONNECTEDDEVICES
PC
MOBILE
89%
91%94%
79%
TABLET
Adults 18+ P18-34 P35-49 P50+
83%
96%70%
91%
50%
59%49%
44%
44%
54%33%
54%
37%
57%28%
35%
5Copyright © 2017 The Nielsen Company
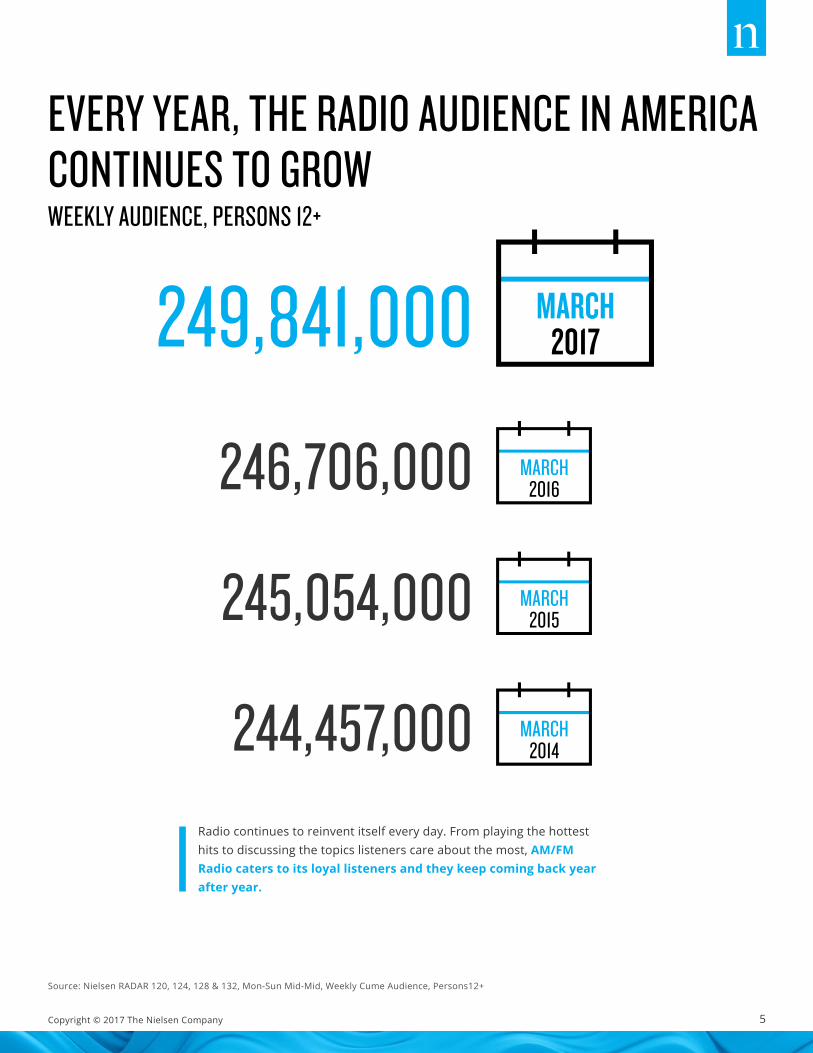
EVERY YEAR, THE RADIO AUDIENCE IN AMERICA CONTINUES TO GROWWEEKLY AUDIENCE, PERSONS 12+
Radio continues to reinvent itself every day. From playing the hottest hits to discussing the topics listeners care about the most, AM/FM Radio caters to its loyal listeners and they keep coming back year after year.
Source: Nielsen RADAR 120, 124, 128 & 132, Mon-Sun Mid-Mid, Weekly Cume Audience, Persons12+
249,841,000 MARCH2017
246,706,000 MARCH2016
245,054,000 MARCH2015
244,457,000 MARCH2014

6Copyright © 2017 The Nielsen Company
RADIO ADS ARE MORE TRUSTED THAN ONLINE ADSPERCENT OF PEOPLE THAT TRUST SOMEWHAT OR COMPLETELY
Source: Nielsen Global Trust In Advertising Report (Sept 2015) North American responses only – online survey
Broadcast Media has developed a relationship with their audience over the years. Digital Media does not have the same personal connection among consumers. This is just one more example of why radio advertising is so effective.
82%RECOMMENDATIONS FROM PEOPLE I KNOW
CONSUMER OPINIONS POSTED ONLINE
ADS IN NEWSPAPERS
ADS ON TV
ADS ON THE RADIO
BILLBOARDS/OUTDOOR
ADS SERVED IN SERACH ENGINE RESULT
ONLINE VIDEO ADS
ADS ON SOCIAL NETWORKS
ONLINE BANNER ADS
ADS ON MOBILE DEVICES
66%
65%
63%
60%
57%
49%
47%
42%
41%
39%

7Copyright © 2017 The Nielsen Company
PEOPLE ACT WHEN THEY HEAR RADIO ADSTIMELY ADS DRAW EVEN GREATER RESPONSE
A National Cable Network wanted to boost viewership of a primetime sporting event so they turned to Radio in a few key markets. The radio campaign was tracked with a single-source panel (PPM) to see which ads drove the most tune in. On average, 27% of the people who were exposed to the radio ads tuned in to watch the game that evening. However, the ads that ran 90 minutes or less before the game saw the highest conversion rate. 53% of the people who were exposed to radio ads during the 7-8:30PM daypart watched the game. This study shows that spots airing within 90 minutes of a program are TWICE as likely to get people to tune in. This is also know as the “Recency Effect” underscoring Radio’s ability to influence an audience just before they make a decision or take action.
Source: Nielsen RADAR 120, 124, 128 & 132, Mon-Sun Mid-Mid, Weekly Cume Audience, Persons12+
AMONG THOSE HEARING THE AD WITHIN 90 MINUTES OF GAME TIME, TUNE-IN GREW FROM AN AVERAGE OF
27% TO 53%
Percentage of men hearing any radio ad that tuned into the game.
Percentage of men hearing the radio ad within 90 minutes of game time that tuned to the game.
GAME A GAME DGAME B GAME C
26%18%
32%
45%
31%
46%
60% 60%
MEN 25-54 WHO TUNED INTO SPECIFIC SPORTING EVENT GAMES ON TELEVISION
8Copyright © 2017 The Nielsen Company
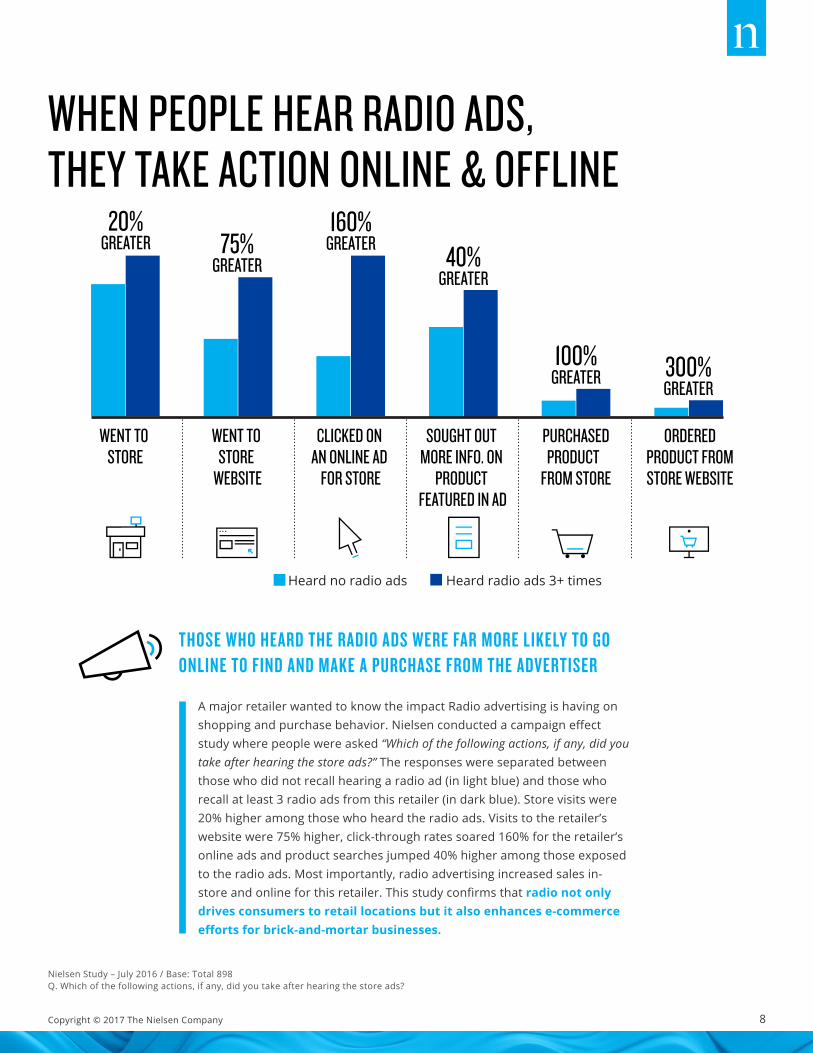
WHEN PEOPLE HEAR RADIO ADS, THEY TAKE ACTION ONLINE & OFFLINE
Nielsen Study – July 2016 / Base: Total 898Q. Which of the following actions, if any, did you take after hearing the store ads?
A major retailer wanted to know the impact Radio advertising is having on shopping and purchase behavior. Nielsen conducted a campaign effect study where people were asked “Which of the following actions, if any, did you take after hearing the store ads?” The responses were separated between those who did not recall hearing a radio ad (in light blue) and those who recall at least 3 radio ads from this retailer (in dark blue). Store visits were 20% higher among those who heard the radio ads. Visits to the retailer’s website were 75% higher, click-through rates soared 160% for the retailer’s online ads and product searches jumped 40% higher among those exposed to the radio ads. Most importantly, radio advertising increased sales in-store and online for this retailer. This study confirms that radio not only drives consumers to retail locations but it also enhances e-commerce efforts for brick-and-mortar businesses.
THOSE WHO HEARD THE RADIO ADS WERE FAR MORE LIKELY TO GO ONLINE TO FIND AND MAKE A PURCHASE FROM THE ADVERTISER
20%GREATER 75%
GREATER
160%GREATER 40%
GREATER
100%GREATER 300%
GREATER
WENT TO STORE
WEBSITE
WENT TO STORE
CLICKED ON AN ONLINE AD
FOR STORE
SOUGHT OUT MORE INFO. ON
PRODUCT FEATURED IN AD
PURCHASEDPRODUCT
FROM STORE
ORDEREDPRODUCT FROMSTORE WEBSITE
Heard no radio ads Heard radio ads 3+ times
9Copyright © 2017 The Nielsen Company
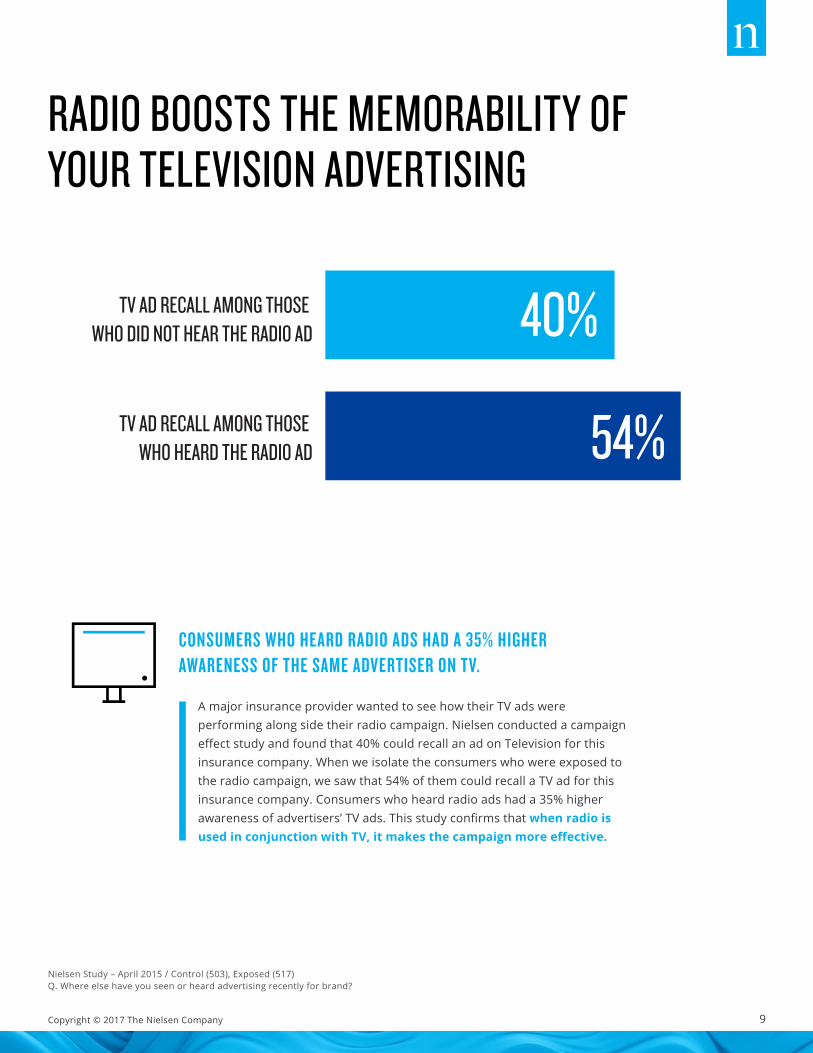
RADIO BOOSTS THE MEMORABILITY OF YOUR TELEVISION ADVERTISING
A major insurance provider wanted to see how their TV ads were performing along side their radio campaign. Nielsen conducted a campaign effect study and found that 40% could recall an ad on Television for this insurance company. When we isolate the consumers who were exposed to the radio campaign, we saw that 54% of them could recall a TV ad for this insurance company. Consumers who heard radio ads had a 35% higher awareness of advertisers’ TV ads. This study confirms that when radio is used in conjunction with TV, it makes the campaign more effective.
Nielsen Study – April 2015 / Control (503), Exposed (517)Q. Where else have you seen or heard advertising recently for brand?
CONSUMERS WHO HEARD RADIO ADS HAD A 35% HIGHER AWARENESS OF THE SAME ADVERTISER ON TV.
54%
40%TV AD RECALL AMONG THOSE WHO DID NOT HEAR THE RADIO AD
TV AD RECALL AMONG THOSE WHO HEARD THE RADIO AD
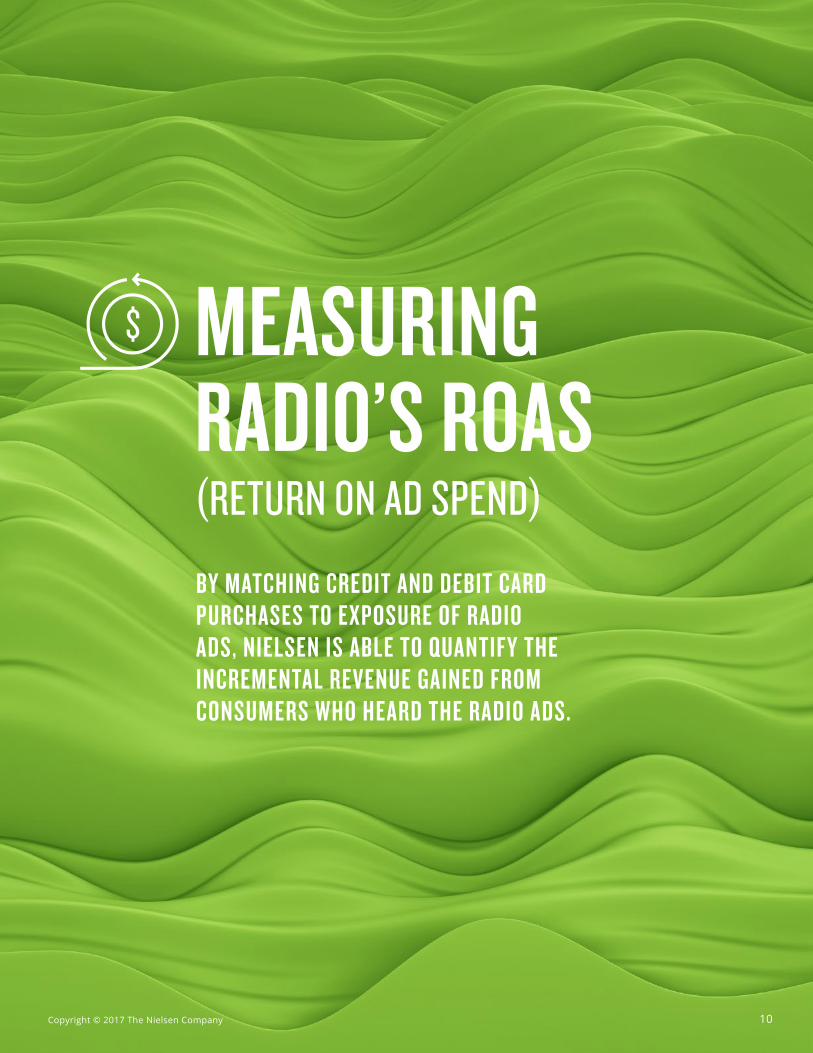
MEASURING RADIO’S ROAS(RETURN ON AD SPEND)
BY MATCHING CREDIT AND DEBIT CARD PURCHASES TO EXPOSURE OF RADIO ADS, NIELSEN IS ABLE TO QUANTIFY THE INCREMENTAL REVENUE GAINED FROM CONSUMERS WHO HEARD THE RADIO ADS.
10Copyright © 2017 The Nielsen Company
11Copyright © 2017 The Nielsen Company
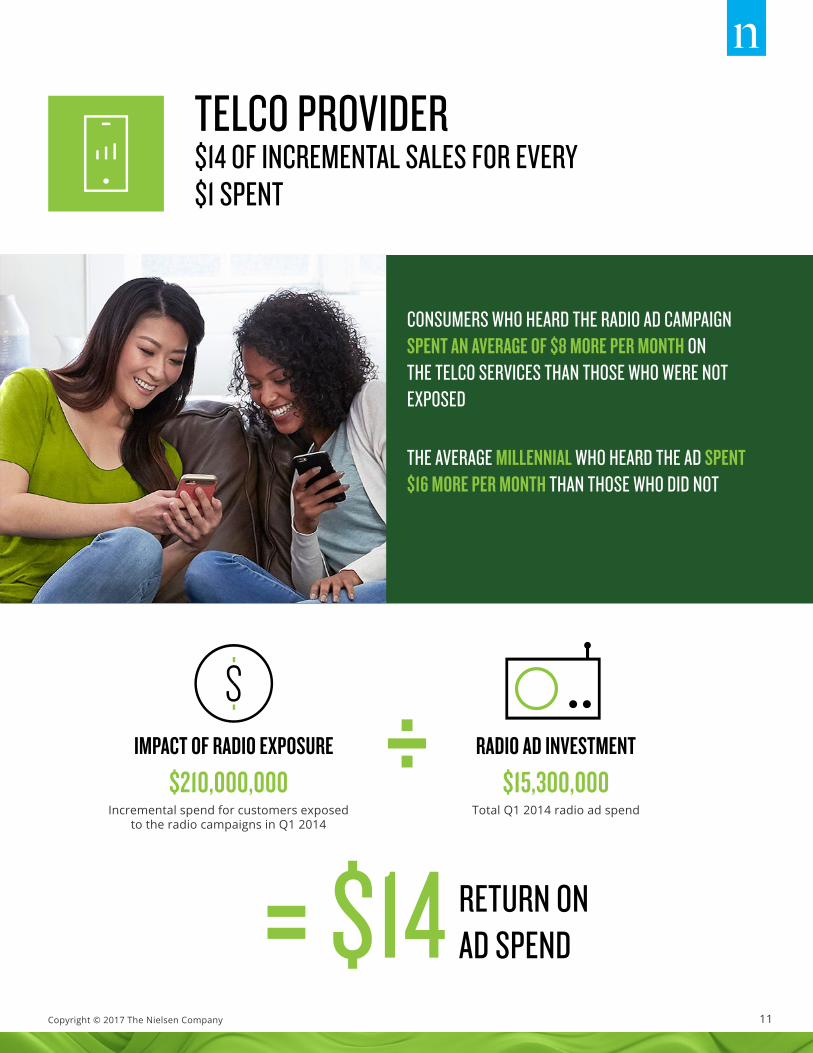
TELCO PROVIDER $14 OF INCREMENTAL SALES FOR EVERY $1 SPENT
$14 RETURN ONAD SPEND=
÷
CONSUMERS WHO HEARD THE RADIO AD CAMPAIGN SPENT AN AVERAGE OF $8 MORE PER MONTH ON THE TELCO SERVICES THAN THOSE WHO WERE NOT EXPOSED
THE AVERAGE MILLENNIAL WHO HEARD THE AD SPENT $16 MORE PER MONTH THAN THOSE WHO DID NOT
IMPACT OF RADIO EXPOSURE
$210,000,000 $15,300,000RADIO AD INVESTMENT
Incremental spend for customers exposed to the radio campaigns in Q1 2014
Total Q1 2014 radio ad spend
12Copyright © 2017 The Nielsen Company
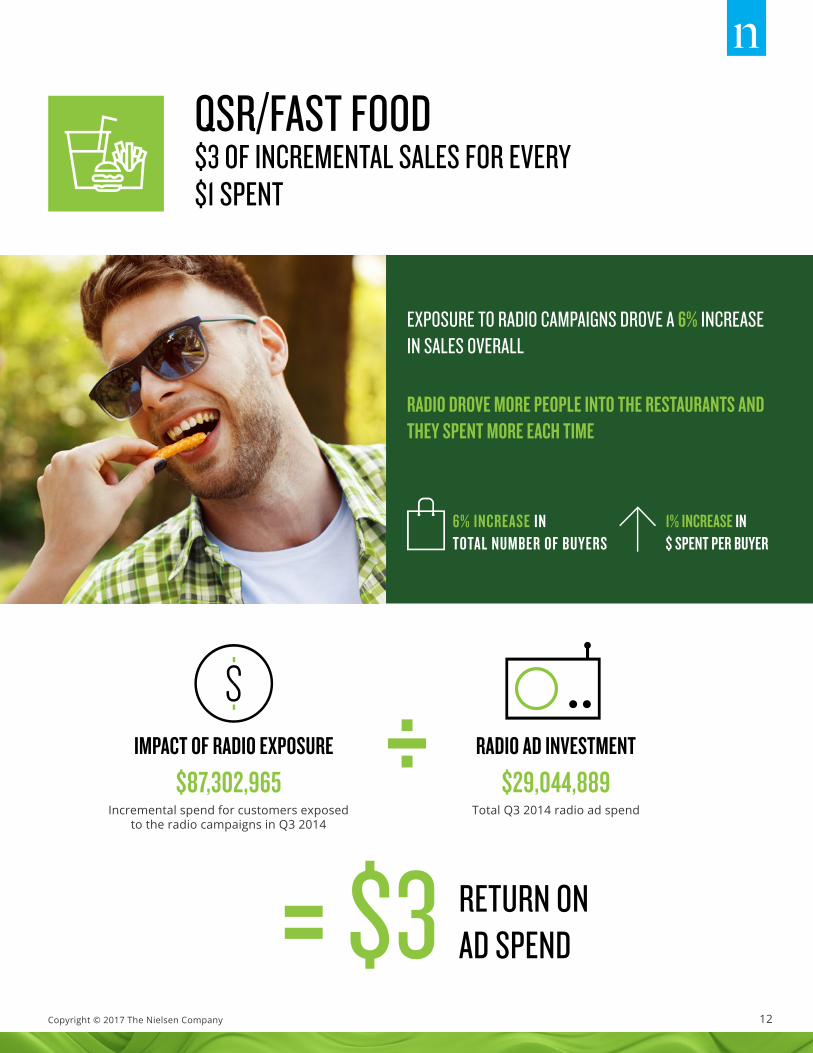
QSR/FAST FOOD $3 OF INCREMENTAL SALES FOR EVERY $1 SPENT
$3 RETURN ONAD SPEND=
÷IMPACT OF RADIO EXPOSURE
$87,302,965 $29,044,889RADIO AD INVESTMENT
Incremental spend for customers exposed to the radio campaigns in Q3 2014
Total Q3 2014 radio ad spend
EXPOSURE TO RADIO CAMPAIGNS DROVE A 6% INCREASE IN SALES OVERALL
RADIO DROVE MORE PEOPLE INTO THE RESTAURANTS AND THEY SPENT MORE EACH TIME
6% INCREASE IN TOTAL NUMBER OF BUYERS
1% INCREASE IN $ SPENT PER BUYER

13Copyright © 2017 The Nielsen Company
DEPARTMENT STORES $17 OF INCREMENTAL SALES FOR EVERY $1 SPENT
$17 RETURN ONAD SPEND=
÷IMPACT OF RADIO EXPOSURE
$356,966,946 $20,999,788 RADIO AD INVESTMENT
Incremental spend for customers exposed to the radio campaigns in Q3 2014
Total Q3 2014 radio ad spend
EXPOSURE TO RADIO CAMPAIGNS DROVE A 10% INCREASE IN SALES OVERALL
RADIO BROUGHT IN MORE SHOPPERS AND THEY SPENT MORE EACH TIME THEY SHOPPED
3% INCREASE IN TOTAL NUMBER OF BUYERS
6% INCREASE IN $ SPENT PER BUYER

14Copyright © 2017 The Nielsen Company
HOME IMPROVEMENT $9 OF INCREMENTAL SALES FOR EVERY $1 SPENT
$9 RETURN ONAD SPEND=
÷IMPACT OF RADIO EXPOSURE
$368,666,119 $38,885,290 RADIO AD INVESTMENT
Incremental spend for customers exposed to the radio campaigns in Q2 2014
Total Q2 2014 radio ad spend
EXPOSURE TO RADIO CAMPAIGNS DROVE A 4% INCREASE IN SALES OVERALL
RADIO CAMPAIGN EXPOSURE DROVE MORE PEOPLE TO SHOP AND TO SHOP MORE OFTEN
8% INCREASE IN TOTAL NUMBER OF BUYERS
2% INCREASE IN $ SPENT PER BUYER

15Copyright © 2017 The Nielsen Company
MASS MERCHANDISER $16 OF INCREMENTAL SALES FOR EVERY $1 SPENT
$16 RETURN ONAD SPEND=
÷IMPACT OF RADIO EXPOSURE
$227,707,290 $13,908,650 RADIO AD INVESTMENT
Incremental spend for customers exposed to the radio campaigns in Q4 2014
Total Q4 2014 radio ad spend
EXPOSURE TO RADIO CAMPAIGNS DROVE A 1% INCREASE IN SALES OVERALL
RADIO BROUGHT IN MORE SHOPPERS AND THEY SPENT MORE WHEN THEY SHOPPED
2% INCREASE IN TOTAL NUMBER OF BUYERS
2% INCREASE IN $ SPENT PER BUYER
“THE DAYS OF GIVING DIGITAL A PASS ARE OVER”MARC PRITCHARD, CHIEF BRAND OFFICERPROCTER AND GAMBLE
16Copyright © 2017 The Nielsen Company

17Copyright © 2017 The Nielsen Company
RADIO ADS DRIVE A 32% SALES LIFT FOR CPG ADVERTISERSBUT CURRENT GRP LEVELS FOR MOST CPG RADIO CAMPAIGNS ARE OFTEN TOO LOW
A recent study from Nielsen Catalina Solutions looked at the impact of radio advertising on sales for a snack product. This product typically gets a 10.5% share of all sales in the category. Isolating only the 9% of consumers who were exposed to the radio campaign, the snack product saw a 13.9% share of sales in the category. This equates to a 32% increase in brand share or a difference of 3.4 share points. However, since only 9% of the audience was exposed, the total sales lift among all purchases, including for the 91% who were not exposed, is a weighted average of only 0.3 share points higher than the expected lift without advertising. Radio may have made a greater impact in overall sales if the GRP levels were higher.
Nielsen Catalina Study – 2014http://www.ncsolutions.com/radio-advertising-drives-sales
EXPOSED
SNACK RADIO CAMPAIGN SNACK BRAND DOLLAR SHARE
EXPECTED
10.513.9
+3.4
32%
EXPOSED
UNEXPOSEDPURCHASE
9%91%

Copyright © 2017 The Nielsen Company 18
ADVERTISERS CURRENTLY USING RADIOTOP 100 SPENDERS ON SPOT RADIO / JAN – DEC 2016COMCAST CORP DEUTSCHE TELEKOM AG BERKSHIRE HATHAWAY INC MCDONALDS CORP AT&T INC VERIZON COMMUNICATIONS INC SOFTBANK CORP FIAT CHRYSLER AUTOMOBILES NV KROGER CO HOME DEPOT INC STEINHOFF INTL HOLDINGS NV UNITED STATES GOVERNMENT WESTERN STONE & METAL CORP WALGREENS BOOTS ALLIANCE INC HONDA MOTOR CO LTD-DA AB ACQUISITION LLC FORD MOTOR CO IHEARTMEDIA INC OREILLY AUTOMOTIVE INC MACYS INC JC PENNEY CO INC OPTIMA TAX RELIEF LLC 3G CAPITAL INC COCA-COLA CO WALT DISNEY CO
IMPAC MORTGAGE CORP NATIONAL AMUSEMENTS INC LOWES COS INC AUTOZONE INC TOYOTA MOTOR CORP-DA CHARTER COMMUNICATIONS INC CALIFORNIA STATE OF UNITED SVCS AUTOMOBILE ASSN STATE FARM AUTOMBL INSRNC CO STAPLES INC JW CHILDS ASSOC LP LIFELOCK INC ZIPRECRUITER INC BLACKSTONE GROUP LP AMERICAN FAMILY MUTUAL INSURANCE CO PEPSICO INC NISSAN MOTOR CO LTD-DA WELLS FARGO & CO DOCTORS ASSOC INC WAL-MART STORES INC STEINER LEISURE LTD ABBVIE INC WENDYS CO ROCK VENTURES LLC GENERAL MOTORS CO-DA
SIGNET JEWELERS LTD FORTUNEBUILDERS INC TOYOTA MOTOR CORP TWENTY-FIRST CENTURY FOX INC ANHEUSER-BUSCH INBEV SA/NV DUNKIN BRANDS INC SELECT COMFORT CORP FORD MOTOR CO-DA MY PILLOW INC AMAZON.COM INC AMERICAN EXPRESS CO BROADCASTING MEDIA PARTNERS INC FLORIDA STATE OF NUBIOTIX LLC AUTONATION INC NEXTRADIO LLC MARATHON PETROLEUM CORP YUM! BRANDS INC BAIN CAPITAL LP MONDELEZ INTL INC ARIZONA STATE OF CREDITREPAIR.COM INC RBDS RUBBISH BOYS DISPOSAL SVC INC PUBLIX SUPER MARKETS INC TEXAS STATE OF
FREEMAN SPOGLI & CO INC COMMUNITY TAX LLC-BS GAP INC EQYSS INTL INC ROSETTA STONE INC GENERAL MOTORS CO SIX FLAGS ENTERTAINMENT CORP KARS-4-KIDS INC TRUECAR INC ROARK CAPITAL GROUP INC NEW YORK STATE OF JACKSON HEWITT TAX SVC INC PRODUCT PARTNERS LLC TACT HOLDING INC UBER TECHNOLOGIES INC LOANME INC KAO CORP ADVANCE AUTO PARTS INC GENUINE PARTS CO MORONGO BAND OF MISSION INDIANS INC VISION ACQUISITION LLC VOLKSWAGEN AG KOHLS CORP COX ENTERPRISES INC MARYLAND STATE OF

19Copyright © 2017 The Nielsen Company
ABOUT NIELSENNielsen Holdings plc (NYSE: NLSN) is a global performance management company that provides a comprehensive understanding of what consumers watch and buy. Nielsen’s Watch segment provides media and advertising clients with Nielsen Total Audience measurement services for all devices on which content — video, audio and text — is consumed. The Buy segment offers consumer packaged goods manufacturers and retailers the industry’s only global view of retail performance measurement. By integrating information from its Watch and Buy segments and other data sources, Nielsen also provides its clients with analytics that help improve performance. Nielsen, an S&P 500 company, has operations in over 100 countries, covering more than 90% of the world’s population. For more information, visit www.nielsen.com.

Top Related