


Languages
Pages
Legal


Quest for nodal development Evidence from Census 2001 and Census 2011
Statistics South Africa
Pali Lehohla Statistician-GeneralReport No. 03-10-14 (2001–2011)

Statistics South Africa
Quest for nodal development: Evidence from Census 2001 and Census 2011
Report 03-10-14
ii
Quest for nodal development: Evidence from Census 2001 and Census 2011 / Statistics South Africa Published by Statistics South Africa, Private Bag X44, Pretoria 0001 © Statistics South Africa, 2016 Users may apply or process this data, provided Statistics South Africa (Stats SA) is acknowledged as the original source of the data; that it is specified that the application and/or analysis is the result of the user's independent processing of the data; and that neither the basic data nor any reprocessed version or application thereof may be sold or offered for sale in any form whatsoever without prior permission from Stats SA. Stats SA Library Cataloguing-in-Publication (CIP) Data Quest for nodal development: Evidence from Census 2001 and Census 2011 / Statistics South Africa. Pretoria: Statistics South Africa, 2016 Report no.: 03-10-14 31pp ISBN 978-0-621-44592-3 A complete set of Stats SA publications is available at Stats SA Library and the following libraries: National Library of South Africa, Pretoria Division National Library of South Africa, Cape Town Division Library of Parliament, Cape Town Bloemfontein Public Library Natal Society Library, Pietermaritzburg Johannesburg Public Library Eastern Cape Library Services, King William’s Town Central Regional Library, Polokwane Central Reference Library, Nelspruit Central Reference Collection, Kimberley Central Reference Library, Mmabatho This report is available on the Stats SA website: www.statssa.gov.za For technical enquiries please contact: Dr Nathaniel Dlamini Tel: (012) 310 8911 (ext) 2265 Email: [email protected] Ms Nozipho Shabalala Tel: (012) 310 6994 Email: [email protected] Dr Sandile Simelane Tel: (012) 310 8046 Email: [email protected]
Statistics South Africa
Quest for nodal development: Evidence from Census 2001 and Census 2011
Report 03-10-14
iii
Contents
Preface ....................................................................................................................................................... vi
1. Introduction ....................................................................................................................................... 1
1.1 Background ......................................................................................................................................... 1
1.2 Purpose of the report ........................................................................................................................... 2
2. Data sources and methods .............................................................................................................. 2
3. Limitations ......................................................................................................................................... 4
4. Key findings ....................................................................................................................................... 5
5. Findings ............................................................................................................................................. 5
5.1 Demographics ..................................................................................................................................... 6
5.2 Education ............................................................................................................................................ 9
5.2.1 Education profile of the nodal population ........................................................................................ 9
5.2.2 Comparisons of the education profile between nodes and non-nodes ......................................... 11
5.3 Economic activity in the nodes .......................................................................................................... 12
5.3.1 Labour market status in rural and urban nodes ............................................................................ 12
5.3.2 Comparisons of the employment status of the economically active population between the nodes and non-nodes ................................................................................................................... 13
5.4 Living conditions in the nodal areas .................................................................................................. 14
5.4.1 Housing and access to basic services in rural and urban nodes .................................................. 14
5.4.2 Comparisons of the standard of living of households between nodes and non-nodes ................. 18
5.5 Multidimensional poverty in the nodes .............................................................................................. 19
5.5.1 Multidimensional poverty levels in the nodes ................................................................................ 20
5.5.2 Comparisons of multidimensional poverty reduction in the nodes and non-nodes: 2001 and 2011 .............................................................................................................................................. 22
5.5.3 Further insights about the rural and urban nodes based on SAMPI headcounts .......................... 23
6. Summary .......................................................................................................................................... 24
7. Conclusion ....................................................................................................................................... 25

Statistics South Africa
Quest for nodal development: Evidence from Census 2001 and Census 2011
Report 03-10-14
iv
List of tables
Table 1: Rural and urban nodes by province ........................................................................................... 2
Table 2: Urban nodes and urban non-nodes per province and municipality ............................................ 4
Table 3: Distribution of the population in South Africa, rural and in urban nodes by age group: 2001 and 2011 .................................................................................................................................... 6
Table 4: Percentage distribution of the population aged 20 years and above in South Africa, in the urban nodes and in the rural nodes by highest level of education: 2001 and 2011 ................. 10
Table 5: Comparisons of the education profile (population aged 20 years and above) between nodes and non-nodes: 2001 and 2011 ..................................................................................... 11
Table 6: Comparisons of the employment status between the nodes and the non-nodes: 2001 and 2011 ......................................................................................................................................... 14
Table 7: Percentage distribution of households in rural and urban nodes by source of energy they use for cooking, heating and lighting: 2001 and 2011 .............................................................. 18
Table 8: Comparisons of improvements in access to formal dwellings and basic services between nodes and non-nodes: 2001 and 2011 ..................................................................................... 19
Table 9: The dimensions and indicators the SAMPI .............................................................................. 20
Table 10: Comparisons of multidimensional poverty reduction in the nodes and non-nodes: 2001 and 2011 .................................................................................................................................. 22
Table 11: The poorest twenty districts in South Africa sorted by 2011 poverty headcount ...................... 23
Statistics South Africa
Quest for nodal development: Evidence from Census 2001 and Census 2011
Report 03-10-14
v
List of figures
Figure 1: Population structure in South Africa: 2001 and 2011 ............................................................................... 7
Figure 2: Population structure in the rural and urban nodes: 2001 ......................................................................... 7
Figure 3: Population structure in the rural and urban nodes: 2011 ......................................................................... 8
Figure 4: Distribution of the population in rural and urban nodes by population group: 2001 and 2011 ................ 8
Figure 5: Proportion of children aged 7 to 15 years who are attending an educational institution: 2001 and 2011 ....................................................................................................................................................... 10
Figure 6: Percentage distribution of the population of working age (15 – 64 years) in rural and urban nodes by labour market status: 2001 and 2011 ..................................................................................... 12
Figure 7: Percentage distribution of the economically active population (15 to 64 years) in rural and urban nodes by employment status: 2001 and 2011 ....................................................................................... 13
Figure 8: Percentage distribution of households in rural and urban nodes by type of dwelling: 2001 and 2011 ....................................................................................................................................................... 15
Figure 9: Percentage distribution of households in rural and urban nodes by tenure status: 2001 and 2011 ...... 15
Figure 10: Percentage distribution of households in rural and urban nodes by main source of water: 2001 and 2011 ................................................................................................................................................ 16
Figure 11: Percentage distribution of households in rural and urban nodes by type of toilet facility: 2001 and 2011 ................................................................................................................................................ 17
Figure 12: Multidimensional poverty levels in South Africa, rural and urban nodes: 2001 and 2011 ..................... 20
Figure 13: Contribution of each dimension towards poverty in rural and urban nodes: 2001 and 2011 ................. 21
Figure 14: Contribution of each indicator to poverty in rural and urban nodes: 2011 ............................................. 22
Statistics South Africa
Quest for nodal development: Evidence from Census 2001 and Census 2011
Report 03-10-14
vi
Preface
This report is a consolidation of descriptive analysis done on the rural nodes (as identified by the Integrated
Sustainable Rural Development Programme (ISRDP)) and the urban nodes (as identified by the Urban Renewal
Programme (URP)) using Census 2001 and Census 2011 data. The analysis includes detailed information of each
node presented in tables, graphs and maps. This consolidated report presents aggregated information on the rural
and urban nodes and compares them with non-nodal areas to better understand the gains achieved through the
ISRDP and URP programmes. For further information and analysis on these nodes, readers are encouraged to
refer to the detailed analysis available on the Stats SA website (www.statssa.gov.za).
Pali Lehohla Statistician‐General

Statistics South Africa
Quest for nodal development: Evidence from Census 2001 and Census 2011
Report 03-10-14
1
1. Introduction
The advent of democracy in 1994 came with a need to restructure South Africa economically, socially and spatially
to address the imbalances and inequalities manufactured by the apartheid system. Spatially, during the apartheid
system, rural areas were excluded from economic and infrastructural development. This exclusion was as a result
of apartheid laws such as the Group Areas Act, No. 36 of 1966. The rural population, due to this exclusion, was
significantly disadvantaged in terms of work opportunities, quality education, basic services, etc.
Within the urban landscape, South Africa had what is called townships. Townships were established to house the
labour force, majority being black Africans, followed by Coloureds. These were somewhat closer to the Central
Business Districts (CBDs) of towns and cities, but still required considerable commuting to and from the CBDs.
They were characterised by high population density and lack of basic services. With the abolishment of the
apartheid system and its laws (including the Group Areas Act of 1966 and the Natives Resettlement Act, No. 19 of
1954,) urbanisation increased as the rural population flocked to the towns and cities in search of work. This led to
further high population density in urban townships and put further stress on the quality and availability to basic
services. In addition, there was a rise in the number of informal settlement established around towns and cities.
In an attempt to address the challenges of infrastructure development, access to basic services and economic
activity in both rural areas and urban townships, the post-apartheid government conceptualised and implemented
(in selected areas) two specific programmes, namely the Integrated Sustainable Rural Development Programme
(ISRDP) in eighteen (18) rural areas and the Urban Renewal Programme (URP) in eight (8) urban townships. This
report looks at the progress of development in these selected areas between 2001 and 2011 using census data.
1.1 Background
In 2001, the government identified 13 specific rural areas – over the years these have increased to 18 – which
were earmarked for accelerated development under the ISRDP and 8 urban townships earmarked for accelerated
development under the URP. The 26 selected areas were then referred to as nodes; 18 rural nodes and 8 urban
nodes. Table 1 indicates both rural and urban nodes as well as the provinces they belong to.
Urban and rural nodes are distributed in all provinces of South Africa except in North West where there is neither a
rural nor urban node. The rural nodes were selected in the poorest parts of the country found in seven provinces,
namely, Western Cape, Northern Cape, Eastern Cape, Free State, KwaZulu-Natal, Mpumalanga and Limpopo.
They are characterised by inadequate infrastructure, poor means of communication, poor access to basic services,
poor living conditions, high levels of unemployment, lack of adequate facilities and predominantly occupied by
black Africans. The urban nodes, on the other hand, were selected in five provinces, namely, Western Cape,

Statistics South Africa
Quest for nodal development: Evidence from Census 2001 and Census 2011
Report 03-10-14
2
Eastern Cape, Northern Cape, KwaZulu-Natal and Gauteng. They are characterised by high levels of poverty and
crime, depleted infrastructure, shortage of housing, inadequate operational and maintenance budgets and low
internal economic opportunities.
Table 1: Rural and urban nodes by province
Province Rural nodes Urban nodes Municipality Node
Western Cape Central Karoo City of Cape Town Khayelitsha Mitchell’s Plain Eastern Cape OR Tambo Nelson Mandela
Metro Motherwell
Alfred Nzo Buffalo City Mdantsane Joe Gqabi Chris Hani Amathole Northern Cape Sol Plaatjie Galeshewe Free State Thabo Mofutsanyane KwaZulu Natal UMkhanyakude eThekwini Metro Inanda Zululand Kwa-Mashu uThukela uMzinyathi uMgungundlovu Sisonke Ugu Gauteng City of Johannesburg Alexandra Mpumalanga Ehlanzeni Limpopo Mopani Greater Sekhukhune
1.2 Purpose of the report
The purpose of this report is two-fold. First, it is to provide a detailed analysis of the plight of the citizens living in
the nodes over a ten year period (2001 and 2011). Second, it is to compare development in the nodes relative to
the development in other areas not selected as nodes between 2001 and 2011.
2. Data sources and methods
This report is based on the results of the two censuses conducted in 2001 and 2011. Census 2001 was the second
census conducted in post-democratic South Africa and Census 2011 was the third. Both censuses were conducted
using de facto census methodology, meaning that people were counted where they were found on the census
night. Data collection took place from 9th to the 31st of October of each year (2001 and 2011). Face-to-face
interviews were conducted with respondents. Self-administration was permitted as per respondents’ preferences.
The completed questionnaires were then scanned and transferred into a database for editing and analysis.
Statistics South Africa
Quest for nodal development: Evidence from Census 2001 and Census 2011
Report 03-10-14
3
Analysis of data was done using two statistical packages, namely the Statistical Analyses System (SAS) and
SuperCross.
This report seeks to provide information on the poverty levels and living conditions of the nodal population between
2001 and 2011. Selected development indicators such as education, employment, living conditions, and poverty
levels are explored using frequency tables and cross tabulations to study development in the nodes over the ten
year period. The choice of indicators used is limited by the availability and comparability of data items across
Census 2001 and Census 2011.
The report also seeks to provide information on the performance of the nodes compared to non-nodes during the
same period of time (between 2001 and 2011). Statistical tests for differences in the performance of the two are
conducted to establish statistical significance. Two separate approaches were adopted for the selection of non-
nodal areas used for these comparisons.
For rural nodes, a rural node is equivalent to a district municipality, e.g. uMkhanyakude, which is a district
municipality in KwaZulu-Natal was selected as a node whilst uThungulu, also a district municipality in KwaZulu-
Natal is not a node. The results from the eighteen selected nodes are then compared with the results from the
districts not classified as nodes. Districts that are not part of the ISRDP are referred to as “rural non-nodes” in this
report. The percentage change between the two points, 2001 and 2011, is compared to study the direction and rate
of change for the rural nodes and the rural non-nodes.
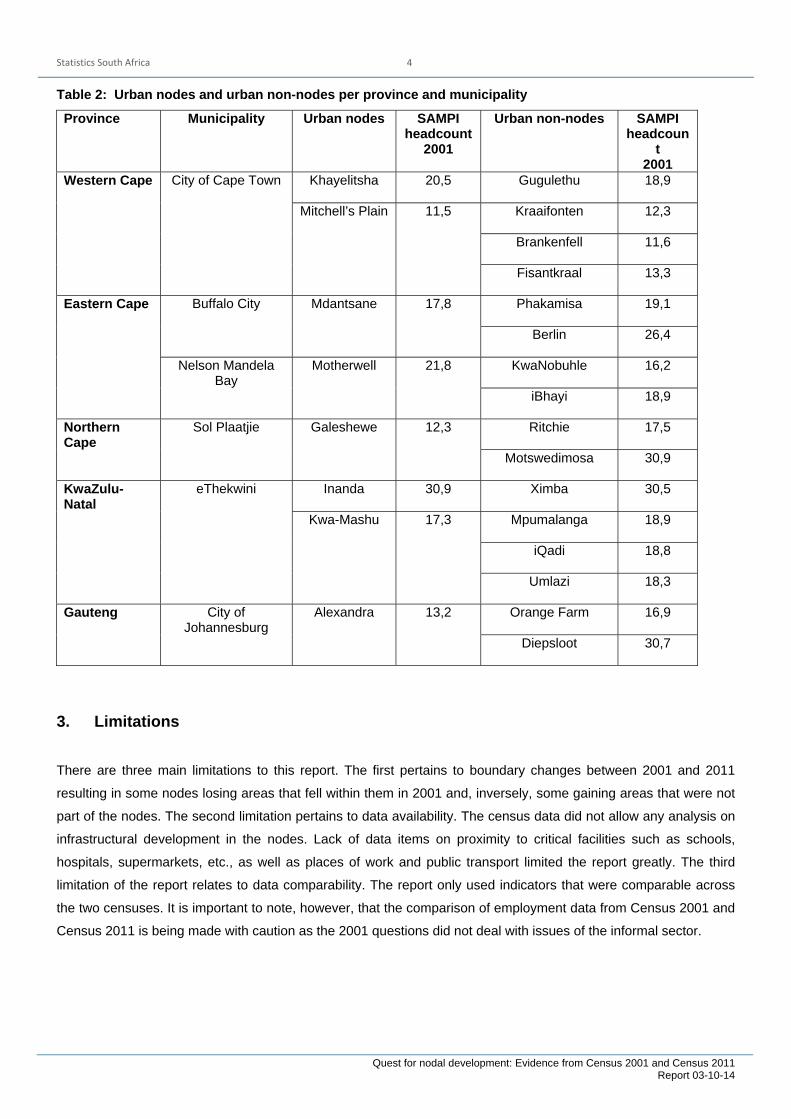
For urban nodes, on the other hand, an urban node is a township, which is a ‘main place’ found within a
municipality. For comparison of urban nodes to urban non-nodes, we selected townships that were not part of the
URP. The townships selected for comparison with the urban nodes are referred to as “urban non-nodes” in this
report. The urban non-nodes used for comparisons with urban nodes are selected based on their proximity to the
urban nodes and their poverty levels. The selected urban non-nodes have to be in the same municipality as the
urban node, and had similar levels of poverty as the urban node in 2001. As done for the rural nodes, the
percentage change between the two points is compared to study the direction and rate of change between the
urban nodes and the urban non-nodes. A z-score test is also used to determine statistical significance. Table 2
indicates townships that are selected as urban non-nodes to be used for comparison with urban nodes based on
their South African Multidimensional Poverty Index (SAMPI) headcounts at base year (2001) as calculated and
published by Statistics South Africa (2014).
Statistics South Africa
Quest for nodal development: Evidence from Census 2001 and Census 2011
Report 03-10-14
4
Table 2: Urban nodes and urban non-nodes per province and municipality
Province Municipality Urban nodes SAMPI headcount
2001
Urban non-nodes SAMPI headcoun
t 2001
Western Cape City of Cape Town Khayelitsha 20,5 Gugulethu 18,9
Mitchell’s Plain 11,5 Kraaifonten 12,3
Brankenfell 11,6
Fisantkraal 13,3
Eastern Cape Buffalo City Mdantsane 17,8 Phakamisa 19,1
Berlin 26,4
Nelson Mandela Bay
Motherwell 21,8 KwaNobuhle 16,2
iBhayi 18,9
Northern Cape
Sol Plaatjie Galeshewe 12,3 Ritchie 17,5
Motswedimosa 30,9
KwaZulu-Natal
eThekwini Inanda 30,9 Ximba 30,5
Kwa-Mashu 17,3 Mpumalanga 18,9
iQadi 18,8
Umlazi 18,3
Gauteng City of Johannesburg
Alexandra 13,2 Orange Farm 16,9
Diepsloot 30,7
3. Limitations
There are three main limitations to this report. The first pertains to boundary changes between 2001 and 2011
resulting in some nodes losing areas that fell within them in 2001 and, inversely, some gaining areas that were not
part of the nodes. The second limitation pertains to data availability. The census data did not allow any analysis on
infrastructural development in the nodes. Lack of data items on proximity to critical facilities such as schools,
hospitals, supermarkets, etc., as well as places of work and public transport limited the report greatly. The third
limitation of the report relates to data comparability. The report only used indicators that were comparable across
the two censuses. It is important to note, however, that the comparison of employment data from Census 2001 and
Census 2011 is being made with caution as the 2001 questions did not deal with issues of the informal sector.

Statistics South Africa
Quest for nodal development: Evidence from Census 2001 and Census 2011
Report 03-10-14
5
4. Key findings
The key findings of this report are summarised into three main points. These three points pertain to comparisons
between the rural and urban nodes, comparisons between the nodes and the non-nodes, and lastly, the selection
of the nodes.
Regarding comparisons between the rural nodes and urban nodes, the report found that there were improvements
in all the development areas covered (i.e. education, economic activity, living conditions and poverty) in both rural
and urban nodes between 2001 and 2011. This however, excluded school attendance in the urban nodes where
the proportion of children aged 7 to 15 years attending an educational institution dropped from 94.6% in 2001 to
92.4% in 2011. The report also found visible inequalities regarding access to water and sanitation between rural
and urban nodes. Whilst access to water and sanitation improved both in rural and urban nodes between 2001 and
2011, there are still very low proportions of households in the rural nodes that have access to these services
compared to the proportions observed in the urban nodes.
Regarding comparisons between the nodes and the non-nodes, the report found that, on average, the nodes were
doing poorly on education, employment, living conditions and poverty compared to the non-nodes in 2001. The
difference between the two is found to be statistically significant. This difference may be viewed as a justification for
the selection of these areas to be identified as nodes. Ten years later, in 2011, the report found that the nodes are
still doing poorly compared to non-nodes. This difference between the nodes and the non-nodes is also found to be
statistically significant. This indicates that, despite the implementation of the ISRDP and URP, the nodes didn’t
catch up with the non-nodes.
Regarding the selection of the nodes, the report found that there were areas that had higher multidimensional
poverty headcounts than some selected nodes but were not identified as nodes. These areas include Dr Ruth
Segomotsi Mompati district municipality and Vhembe district municipality that were not identified as rural nodes,
but were worse off than some of the identified rural nodes. In addition, townships such as Diepsloot and
Motswedimosa were not identified as urban nodes yet being worse off than some identified urban nodes. This may
highlight some of the data gaps that existed in 2001.
5. Findings
This section is sub-divided into five main sections, namely demographics, education, economic activity, living
conditions, and multidimensional poverty. Each of the five sections begins with a review of the status of the nodes
in 2001 and in 2011 and then proceeds to compare the nodes with their non-nodal counterparts.
Statistics South Africa
Quest for nodal development: Evidence from Census 2001 and Census 2011
Report 03-10-14
6
5.1 Demographics
In 2001, the total population of South Africa was estimated at 44.8 million. Of this population, 14.9 million was
found in the nodal areas; 13.9 million in rural nodes and 1.6 million in urban nodes. By 2011, the population of
South Africa had grown to 51.8 million, of which 15.5 million people were living in the nodal areas. Of importance to
note, while the population in the rural nodes increased by 4.8%, there was a decrease in the population in urban
nodes by 0.5% between 2001 and 2011. Both rural and urban nodes experienced a decline among the population
aged 0 – 17 years, whilst other age groups experienced an increase in population size. This is with the exception of
the age group 18 – 34 among the population of urban nodes that experienced a marginal decline in population size
during this time period. It is also important to note the considerable increase in those aged 65 years and older living
in the urban nodes between 2001 and 2011 (see Table 3).
Table 3: Distribution of the population in South Africa, rural and in urban nodes by age group: 2001 and 2011
Age group
South Africa Rural nodes Urban nodes
Total population
2001
Total population
2011
% change
Total population
2001
Total population
2011
% change
Total population
2001
Total population
2011
% change
0 – 17 17 382 879 18 067 972 3,9 6 306 767 5 948 312 -5,7 563 460 520 752 -7,6
18 – 34 13 534 492 16 498 464 21,9 3 425 873 3 913 284 14,2 580 636 578 515 -0,4
35 - 64 11 687 195 14 438 134 23,5 2 804 701 3 231 141 15,2 435 808 460 030 5,6
65+ 2 215 211 2 765 991 24,9 731 826 812 197 11,0 40 565 52 437 29,3
Total 44 819 778 51 770 560 15,5 13 269 167 13 904 935 4,8 1 620 470 1 611 735 -0,5
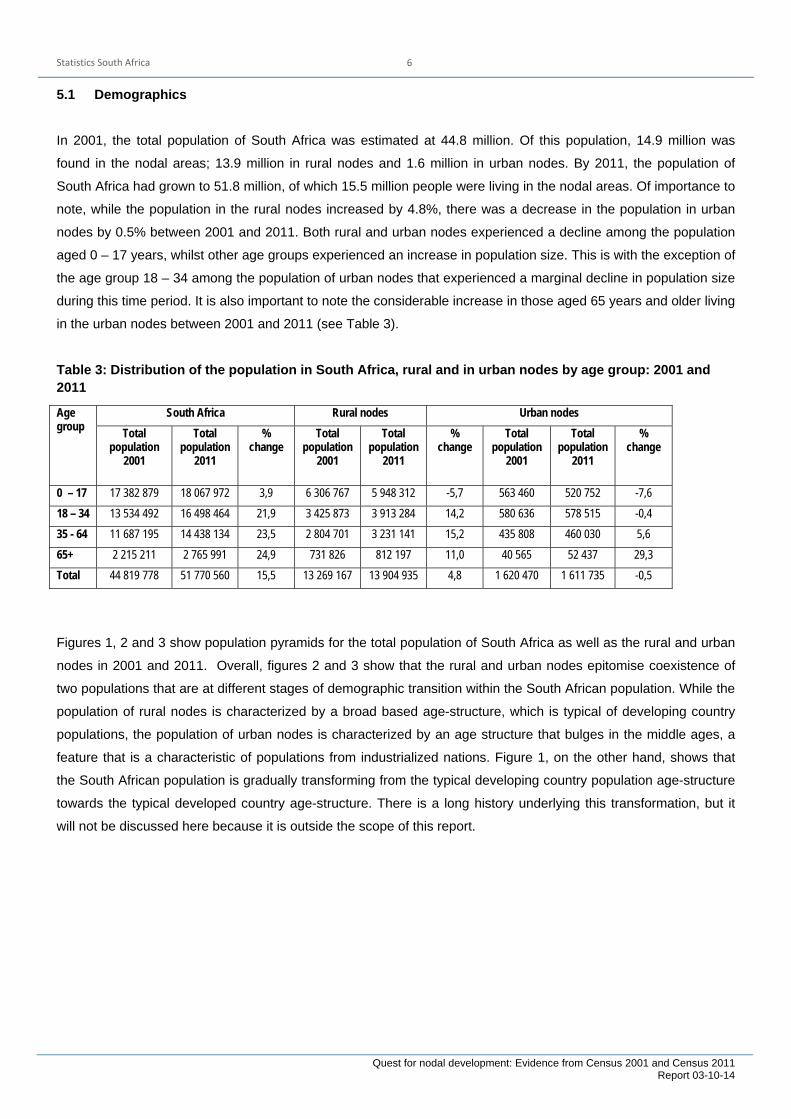
Figures 1, 2 and 3 show population pyramids for the total population of South Africa as well as the rural and urban
nodes in 2001 and 2011. Overall, figures 2 and 3 show that the rural and urban nodes epitomise coexistence of
two populations that are at different stages of demographic transition within the South African population. While the
population of rural nodes is characterized by a broad based age-structure, which is typical of developing country
populations, the population of urban nodes is characterized by an age structure that bulges in the middle ages, a
feature that is a characteristic of populations from industrialized nations. Figure 1, on the other hand, shows that
the South African population is gradually transforming from the typical developing country population age-structure
towards the typical developed country age-structure. There is a long history underlying this transformation, but it
will not be discussed here because it is outside the scope of this report.

Statistics South Africa
Quest for nodal development: Evidence from Census 2001 and Census 2011
Report 03-10-14
7
Figure 1: Population structure in South Africa: 2001 and 2011
Figure 2: Population structure in the rural and urban nodes: 2001
Figure 2 indicates a visible bottom heavy age structure in the rural nodes whilst the age structure is visibly middle
heavy in the urban nodes in 2001.
15 10 5 0 5 10 15
0 ‐ 45 ‐ 9
10 ‐ 1415 ‐ 1920 ‐ 2425 ‐ 2930 ‐ 3435 ‐ 3940 ‐ 4445 ‐ 4950 ‐ 5455 ‐ 5960 ‐ 6465 ‐ 6970 ‐ 74
75 +
2001
Male Female
15 10 5 0 5 10 15
0 ‐ 45 ‐ 9
10 ‐ 1415 ‐ 1920 ‐ 2425 ‐ 2930 ‐ 3435 ‐ 3940 ‐ 4445 ‐ 4950 ‐ 5455 ‐ 5960 ‐ 6465 ‐ 6970 ‐ 74
75 +
2011
Male Female
10,0 5,0 0,0 5,0 10,0
0 ‐ 45 ‐ 9
10 ‐ 1415 ‐ 1920 ‐ 2425 ‐ 2930 ‐ 3435 ‐ 3940 ‐ 4445 ‐ 4950 ‐ 5455 ‐ 5960 ‐ 6465 ‐ 6970 ‐ 74
75+
Male Female
Rural nodes
15 10 5 0 5 10 15
0‐45‐9
10‐1415‐1920‐2425‐2930‐3435‐3940‐4445‐4950‐5455‐5960‐6465‐6970‐7475+
Male Female
Urban nodes
Statistics South Africa
Quest for nodal development: Evidence from Census 2001 and Census 2011
Report 03-10-14
8
Figure 3: Population structure in the rural and urban nodes: 2011
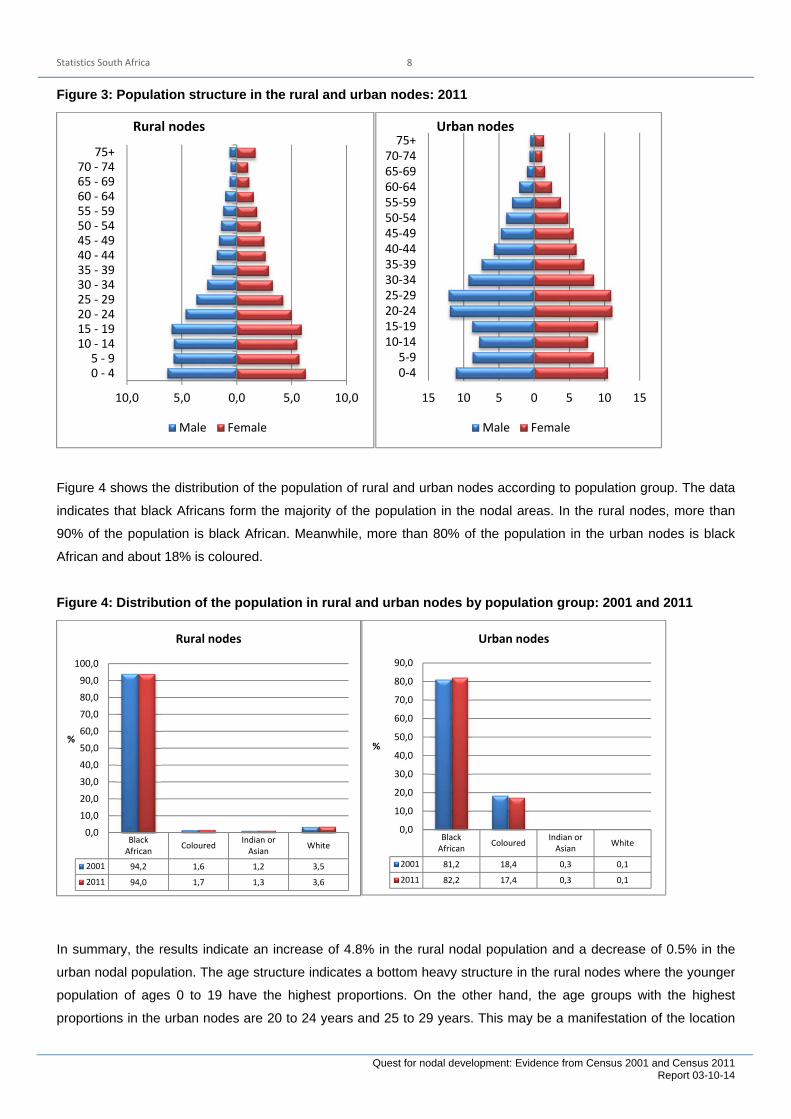
Figure 4 shows the distribution of the population of rural and urban nodes according to population group. The data
indicates that black Africans form the majority of the population in the nodal areas. In the rural nodes, more than
90% of the population is black African. Meanwhile, more than 80% of the population in the urban nodes is black
African and about 18% is coloured.
Figure 4: Distribution of the population in rural and urban nodes by population group: 2001 and 2011
In summary, the results indicate an increase of 4.8% in the rural nodal population and a decrease of 0.5% in the
urban nodal population. The age structure indicates a bottom heavy structure in the rural nodes where the younger
population of ages 0 to 19 have the highest proportions. On the other hand, the age groups with the highest
proportions in the urban nodes are 20 to 24 years and 25 to 29 years. This may be a manifestation of the location
10,0 5,0 0,0 5,0 10,0
0 ‐ 45 ‐ 9
10 ‐ 1415 ‐ 1920 ‐ 2425 ‐ 2930 ‐ 3435 ‐ 3940 ‐ 4445 ‐ 4950 ‐ 5455 ‐ 5960 ‐ 6465 ‐ 6970 ‐ 74
75+
Male Female
Rural nodes
15 10 5 0 5 10 15
0‐45‐9
10‐1415‐1920‐2425‐2930‐3435‐3940‐4445‐4950‐5455‐5960‐6465‐6970‐7475+
Male Female
Urban nodes
BlackAfrican
ColouredIndian orAsian
White
2001 94,2 1,6 1,2 3,5
2011 94,0 1,7 1,3 3,6
0,0
10,0
20,0
30,0
40,0
50,0
60,0
70,0
80,0
90,0
100,0
%
Rural nodes
BlackAfrican
ColouredIndian orAsian
White
2001 81,2 18,4 0,3 0,1
2011 82,2 17,4 0,3 0,1
0,0
10,0
20,0
30,0
40,0
50,0
60,0
70,0
80,0
90,0
%
Urban nodes

Statistics South Africa
Quest for nodal development: Evidence from Census 2001 and Census 2011
Report 03-10-14
9
of the urban nodes – their proximity to economic and educational opportunities. Lastly, black Africans form the
overwhelming majority of the population in the nodes.
5.2 Education
Section 5.2 presents the education profile in both rural and urban nodes. The section looks at the changes that
occurred in terms of the education status of the nodal population between 2001 and 2011. It further compares
these changes with the changes that occurred in the selected non-nodal areas.
5.2.1 Education profile of the nodal population
Basic education is a fundamental right in South Africa (The Constitution of the Republic of South Africa, 1996). It is,
therefore, compulsory for children aged 7 to 15 years to be enrolled in an educational institution. There are various
programmes in the country that are designed to support learners and their families to ensure that universal
enrolment is achieved. These programmes include, among others, no fee schools and feeding schemes at schools.
Figure 5 presents proportions of children aged 7 to 15 years attending an educational institution in rural and urban
nodes. The results indicate that in 2001, the proportion of children aged 7 to 15 years attending an educational
institution in the urban nodes was higher than the national average. However, whilst nationally the proportion
increased slightly from 93.4% in 2001 to 93.9% in 2011, a decline in the proportion of children attending an
educational institution in the urban nodes is observed in the same period, from 94.6% to 92.3%. This decline is
found among children aged 12 and 13 years. In the rural nodes, an increase from 92.7% in 2001 to 94.2% in 2011
in the proportion of children aged 7 to 15 years attending an educational institution is observed. In fact, in 2011 the
proportion of such children was higher in the rural nodes compared to the national average. This could be
attributed to compulsory education and no fee schools, as well as to initiatives such as feeding schemes, which
make it easier and more affordable for children coming from disadvantaged households to go to school.

Statistics South Africa
Quest for nodal development: Evidence from Census 2001 and Census 2011
Report 03-10-14
10
Figure 5: Proportion of children aged 7 to 15 years who are attending an educational institution: 2001 and 2011
Table 4: Percentage distribution of the population aged 20 years and above in South Africa, in the urban nodes and in the rural nodes by highest level of education: 2001 and 2011
Highest level of education
National Rural nodes Urban nodes
2001 2011 2001 2011 2001 2011
No schooling 17.9 8.6 31.7 15.9 7.0 3.4
Some primary education 16 12.3 19.2 17.2 16.7 9.9
Primary education 6.4 4.6 6.1 5.2 8.6 4.8
Some secondary education 30.8 33.9 24.9 32.4 43.4 43.3
Secondary education (Grade 12) 20.4 28.9 12.8 22.0 20.0 32.5
Tertiary qualification 8.4 11.8 5.2 7.3 4.3 6.1
Table 4 reveals a good story. The table indicates a decrease in the proportion of people with lower levels of
education and an increase in the proportion of the population aged 20 years and above with higher levels of
education in both rural and urban nodes. While this is an indication that South Africa is moving towards achieving
the targets outlined in the National Development Plan (NDP) regarding education, more effort needs to be put on
increasing proportions of people with tertiary qualifications and reducing proportions of those with low levels of
education. In the rural nodes, more than 3 in 10 people (33.1%) have no education or did not complete primary
education. Most people, nationally and in the nodes, have some secondary education as their highest level of
education.
93,4 92,7 94,693,9 94,2 92,3
0
10
20
30
40
50
60
70
80
90
100
National Rural nodes Urban nodes
%
2001
2011

Statistics South Africa
Quest for nodal development: Evidence from Census 2001 and Census 2011
Report 03-10-14
11
5.2.2 Comparisons of the education profile between nodes and non-nodes
Table 4 above presents a positive picture in terms of improvements in the education profile of the nodal population.
Table 5 therefore attempts to compare whether there are any differences between the nodes and non-nodes in
terms of the education profile. At the time of the selection of the nodes, the proportion of the population in the rural
nodes aged 20 years and older with no schooling was higher than that of the non-nodes and the proportion of
those with higher educational levels in the nodes was lower than that of the non-nodes. These differences were
found to be statistically significant, which then justifies the selection of the nodes as these areas were found to be
doing poorly in education compared to the non-nodes. In 2011, however the situation was still the same with the
exception of tertiary qualifications. In 2011, there were no significant differences between the urban nodes and the
urban non-nodes with regards to the proportion of the population aged 20 years and older with some secondary
education and with tertiary qualifications. This means that, by 2011 the urban nodes had caught up with the urban
non-nodes on some secondary education and tertiary qualifications.
Table 5: Comparisons of the education profile (population aged 20 years and above) between nodes and non-nodes: 2001 and 2011
No
schooling
Some primary
education
Completed primary
education
Some secondary education
Completed secondary education (Grade 12)
Tertiary qualification
2001
Rural nodes 31.7 19.2 6.1 24.9 12.8 5.2
Non-nodes 19.3 18.5 7.0 30.1 18.3 6.8
Difference 12.4* 0.7* 0.9* 5.2* 5.5* 1.6* 2011 Rural nodes 15.9 17.2 5.2 32.4 22.0 7.3
Non-nodes 19.1 18.5 7.1 30.2 18.3 6.8
Difference 3.2* 1.3* 1.9* 2.2* 3.7* 0.5*
2001 Urban nodes 7.0 16.7 8.6 43.4 20.0 4.3 Urban non-nodes
13.5 15.8
7.8 38.4
22.3 5.5
Difference 6.5* 0.9* 0.8* 5.0* 2.3* 1.2* 2011 Urban nodes 3.4 9.9 4.8 43.3 32.5 6.1 Urban non-nodes
7.3 13.6
4.9 40.2
32.4 8.6
Difference 3.9* 3.7* 0.1 3.1* 0.1 2.5* p<0.05

Statistics South Africa
Quest for nodal development: Evidence from Census 2001 and Census 2011
Report 03-10-14
12
5.3 Economic activity in the nodes
This section provides the labour market status of the nodal population aged 15 to 64 years. The official definition of
unemployment – which is: persons who are within the economically active population who did not work during the
seven day prior to the interview; want to work and are available to start work within a week; and have taken active
steps to look for work or start some form of self-employment within the four weeks prior to the interview – is used
throughout the report. As highlighted in Section 3, it is important to point out that the comparison of employment
data from Census 2001 and Census 2011 is being made with caution as the 2001 questions did not deal with
issues around the informal sector. The merits of the comparison will therefore depend on whether the informal
sector was a significant factor in the employment dynamics of the rural nodes.
5.3.1 Labour market status in rural and urban nodes
Figure 6 presents the distribution of the population of working age in South Africa and in the nodes by labour
market status, while Figure 7 indicates employment rates and unemployment rates in the nodes. Figure 6 indicates
a different distribution pattern of the population of working age between 2001 and 2011 in the rural nodes and the
urban nodes. In 2001, in the rural nodes, the majority of the working age population is formed by the economically
inactive population, followed by the unemployed and then the employed. In the urban nodes, in 2001, most the
working age population was unemployed, followed by those who were employed and then the economically
inactive. In 2011, the economically inactive in the rural nodes still formed the majority of the working age
population, followed by the unemployed and then the employed. In the urban nodes in 2011, most were employed,
followed by the economically inactive and then the unemployed.
Figure 6: Percentage distribution of the population of working age (15 – 64 years) in rural and urban nodes by labour market status: 2001 and 2011
2001 2011 2001 2011
Rural nodes Urban nodes
Employed 20,3 27,3 33,7 40,4
Unemployed 23,7 16,9 34,5 23,8
Economically inactive 56,0 55,8 31,7 35,8
0
10
20
30
40
50
60
%

Statistics South Africa
Quest for nodal development: Evidence from Census 2001 and Census 2011
Report 03-10-14
13
In terms of employment, Figure 7 indicates that the unemployment rate for the rural nodes was higher than that in
the urban nodes both in 2001 and 2011. Significant increases in the employment rate of the economically active
population (aged 15 to 64 years) are observed in both the rural and the urban nodes. This increase, specifically in
the rural nodes, suggests positive outcomes of rural development programmes targeting job creation. A reduction
in unemployment between 2001 and 2011 in both rural and urban nodes is observed.
Figure 7: Percentage distribution of the economically active population (15 to 64 years) in rural and urban nodes by employment status: 2001 and 2011
5.3.2 Comparisons of the employment status of the economically active population between the nodes and non-nodes
Unemployment in South Africa remains a major challenge. Although there was a reduction in unemployment over
the 10 year period (2001 to 2011) in the nodes, it is interesting to see how the non-nodes performed in this area
compared to the nodes. The unemployment rate in the rural nodes in 2001 was significantly higher than in the non-
nodes. On the other hand, the unemployment rate in the non-urban nodes was significantly higher than in urban
nodes in 2001. Whilst there were reductions in unemployment rates between 2001 and 2011 in the nodes, when
compared to the non-nodes in 2011, significantly higher rates were still observed in the nodes compared to the
non-nodes. It is however important to note that in 2011, even though the difference in the unemployment rate
between urban nodes and urban non-nodes is significant, the z-score test for the difference indicates a weak
statistical significance at 0.05 level. This indicates that despite significant differences in 2001 between the urban
2001 2011 2001 2011
Rural nodes Urban nodes
Employed 46,2 61,8 49,4 63,0
Unemployed 53,8 38,2 50,6 37,0
0,0
10,0
20,0
30,0
40,0
50,0
60,0
70,0%

Statistics South Africa
Quest for nodal development: Evidence from Census 2001 and Census 2011
Report 03-10-14
14
nodes and the urban non-nodes regarding unemployment, by 2011 the nodes were close to catching up with the
non-nodes.
Table 6: Comparisons of the employment status between the nodes and the non-nodes: 2001 and 2011
Employment status
2001 2011
Rural nodes
Non-nodes Difference
Rural nodes
Non-nodes Difference
Employment 46.2 59.2 13.0* 61.8 70.3 8.5*
Unemployment 53.8 40.8 13.0* 38.2 29.7 8.5*
Urban nodes
Urban non-
nodes DifferenceUrban nodes
Urban non-
nodes Difference
Employment 49.4 44.5 4.9* 63.0 62.5 0.5*
Unemployment 50.6 55.5 4.9* 37.0 37.5 0.5*
* p < 0.05
5.4 Living conditions in the nodal areas
This section covers the living circumstances of the households in the nodal areas with regard to housing and
access to basic services such as water, electricity, sanitation and refuse removal. The country’s overarching socio-
economic policy framework, outlined in the Reconstruction and Development Programme (RDP) that was started in
1996 and now carried forward through the NDP, requires the government to provide adequate housing, electricity,
telecommunications, piped water and sanitation to all households, particularly among the groups that were
disadvantaged during the apartheid era. According to the National Development Plan, access to adequate housing,
reliable electricity, safe water supplies, accessible public transport, and hygienic and dignified sanitation facilities
remains a daily challenge for many South Africans, particularly in poor rural and peri-urban communities.
5.4.1 Housing and access to basic services in rural and urban nodes
Through the RDP, the government of South Africa has been providing free housing to low income earners since
1996. This programme ensures decent housing to all South Africans and specifically deals with the increasing
number of households residing in informal settlements. Figure 8 illustrates the progress made in increasing the
proportion of households living in formal dwellings between 2001 and 2011 in both rural and urban nodes. This is
matched by a decrease in the proportion of households living in traditional dwellings and informal dwellings
between 2001 and 2011 in both rural and urban nodes.

Statistics South Africa
Quest for nodal development: Evidence from Census 2001 and Census 2011
Report 03-10-14
15
Figure 8: Percentage distribution of households in rural and urban nodes by type of dwelling: 2001 and 2011
In addition to decent housing, ownership of assets (e.g. a house) is important as this can be used as collateral for
securing credit. Access to credit allows households to survive economic shocks and provides them with a platform
to start a small business and/or improve their living conditions. Ownership of houses increased in the nodal areas
between 2001 and 2011. In the rural nodes, households that reported owning dwelling units that they resided in
increased from 59.0% in 2001 to 59.8% in 2011. Similarly in the urban nodes, the proportion of house ownership
increased from 55.7% in 2001 to 60.1% in 2011 (Figure 9).
Figure 9: Percentage distribution of households in rural and urban nodes by tenure status: 2001 and 2011
Formaldwelling
Traditionaldwelling
Informaldwelling
Other
2001 54,9 38,7 6,1 0,2
2011 70,1 25,3 4,5 0,1
0,0
10,0
20,0
30,0
40,0
50,0
60,0
70,0
80,0
% Rural nodes
Formaldwelling
Traditionaldwelling
Informaldwelling
Other
2001 62,3 2,2 35,2 0,3
2011 71,8 0,7 26,6 0,9
0,0
10,0
20,0
30,0
40,0
50,0
60,0
70,0
80,0
% Urban nodes
Ownedand fullypaid off
Ownedbut notyet paid
off
RentedOccupied rent‐free
Other
2001 51,2 7,8 9,6 31,3 0,0
2011 52,5 7,3 13,5 22,2 4,5
0,0
10,0
20,0
30,0
40,0
50,0
60,0
%Rural nodes
Ownedand fullypaid off
Ownedbut notyet paid
off
RentedOccupiedrent‐free
Other
2001 36,3 19,4 18,6 25,6 0,0
2011 46,4 13,7 18,2 18,6 3,1
0,0
10,0
20,0
30,0
40,0
50,0
60,0% Urban nodes

Statistics South Africa
Quest for nodal development: Evidence from Census 2001 and Census 2011
Report 03-10-14
16
Access to basic services such as piped water, decent sanitation, refuse removal by local authority, and electricity
are all important indicators of a household’s living conditions. One of the main aims of the URP is to create a
quality urban environment where people can live with dignity and pride. This portion of the report presents a picture
of whether there have been any improvements in the nodes between 2001 and 2011 with regard to access to basic
services.
While the results in Figure 8 indicate an increase in the percentage of households with access to piped water inside
the dwelling for households both in rural and urban nodes, the inequality between households in rural nodes and
households in urban nodes is pronounced. In 2011, the majority of the households (52.6%) in the urban nodes had
access to piped water inside the dwelling whereas only one out of five households (20.9%) had access in the rural
nodes. At the other end of the spectrum, only 1% of the households in the urban nodes had no access to piped
water whereas in the rural nodes, about 24.1% (or one in every four) of the households did not have access to
piped water.
Figure 10: Percentage distribution of households in rural and urban nodes by main source of water: 2001 and 2011
In terms of sanitation in the nodes, the results indicate different circumstances for households in rural nodes and
households in urban nodes. Whilst Figure 11 shows an increase in the percentage of households using flush toilets
in both rural and urban nodes between 2001 and 2011, there was an increase in the percentage of households
using pit latrines (with or without ventilation pipes) in the rural nodes in the same period; in urban nodes, a
decrease is observed. In both rural and urban nodes, a decrease in the percentage of those using bucket toilets
and those without toilets is observed during this time period.
Piped (tap)water insidedwelling
Piped (tap)water inside
yard
CommunalTap
No access topiped (tap)
water
2001 11,5 20,5 29,7 38,3
2011 20,9 25,1 29,9 24,1
0,0
5,0
10,0
15,0
20,0
25,0
30,0
35,0
40,0
45,0
50,0
55,0
% Rural nodes
Piped (tap)waterinside
dwelling/institution
Piped (tap)water
inside yard
CommunalTap
No accessto piped
(tap) water
2001 32,2 37,1 28,3 2,4
2011 52,6 26,1 20,2 1,1
0,0
5,0
10,0
15,0
20,0
25,0
30,0
35,0
40,0
45,0
50,0
55,0% Urban nodes

Statistics South Africa
Quest for nodal development: Evidence from Census 2001 and Census 2011
Report 03-10-14
17
Figure 11: Percentage distribution of households in rural and urban nodes by type of toilet facility: 2001 and 2011
Great strides have been made in the 10 years (2001 to 2011) in terms of providing electricity to household in the
nodes (Table 7). In both rural and urban nodes, the proportion of households using electricity for cooking, heating,
and/or lighting increased during this time period. Over the same period, the proportion of those using solid fuels like
wood, animal dung and candles, as well as those using paraffin decreased. In the rural nodes, the proportion of
households using electricity for cooking, heating and lighting increased by 31.7%, 20.6% and 24.8% respectively.
The proportion of those using wood for cooking and heating decreased by 17.3% and 13.9% respectively, between
2001 and 2011 in the rural nodes.
Similarly, in the urban nodes, the proportion of households using electricity for cooking, heating and lighting
increased by 28.7%, 16.0% and 14.9% respectively. Again, the proportion of those using paraffin for cooking,
heating and lighting decreased by 29.6%, 9.5% and 9.4% respectively.
Flushtoilet
Chemical toilet
Pit toiletwith
ventilation (VIP)
Pit toiletwithoutventilati
on
Buckettoilet
None
2001 19,1 3,0 9,2 36,1 3,0 29,5
2011 24,6 4,3 18,9 35,2 1,3 11,6
0,0
10,0
20,0
30,0
40,0
50,0
60,0
70,0
80,0
90,0
Flushtoilet
Chemical toilet
Pit toiletwith
ventilation (VIP)
Pit toiletwithoutventilati
on
Buckettoilet
None
2001 72,4 2,0 3,0 5,3 7,2 10,0
2011 82,1 3,0 2,0 3,5 5,1 4,4
0,0
10,0
20,0
30,0
40,0
50,0
60,0
70,0
80,0
90,0
%

Statistics South Africa
Quest for nodal development: Evidence from Census 2001 and Census 2011
Report 03-10-14
18
Table 7: Percentage distribution of households in rural and urban nodes by source of energy they use for cooking, heating and lighting: 2001 and 2011
Source of energy
Cooking Heating Lighting
2001 2011 % change 2001 2011 % change 2001 2011 % change
Rural nodes
Electricity 24.3 56.0 31.7 22.6 43.2 20.6 50.9 75.7 24.8
Gas 3.2 3.4 0.2 1.0 1.9 0.9 0.3 0.3 0.0
Paraffin 18.8 7.5 -11.3 14.2 12.3 -1.9 10.1 3.8 -6.3
Wood 48.5 31.1 -17.4 53.5 39.6 -13.9 - - -
Coal 2.2 0.6 -1.6 4.2 1.8 -2.4 - - -
Animal dung 2.4 1.0 -1.4 1.7 0.9 -0.8 - - -
Candles - - - - - - 37.8 20.5 -17.3
Solar 0.2 0.1 -0.1 0.2 0.2 0.0 0.3 0.6 0.3
Other 0.4 0.1 -0.3 2.5 0.0 -2.5 0.5 0.0 -0.5
Urban nodes
Electricity 56.5 85.2 28.7 50.6 66.6 16.0 74.5 89.4 14.9
Gas 3.3 5.1 1.8 1.0 2.3 1.3 0.3 0.3 0.0
Paraffin 38.5 8.9 -29.6 38.6 29.1 -9.5 16.1 6.7 -9.4
Wood 0.4 0.2 -0.2 3.3 1.3 -2.0 - - -
Coal 0.3 0.1 -0.2 0.8 0.2 -0.6 - - -
Animal dung 0.5 0.1 -0.4 0.2 0.1 -0.1 - - -
Candles - - - - - - 8.8 3.4 -5.4
Solar 0.3 0.2 -0.1 0.3 0.3 0.0 0.1 0.2 0.1
Other 0.2 0.1 -0.1 5.3 0.0 -5.3 0.1 0.0 -0.1
5.4.2 Comparisons of the standard of living of households between nodes and non-nodes
Whilst the results in Section 5.4.1 indicate improvements with regards to access to formal dwellings and basic
services in both rural and urban nodes, Section 5.4.2 addresses the question of whether [or not], the nodes caught
up with the non-nodes during the same period. With regard to the rural nodes, the results in Table 8 indicate that, in
2001, the nodes were doing poorly in terms of access to formal dwellings and basic services compared to the non-
nodes. Analysis shows that this difference was statistically significant. In 2011, the nodes were still doing poorly
compared to the non-nodes and the difference was also statistically significant. With regard to urban nodes and
urban non-nodes, whilst nominally, the differences were not as pronounced for access to formal dwelling and piped
water inside the dwelling on on-site, the z-score test indicates that these differences are statistically significant both
in 2001 and 2011.

Statistics South Africa
Quest for nodal development: Evidence from Census 2001 and Census 2011
Report 03-10-14
19
Table 8: Comparisons of improvements in access to formal dwellings and basic services between nodes and non-nodes: 2001 and 2011
Access to basic services and formal housing
2001 2011
NodesNon-
nodes Difference Nodes
Non-nodes
Difference
Rural
Formal dwelling 54.9 74.8 19.9* 70.1 82.9 12.8* Access to piped water inside the dwelling or on site
32.0 69.7 37.7* 46.0 80.9 34.9*
Access to a flushed toilet 22.1 56.2 34.1* 30.2 67.3 37.1*
Access to electricity for lighting 51.5 56.7 5.2* 76.6 80.4 3.8*
Urban
Formal dwelling 62.3 62.5 0.2* 71.8 68.8 3.0* Access to piped water inside the dwelling or on site
69.3 68.3 1.0* 78.7 80.0 1.3*
Access to a flushed toilet 74.4 60.1 14.3* 85.1 69.1 16.0*
Access to electricity for lighting 76.2 74.9 1.3* 89.6 87.7 1.9* p<0.05*
5.5 Multidimensional poverty in the nodes
Both the urban and rural nodes were selected for accelerated development based on their high poverty levels in
the late 1990s to early 2000s. The ISRDP and the URP were part of government’s poverty reduction strategies to
rectifying the legacy of underdevelopment in these areas. This section presents poverty levels in the nodes in 2001
and 2011 based on the South African Multidimensional Poverty Index (SAMPI). The SAMPI is a domesticated
version of the global Multidimensional Poverty Index (MPI) which captures severe deprivations that each person or
household faces with respect to education, health and living standards. Statistics South Africa customised the MPI
to the South African situation such that the SAMPI is made up of four dimensions, (i.e. health, education, standard
of living, and economic activity) and eleven indicators as highlighted in Table 9.
Statistics South Africa
Quest for nodal development: Evidence from Census 2001 and Census 2011
Report 03-10-14
20
Table 9: The dimensions and indicators the SAMPI
Dimension Indicator Health Child mortality Education Years of schooling
School attendance Standard of living Fuel for lighting
Fuel for heating Fuel for cooking Water access Sanitation type Dwelling type Asset ownership
Economic activity Unemployment
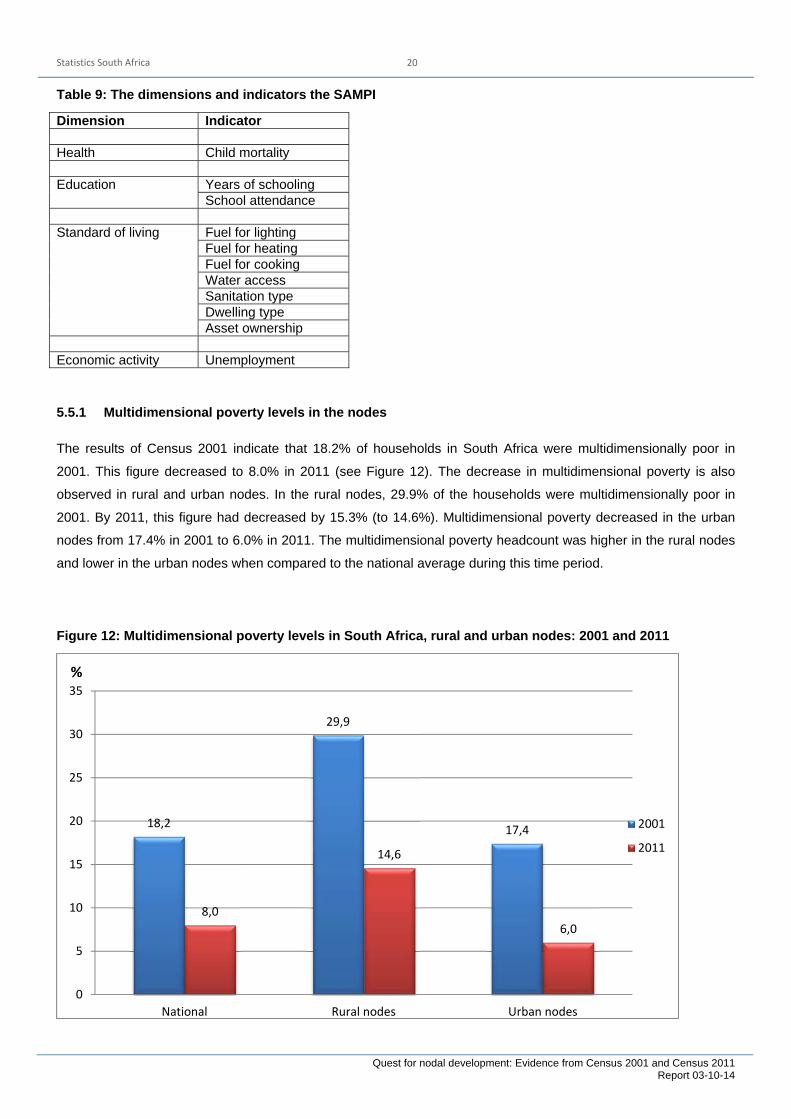
5.5.1 Multidimensional poverty levels in the nodes
The results of Census 2001 indicate that 18.2% of households in South Africa were multidimensionally poor in
2001. This figure decreased to 8.0% in 2011 (see Figure 12). The decrease in multidimensional poverty is also
observed in rural and urban nodes. In the rural nodes, 29.9% of the households were multidimensionally poor in
2001. By 2011, this figure had decreased by 15.3% (to 14.6%). Multidimensional poverty decreased in the urban
nodes from 17.4% in 2001 to 6.0% in 2011. The multidimensional poverty headcount was higher in the rural nodes
and lower in the urban nodes when compared to the national average during this time period.
Figure 12: Multidimensional poverty levels in South Africa, rural and urban nodes: 2001 and 2011
18,2
29,9
17,4
8,0
14,6
6,0
0
5
10
15
20
25
30
35
National Rural nodes Urban nodes
%
2001
2011

Statistics South Africa
Quest for nodal development: Evidence from Census 2001 and Census 2011
Report 03-10-14
21
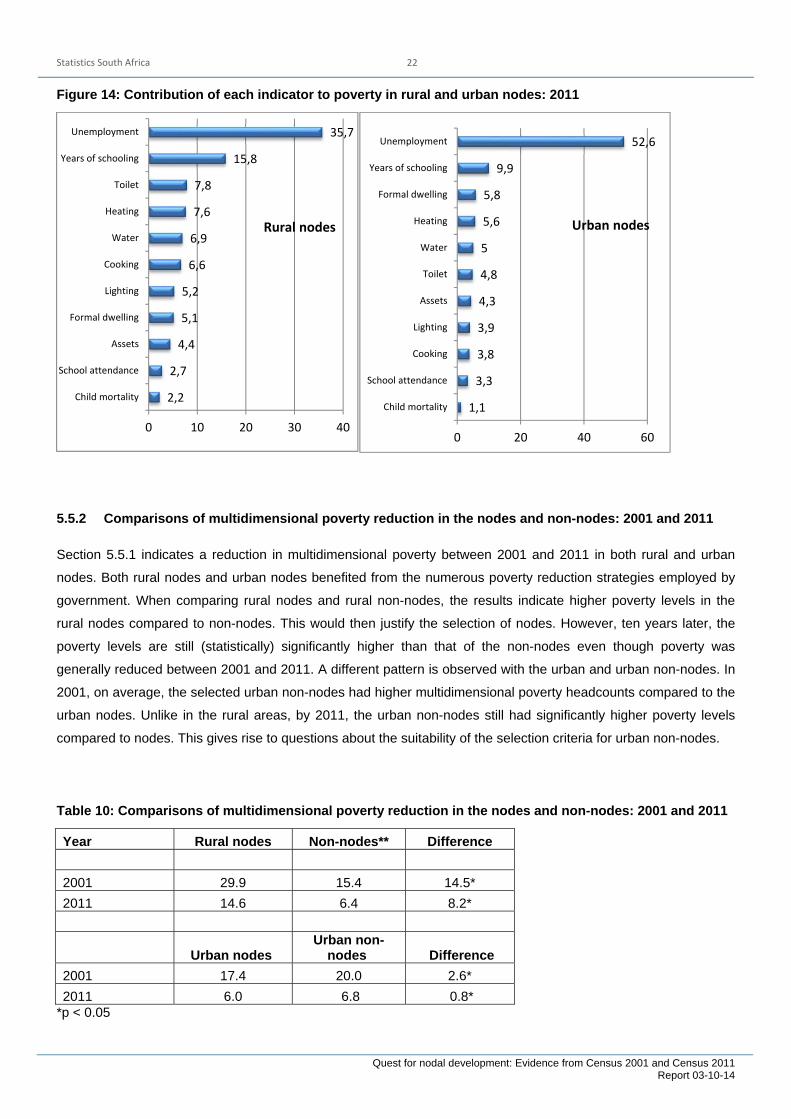
One of the advantages of the SAMPI is its ability to decompose information such that it informs on the contribution
of each indicator towards multidimensional poverty. This is useful information for planning and policy
implementation as drivers of poverty can be identified and be addressed directly. Figure 13 below indicates the
contribution of each dimension to poverty in both the rural and urban nodes. The results show that the biggest
contributor towards poverty in the urban nodes is unemployment, whereas the rural nodes are still grappling with
the issue of service delivery. When looking at both the rural and urban nodes in 2001 and 2011, the contribution of
the education and living conditions dimensions decreases, while the contribution of unemployment increases. A
further disaggregation of this information to indicator level reveals the main drivers of poverty being unemployment
and education (particularly years of schooling) in both rural and urban nodes (see Figure 14).
Figure 13: Contribution of each dimension towards poverty in rural and urban nodes: 2001 and 2011
2001 2011 2001 2011
Rural nodes Urban nodes
Health 1,6 2,2 0,8 1,1
Education 23,5 18,5 11,9 13,2
Living standards 48,8 43,6 40,2 33,2
Economic activity 26,1 35,7 47,3 52,6
0
10
20
30
40
50
60%
Statistics South Africa
Quest for nodal development: Evidence from Census 2001 and Census 2011
Report 03-10-14
22
Figure 14: Contribution of each indicator to poverty in rural and urban nodes: 2011
5.5.2 Comparisons of multidimensional poverty reduction in the nodes and non-nodes: 2001 and 2011
Section 5.5.1 indicates a reduction in multidimensional poverty between 2001 and 2011 in both rural and urban
nodes. Both rural nodes and urban nodes benefited from the numerous poverty reduction strategies employed by
government. When comparing rural nodes and rural non-nodes, the results indicate higher poverty levels in the
rural nodes compared to non-nodes. This would then justify the selection of nodes. However, ten years later, the
poverty levels are still (statistically) significantly higher than that of the non-nodes even though poverty was
generally reduced between 2001 and 2011. A different pattern is observed with the urban and urban non-nodes. In
2001, on average, the selected urban non-nodes had higher multidimensional poverty headcounts compared to the
urban nodes. Unlike in the rural areas, by 2011, the urban non-nodes still had significantly higher poverty levels
compared to nodes. This gives rise to questions about the suitability of the selection criteria for urban non-nodes.
Table 10: Comparisons of multidimensional poverty reduction in the nodes and non-nodes: 2001 and 2011
Year Rural nodes Non-nodes** Difference
2001 29.9 15.4 14.5*
2011 14.6 6.4 8.2*
Urban nodes Urban non-
nodes Difference
2001 17.4 20.0 2.6*
2011 6.0 6.8 0.8* *p < 0.05
2,2
2,7
4,4
5,1
5,2
6,6
6,9
7,6
7,8
15,8
35,7
0 10 20 30 40
Child mortality
School attendance
Assets
Formal dwelling
Lighting
Cooking
Water
Heating
Toilet
Years of schooling
Unemployment
Rural nodes
1,1
3,3
3,8
3,9
4,3
4,8
5
5,6
5,8
9,9
52,6
0 20 40 60
Child mortality
School attendance
Cooking
Lighting
Assets
Toilet
Water
Heating
Formal dwelling
Years of schooling
Unemployment
Urban nodes

Statistics South Africa
Quest for nodal development: Evidence from Census 2001 and Census 2011
Report 03-10-14
23
5.5.3 Further insights about the rural and urban nodes based on SAMPI headcounts
A detailed analysis of poverty levels in each node reveals an interesting finding. The nodes were selected in 2001
based on their high poverty levels. Data however reveal that, there were areas that were not identified as non-
nodes that were worse off than the nodes, meaning that they had higher levels of multidimensional poverty than
that of the nodes. Table 11 shows the twenty poorest districts in South Africa. In 2001, Dr Ruth Segomotsi Mompati
district was the 11th poorest district in the country and in 2011 it ranked the 10th poorest, yet this district was not
identified as a node. Similarly, Vhembe district was the 14th poorest in 2001 and the 13th poorest in 2011 and yet
was also not identified as a node during the period 2001 to 2011. Districts such as Central Karoo and Ehlanzeni did
not feature in the 20 poorest districts, however, they form part of the areas selected as nodes.
Table 11: The poorest twenty districts in South Africa sorted by 2011 poverty headcount
District 2001
Headcount 2011
Headcount Alfred Nzo 44,7% 25,6%
uMzinyathi 42,5% 23,7%
O.R.Tambo 43,6% 21,1%
uMkhanyakude 40,1% 20,4%
Sisonke 36,8% 19,3%
Amathole 34,9% 18,7%
Joe Gqabi 34,0% 16,8%
Chris Hani 32,0% 15,6%
Ugu 28,3% 15,1%
Dr Ruth Segomotsi Mompati 28,6% 13,7%
uThukela 27,0% 13,7%
iLembe 27,4% 13,2%
Vhembe 25,0% 13,0%
Zululand 30,3% 12,8%
Ngaka Modiri Molema 21,0% 12,3%
John Taolo Gaetsewe 28,6% 11,4%
Greater Sekhukhune 22,1% 11,3%
Mopani 25,6% 11,3%
uThungulu 25,7% 11,0%
Buffalo City 20,9% 9,3%
Similarly, with regards to urban nodes, townships such as Berlin in Buffalo City, which was not selected as a node
had a higher level of multidimensional poverty compared to Mdantsane which was identified as a node in Buffalo
City. Both Richie and Motswedimoa townships in Sol Plaaitjie had higher levels of multidimensional poverty
compared to Galeshewe which was identified as a node in the same municipality. In the City of Johannesburg,
Diepsloot’s multidimensional poverty headcount was estimated at 30.7% in 2001 and was not identified as a node,

Statistics South Africa
Quest for nodal development: Evidence from Census 2001 and Census 2011
Report 03-10-14
24
whilst Alexandra, which had a poverty level of 13.2% in the same year, was identified as a node (see Table 2). This
anomaly in the selection of nodes may point to data gaps that existed 15 years ago (in 2001).
6. Summary
In 2001, the government of South Africa identified 13 district municipalities (that was later increased to 18) and 8
townships for accelerated development under the ISRDP and the URP auspice. The 18 district municipalities are
referred to as rural nodes and the 8 townships are referred to as urban nodes. The nodes were selected based on
their high levels of poverty and underdevelopment. This report examined development in these nodes for the
period 2001 to 2011 using Census 2001 and Census 2011 data. In addition to looking at development in the nodes,
the report further compared the rate of development between nodes and other areas not identified as nodes, that
is, results from the 18 rural nodes are compared with results from other district municipalities not identified as
nodes. Similarly, the results from the 8 urban nodes were compared with results for selected urban townships not
identified as nodes.
The data showed different age structures in rural and urban nodes. Whilst the age structure in the rural nodes
closely resembled the national one, where the younger age groups of 0 – 19 years form most of the population, the
age structure in the urban nodes indicated a different picture. People in the age groups 20 to 29 years represented
the largest proportion of the population. This age group is characterised by people seeking higher education and
work opportunities. The proximity of the urban nodes to such opportunities may be the reason for such an age
structure in urban nodes to occur.
The report also found that in both rural and urban nodes, great strides have been made in terms of education. An
increase in the proportion of the population who have some secondary education, completed secondary education,
and tertiary qualification was observed. This was matched by a decrease in the proportion of those with lower
levels of education. Whilst these improvements were observed in both rural and urban nodes, the proportions of
those with higher educational qualification in the rural nodes is still very low. The proportion of those with lower
educational levels in rural areas is relatively high when compared to urban nodes. It is important to note that the
proportion of children aged 7 to 15 years attending an educational institution in the rural nodes was higher than that
of the urban nodes and even higher than the national average. Such an improvement in the rural nodes may be
attributed government programmes such as no fee schools and feeding schemes. Also, of importance is a
decrease in the proportion of children aged 7 to 15 years attending an educational institution in the urban nodes
between 2001 and 2011.
Regarding economic activity, the results indicated that the majority of the population of working age in the rural
nodes were not economically active. A pronounced reduction in the unemployment rate was observed in the rural

Statistics South Africa
Quest for nodal development: Evidence from Census 2001 and Census 2011
Report 03-10-14
25
nodes. Similarly to the rural nodes, the urban nodes increased their employment rate and decreased the
unemployment rate during the period 2001 and 2011.
Regarding the living conditions of households in the nodes, the results painted a positive picture. In both rural and
urban nodes, there were improvements with regard to formal housing, water, sanitation, electricity and refuse
removal between 2001 and 2011. Special attention should been given to access to piped water inside the dwelling
or on site and access to flush toilets in the rural nodes. Intensification of programmes that provides free basic
services to indigent households is necessary, especially in the rural nodes. Awareness campaigns on the
registration of households as indigent are still crucial for the success of these and future programmes.
The results of the SAMPI in the nodes also told a good story of poverty reduction between 2001 and 2011 in both
rural and urban nodes. The SAMPI revealed that the main drivers of poverty in the rural and urban nodes are not
the same. While unemployment drives poverty in the urban nodes, lack of basic services is the main driver of
poverty in rural nodes.
When all these results in the nodes were compared with the results from the selected non-nodes it appeared that
the nodes did not do specifically better than the non-nodes with regard to education, economic activity, living
conditions and multidimensional poverty. The differences between the nodes and the non-nodes in both 2001 and
2011 were statistically significant. This means that, ten years after the implementation of the ISRDP and the URP,
the nodes have not caught up with the non-nodes and thus, the overall success of these programmes less clear.
In addition to the comparisons between the nodes and the non-nodes, the results indicate that there were areas
that were worse-off than some nodes in 2001, but were not included in the ISRDP and URP programmes as nodes.
These include Dr Ruth Segomotsi Mompati district and Vhembe district municipality that were not identified as rural
nodes and Berlin in Buffalo City, as well as Richie and Motswedimoa townships in Sol Plaaitjie, which were not
identified as urban nodes despite being worse off than some nodes.
7. Conclusion
Great strides towards improving the lives of the population living in the nodes have been made between 2001 and
2011. The plight of the households in both the rural and urban nodes is changing for the better. However, the
nodes have not caught up with the non-nodes ten years after the implementation of the ISRDP and the URP except
with regards the proportion of the population aged 20 years and above with some secondary education and those
with some tertiary qualifications.
Top Related